Meta-Research: Author-level data confirm the widening gender gap in publishing rates during COVID-19
- Danish Centre for Studies in Research and Research Policy, Aarhus University, Denmark
- Department of Sociology, Copenhagen University, Denmark
- Department of Radiation Oncology, University of Michigan, United States
Abstract
Publications are essential for a successful academic career, and there is evidence that the COVID-19 pandemic has amplified existing gender disparities in the publishing process. We used longitudinal publication data on 431,207 authors in four disciplines - basic medicine, biology, chemistry and clinical medicine - to quantify the differential impact of COVID-19 on the annual publishing rates of men and women. In a difference-in-differences analysis, we estimated that the average gender difference in publication productivity increased from –0.26 in 2019 to –0.35 in 2020; this corresponds to the output of women being 17% lower than the output of men in 2109, and 24% lower in 2020. An age-group comparison showed a widening gender gap for both early-career and mid-career scientists. The increasing gender gap was most pronounced among highly productive authors and in biology and clinical medicine. Our study demonstrates the importance of reinforcing institutional commitments to diversity through policies that support the inclusion and retention of women in research.
Introduction
Gender disparities in academic publishing have widened during the COVID-19 pandemic. The proportion of preprints and manuscript submissions with women as authors has decreased (Cui et al., 2021; Kibbe, 2020; Mogensen et al., 2021; Squazzoni et al., 2020; Williams et al., 2021), as has the proportions of preprints and published articles with women as either the first author or the senior author (Andersen et al., 2020; Inno et al., 2020; Lerchenmüller et al., 2021; Muric et al., 2021; Ribarovska et al., 2021). Gender gaps in self-reported research activities have also increased (Andersen et al., 2020; Inno et al., 2020; Lerchenmüller et al., 2021; Muric et al., 2021; Ribarovska et al., 2021). However, the longitudinal effects of the pandemic on differences in annual publication outputs remain uncertain. In this study, we used individual-level panel data on the publication activities of 431,207 authors globally to quantify the differential impact of COVID-19 on the publishing rates of women and men.
Research on gender and publication productivity suggests that women (on average) publish fewer articles than men (Mairesse and Pezzoni, 2015), although the magnitude of this difference varies by career stage, discipline and country, and has diminished over time (Huang et al., 2020; Sax et al., 2002; Xie and Schauman, 2005). The gender imbalance in publishing rates should be understood in the context of broader disparities in the science system. Structural variables such as employment rank, access to resources, university prestige, appointment type, teaching loads (Eagly, 2020; Taylor et al., 2006) and available time for research (Guarino and Borden, 2017; Leišytė, 2016) all partially explain the observed gender imbalances in publication productivity (Allison and Long, 1990; Bland et al., 2006; Xie and Shauman, 1998). In addition, research finds that women scientists (compared to men) tend to span more topics in their research activities, face stricter editorial standards in peer reviewing (Hengel, 2017), and take on greater shares of parenthood responsibilities (Derrick et al., 2021), which also likely perpetuate publishing disparities.
Recent research has identified two primary mechanisms through which the pandemic may have amplified existing disparities in publishing (King and Frederickson, 2021). First, evidence from national and international surveys indicates that women scientists have taken the lion’s share of the extra childcare and domestic responsibilities imposed by lockdowns of schools and daycares (Deryugina et al., 2021; Staniscuaski et al., 2021; Yildirim and Eslen-Ziya, 2020). According to surveys of self-reported research activities, women scientists – especially those with young dependents – have seen notable productivity decreases in the wake of the pandemic (Deryugina et al., 2021; Myers et al., 2020; Staniscuaski et al., 2021). Second, transitions to online teaching during university lockdowns required extra hours of planning and preparation and may have affected women scientists more than men due to observed disparities in average teaching loads (Barber et al., 2021; Eagly, 2020; King and Frederickson, 2021; Taylor et al., 2006). Survey-based evidence from the United States also indicates that the extra time spent on teaching partially accounts for observed decreases in scientists’ self-reported publication rates (Barber et al., 2021). In clinical medicine, service demands related to care for COVID-19 patients and transitions to virtual care delivery for many others may also have disproportionately affected women, who are more likely to be represented on clinician-educator rather than traditional tenure tracks at medical schools (Mayer et al., 2014).
This study is, to our knowledge, the first to quantify the differential impact of COVID-19 on the annual publishing rates of women and men. We used a linked dataset of 431,207 authors and 2,113,108 publications and a difference-in-differences specification to estimate how the gender difference in average publishing rates changed from 2019–2020.
We rely on author-disambiguated publication data from Clarivate’s Web of Science, restricting our focus to scientists with >2 publications within basic medicine, biology, chemistry and clinical medicine. We chose these fields as they are well-represented in Web of Science (more than 90% of references are included in Web of Science), their primary knowledge production mode is through journal publication (unlike, for example, computer science, many fields of engineering, and the humanities), research is comparatively collaborative (although some areas of clinical research have somewhat more authors), publishing is relatively fast (compared to, for example, the social sciences). Basic medicine, biology and clinical medicine also have some of the highest shares of women scientists in the natural sciences.
We report annual, per-author publishing rates based on a full and fractional counting. The full counting gives the raw sum of all papers published by a scientist in a given year. The fractional counting gives the sum of the reciprocal of the number of authors per paper published by a scientist.
Results
The following results use a main sample consisting of two scientist cohorts, one with first publication year in 2009 or 2010 ("mid-career", n = 137,767) and one with first publication year in 2016 or 2017 ("early-career", n = 293,440). Unless mentioned otherwise, the combined cohort (n = 431,207) is used. A third, counterfactual cohort (n = 276,793) is used to contrast the early-career sample, as a means of estimating the expected attrition in the early-career stage, when a proportion of scientists leave academia. Each analysis referring to a "treatment", indicated in figures as a dotted line between 2019 and 2020, refers to the changes in working environments in 2020 due to the COVID-19 pandemic.
Descriptive results
Our analysis suggests that gender disparities in annual publication outputs have widened during COVID-19. A descriptive comparison of changes in publishing rates in 2020 compared to 2019 (Figure 1) indicates a 15% decrease in women’s average full- and fractional-count publication output and a 6%–7% decrease in men’s average full- and fractional-count publication output.
Figure 1
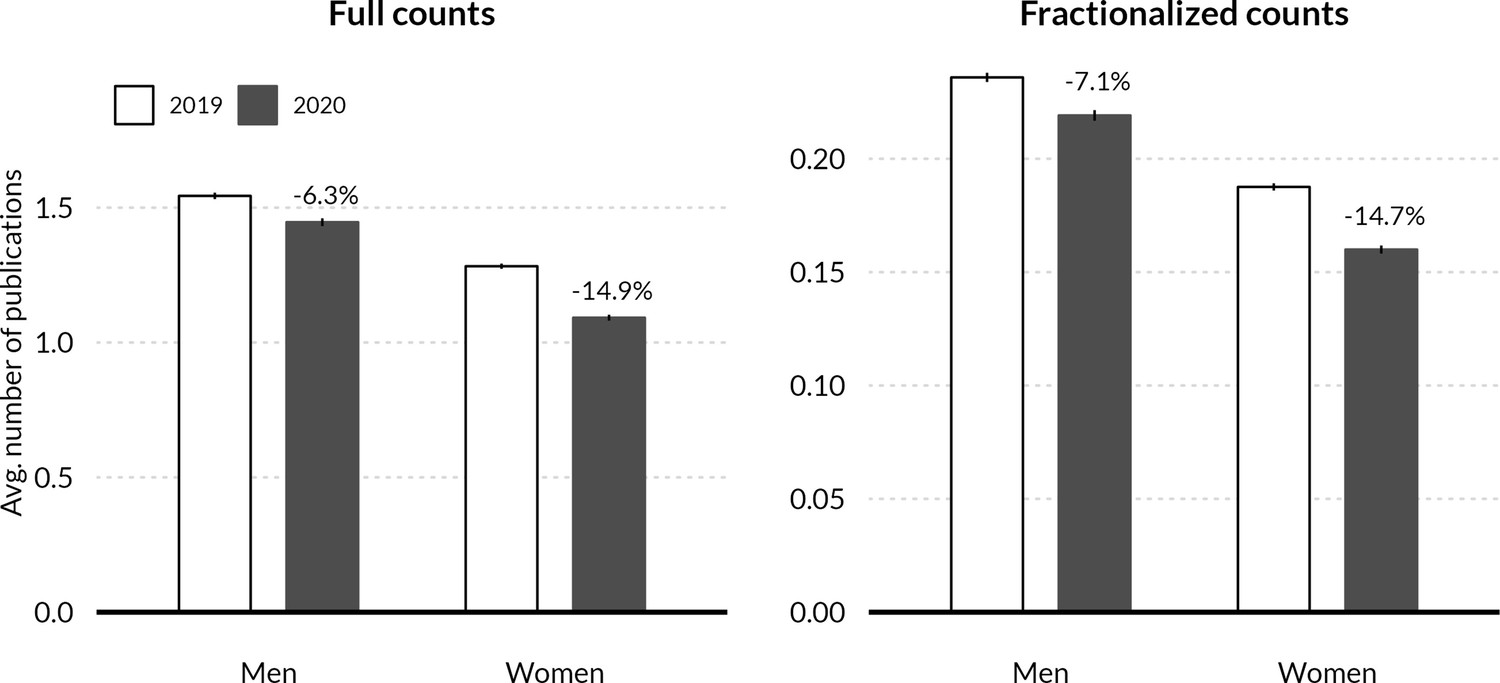
Average publication output by gender and year.
Differences are in percentages of average publication rates in 2019. Results are presented for full and fractionalized publication counts. Men experience a smaller productivity decrease in 2020 compared to 2019 (6.3%) than women (14.9%) using full counts of publications. For fractional counts (each paper counts as a fraction of the number of co-authors), the difference in decrease is greater, with a 7.1% decrease for men and 14.7% decrease for women. Average publication counts are presented with 99% confidence bounds.
Difference-in-differences estimates
Figure 2 displays the dynamic effects of the COVID-19 pandemic and summarizes the main result of the difference-in-differences estimation. As shown in panel A, the gender difference in annual publishing rates remained relatively stable between 2017 and 2019 (implying parallel trends prior to COVID-19), while increasing in 2020. From 2019 to 2020, the average-marginal gender difference increased from –0.260 (corresponding to a 17% lower output for women than for men) to –0.354 (corresponding to a 24% lower output for women than for men) in full-count output. Figure 2—figure supplement 1 presents results from a complementary analysis with fractional-count publication output as outcome and shows a change in the average-marginal gender difference from –0.048 (corresponding to a 22% lower output for women than for men) to 0.059 (corresponding to a 27% lower output for women than for men).
Figure 2 with 1 supplement see all
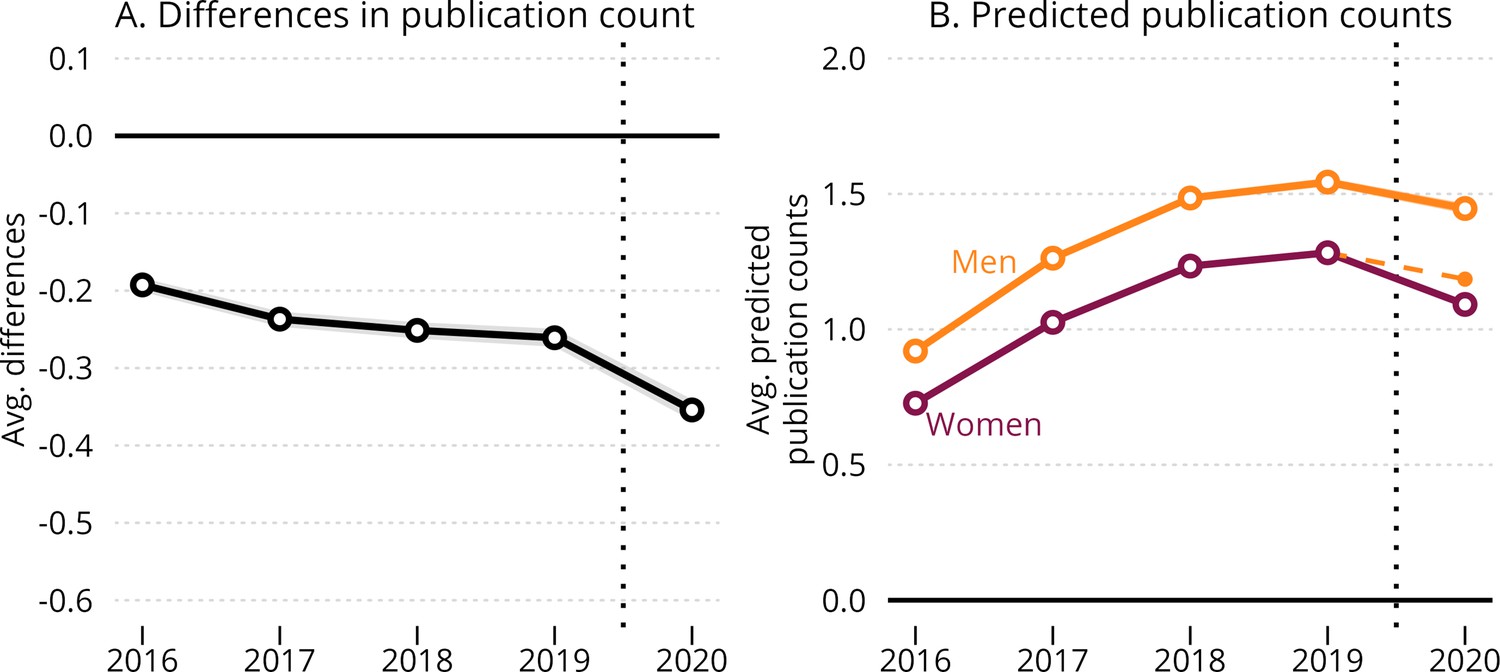
Dynamic effects of the COVID-19 pandemic on women’s and men’s publication productivity.
Panel A shows the estimated average gender difference in publication rates by year. Each point shows the relative difference between men and women per year, with 99.9% confidence bounds shown as a gray area around the line. From 2019 to 2020, the average-marginal gender difference increased from –0.260 (17% lower output for women) to –0.354 (24% lower output for women). Panel B shows the predicted publishing rates for men and women authors, with solid lines showing the trend per gender, and the dashed, orange line showing the counterfactual trend for women if they had similar 2019–2020 trajectories as men (i.e. the trend for men is projected to the 2019 estimate for women). The difference between the dashed line and the straight line in Panel B specifies the average treatment effect for women. Point estimates are reported with 99.9% confidence bounds, with robust standard errors clustered at the individual-author level. For information on how average marginal and predicted values are calculated, please refer to Materials and Methods: Difference-in-Differences model.
-
Figure 2—source data 1
OLS linear regression with full count as dependent variable.
- https://cdn.elifesciences.org/articles/76559/elife-76559-fig2-data1-v3.docx
-
Figure 2—source data 2
OLS linear regression with fractional count as dependent variable.
- https://cdn.elifesciences.org/articles/76559/elife-76559-fig2-data2-v3.docx
-
Figure 2—source data 3
Poisson regression with full count as dependent variable.
- https://cdn.elifesciences.org/articles/76559/elife-76559-fig2-data3-v3.docx
-
Figure 2—source data 4
Negative binomial regression with full count as dependent variable.
- https://cdn.elifesciences.org/articles/76559/elife-76559-fig2-data4-v3.docx
To verify that the change in the gender productivity gap was in fact due to COVID-19 and did not represent a more generic dip in women’s productivity (compared to men’s) during the fifth year of their publication career, we ran a counterfactual analysis for a sample of researchers, who published their first paper in 2011. For this sample, we observed a small but consistent annual increase in the marginal gender difference across years (from 2011–2015). In this case, the gender difference in productivity increased by 1/20 of a full publication (full count: –0.05, 99% CI: –0.0665; –0.0337) between year four (2014) and five (2015), amounting to 53% of the treatment effect observed in Figure 2.
Career-stage differences
Research suggests that the working conditions of early-career women scientists have been especially affected by the pandemic (Andersen et al., 2020; Krukowski et al., 2021). We examined this question by conducting sub-group analyses by career-age. As shown in Figure 3 the widening gender gap was salient for early-career scientists with four years of publication experience as well as for mid-career scientists with ten years of publication experience. From 2019 to 2020, the average marginal publication disadvantage for early-career women increased from –0.133 (corresponding to an 11% lower output for women than for men) to –0.20 (corresponding to an 18% lower output for women than for men) in full-count output. In comparison, the average marginal publication disadvantage for mid-career women changed from –0.452 (corresponding to a 21% lower output for women than for men) to –0.592 (corresponding to a 27% lower output for women than for men). This is a relative increase in the gender gap of 61% for early-career scientists and 29% for mid-career scientists. We obtained comparable results in an age-differentiated analysis with fractional-count publications as outcome (Figure 3—figure supplement 1).
Figure 3 with 2 supplements see all
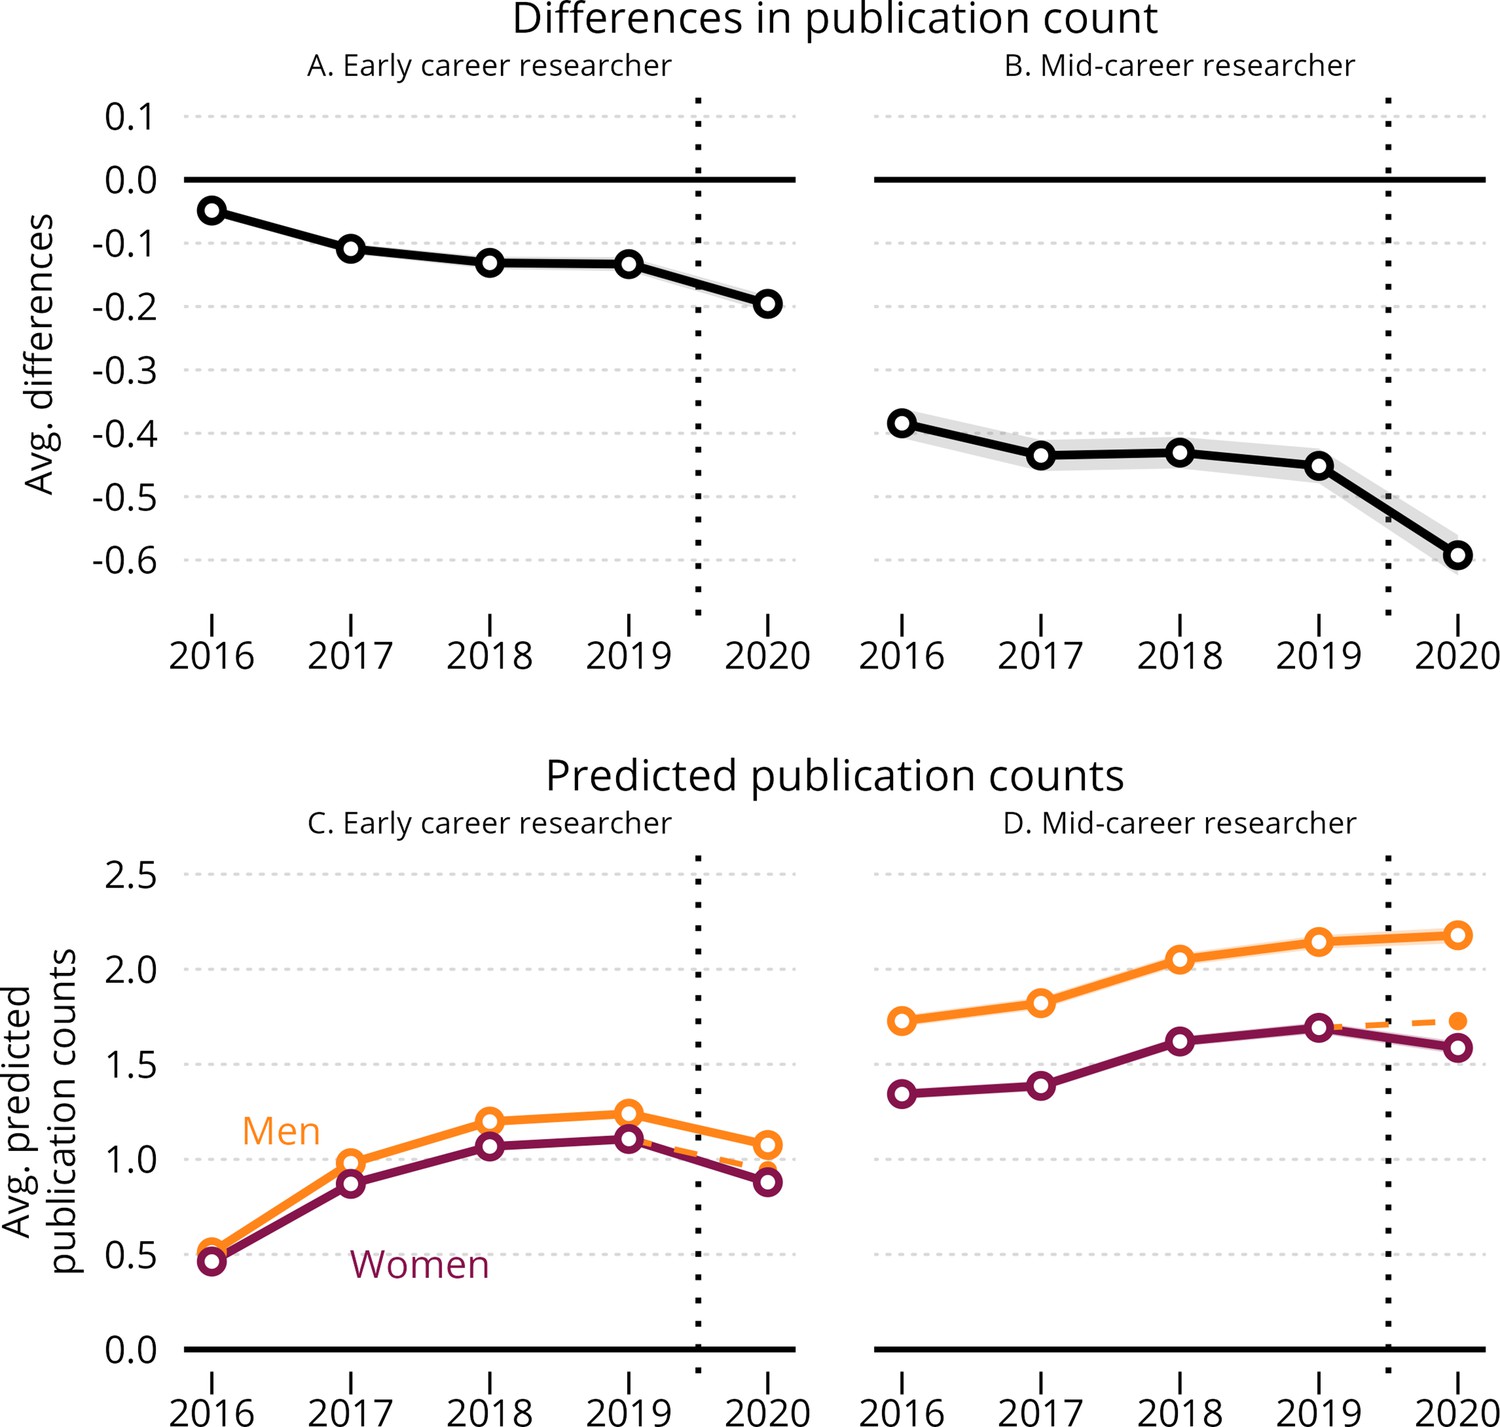
Dynamic effects of the COVID-19 pandemic on the average gender gap in annual publishing rates, by career age.
Panels A and B show the estimated average gender difference in full-count publication rates by year for early-career and mid-career researchers. Panels C and D show men’s and women’s predicted full-count publication rates per year by author status (early-career vs. mid-career researcher). Point estimates are reported with 99.9% confidence bounds and robust standard errors clustered at the individual-author level. For information on how average marginal and predicted values are calculated, please refer to Materials and Methods: Difference-in-Differences model.
-
Figure 3—source data 1
OLS linear regression of the early-career sample, with full count as dependent variable.
- https://cdn.elifesciences.org/articles/76559/elife-76559-fig3-data1-v3.docx
-
Figure 3—source data 2
OLS linear regression of the mid-career sample, with full count as dependent variable.
- https://cdn.elifesciences.org/articles/76559/elife-76559-fig3-data2-v3.docx
-
Figure 3—source data 3
OLS linear regression of the early-career sample, with fractional count as dependent variable.
- https://cdn.elifesciences.org/articles/76559/elife-76559-fig3-data3-v3.docx
-
Figure 3—source data 4
OLS linear regression of the mid-career sample, with fractional count as dependent variable.
- https://cdn.elifesciences.org/articles/76559/elife-76559-fig3-data4-v3.docx
Productivity-dependant differences
As indicated in Figure 4 panel A, the effect of the pandemic on women’s and men’s publishing rates also varied considerably across different strata of the publication-productivity distribution. Indeed, a considerable share of the average marginal gender difference appeared to be attributable to differences occurring among the top-10% most prolific men and women authors. In contrast, changes in the average gender gap were marginal for authors below the 80th percentile of the publication distribution. This can clearly be seen in panel B, where the trends for men per quantile in 2019–2020 (solid, black dots) is projected unto the same trends for women (hollow dots). While the differences in trends below the 80th percentile are not visible in the figure, and the absolute differences are very small, the relative differences are noticeable. At the highest decile, the average difference increases from –1.35 (corresponding to 23% lower output for women) to –1.74 (31% lower output for women) from 2019–2020,, which is a relative change of 22.3%. Correspondingly the relative change is 25.8% in the 81st to 90th percentile and 25.9% in the 51st to 80th percentile.
Figure 4
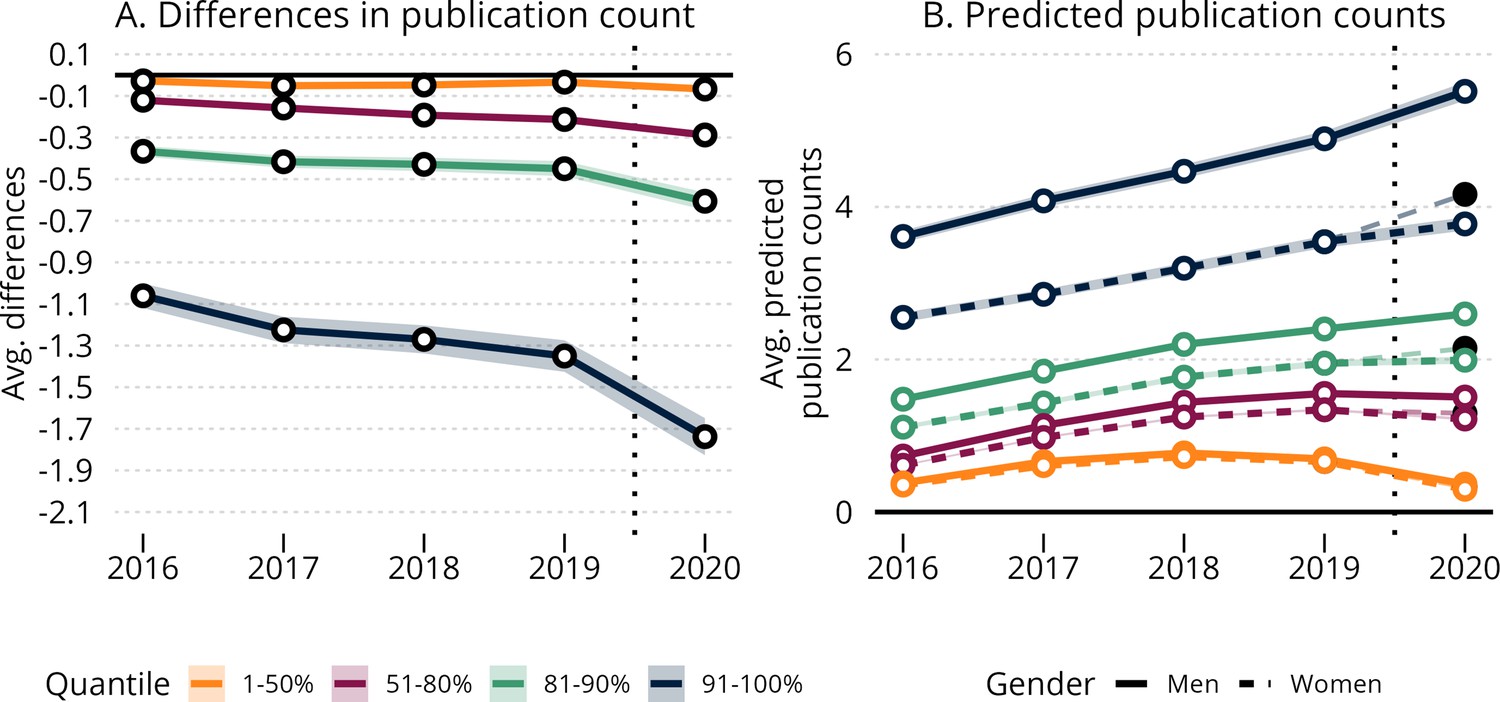
Stratified effects of the COVID-19 pandemic on the average gender gap in annual publishing rates.
Panel A shows the estimated average gender difference in publication rates by year. Panel B shows the predicted publishing rates for men and women authors. In each panel, scientists are divided into strata according to their total number of publications in the period 2016–2020. The difference between the thinner, dashed line with the black circle in 2020 and the thicker, dashed line with hollow circles in panel B specifies the average treatment effect for women. Point estimates are reported with 99.9% confidence bounds and robust standard errors clustered at the individual-author level. For information on how average marginal and predicted values are calculated, please refer to Materials and methods: Difference-in-differences model.
Country-level differences
The estimated change in the magnitude of the gender gap also varied across countries (Figure 5), with the smallest changes observed in Denmark, Australia, Pakistan and Belgium, and the largest increases found in Russia, Italy, Austria and Iran. The horizontal bar diagram to the right in Figure 5 shows that the vast majority of scientists are from the USA. This means that the average treatment effect on the treated () also gravitates towards the effect observed for the US population. Surprisingly, the estimated effects at the country-level were only weakly and inconsistently correlated with the severity of COVID-19 restrictions (Figure 5—figure supplement 1 and Figure 5—figure supplement 2).
Figure 5 with 2 supplements see all
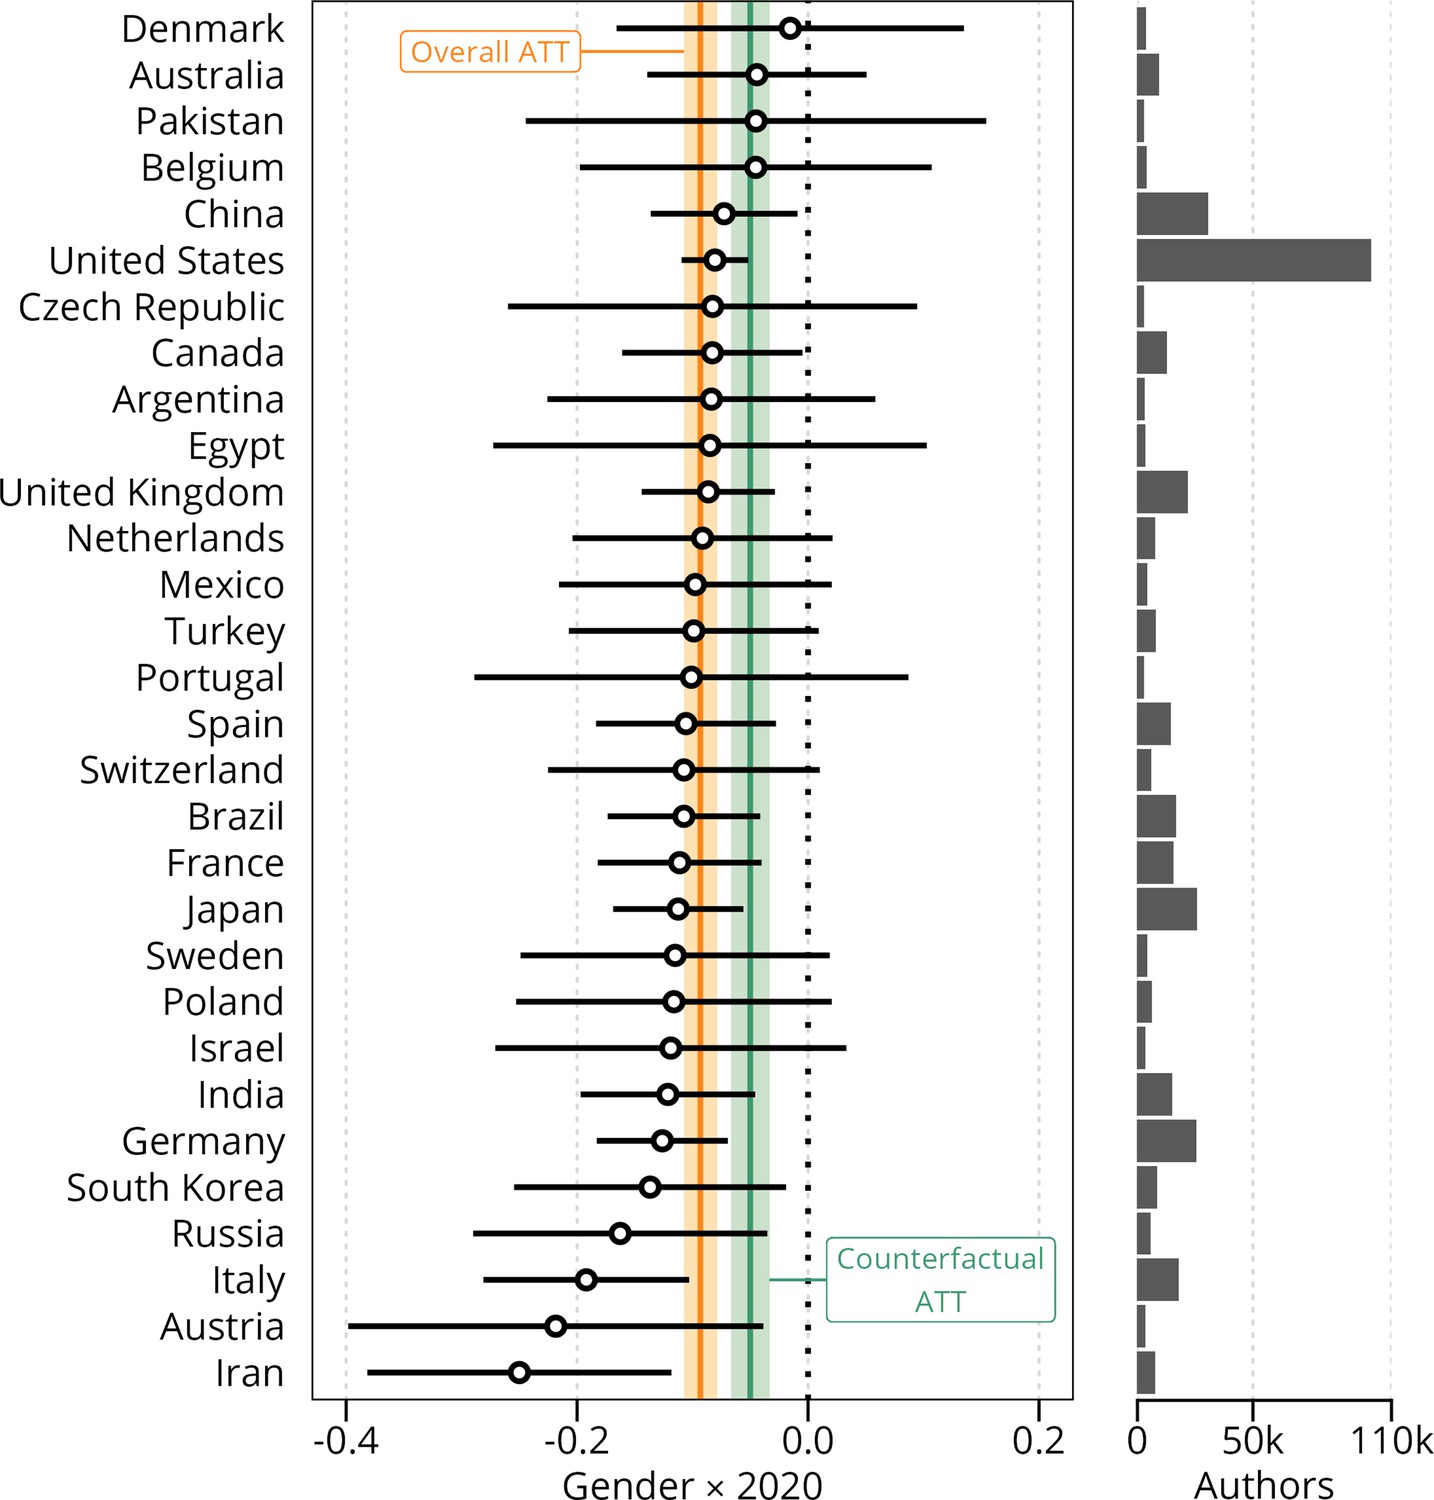
Gender differences in full publication productivity by country, 2019 vs 2020.
The hollow circles show the gender differences per country in full publications counts in 2020 relative to 2019, with error bars showing the 99% confidence intervals based on robust clustered standard errors. Countries are ranked by the estimated gender difference. The horizontal histogram shows the distribution of authors from each country, showing that the vast majority are from the USA. We only list the first 30 countries by number of authors, comprising 90% of authors in our sample. The orange and green lines and bands show the overall treatment effect on the sample and the counterfactual sample. (ATT is the Average Treatment effect on the Treated).
-
Figure 5—source data 1
OLS linear regression of counterfactual sample, with full count as dependent variable.
- https://cdn.elifesciences.org/articles/76559/elife-76559-fig5-data1-v3.docx
-
Figure 5—source data 2
OLS linear regression of counterfactual sample, with fractional count as dependent variable.
- https://cdn.elifesciences.org/articles/76559/elife-76559-fig5-data2-v3.docx
-
Figure 5—source data 3
Coefficients and standard errors relative to 2019 for the 30 countries with most authors in the dataset.
- https://cdn.elifesciences.org/articles/76559/elife-76559-fig5-data3-v3.docx
Discipline-level differences
As a final step in the analysis, we disaggregated results by discipline. As shown in Figure 6 panel A, the widening gender gap was persistent across all four disciplines but with markedly larger effects observed for clinical medicine (Average marginal gender difference = −0.117, CI: –0.138––0.095) and biology (Average marginal gender difference = −0.089, CI: –0.117––0.063) compared to basic medicine (Average marginal gender difference = 0.058, CI: –0.093––0.022) and chemistry (Average marginal gender difference = 0.062, CI: –0.100––0.023). Figure 6 panel B specifies the representation of authors according to their position in the publication-productivity distribution, across the four disciplines. As shown in the figure, we observe an over-representation of highly productive authors in clinical medicine implying that the large average marginal gender difference effect observed for this discipline may partially be driven by a higher proportion of prolific scientists.
Figure 6
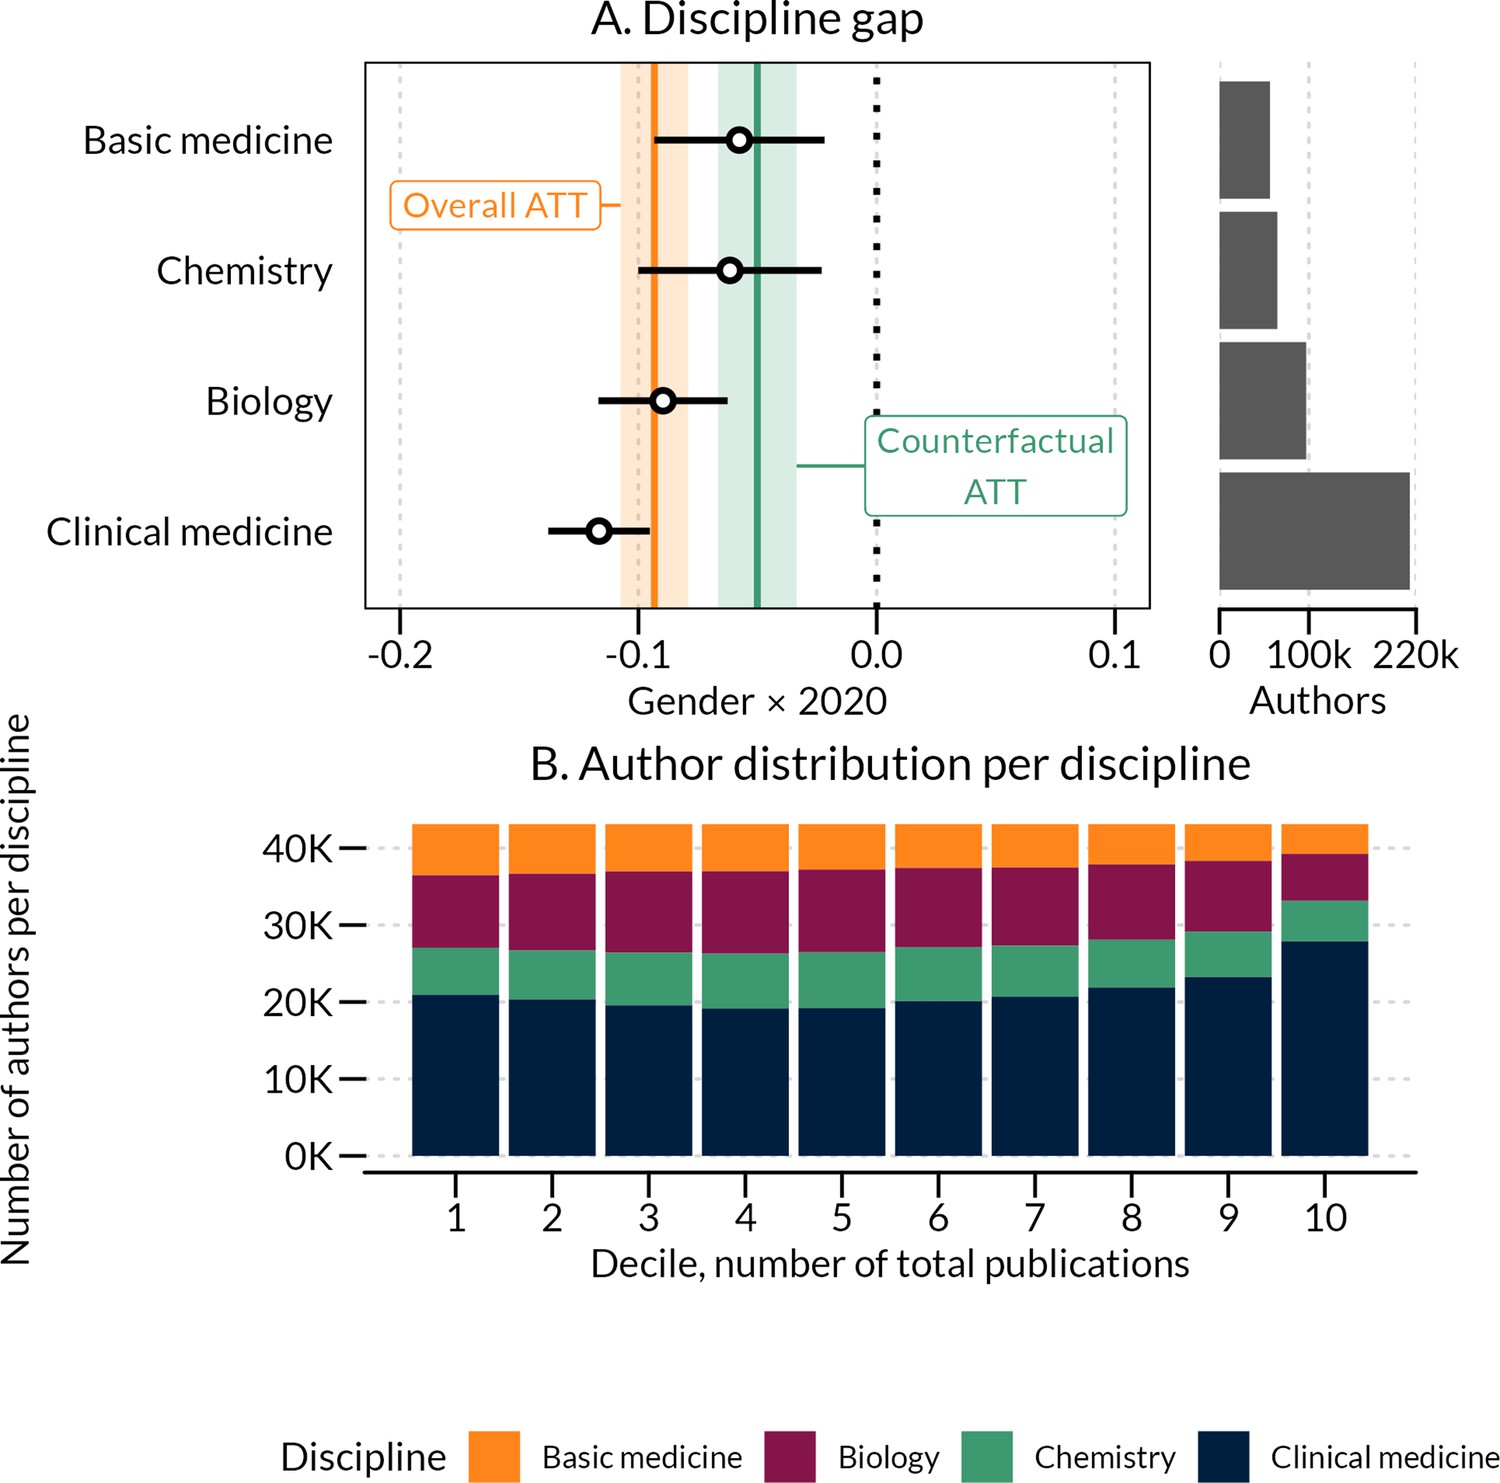
2020 gender differences in full publications counts relative to 2019, across the four disciplines comprising in our sample.
Difference-in-differences estimate from Figure 6—source data 1. 99% confidence intervals based on clustered standard errors are shown. Histograms show the distribution of authors who mainly publish within a given discipline, and orange and green lines and bands show the overall treatment effect on the sample and the counterfactual sample from Figure 2—source data 1 and Figure 5—source data 1. Panel B shows the distribution of authors per discipline in deciles of total publications over the time period.
-
Figure 6—source data 1
Coefficients and standard errors relative to 2019 for the four disciplines.
- https://cdn.elifesciences.org/articles/76559/elife-76559-fig6-data1-v3.docx
Robustness checks
We conducted two (Figure 7) placebo tests, simulating a placebo pandemic incident between 2017–2018 and 2018–2019. shows the difference-in-differences estimate for both full and fractionalized publication counts. In both cases, the estimates are very small in magnitude (ranging from 7%–17% of our 2020 estimate, ), and only statistically significant for the 2017–2018, full count, estimate at the 99% level (the 2017–2018 estimate is significant for the fractionalized count at a 95% level). Taken together, there does not appear to be a substantial difference in publication counts in the immediate years prior to the onset of the pandemic.
Figure 7
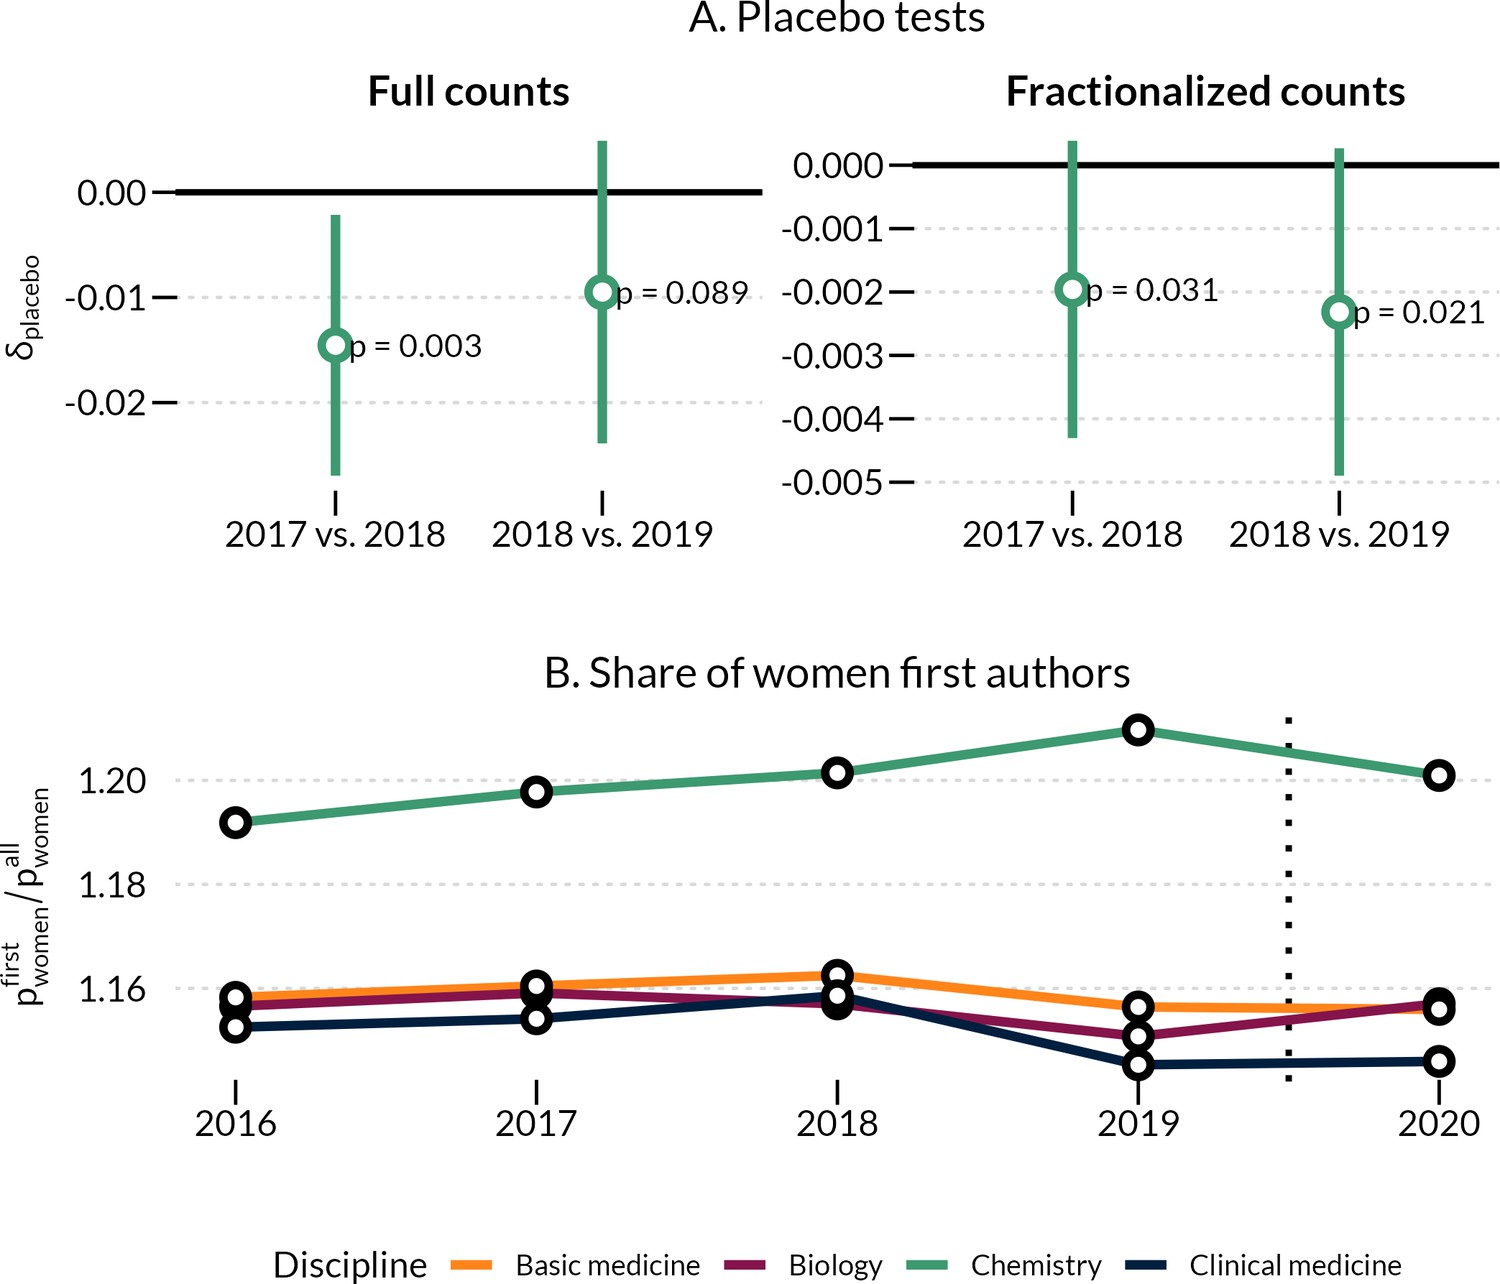
Test against hypothetical placebo pandemic in 2018/2019 (A) and changes in women as first authors (B).
(A) Difference in differences of publication productivity for placebo tests. Points show the difference in publication productivity for women relative to men for two placebo periods, using both full publication counts and fractionalized counts. Estimates are based on Figure 7—source data 1 and Figure 7—source data 2. Errorbars are 99% confidence intervals, with accompanying p-values based on clustered standard errors. (B) Ratio of women’s first author share to women’s share of all authorships. Each line shows the share of women who occupy the first author position divided by women’s share of all authorships by year for each of the four disciplines. A ratio > 1 shows a greater share of women first authors relative to all women’s authorships. Authorships counts are made for a larger sample than used in the main analysis, comprising all authorships registered in the Web of Science for each discipline and year.
-
Figure 7—source data 1
OLS linear regression of full and fractional count as dependent variable, placebo test of 2017 vs 2018.
Linear regression with author and year fixed effects. Standard errors in parentheses are HC1 and clustered at the author level.
- https://cdn.elifesciences.org/articles/76559/elife-76559-fig7-data1-v3.docx
-
Figure 7—source data 2
OLS linear regression of full and fractional count as dependent variable, placebo test of 2018 vs 2019.
Linear regression with author and year fixed effects. Standard errors in parentheses are HC1 and clustered at the author level.
- https://cdn.elifesciences.org/articles/76559/elife-76559-fig7-data2-v3.docx
We also check whether there are changes in the position in the author byline of women authors (see Figure 7B). We first observe, that the share of women first authors is higher than expected, considering the share of women in total. Some variation occurs over time, but there are no changes from 2019–2020 which could indicate a general shift in women appearing less often as first authors than before the pandemic.
Discussion
In this paper, we estimated the differential impact of COVID-19 on the annual publication rates of women and men in 2020 compared to 2019. Using individual-level panel data on a global sample of 431,207 authors, we observed small but consistent average increases in the gap between women’s and men’s annual publishing rates. This finding is consistent with extant research suggesting amplified gender disparities in manuscript submissions, first and last authorships, and self-reported research activities during COVID-19. However, unlike prior studies, we find that the gendered effects of COVID-19 are salient for early-career-scientists with four years of publication experience as well as for mid-career scientists with ten years of publication experience. While the numerical increase in the gender gap is largest for mid-career scientists, the relative change in the gender gap is biggest for early-career scientists. Moreover, we add to existing evidence by showing that the increase in the gender gap (in absolute terms) was most pronounced among highly productive authors and scientists working in clinical medicine and biology. Lastly, the widening gender gap appears to represent a genuine decline in publication productivity and not just a shift in author roles, as women continue to first author publications at similar rates as in prior years (Figure 7).
Despite clear country variations in the observed effects, we found negligible and inconsistent associations between local COVID-19 restrictions and estimated changes in the productivity gender gap. Further, the ordering of countries in Figure 5 does not seem to suggest that the gender-differentiated changes in productivity rates vary systematically according to a country’s level of gender equality, welfare model, or infection rate.
Taken together, these results indicate that the publication productivity of already prolific women scientists have been affected the most by the pandemic. Those designing interventions to promote equity in academic science and medicine should strive to understand the reasons why highly prolific men appeared able to maintain their annual publication rates while highly prolific women were not. Prior research suggests that it is possible that men with the highest levels of productivity may have been more likely to have been rewarded with access to additional workplace supports, such as endowed professorships, in recognition of their achievements (Gold et al., 2020). If so, this might have served as a cushion against the impact of the pandemic on those individuals. Moreover, if institutions prioritized protecting a few "superstar" researchers from teaching or clinical demands without clear processes for identifying which individuals received preferential treatment, the vast literature on unconscious bias suggests that such efforts might preferentially have protected outstanding men as compared to similarly outstanding women (NASEM, 2007). Prior research also suggests that high-achieving women scientists may be more likely than their male peers to state that their partners’ careers take priority (Mody et al., 2022). Indeed, it is possible that high-achieving men scientists’ partners may be particularly likely to be willing to make sacrifices in their own careers to take on additional domestic labor to allow continuation of their extraordinary partners’ work. If partners of extraordinarily productive women scientists are less willing to do so, and if this difference is even more marked than any differences that may exist when a scientist is less highly productive, this could also serve as a mechanism to drive the differences observed. Further research is necessary to investigate these and other possibilities.
The amplified effect in clinical medicine may be due to the dual research and clinical roles taken on by scientists in this discipline. Early research suggested that initial funding for COVID-19 related research was biased toward applications from men (Witteman et al., 2021), supporting a hypothesis that women spent disproportionally more time on clinical work or other demands around the time of the outbreak. However, further research is required to provide conclusive evidence on this question. The consequences of a systematically biased change in the work priorities for men and women in particularly clinical medicine can potentially reach far beyond the individual careers of those women affected by it. Research suggests a positive association between women’s participation as leading authors in medical research and a study’s likelihood of including sex and gender as analytical variables (Nielsen et al., 2017). The omission of gender and sex analysis has been widespread in COVID-19-related clinical trials (Brady et al., 2021), despite early evidence of sex-differences in the prognosis and outcome of the disease.
The widening gender-gap in publishing may be a detectable symptom of larger setbacks on issues of gender equity in science (King and Frederickson, 2021). Indeed, recent research also shows widening gender disparities in research project initiation (Gao et al., 2021) and clinical-trial leadership (Cevik et al., 2021).
Our study demonstrates the importance of reinforcing institutional commitments to gender equity through policies that support the inclusion and retention of women researchers (Andersen et al., 2020; Fulweiler et al., 2021; King and Frederickson, 2021; Narayana et al., 2020). While our study focuses on gender, other marginalized groups are likely to suffer from similar set-backs, potentially to an even higher degree. These groups are generally under-studied in the the literature on productivity gaps, as they are much more difficult to identify quantitatively. Further research, with reliable data on especially ethnicity, and with an inter-sectional perspective is needed.
Data on individual publication rates gives us a better estimate of the effects of the pandemic on researcher productivity than most previously published analyses focusing on publication-level effects. Despite this, the data do not allow us to disentangle how much of the widening gender gap is due to attrition. If the relative share of women scientists opting out of an academic career is higher in 2020 compared to 2019, this may inflate the observed change in productivity. Future research should examine the potential changes in women’s and men’s attrition rates in closer detail. Further, the counter-factual analysis presented in Figure 3—figure supplement 2 suggests a consistent increase in the size of gender productivity gap over time with a marginal annual change in the gender difference from year four to five amounting to 53% of the treatment effect observed in our main analysis. The estimated change from a 17% lower output for women than men in 2019 compared to 24% percent lower output for women than men in 2020 should thus be interpreted with some caution. However, both mechanisms - lower publication productivity and attrition - result in lower total publication outputs for women and lead to enlarged gender disparities. While we can not currently estimate the relationship between the two mechanisms, the conclusions above remain the same.
Our study design has four limitations. First, our analysis focused on annual publishing rates, which may obscure some of the potential effects of e.g. school closures on the immediate publishing rates. A more granular analysis of monthly publishing rates may reveal a more direct correlation between lockdowns and decreased publishing rates. However, information on when something is published is not available on a monthly basis for a large proportion of articles, and information on submission and review dates are even harder to obtain, often completely missing. Further, many of the delays occurring in the publishing process are out of the hand of authors and thus unrelated to the lockdown effect that they may be experiencing. By looking at annual data, we can estimate a more reliable effect overall. We strongly encourage publishers to make available transparent, open machine- and human-accessible information on which date a manuscript was received, reviewed, revised, accepted and published. Similarly, the weak relationship between country-level gender gaps and the severity of lockdown policies could be due to aggregation. Using survey data on self-reported time-use, Deryugina et al., 2022 show that e.g. the fraction of days with at least partial primary school closures negatively affected time loss for women researchers relative to men in the period Feb. 16 - July 31, 2020. To compare our yearly publication data with lockdown severity, we aggregated day-to-day data on school closures, workplace closures, stay at home requirements, and overall lockdown severity across the entire year of 2020.
Second, the author-disambiguation approach used to establish individual-level panel data unavoidably introduces some level of uncertainty into our analysis, and errors are more likely to occur for individuals with East Asian names (Nielsen and Andersen, 2021) (see Materials and Methods). The country-specific evidence for China and South-Korea (Figure 5) should thus also be interpreted with caution.
Third, the gender-assignment algorithm used in this study did not infer the gender of 20% of the author sample. This introduces potential sampling bias into our analysis. Moreover, the algorithm reduces author gender to a binary category (woman or man), but not all individuals identify as women or men. Despite this clear limitation, we find the algorithm useful in quantifying COVID-19-related disparities on a large scale (D’Ignazio and Klein, 2020).
Fourth, academic publishing is a slow endeavor, and article submissions may undergo many rounds of revisions before they are published (Homolak et al., 2020). This introduces two types of potential bias into our analysis: (a) some of the articles published in 2020 are based on research conducted in 2019; and (b) some of the research conducted in 2020 will not appear in print before 2021, or later. Thus, in the coming years, scientists should continue to monitor disparities in women’s and men’s publishing rates.
In science, even small negative kicks or setbacks may add up over time and become cumulative disadvantages (Valian, 1999; Cole and Singer, 1991). We observe a decreased growth in publications for all but the most productive men, and especially early-career researchers. This has the potential to reinforce disparities in an already heavily skewed system, if not given special attention, especially with regard to women. The widening gender gap in publishing observed in this study should thus be taken seriously by universities and funding agencies and factored into policies that allocate resources and support, as well as those that determine advancement and compensation, in order to mitigate inequities resulting from the unequal impact of the pandemic and its associated disruptions. Such inequities are deeply troubling both because they demonstrate how morally arbitrary characteristics like gender affect the opportunity to succeed in science and because they hinder the inclusion of diverse perspectives necessary to optimally advance scientific inquiry itself.
Materials and methods
Data on authors and their publications. Publication data were retrieved from the Web of Science (WoS) in-house implementation at CWTS, Leiden University. This version of the WoS has linked tables between authors, their publications and information on the probable gender of authors.
The CWTS WoS includes a high-quality disambiguated table of authors and links to their publications. This list is produced through an algorithmic identification of publication clusters, using author, publication, source and citation data (Caron and Eck, 2014; D’Angelo and van Eck, 2020). This algorithm greatly improves the likelihood of an author profile containing the correct links to a scientist’s publications, without including those of another author with the same name, and also including their own publications published under variations of their name. This algorithm so far has the highest precision and recall for this task (Tekles and Bornmann, 2020).
Author gender was inferred using a combination of Gender-API (https://gender-api.com/) and genderize (https://genderize.io/), in order to find the most likely gender of an author using their first name and country. The inferred gender is only applied in cases with >90% confidence, meaning gender ambiguous names, or names with very few observations for a country, are not included. This leads to an exclusion of 20% of all authors, with a majority of those from China and South Korea, as first names in these countries tend to be less gendered than for most other countries.
Disciplines were inferred from the journal in which articles were published, using the translation table (http://help.prod-incites.com/inCites2Live/filterValuesGroup/researchAreaSchema/oecdCategoryScheme.html) between WoS Subject Categories and the OECD Fields of Science from the Frascati Manual (OECD Working OECD Working Party of National Experts on Science and Technology Indicators, 2007). For each author, we summed the weighted major scientific fields and assigned the most frequent as their main discipline.
We queried the WoS for all authors with their first publication in either 2009 or 2010 (mid-career researchers) or 2016 or 2017 (early-career researchers). We excluded authors with fewer than three publications in total, and further limited the sample to authors with at least one publication in 2018 or 2019. The last step was done to create a sample of actively publishing scientists. We assigned main discipline codes to all authors and limited the sample to authors from 1.4 Chemical sciences, 1.6 Biological sciences, 3.1 Basic medicine and 3.2 Clinical medicine. This sample consisted of 431,207 authors linked to 2,113,108 publications in the period 2016–2020. The counterfactual sample was constructed identically, but for authors with their first publication in 2011 or 2012, counting their publications until 2015. This sample included 276,793 authors linked to 1,060,330 publications.
Difference-in-differences model
Request a detailed protocolTo estimate the differential impact of the COVID-19 pandemic on the gender gap in publication productivity, we leveraged a difference-in-differences strategy. Because of a persistent gender gap in the number of publications over time, we used the yearly data on journal article publications prior to 2020 as baselines for estimating how the pandemic impacted the scholarly productivity of men and women differently. Although, not a randomized treatment, we treated the yearly gender difference in publication numbers (for 2016, 2017, 2018, and 2020) relative to the difference in 2019 as our key estimand. To estimate the average treatment effect on the treated (), the gender difference relative to the baseline 2019 difference, we specified the following regression model:
(1)
Where denotes the number of published articles by individual in year , are the author fixed effects, are the year fixed effects, and are a set of parameters with estimating the difference in publication numbers between men and women each year, relative to the difference in 2019 (), which we left out of the estimation. The indicator is here the year relative to 2020. The for a given year relative to 2019 is then:
(2)
When used in the analysis, predicted values are the average partial effects at specified combinations of gender and year. We calculate the linear predicted value based on the regression model for each unit of observation (person i at year t), and average over these units for each specified subset of units (e.g. women in 2019 or men in 2018). This provides average predicted publications counts for each group at each time. Estimated differences in publication counts are the average marginal effects for each year derived from the regression model. The marginal effects are the partial derivative with respect to gender for each unit of observation, and the estimated average differences are then the mean of the unit-specific derivatives at each year.
Parallel trends and counterfactual samples
Request a detailed protocolValid identification of the differential impact of the COVID-19 pandemic on researchers of different genders relies on a strong assumption of parallel trends of publication outcomes in pre-pandemic years. I.e. identification of the average treatment effect on women essentially assumes that . A large literature (e.g. Hart and Perlis, 2019; Mairesse and Pezzoni, 2015) has documented persistent gender gaps in publication productivity. Our dynamic difference-in-differences model confirms this. A consistent gap between men and women is present in all years prior to 2020 for our full sample (Figure 2). This gap also tends to slightly increase over time, casting doubt on the assumption of similar publication trends for men and women scientists. Figure 2—source data 1 shows a statistically significant difference in the publication gender gap between 2016 and 2019, and 2017 and 2019. However, the difference is much smaller, and statistically non-significant, when comparing 2018 and 2019.
We also modeled the differential publications rates for a counterfactual sample of researchers, who started publishing (or who’s first publication was registered in the Web of Science database) in 2011, across the following five years. As shown in Figure 3—figure supplement 1, the gender gap in publication rates increased from almost parity in the first year to an average difference of 0.2 full publications five years after (0.05 fractionalized). Again, the gender gap increased with 1/20 of a full publication (full count: –0.05, 99% CI: [–0.0665; –0.0337], fractionalized count: –0.006, 99% CI: [–0.0094; –0.0028]) between four and five years after first publication, amounting to 53% of our from the full sample.
Data on lockdown severity
Request a detailed protocolTo assess how the pandemic may entail different gender effects across countries and lockdown severity, we use data from the Oxford COVID-19 Government Response Tracker. We construct seven lockdown indicators at the country level by aggregating four measures of daily government COVID-policies across a whole year (from March 1st 2020 to December 31st 2020) in two ways. Table 1 summarizes the seven indicators. We use four of the Oxford COVID-19 Government Response Tracker indicators (Hale et al., 2021) related to the coordinated close-downs of schools (C1) or workplaces (C2), stay at home requirements (C6), and the combined policy stringency index. First, we sum the indicator value across the whole year to create a cumulative sum of restriction severity for all four indicators, such that a lockdown indicator is the summarized values across 305 days:
(3)
Table 1
Seven indicators of COVID-19 lockdown severity.
| Sum indicator | Count of maximum values | |
|---|---|---|
| School lockdowns | + | + |
| Workplace lockdowns | + | + |
| Stay at home requirements | + | + |
| Stringency index | + | - |
Second, we count the number of days across the same period with the maximum indicator value for three indicators relating to school lockdowns, workplace lockdowns, and stay at home requirements. Each of these indicators can take the values 0, 1, 2, and three per day (where three indicates the most severe policy situation for the three indicators in question). For these three indicators we create a conditional sum across 305 days. We then let be the number of days an indicator equals 3:
(4)
Together, this gives us seven different indicators of lockdown severity at the national level. It is important to note that we use national-level policy indicators capturing only COVID-19 policy responses enacted at the country or federal level. In cases where sub-national policies supersede country-level restrictions, more or less severe policies are not reflected in the indicators.
Heterogeneity in COVID-19 effects
Request a detailed protocolTo show the heterogeneity in possible COVID-19 induced treatment effects, we estimated our difference-in-differences model separately for each country, focusing on the 40 countries contributing 95% of all authors in our sample. We also investigated the degree to which this heterogeneity could be attributed to variations in the severity of policy restrictions across countries. Using the seven lockdown indicators described above, we compared country-level gender gaps with the measures of severity as shown in Figure 5—figure supplement 1 and Figure 5—figure supplement 2.
Data availability
The current manuscript is a computational study, so no data have been generated for this manuscript. Source code and compiled data are available here: https://github.com/emilbargmann/covid_update (copy archived at swh:1:rev:436c899ca98e80b5f09500bf54b40b3649cc5b02) Raw data are available here: https://github.com/ipoga/covid19_gender.
References
-
Departmental effects on scientific productivityAmerican Sociological Review 55:469.https://doi.org/10.2307/2095801
-
What explains differences in finance research productivity during the pandemicThe Journal of Finance 76:1655–1697.https://doi.org/10.1111/jofi.13028
-
The impact of appointment type on the productivity and commitment of full-time faculty in research and doctoral institutionsThe Journal of Higher Education 77:89–123.https://doi.org/10.1353/jhe.2006.0002
-
Lack of consideration of sex and gender in COVID-19 clinical studiesNature Communications 12:4015.https://doi.org/10.1038/s41467-021-24265-8
-
ConferenceLarge scale author name disambiguation using rule-based scoring and clusteringIn Proceedings of the Science and Technology Indicators conference.
-
Gender disparities in coronavirus disease 2019 clinical trial leadershipClinical Microbiology and Infection 27:1007–1010.https://doi.org/10.1016/j.cmi.2020.12.025
-
BookA theory of limited differencesIn: Zuckerman H, Cole JR, Bruer J, editors. The Outer Circle: Women in the Scientific Community. Yale University Press. pp. 277–310.https://doi.org/10.2307/2579869
-
Gender inequality in research productivity during the COVID-19 pandemicManufacturing & Service Operations Management 1:0991.https://doi.org/10.1287/msom.2021.0991
-
COVID-19 disruptions disproportionately affect female academicsAEA Papers and Proceedings 111:164–168.https://doi.org/10.1257/pandp.20211017
-
ConferencePublic school access or stay-at-home partner: Factors mitigating the adverse effects of the covid-19 pandemic on academic parentsNational Bureau of Economic Research.
-
Potentially long-lasting effects of the pandemic on scientistsNature Communications 12:6188.https://doi.org/10.1038/s41467-021-26428-z
-
Gender differences in endowed chairs in medicine at top schoolsJAMA Internal Medicine 180:1391–1394.https://doi.org/10.1001/jamainternmed.2020.2677
-
Faculty service loads and gender: Are women taking care of the academic family?Research in Higher Education 58:672–694.https://doi.org/10.1007/s11162-017-9454-2
-
Trends in proportion of women as authors of medical journal articles, 2008-2018JAMA Internal Medicine 179:1285–1287.https://doi.org/10.1001/jamainternmed.2019.0907
-
BookPublishing While Female: Are Women Held to Higher Standards? Evidence from Peer ReviewCambridge Working Paper Economics.https://doi.org/10.17863/CAM.17548
-
COVID-19 lockdown effects on gender inequalityNature Astronomy 4:1114.https://doi.org/10.1038/s41550-020-01258-z
-
Does gender affect scientific productivityRevue Économique 66:65.https://doi.org/10.3917/reco.661.0065
-
Gender differences in work-family conflict experiences of faculty in academic medicineJournal of General Internal Medicine 37:280–282.https://doi.org/10.1007/s11606-020-06559-7
-
The impact of the COVID-19 pandemic on journal scholarly activity among female contributorsJournal of the American College of Radiology 18:1044–1047.https://doi.org/10.1016/j.jacr.2021.01.011
-
Gender disparity in the authorship of biomedical research publications during the COVID-19 pandemic: Retrospective observational studyJournal of Medical Internet Research 23:e25379.https://doi.org/10.2196/25379
-
Unequal effects of the COVID-19 pandemic on scientistsNature Human Behaviour 4:880–883.https://doi.org/10.1038/s41562-020-0921-y
-
Minding the gap: Organizational strategies to promote gender equity in academic medicine during the COVID-19 pandemicJournal of General Internal Medicine 35:3681–3684.https://doi.org/10.1007/s11606-020-06269-0
-
BookBeyond Bias and BarriersWashington, DC: National Academies Press.https://doi.org/10.17226/11741
-
Global citation inequality is on the risePNAS 118:e2012208118.https://doi.org/10.1073/pnas.2012208118
-
ConferenceRevised Field of Science and Technology (FOS) in the Frascati ManualDirectorate for Science, Technology and Innovation.
-
Gender inequality in publishing during the COVID-19 pandemicBrain, Behavior, and Immunity 91:1–3.https://doi.org/10.1016/j.bbi.2020.11.022
-
Faculty research productivity: Exploring the role of gender and family-related factorsResearch in Higher Education 43:423–446.https://doi.org/10.1023/A:1015575616285
-
Unraveling the academic productivity of economists: The opportunity costs of teaching and serviceSouthern Economic Journal 72:846.https://doi.org/10.2307/20111856
-
Author name disambiguation of bibliometric data: A comparison of several unsupervised approachesQuantitative Science Studies 1:1510–1528.https://doi.org/10.1162/qss_a_00081
-
BookWhy so Slow? The Advancement of WomenCambridge, MA: Mass MIT Press.https://doi.org/10.7551/mitpress/7235.001.0001
-
Sex differences in research productivity: New evidence about an old puzzleAmerican Sociological Review 63:847.https://doi.org/10.2307/2657505
-
The differential impact of COVID‐19 on the work conditions of women and men academics during the lockdownGender, Work, and Organization 28:243–249.https://doi.org/10.1111/gwao.12529
Decision letter
-
Peter RodgersSenior and Reviewing Editor; eLife, United Kingdom
In the interests of transparency, eLife publishes the most substantive revision requests and the accompanying author responses.
Decision letter after peer review:
Thank you for submitting your article "Individual-level researcher data confirm the widening gender gap in publishing rates during COVID-19" to eLife for consideration as a Feature Article. Your article has been reviewed by two peer reviewers, and the evaluation has been overseen by the eLife Features Editor, Peter Rodgers. The reviewers opted to remain anonymous.
The reviewers and editors have discussed the reviews and we have drafted this decision letter to help you prepare a revised submission. Please also note the following
i) If your article is accepted, we would like to publish some of the relevant code with the article: please let me know if this will be a problem.
ii) The eLife Features Editor will also contact you separately about some editorial issues that you will need to address regarding the appendixes and figure supplements.
Summary:
This very interesting paper estimates the differential impact of COVID-19 on the annual publication rates of male and female authors working in the disciplines of biology, chemistry, and clinical and basic medicine relative to the pre-pandemic publication rate. When the pandemic began early in 2020, a number of studies of preprints predicted that gender gaps in productivity would get larger. Using data on a global sample of 431,207 authors (2,113,108 publications), this paper documents a small but consistent average worsening in the gap between women's and men's annual publishing rates. The largest differential impacts by gender were observed for particularly prolific researchers, in the top-10% of the productivity distribution. The paper also performs heterogeneity analyses by career stage and discipline. In addition, the authors compared their results to a counterfactual sample of authors and their publications from 2011 to 2015, to see how much the gender gap widened over a 5-year period with no pandemic. Overall, this is a well-designed study with compelling results. However, there are a number of points that need to be addressed to make the article suitable for publication.
Major/Essential revisions:
1) I am curious as to why the authors decided to focus on the particular disciplines they do. In terms of generalizability of findings, this particular selection might present difficulties if these fields had different post-covid policy responses, as well as unique challenges due to the pandemic, as compared to others. It would be important to understand why these fields were selected and how this might affect the overarching conclusions.
2) The study looks at the annual publication rate pre and post covid, focusing on how the gender gap in 2020 compared to 2019. The disruptions due to the pandemic did not start in most parts of the world until March of 2020. I would encourage the authors to conduct the analysis at a more granular level (by, say, looking at monthly publications rather than annual averages)? This could also potentially enrich the country-level analysis, as there was considerable time variable in lockdowns.
Note from editor: Addressing this point is optional, but I would encourage you to perform this analysis if possible. If you decide not to address this point, please discuss it as a topic that could be explored in future research.
3) One of the contributions that the paper emphasizes on p. 1 line 30 is that the study considers longer-term publication impacts. I would caution against using "long-term" to refer to 2020. As the paper rightly points out on p. 9, line 212, publishing takes quite a long time. From the start of the research project to the publication stage, we might expect to see much longer lags than just a few months. Even in the sciences, where the publication process is quicker than in other disciplines, it's highly unlikely that we are seeing an impact on new projects. The 2020 papers being published are likely old projects that were already in the publication pipeline and are now coming out at journals. Therefore, these are much more likely to pick up the pre-pandemic trend, which we see in fact – Figure 2 shows a slight widening of the gender gap pre-treatment (from -.2 to roughly around -.27 or so). I would encourage the authors to reframe the article with this in mind.
4) The analysis can be expanded to look at the quality dimension of publications (control for journal rankings in some systematic manner), as well as how the female authors stack up against male authors in terms of contributions. In science, we can tell clearly which author contributed the most to the project (first author). It would be interesting to see an analysis by first author only.
Note from editor: Addressing this point is optional: however, if you decide not to address it please discuss it as a topic that could be explored in future research.
5) I would like to know more details about the country-level comparisons. In a recent NBER Working Paper 29668, Deryugina et al. (2022) show that school openness at the country level correlates with a reduction in the gender gap in research time lost by men and women. It would also be important to know how the data sources treats partial closures, timing of closures, as well as academic breaks.
6) As regards severity, I am not sure why the authors lump countries into severity bins rather than using country-level openness measures. There also needs to be greater discussion of the results of the lockdown severity analysis. Why did you find no pattern? Is it because there is too much within-country heterogeneity in the timing, type, and severity of lockdown measures to observe a pattern, and finer-grain analyses (e.g., on a city-by-city basis) are needed? Is it that the demographics of women scientists differ substantially among countries, affecting, for example, the fraction of women scientists with young children? Is it that institutional responses and supports counteracted lockdown effects in some places but not others?
7) My main criticism is that the paper's Discussion section is rather boilerplate; it covers much of the same ground as previous papers on the pandemic's effects on women academics. Instead, I think I would be better to highlight some of the unique insights derived from the present analysis that currently get little attention in the Discussion. For example, I was struck by the analysis in Figure 4, which clearly shows that the gender gap is widest among the most productive scientists. This was true before COVID-19 and has become more pronounced during the pandemic. Why is this? What does it suggest about the pandemic's impacts on women versus men scientists? At the risk of over-interpreting Figure 4, it appears from panel B that the most productive men either maintained or improved their productivity during the pandemic, while the pandemic hurt the productivity of everyone else. Are highly productive men, but not women, most likely to have partners that do not work and who could thus shoulder additional caregiving or domestic duties? Are highly productive men, but not women, most likely to be spared the additional teaching or service burdens during the pandemic? I realize the present analysis cannot answer these questions, but the authors should discuss these possibilities.
8) Several figures (Figure 2 and the early-career panel of Figure 3, as well as the fractional-count versions in the supplement) suggest that publication rate declined for both men and women authors during the pandemic, it just declined more among women. This is worth discussing as it suggests that tenure committees and grant panels, etc., need to revise their expectations vis-à-vis productivity for all researchers, and especially so for women scientists.
9) The discussion says, "unlike prior studies, we find that the gendered effects of COVID-19 are salient for early career-scientists with four years of publication experience as well as for mid-career scientists with ten years of publication experience" (Lines 154-156), but I found this a bit misleading. Similarly, Lines 16-17 in the abstract imply that the gender gap widened similarly for early-career and mid-career scientists. But from Figure 3, it appears there is a growing gender gap during the pandemic for both early-career and mid-career researchers, but that the gender gap grows larger for mid-career than for early-career scientists. Please rephrase the abstract and discussion to reflect Figure 3.
https://doi.org/10.7554/eLife.76559.sa1Author response
Major/Essential revisions:
1) I am curious as to why the authors decided to focus on the particular disciplines they do. In terms of generalizability of findings, this particular selection might present difficulties if these fields had different post-covid policy responses, as well as unique challenges due to the pandemic, as compared to others. It would be important to understand why these fields were selected and how this might affect the overarching conclusions.
Thank you for this comment. We agree, there needs to be a justification of the field selection, which we added in the introduction, as follows:
“We chose these fields as they are well-represented in Web of Science (more than 90% of references are included in Web of Science), their primary knowledge production mode is through journal publication (as opposed to e.g. computer science and most engineering fields, or the humanities), research is comparatively collaborative (although some types of clinical research has somewhat more authors), publishing is relatively fast (compared to the social sciences). Biology, clinical and basic medicine also have some of the highest shares of women scientists in the natural sciences.”
2) The study looks at the annual publication rate pre and post covid, focusing on how the gender gap in 2020 compared to 2019. The disruptions due to the pandemic did not start in most parts of the world until March of 2020. I would encourage the authors to conduct the analysis at a more granular level (by, say, looking at monthly publications rather than annual averages)? This could also potentially enrich the country-level analysis, as there was considerable time variable in lockdowns.
Note from editor: Addressing this point is optional, but I would encourage you to perform this analysis if possible. If you decide not to address this point, please discuss it as a topic that could be explored in future research.
During the planning of this study, we intended to do precisely this. However, data on publication month is surprisingly not available or representable for all publications (and even when it is, journals may use labels such as “Summer 2020”). In addition, while we look into the effect of lock-downs (and don’t find a clear one), there are many other reasons the pandemic has influenced the publication productivity of men and women differently, e.g. differences in funding, teaching workloads, burnout, expectations of academic service and care etc.
As a final reason behind the choice not to use per-month data, is the fact that for most scientists, publishing a paper is a somewhat rare event that does not happen on a monthly basis. We would not have been able to use the panel-based difference-in-difference design allowing this type of analysis, if we should have analysed differences on a per-month basis.
We have added the following as a limitation in the discussion:
“Our analysis focused on annual publishing rates, which may obscure some of the potential effects of e.g. school closures on the immediate publishing rates. A more granular analysis of monthly publishing rates may reveal a more direct correlation between lock-downs and decreased publishing rates. However; information on when something is published is not available on a monthly basis for a large proportion of articles, and information on submission and review dates are even harder to obtain, often completely missing even through manual process. Furthermore, many of the delays in the publishing process are out of the hand of authors and thus unrelated to the lock-down effect they may be experiencing, and many other pandemic factors may be related to an increasing gender gap than the very specific lock-downs. By looking at annual data, we see a more robust effect overall. We strongly encourage publishers to publish transparent, open machine- and human-accessible information on which day a manuscript was received, reviewed, revised, accepted and published.”
3) One of the contributions that the paper emphasizes on p. 1 line 30 is that the study considers longer-term publication impacts. I would caution against using "long-term" to refer to 2020. As the paper rightly points out on p. 9, line 212, publishing takes quite a long time. From the start of the research project to the publication stage, we might expect to see much longer lags than just a few months. Even in the sciences, where the publication process is quicker than in other disciplines, it's highly unlikely that we are seeing an impact on new projects. The 2020 papers being published are likely old projects that were already in the publication pipeline and are now coming out at journals. Therefore, these are much more likely to pick up the pre-pandemic trend, which we see in fact – Figure 2 shows a slight widening of the gender gap pre-treatment (from -.2 to roughly around -.27 or so). I would encourage the authors to reframe the article with this in mind.
This is a good point. We have changed longer-term effects to longitudinal effects in accordance with your suggestion.
4) The analysis can be expanded to look at the quality dimension of publications (control for journal rankings in some systematic manner), as well as how the female authors stack up against male authors in terms of contributions. In science, we can tell clearly which author contributed the most to the project (first author). It would be interesting to see an analysis by first author only.
Note from editor: Addressing this point is optional: however, if you decide not to address it please discuss it as a topic that could be explored in future research.
Thank you for the suggestion. We added a descriptive analysis of the trends in women’s first authorship shares between 2016 and 2020 for each of the four disciplines. For each year, women were more likely to occupy the first authorship compared to a baseline of all authorships, showing no clear decline in women’s first authorships. Only chemistry showed a slight decline in women’s first authorships relative to all authorships, but these are not dramatic changes. We have added this clarification to the Discussion section.
5) I would like to know more details about the country-level comparisons. In a recent NBER Working Paper 29668, Deryugina et al. (2022) show that school openness at the country level correlates with a reduction in the gender gap in research time lost by men and women. It would also be important to know how the data sources treats partial closures, timing of closures, as well as academic breaks.
Thank you for the suggestion and relevant citation. We have added considerations in the Discussion section specifically focusing on why lock-down severity does not seem to correlate to gender gap levels. A likely factor is the need to aggregate day-to-day levels of policy severity across almost the whole year of 2020 (305 days, as stipulated in the Materials and methods section) to compare these to yearly publication gaps. Furthermore, we have clarified that these indicators pertain to the national policy level, but ignoring sub-national variation. This may be inappropriate in some countries where Covid-19 policies have largely been enacted at state or regional levels. However, with such a large country sample it would be impossible to compare gender gaps across countries where relevant policies are mostly sub-national or nation. As our sample comprises many researchers from the US, an idea for future studies could be to conduct a case study on individual researchers in US universities and state-level genders gaps vis-à-vis Covid-policies. This is, nevertheless, beyond the scope of this article.
6) As regards severity, I am not sure why the authors lump countries into severity bins rather than using country-level openness measures. There also needs to be greater discussion of the results of the lockdown severity analysis. Why did you find no pattern? Is it because there is too much within-country heterogeneity in the timing, type, and severity of lockdown measures to observe a pattern, and finer-grain analyses (e.g., on a city-by-city basis) are needed? Is it that the demographics of women scientists differ substantially among countries, affecting, for example, the fraction of women scientists with young children? Is it that institutional responses and supports counteracted lockdown effects in some places but not others?
Thank you for this comment. We have changed the severity-related figure to instead show the individual country-level gender gaps plotted against the openness measures. The revised figure show a similar lack of relationship to national gender gaps in publications. As stated above, we think it highly likely that within-country, and across-time, variation in Covid-response policies makes it hard to discern any decisive patterns from the more aggregate data. A city-by-city analysis would not be feasible as large scale data on city policies are not available, and given the lack of wide-covering data on monthly publications, a more fine-grained analysis over time is not possible either.
7) My main criticism is that the paper's Discussion section is rather boilerplate; it covers much of the same ground as previous papers on the pandemic's effects on women academics. Instead, I think I would be better to highlight some of the unique insights derived from the present analysis that currently get little attention in the Discussion. For example, I was struck by the analysis in Figure 4, which clearly shows that the gender gap is widest among the most productive scientists. This was true before COVID-19 and has become more pronounced during the pandemic. Why is this? What does it suggest about the pandemic's impacts on women versus men scientists? At the risk of over-interpreting Figure 4, it appears from panel B that the most productive men either maintained or improved their productivity during the pandemic, while the pandemic hurt the productivity of everyone else. Are highly productive men, but not women, most likely to have partners that do not work and who could thus shoulder additional caregiving or domestic duties? Are highly productive men, but not women, most likely to be spared the additional teaching or service burdens during the pandemic? I realize the present analysis cannot answer these questions, but the authors should discuss these possibilities.
This is a fair point, and we have made a number of revisions based on the other comments which we believe alleviates some of the “boilerplate” phrasing. To address the prolific-perspective, we also added the following paragraph to the discussion:
“Those designing interventions to promote equity in academic science and medicine should strive to understand the reasons why highly prolific men appeared able to maintain their annual publication rates while highly prolific women were not. Prior research suggests that it is possible that men with the highest levels of productivity may have been more likely to have been rewarded with access to additional workplace supports, such as endowed professorships, in recognition of their achievements (Gold et al. 2020). If so, this might have served as a cushion against the impact of the pandemic on those individuals. Moreover, if institutions prioritized protecting a few “superstar” researchers from teaching or clinical demands without clear processes for identifying which individuals received preferential treatment, the vast literature on unconscious bias suggests that such efforts might preferentially have protected outstanding men as compared to similarly outstanding women (NASEM, 2007). Prior research also suggests that high-achieving women scientists may be more likely than their male peers to state that their partners’ careers take priority (Mody et al., 2020). Indeed, it is possible that high-achieving men scientists’ partners may be particularly likely to be willing to make sacrifices in their own careers to take on additional domestic labor to allow continuation of their extraordinary partners’ work. If partners of extraordinarily productive women scientists are less willing to do so, and if this difference is even more marked than any differences that may exist when a scientist is less highly productive, this could also serve as a mechanism to drive the differences observed. Further research is necessary to investigate these and other possibilities.”
8) Several figures (Figure 2 and the early-career panel of Figure 3, as well as the fractional-count versions in the supplement) suggest that publication rate declined for both men and women authors during the pandemic, it just declined more among women. This is worth discussing as it suggests that tenure committees and grant panels, etc., need to revise their expectations vis-à-vis productivity for all researchers, and especially so for women scientists.
Thank you for this comment. We agree with the observation, and that grant panels, promotion committees etc. need to be aware of this. However, in many of those cases, comparisons between candidates occur at the same career stage and when not, evaluators are aware of career stage differences. We therefore consider the increasing gender gap more crucial and still focus our discussion on this. We included the following in the concluding paragraph of the discussion to give attention to the more overall problem:
“We observe a decline in publications for all but the most productive men, and especially early career researchers. This has the potential to further skew an already heavily skewed system, if not given special attention, especially with regard to women.”
9) The discussion says, "unlike prior studies, we find that the gendered effects of COVID-19 are salient for early career-scientists with four years of publication experience as well as for mid-career scientists with ten years of publication experience" (Lines 154-156), but I found this a bit misleading. Similarly, Lines 16-17 in the abstract imply that the gender gap widened similarly for early-career and mid-career scientists. But from Figure 3, it appears there is a growing gender gap during the pandemic for both early-career and mid-career researchers, but that the gender gap grows larger for mid-career than for early-career scientists. Please rephrase the abstract and discussion to reflect Figure 3.
Thank you for pointing to this inconsistency in the representation and discussion of our results. While the numerical difference is indeed larger for mid-career scientists, the relative change in the gender gap is larger for early career scientists. We have revised the results and Discussion sections to make this point clearer.
https://doi.org/10.7554/eLife.76559.sa2Article and author information
Author details
Emil Bargmann Madsen

Mathias Wullum Nielsen
Jens Peter Andersen
Funding
Samfund og Erhverv, Det Frie Forskningsråd (DFF-0133-00165B)
- Emil Bargmann Madsen
- Mathias Wullum Nielsen
- Josefine Bjørnholm
- Jens Peter Andersen
Aarhus Universitets Forskningsfond (AUFF-F-2018-7-5)
- Jens Peter Andersen
Independent Research Fund Denmark (9130-00029B)
- Mathias Wullum Nielsen
The funders had no role in study design, data collection and interpretation, or the decision to submit the work for publication.
Publication history
- Received: December 21, 2021
- Accepted: March 15, 2022
- Accepted Manuscript published: March 16, 2022 (version 1)
- Accepted Manuscript updated: March 17, 2022 (version 2)
- Version of Record published: March 23, 2022 (version 3)
Copyright
© 2022, Madsen et al.
This article is distributed under the terms of the Creative Commons Attribution License, which permits unrestricted use and redistribution provided that the original author and source are credited.
Metrics
-
- 2,765
- views
-
- 244
- downloads
-
- 24
- citations
Views, downloads and citations are aggregated across all versions of this paper published by eLife.
Download links
A two-part list of links to download the article, or parts of the article, in various formats.
Downloads (link to download the article as PDF and Executable version)
Open citations (links to open the citations from this article in various online reference manager services)
Cite this article (links to download the citations from this article in formats compatible with various reference manager tools)
Meta-Research: Author-level data confirm the widening gender gap in publishing rates during COVID-19
eLife 11:e76559.
https://doi.org/10.7554/eLife.76559

Further reading
-
eLife’s Executable Research Article lets authors include live code, data and interactive figures in their published paper.
-
- Computational and Systems Biology
- Genetics and Genomics
We propose a new framework for human genetic association studies: at each locus, a deep learning model (in this study, Sei) is used to calculate the functional genomic activity score for two haplotypes per individual. This score, defined as the Haplotype Function Score (HFS), replaces the original genotype in association studies. Applying the HFS framework to 14 complex traits in the UK Biobank, we identified 3619 independent HFS–trait associations with a significance of p < 5 × 10⁻⁸. Fine-mapping revealed 2699 causal associations, corresponding to a median increase of 63 causal findings per trait compared with single-nucleotide polymorphism (SNP)-based analysis. HFS-based enrichment analysis uncovered 727 pathway–trait associations and 153 tissue–trait associations with strong biological interpretability, including ‘circadian pathway-chronotype’ and ‘arachidonic acid-intelligence’. Lastly, we applied least absolute shrinkage and selection operator (LASSO) regression to integrate HFS prediction score with SNP-based polygenic risk scores, which showed an improvement of 16.1–39.8% in cross-ancestry polygenic prediction. We concluded that HFS is a promising strategy for understanding the genetic basis of human complex traits.


