A persistent behavioral state enables sustained predation of humans by mosquitoes
- Laboratory of Neurogenetics and Behavior, The Rockefeller University, United States
- Kavli Neural Systems Institute, United States
- Howard Hughes Medical Institute, United States
Figures
Figure 1 with 1 supplement
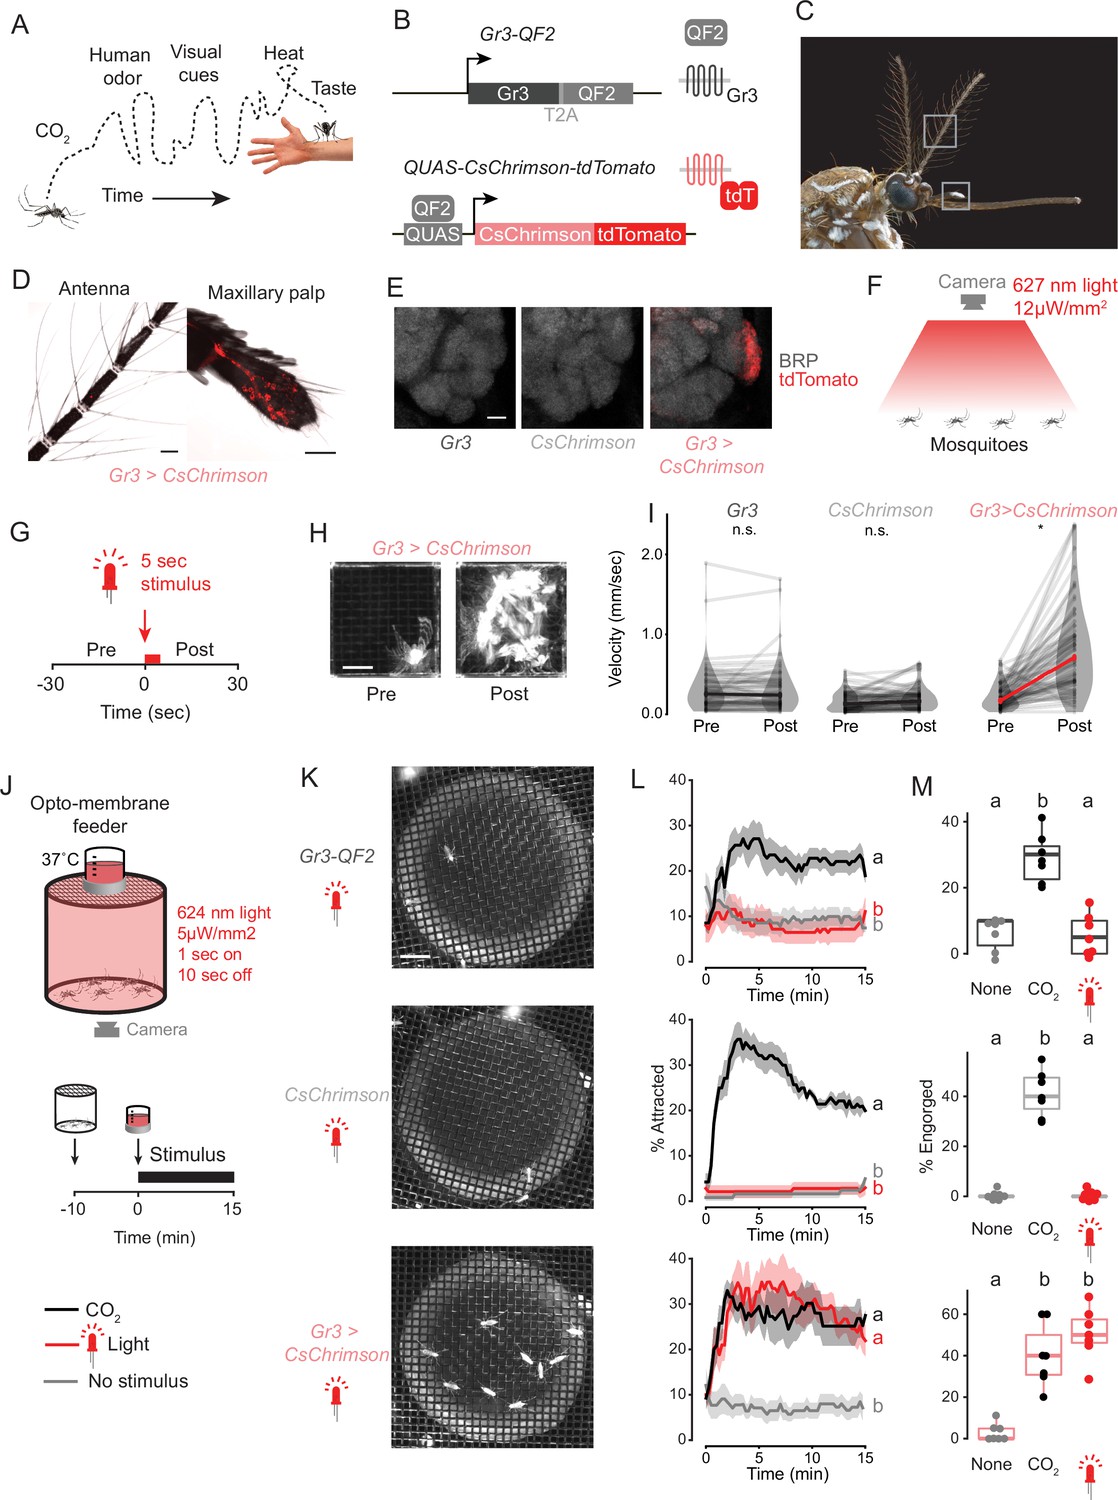
Optogenetic control of mosquito host seeking and blood feeding.
(A) Schematic of human host cues experienced by a host-seeking mosquito over time. (B) Schematic of genetic reagents used for optogenetic activation of CO2-sensitive Gr3 sensory neurons. (C) Female Aedes aegypti, gray boxes indicating antenna (top) and maxillary palp (bottom). Photo: Alex Wild. (D) Intrinsic tdTomato fluorescence of whole mounted Gr3 > CsChrimson female mosquito antenna and maxillary palp. Scale bar: 50 µm. (E) Maximum-intensity projections of confocal Z-stacks of antennal lobes in the right-brain hemisphere of the indicated genotype with immunofluorescent labelling of tdTomato (red) and the synaptic marker BRP (grayscale). Scale bar: 10 µm. (F,G) Diagram (F) and stimulus protocol (G) of optogenetic behavior assay for mosquito movement. (H) Time maximum projection of a single mosquito in the assay in (F) for 30 s pre- (left) and post- (right) stimulus. Scale bar: 0.5 cm. (I) Velocity of individual mosquitoes of the indicated genotypes 30 s pre- and post-stimulus onset. Data are plotted as mean of individual mosquitoes (thin gray lines) with median across individuals indicated with thick black or red line (*p<0.0001, Wilcoxon signed rank test with Holm’s correction for multiple comparison, n.s., not significant, n=70 mosquitoes/genotype). (J) Schematic of opto-membrane feeder (top) and stimulus protocol (bottom). (K) Still images of mosquitoes of the indicated genotype underneath the warm blood meal approximately 7 min after the start of red light stimulation. Scale bar: 1 cm. (L) Occupancy of mosquitoes on warm blood meal in the opto-membrane feeder. Data are plotted as mean (line) ± SEM (shading). Data labelled with different letters are significantly different at the 5 min timepoint (p<0.05, Kruskal-Wallis test followed by Nemenyi post hoc tests; n=6–7 trials per genotype/stimulus combination, 18–21 mosquitoes/trial). (M) Percent of mosquitoes visually scored as engorged at the conclusion of the experiment in (L). Data are plotted as dot-box plots (median: horizontal line, interquartile range: box, 1.5 times interquartile range: whiskers). Data labelled with different letters are significantly different (p<0.05, Kruskal-Wallis test followed by Nemenyi post hoc tests; n=7 trials per genotype/stimulus combination and 18–21 mosquitoes/trial). See also Figure 1—figure supplement 1 and Figure 1—source data 1.
-
Figure 1—source data 1
Optogenetic control of mosquito host seeking and blood feeding.
- https://cdn.elifesciences.org/articles/76663/elife-76663-fig1-data1-v2.xlsx
Figure 1—figure supplement 1
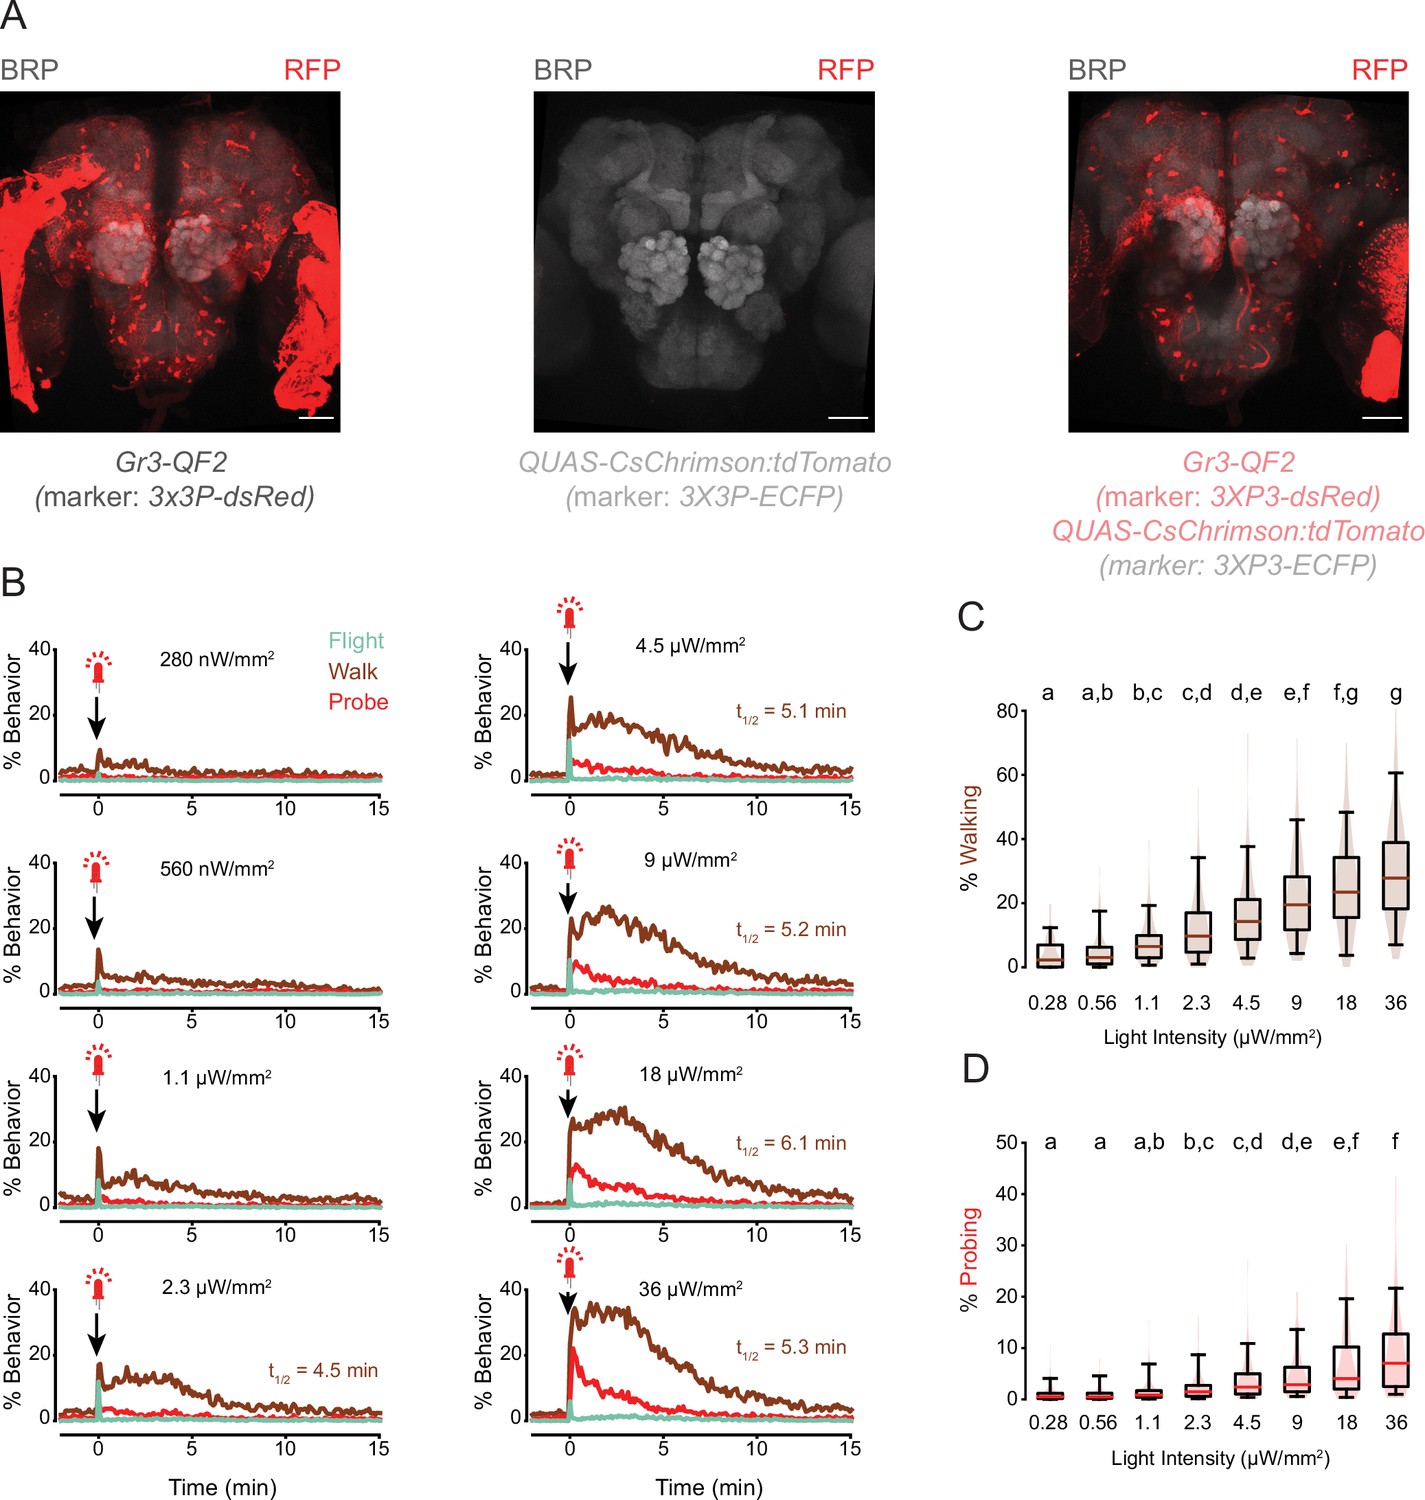
Validation of optogenetic tools.
(A) Maximum-intensity projections of confocal Z-stacks of whole brains of the indicated genotype with immunofluorescent labelling with an anti-RFP antibody that recognizes both dsRed (indicating expression of the 3xP3-dsRed transgene marker) and tdTomato (indicating CsChrimson) in red and the synaptic marker BRP in grayscale. The 3XP3 enhancer expresses extensively in the visual system as well as in scattered cells in the brain. Because of spectral overlap, it is not possible to separate the expression of 3XP3-dsRed and Gr3 > CsChrimson:tdTomato in this preparation. However, previously published work using CD8:GFP as a marker expressed in Gr3-QF2 animals allowed us to establish the specificity of Gr3-QF2 expression to a subpopulation of maxillary palp neurons that project to a single antennal lobe glomerulus (Younger et al., 2022). Note the absence of red fluorescence in the middle panel because this transgene is marked by 3XP3-ECFP. Scale bar: 50 µm. (B) Response of Gr3 > CsChrimson mosquitoes to 5 s stimuli of the indicated light intensities, from 2 min before to 15 min after stimulus onset (n=98, average of 3 stimulus presentations/mosquito). t1/2 indicates the time for walking behavior to return halfway back to baseline. (C,D) Quantification of walking (C) and probing (D) from data in (B) for 5 min after stimulus onset (p<0.05, Friedman test followed by Nemenyi post hoc tests).
Figure 2 with 2 supplements
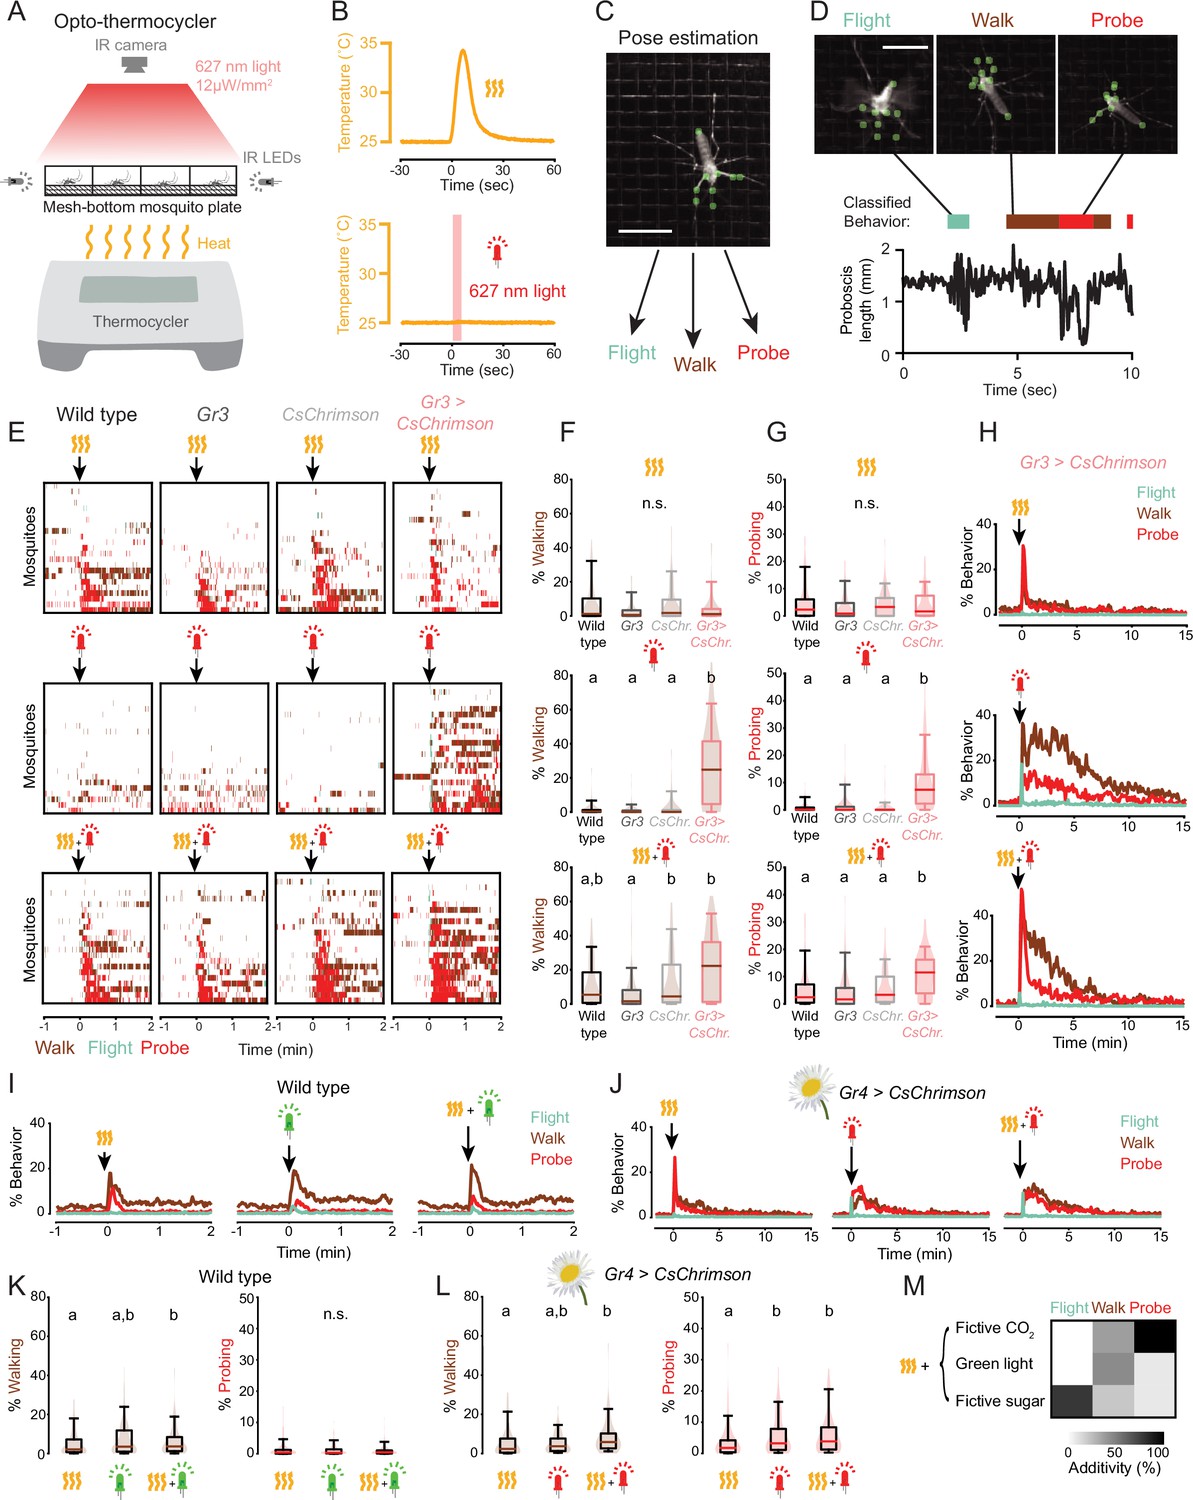
Fictive CO2 induces a persistent behavior state.
(A,B) Schematic of opto-thermocycler assay (A) and stimuli delivered (B). (C) Still image of a mosquito with pose tracking of nine points using Animal Part Tracker. Scale bar: 0.5 cm. (D) Still images of a mosquito exhibiting the indicated classified behaviors (top). Representative plot of proboscis length with classified behavior superimposed (bottom). Scale bar: 0.5 cm. (E) Ethograms of individual mosquitoes of the indicated genotypes. Data show 1 min before and an excerpt of the 2 min after the indicated stimuli from a 20 min experiment. Each row represents data from one mosquito. The experiment comprised a total of n=68–70 mosquitoes/condition. All data were sorted by probing, and every third mosquito (n=22–23) was selected for display here for clarity. (F,G) Quantification of walking (F) and probing (G) behavior exhibited by individual mosquitoes from the experiment in (E) during the 5 min after stimulus onset. Data are plotted as violin-box plots (median: horizontal line, interquartile range: box, 5th and 95th percentiles indicated: whiskers). Data labelled with different letters are significantly different (p<0.05, Kruskal-Wallis test followed by Nemenyi post hoc tests, n.s., not significant, n=68–70 mosquitoes/genotype, 1 stimulus per trial). (H) Plot of percent individual Gr3 > CsChrimson mosquitoes exhibiting the indicated behavior from 2 min before to 15 min after stimulus onset. Data from experiment in (E). (I,J) Plot of percent individual wild-type (I) and Gr4 > CsChrimson(J) mosquitoes exhibiting the indicated behavior from 1 min before to 2 min after stimulus onset (I) or 2 min before to 15 min after stimulus onset (J) excerpted from a 20 min experiment (I: n=140 mosquitoes, average of 2 stimulus presentations/mosquito; J: n=69 mosquitoes, average of 3 stimulus presentations/mosquito). Flower image used for Gr4 > CsChrimson indicates that plant nectar is a sugar source. (K,L) Quantification of (I) and (J) for 5 min after stimulus onset. Data are plotted as violin-box plots (median: horizontal line, interquartile range: box, 5th and 95th percentiles: whiskers). Distribution represents individual mosquitoes, averaged over multiple stimulus presentations. Data labelled with different letters are significantly different (p<0.05, Friedman test followed by Nemenyi post hoc tests, n.s., not significant). (M) Median additivity of heat and the indicated stimuli presented simultaneously. Additivity of 100% corresponds to the case when combined stimuli equal the sum of responses to individual stimuli. Data from E–L. See also Figure 2—figure supplement 1, Figure 2—figure supplement 2, and Figure 2—source data 1.
-
Figure 2—source data 1
Fictive CO2 induces a persistent behavior state.
- https://cdn.elifesciences.org/articles/76663/elife-76663-fig2-data1-v2.xlsx
Figure 2—figure supplement 1
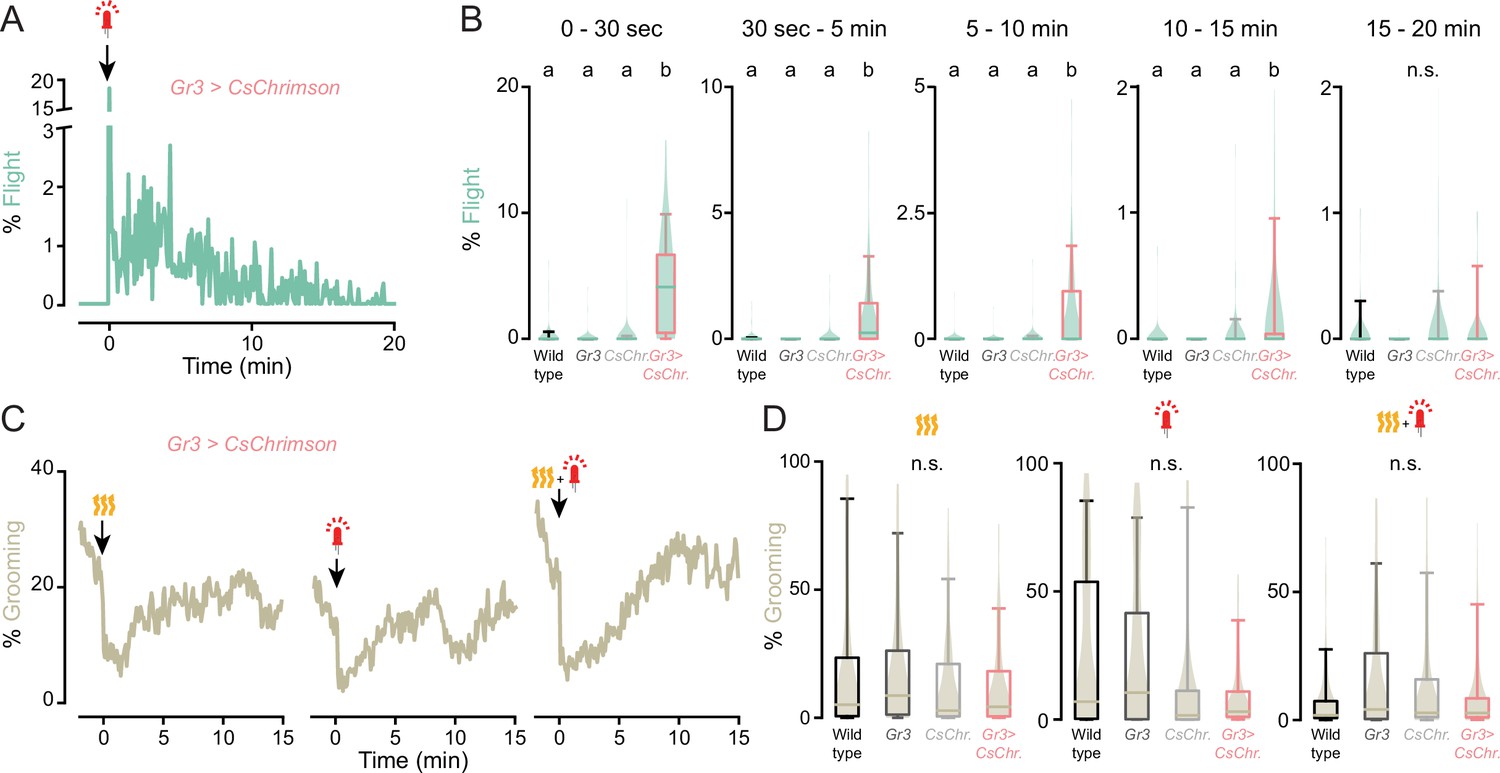
Fictive CO2 triggers flight events for 15 min.
(A,C) Percent indicated behavior of Gr3 > CsChrimson females from 2 min before to 15 min after stimulus onset in response to the indicated stimuli. Data from Figure 2E–H. (B,D) Quantification of the behavior in (A,C) along with data collected from the additional indicated genotypes. Data from Figure 2E–H. Data are plotted as violin-box plots (median: horizontal line, interquartile range: box, 5th and 95th percentiles: whiskers). Data labelled with different letters are significantly different (p<0.05, Kruskal-Wallis test followed by Nemenyi post hoc tests. n.s., not significant, n=68–70 mosquitoes).
Figure 2—figure supplement 2
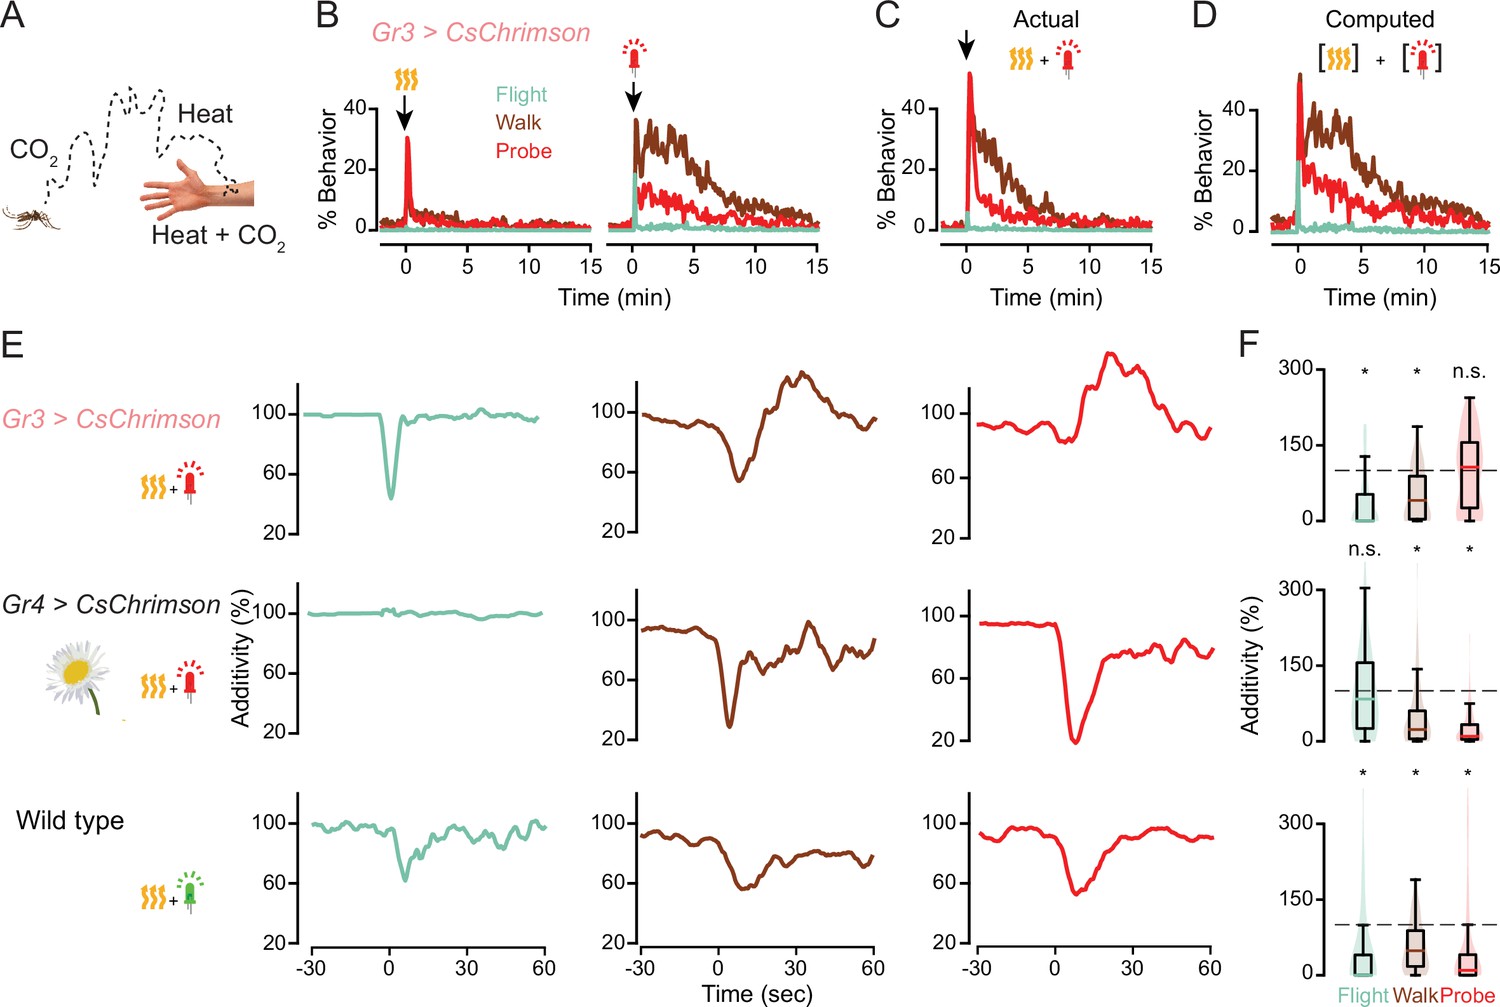
Host cues are integrated with different computations than non-host cues.
(A) Mosquitoes sense host cues separately and simultaneously at different distances from the host. (B–D) Responses to individual (B) or combined (C) stimuli or a computed sum of individual stimuli (D). Plots in (B,C) are reprinted from Figure 2H for comparison with (D). (E) Differences between calculated and actual responses for the indicated genotypes and stimuli from 30 s before to 1 min after stimulus onset, smoothed using a box filter of radius 2.25 s. n=70 for Gr3 > CsChrimson, n=69 for Gr4 > CsChrimson, n=140 for wild type. (F) Quantification of (E) for the first 15 s after stimulus onset. Data are plotted as violin-box plots (median: horizontal line, interquartile range: box, 5th and 95th percentiles: whiskers) (*p<0.0001, sign test using Holm’s correction for multiple comparisons, n.s., not significant).
Figure 3 with 1 supplement
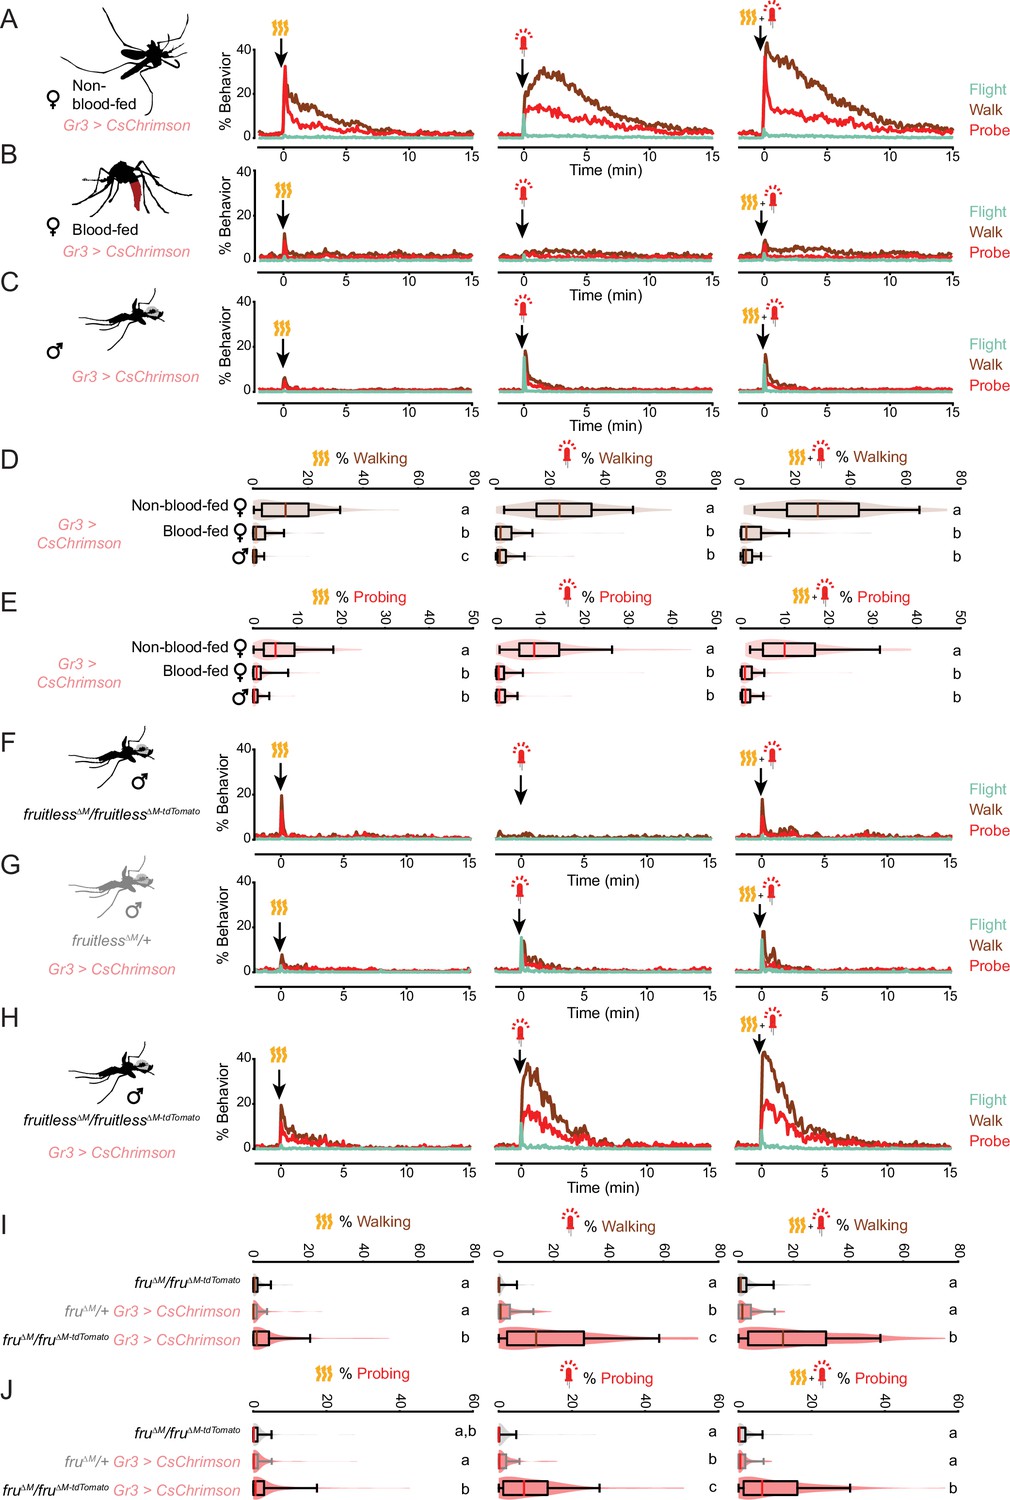
The persistent state is specific to host seeking.
(A–C) Response of non-blood-fed female (A), blood-fed female (B), and male (C) Gr3 > CsChrimson mosquitoes to the indicated stimuli, plotting each behavior from 2 min before to 15 min after stimulus onset (n=98/group, average of 3 stimulus presentations/mosquito). (D,E) Quantification of walking (D) and probing (E) from data in (A–C) for 5 min after stimulus onset. (F–H) The behavioral response of males of the indicated genotype to the indicated stimuli, plotting each behavior from 2 min before to 15 min after stimulus onset (n=97–98/genotype, average of 3 stimulus presentations/mosquito). (I,J) Quantification of walking (I) and probing (J) from data in (F–H) for 5 min after stimulus onset. In (D,E) and (I,J), data are plotted as violin-box plots (median: horizontal line, interquartile range: box, 5th and 95th percentiles: whiskers). The distribution represents individual mosquitoes, averaged over multiple stimulus presentations. Data labelled with different letters are significantly different (p<0.05, Kruskal-Wallis test followed by Nemenyi post hoc tests, n.s., not significant). See also Figure 3—figure supplement 1 and Figure 3—source data 1.
-
Figure 3—source data 1
The persistent state is specific to host seeking.
- https://cdn.elifesciences.org/articles/76663/elife-76663-fig3-data1-v2.xlsx
Figure 3—figure supplement 1

Blood-fed mosquitoes respond to fictive sugar.
(A) Response of blood-fed female Gr4 > CsChrimson mosquitoes to the indicated stimuli, plotting each behavior from 2 min before to 15 min after stimulus onset (n=69/group, average of 3 stimulus presentations/mosquito). (B–E) Quantification of change in probing from 1 min prior to stimulus onset to 1 min after. Data in (B) are from Figure 2J, data in (C) are from (A), and data in (D–E) are from Figure 3A and B. Data are plotted as violin-box plots (median: horizontal line, interquartile range: box, 5th and 95th percentiles: whiskers) (*p<0.05, Wilcoxon one sample test with Holm’s correction for multiple comparisons).
Figure 4 with 2 supplements
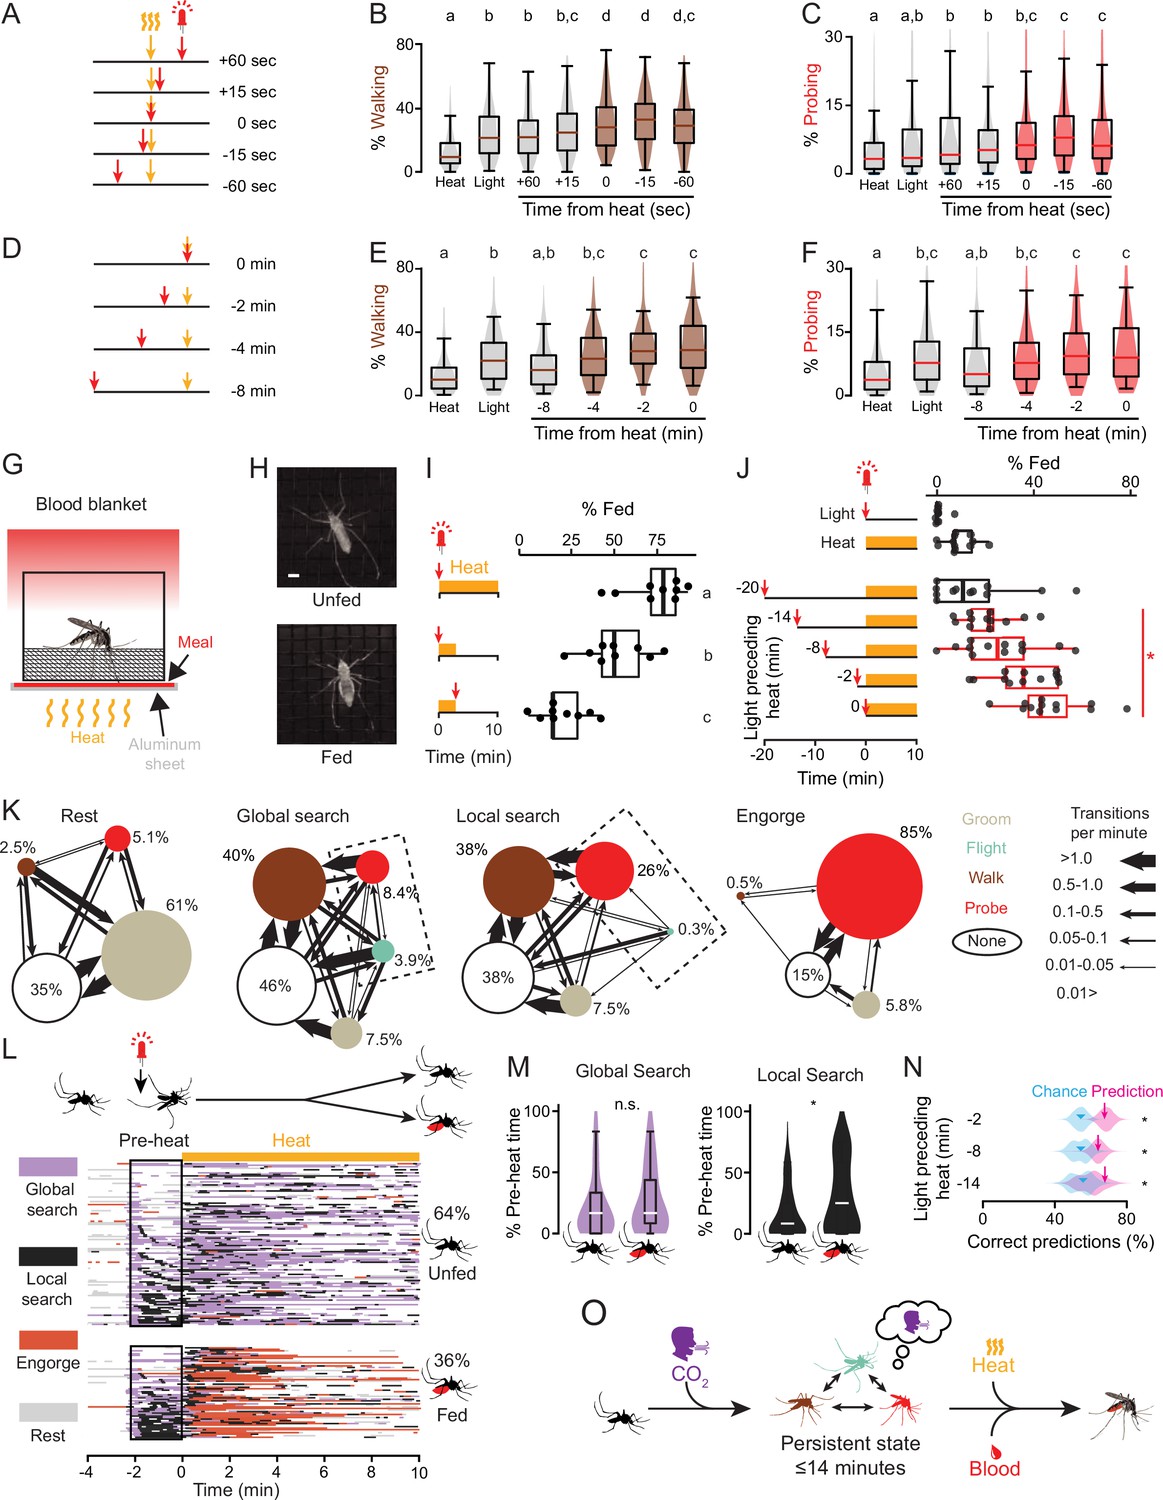
The persistent state integrates host cues and decision making in time.
(A–F) Schematic of stimuli presentation (A,D) and quantification of walking (B,E) and probing (C,E) in the 5 min after the first stimulus onset (n=111–112 mosquitoes, 2 stimulus presentations/mosquito). In (B,C,E,and F), data are displayed as violin-box plots (median: horizontal line, interquartile range: box, 5th and 95th percentiles: whiskers). Data labelled with different letters are significantly different (p<0.05, Friedman test followed by Nemenyi post hoc tests). Data that are significantly different from heat or light are shaded in brown (B,E) or red (C,F). (G) Schematic of blood blanket assay which uses a blood meal mimic. (H) Still images of unfed (top) and fed (bottom) mosquitoes. Scale bar: 1 mm. (I) Percent mosquitoes engorged in response to the indicated stimuli in the blood blanket assay (n=9 trials/stimulus, 14 mosquitoes/trial). Data labelled with different letters are significantly different (p<0.05, ANOVA followed by Tukey’s post hoc test). (J) Percent mosquitoes engorged in response to the indicated cues in the blood blanket assay (14 mosquitoes/trial n=11 trials/stimulus). Data in (I,J) are displayed as dot-box plots (median: horizontal line, interquartile range: box, 1.5 times interquartile range: whiskers). Dot-box plots in (J) with a red border signify data where combined light and heat stimuli are greater than the sum of individual stimuli (*p<0.05, Student’s t-test, after adjustment for multiple comparisons using Holm’s method). (K) Transition ethograms for each of the four states indicating the proportion of each behavior and the rate of transitions between them, with dashed rectangle highlighting difference between global and local search. (L) Inferred states of 168 individual mosquitoes from the 2 min pre-heat stimulus from experiment in (J), separated into those that were visually scored as unfed (top, n=108) or fed (bottom, n=60) at the end of the experiment. Each row represents data from one mosquito and data are sorted according to the amount of local search during the pre-heat period. White indicates none of the four states were inferred (i.e. the mosquito was primarily motionless). (M) Quantification of the percent of time mosquitoes spent in the indicated state during the 2 min pre-heat period. Data are plotted as violin-box plots (median: horizontal line, interquartile range: box, 5th and 95th percentiles: whiskers (*p<0.01), Mann-Whitney U-test, n.s., not significant). (N) Performance of a classifier trained on the proportion of each behavior in pre-heat period and used to predict feeding (magenta arrow) along with 10,000 bootstrapped classifiers (magenta violin plot). Chance value (cyan arrowhead) indicates the median performance of model on 10,000 shuffles (cyan violin plot) of the feeding data in (J). (n=166–168 mosquitoes/stimulus, p=2e-4, 0.0246, 0.0123 for 2, 8, and 14 min pre-heat periods, respectively, bootstrapped z-test.) (O) Summary of the persistent internal state for host-seeking behavior. Color of the mosquito silhouettes indicates the behavior depicted using the colors in K. See also Figure 4—figure supplement 1, Figure 4—figure supplement 2, and Figure 4—source data 1.
-
Figure 4—source data 1
The persistent state integrates host cues and decision making in time.
- https://cdn.elifesciences.org/articles/76663/elife-76663-fig4-data1-v2.xlsx
Figure 4—figure supplement 1
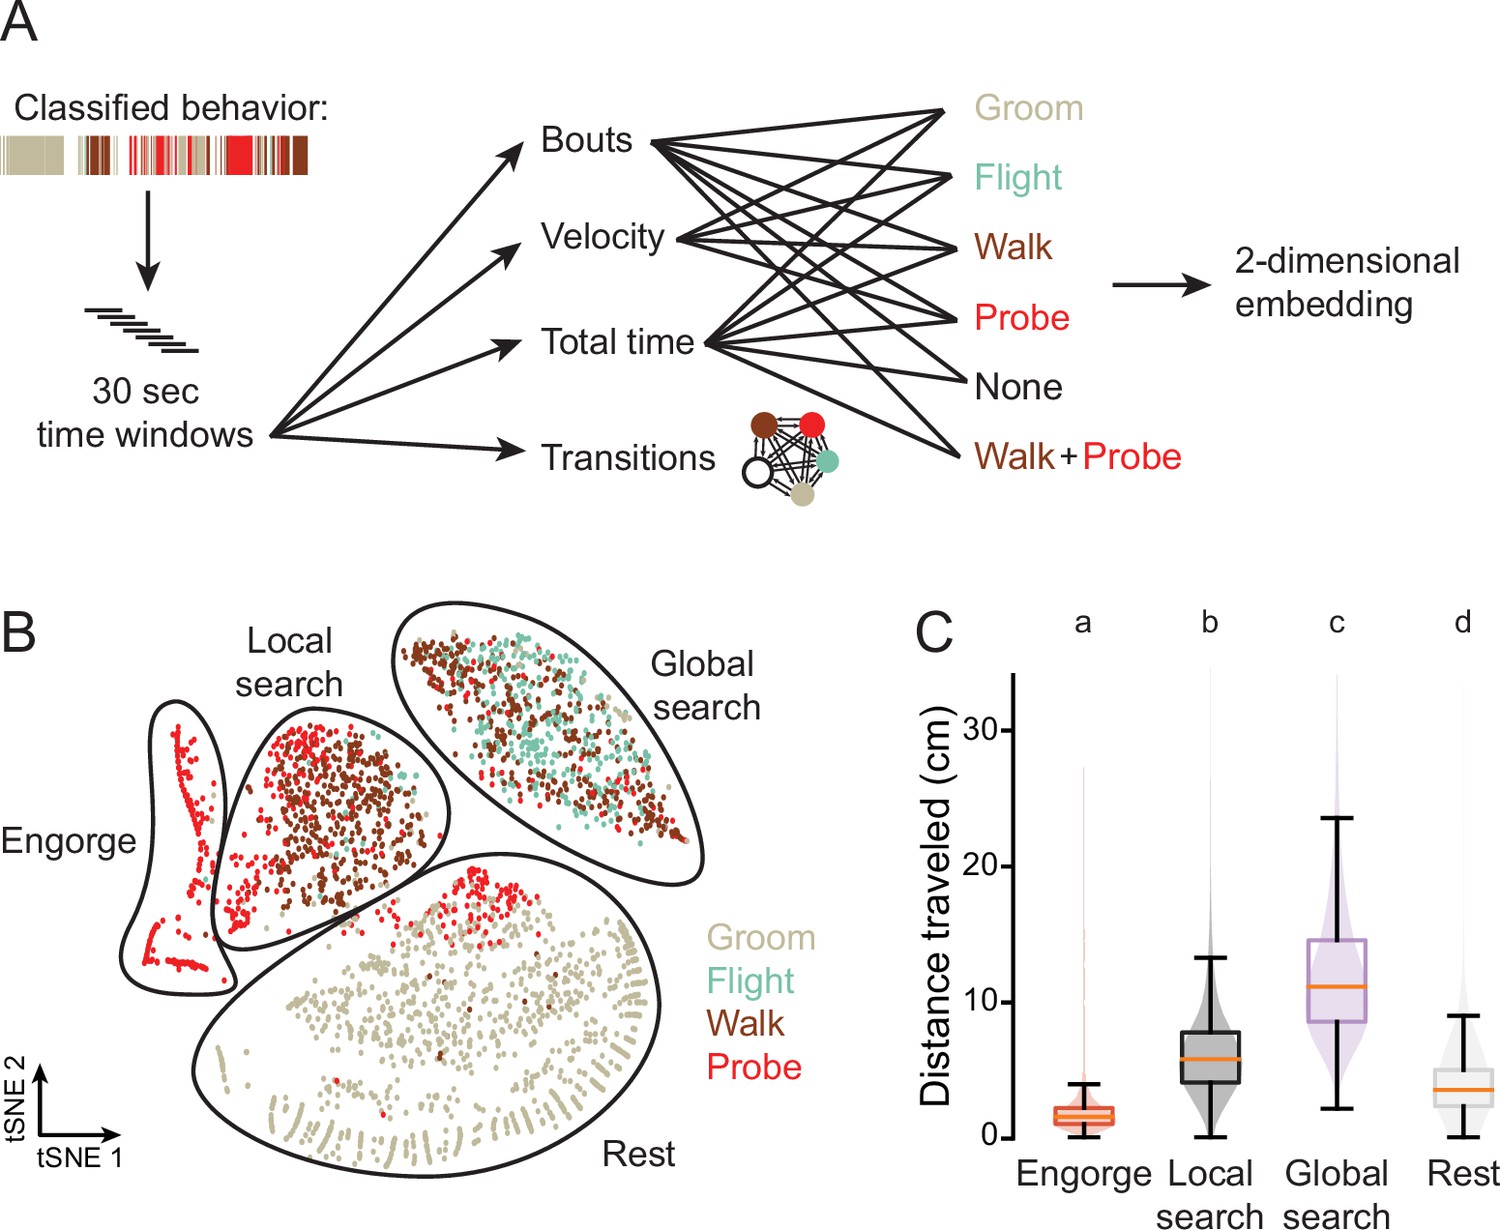
Inference of internal state from behavior.
(A) Schematic of analysis. Classified behavior reflects the output of Animal Part Tracker (APT) followed by Janelia Automatic Animal Behavior Annotator (JAABA) behavior classifiers. (B) t-Stochastic neighbor embedding (tSNE) for 30 s time windows spanning 4 min prior to the light stimulus to 10 min after heat onset for individual mosquitoes from Figure 4J. Points are colored by strong enrichment of the corresponding behavior. State categories were bounded with a black line by visual inspection of the tSNE plot, graphing the behavior characteristics of each cluster, and comparing with video of the mosquitoes in each state. Shown is a random subset of 3000 time windows from 106,076 total windows from all seven stimulus types, n=1162 mosquitoes. (C) Total distance travelled over the course of 30 s time windows for each behavior state with the following number windows from each state: engorge, n=5634; local search, n=11,124; global search, n=15,466; rest, n=9891. Time windows were taken from 4 min before the light stimulus to 10 min after heat onset. Data are plotted as violin-box plots (median: horizontal line, interquartile range: box, 5th and 95th percentiles: whiskers). Data labelled with different letters are significantly different (p<0.0001, Kruskal-Wallis test followed by Nemenyi post hoc tests).
Figure 4—figure supplement 2
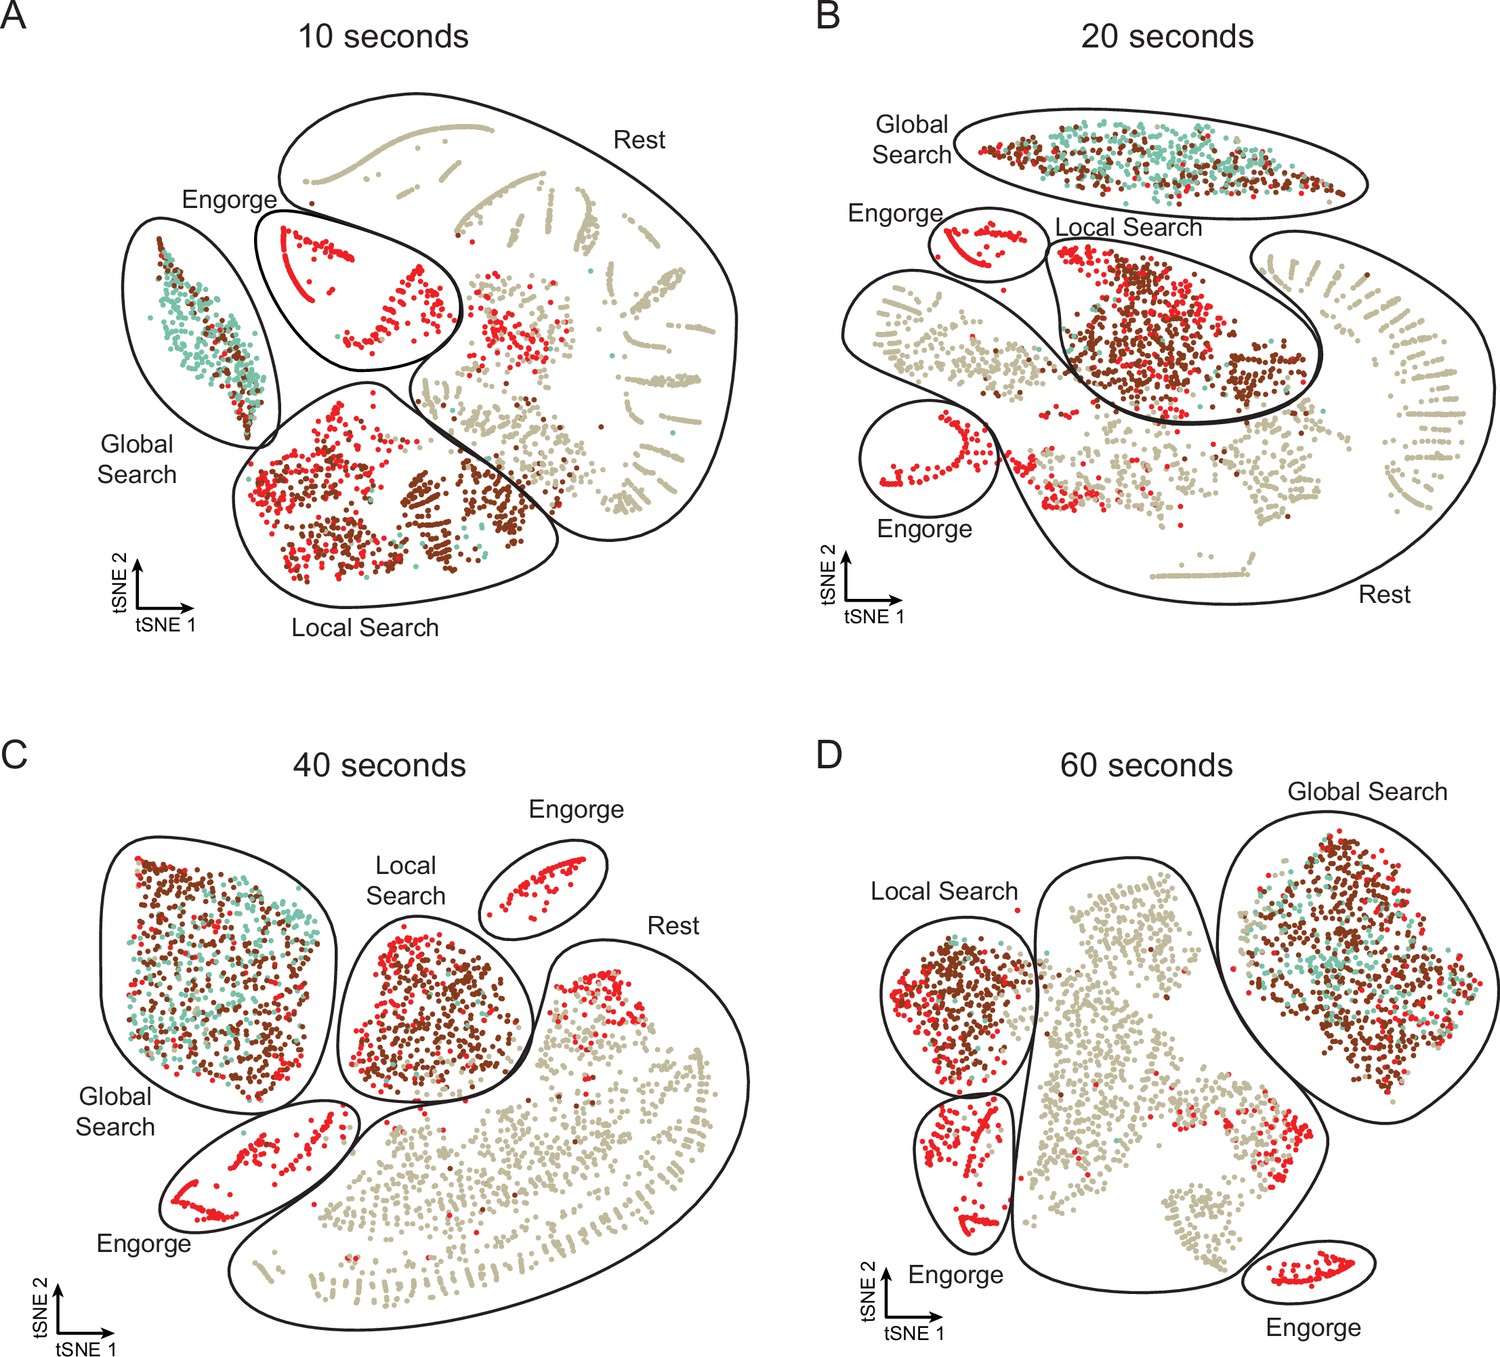
Mosquito states are consistent across window duration.
(A–D) t-Stochastic neighbor embedding (tSNE) for time windows of the indicated duration for individual mosquitoes from Figure 4J. Points are colored by strong enrichment of the corresponding behavior. State categories were bounded with a black line by visual inspection of the tSNE plot. Shown is a random subset of 3000 time windows from 103,658 (A), 105,387 (B), 106,044 (C), and 105,287 (D) total windows from all seven stimulus types, n=1162 mosquitoes.
Videos
Video 1
Mosquito response to fictive CO2.
Shown is video of the opto-thermocycler assay of female Gr3 > CsChrimson mosquitoes responding to a 5 s pulse of red light. Points tracked on the body of the mosquito are indicated by white semi-transparent dots and behaviors are indicated with text. Stimuli are indicated in the upper left corner.
Tables
Key resources table
| Reagent type (species) or resource | Designation | Source or reference | Identifiers | Additional information |
|---|---|---|---|---|
| Recombinant DNA reagent | QUAS-CsChrimson-tdTomato (plasmid) | This study | Addgene RRID:175548 | Described in Materials and methods section ‘Creation of CsChrimson mosquitoes for optogenetics’; available from Addgene |
| Strain, strain background (Aedes aegypti) | Liverpool IB12 | BEI resources | MRA-735 | |
| Genetic reagent (Aedes aegypti) | QUAS-CsChrimson-tdTomato | This study | Strain available on request from Vosshall or Sorrells labs | |
| Genetic reagent (Aedes aegypti) | Gr3-QF2 | doi:https://doi.org/10.1101/2020.11.07.368720 | ||
| Genetic reagent (Aedes aegypti) | Gr4-QF2 | PMID:33049200 | ||
| Antibody | Mouse monoclonal anti-Brp antibody | DSHB | Cat# nc82, RRID:AB_23 14866 | Immunofluorescence 1:10,000 |
| Antibody | Rabbit polyclonal anti-RFP antibody | Rockland | Cat# 600401-379, RRID:AB_22 09751 | Immunofluorescence 1:1000 |
| Antibody | Goat polyclonal anti-mouse Alexa Fluor 647 | Thermo Fisher | Cat# A21235, RRID:AB_25 35804 | Immunofluorescence 1:500 |
| Antibody | Goat polyclonal anti-rabbit Alexa Fluor 555 | Thermo Fisher | Cat# A32732, RRID:AB_26 33281 | Immunofluorescence 1:500 |
| Software, algorithm | Ctrax | PMID:19412169 | ||
| Software, algorithm | JAABA | PMID:23202433 | Downloaded July 15, 2020 | |
| Software, algorithm | Animal Part Tracker (APT) | https://github.com/kristinbranson/APT | Downloaded July 9, 2020 |
Additional files
Download links
A two-part list of links to download the article, or parts of the article, in various formats.
Downloads (link to download the article as PDF)
Open citations (links to open the citations from this article in various online reference manager services)
Cite this article (links to download the citations from this article in formats compatible with various reference manager tools)
A persistent behavioral state enables sustained predation of humans by mosquitoes
eLife 11:e76663.
https://doi.org/10.7554/eLife.76663


