Ecosystem Services: Putting interactions on the map
A method called functional connectivity mapping helps model some of the complex interactions between multiple ecosystem services.
- Programa de Doctorado en Ciencias Ambientales y Sostenibilidad, Universidad de Bogotá Jorge Tadeo Lozano, Colombia
- Facultad de Estudios Ambientales y Rurales, Pontificia Universidad Javeriana, Colombia
Ecosystem services are defined as “the benefits that humans derive from nature” (MEA, 2005); they link biophysical reality with human well-being. More generally, they can be thought of as the resources and conditions offered by ecosystems that improve human life, ranging from water supplies, food, and materials to recreation, enjoyment of an area, or opportunities to exercise. Human intervention and management can affect the supply of these ecosystem services, for example, by ensuring the supply lasts for a long time, or by consuming it quickly and unsustainably.
Now, imagine a hypothetical landscape with large and small forests, rivers, streams, crop areas, livestock areas, towns, and areas of secondary vegetation (vegetation that grows after disturbances, both human and nature inflicted, such as a flood or a forest being cut down). The land in this area can supply several ecosystem services at different levels simultaneously. To manage this region sustainably, it is important to know how the different ecosystems services interact with each other to determine the best ways to use the land.
Previous work (e.g., Agudelo et al., 2020) recognizes that the reality of ecosystem services is complex, and there may even be a lack of consensus on what constitutes an ecosystem service. However, the connections or interactions between ecosystem services seem clearer, and can be divided into four groups: trade-offs (two ecosystem services show opposing trends), synergy (one ecosystem service increases the benefits of another), bundling or clustering (ecosystem services that appear in regular patterns), and flow (the interaction that describes how supplies flow from the ecosystem to its beneficiaries; Bennett et al., 2009; Hughes et al., 2007; Raudsepp-Hearne et al., 2010; Lee and Lautenbach, 2016).
Modelling and mapping the interactions among multiple ecosystem services should improve the understanding of the benefits that ecosystems can provide to humans. Unfortunately, it is not currently possible to characterize the interactions between ecosystem services in enough detail for decision-makers to make changes to ecosystems with confidence. On the other hand, while some tools have been developed to support decision-making about ecosystem services in specific areas, most of these approaches lack the complexity required to fully answer the questions of when, where, and how nature contributes to ecosystem services (Akçakaya et al., 2016).
Landscape connectivity theory attempts to describe “the degree to which the landscape facilitates movement among resource patches” (Taylor et al., 1993). Now, in eLife, Rachel Field and Lael Parrott, of the University of British Columbia, report an approach to better characterize the interactions between ecosystem services that builds on landscape connectivity theory and existing ecosystem services mapping and modelling (Field and Parrott, 2022). Their methods allow scientists to move away from a static vision of ecosystem services mapping, and measure trade-offs and flow.
The novelty of Field and Parrott’s approach relies on it being replicable in different landscape types with different land-uses by exploiting existing information on the supply of individual ecosystem services. The new method also incorporates landscape connectivity theory, allowing a closer analysis of how resources move between ecosystem services, which cannot be addressed with traditional mapping methods. The characterization of flows specifically, is deepened by going beyond the notion of ecosystem services supply areas, which are static, allowing the identification of corridors through which ecosystem services supplies move, and identifying which ecosystem services depend on each other (Figure 1).
Figure 1
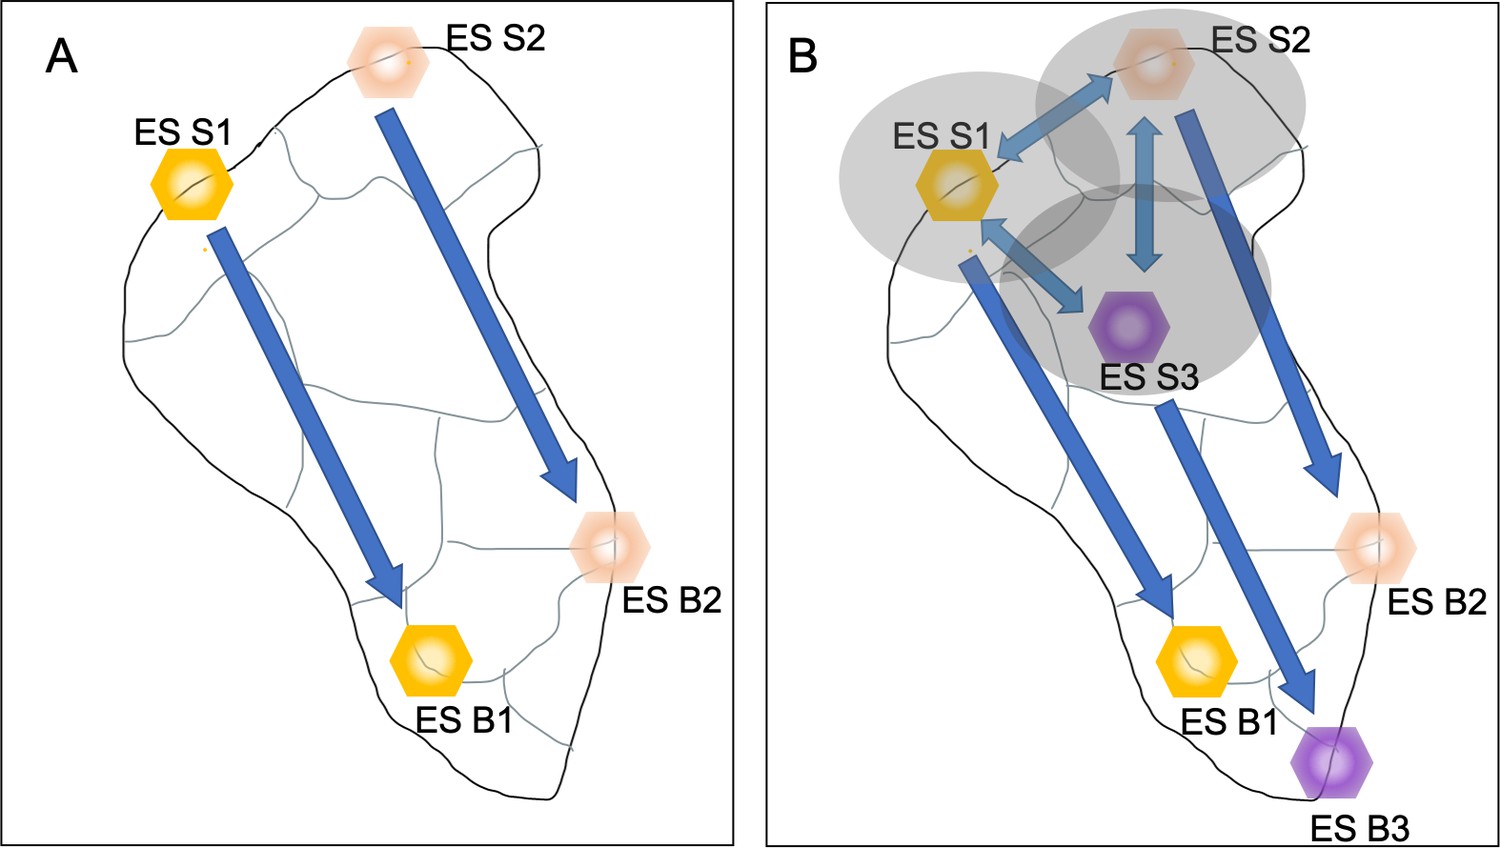
Classical and new approaches to visualizing the interactions between ecosystem services.
Different ecosystem services (ES S1, yellow hexagon; ES S2, red hexagon; ES S3, purple hexagon) can produce different social benefits (ES B1, yellow hexagon; ES B2, red hexagon; ES B3, purple hexagon). (A) The classical approach to mapping ecosystem services provides a static vision of the landscape. Each ecosystem service is in a fixed position and is only connected to the benefit it produces (arrow with one arrowhead). There are no interactions between the services, and therefore no view of the potential effects that changing how one ecosystem service is exploited could have on other ecosystem services. (B) The multifunctional connectivity approach taken by Field and Parrott considers interactions between the different ecosystem services, either in how they physically overlap (yellow, red and purple shaded ellipses) or in how they interact to produce benefits (double headed arrows). This provides a more holistic view of ecosystem services and their benefits.
By providing spatial information on the connectivity between ecosystem services, Field and Parrott’s method enables local and regional environmental planning and management that takes full consideration of the complex and multiscale interactions between ecological processes, land use, land cover, and ecosystem service supply.
Despite these significant advances, future research into mapping ecosystem services still has challenges to face. First, while Field and Parrott incorporate three ecosystem services into their analysis, this is not enough to model real ecosystems, which usually have more than three services. Therefore, it will important to develop methods to incorporate the connectivity of multiple ecosystem services. Second, it will be necessary to overcome the static vision of ecosystem services supply areas, moving on to a more dynamic vision that takes the connections between different ecosystem services into account. Further, Field and Parrott’s approach relies heavily on existing information, but how can their methods be applied to scenarios in which the spatial information about ecosystem services is scarce? Finally, the new methodology allows scientists to measure flows and trade-offs, but it will be important to also measure bundles/clusters and synergies to get a full picture of ecosystem services supply.
References
-
Modeling interactions among multiple ecosystem services a critical reviewEcological Modelling 429:109103.https://doi.org/10.1016/j.ecolmodel.2020.109103
-
BookImproving the rigour and usefulness of scenarios and models through ongoing evaluation and refinementIn: Ferrier S, Ninan KN, Leadley P, Alkemade R, Acosta LA, Akçakaya HR, editors. IPBES, 2016. Methodological Assessment of Scenarios and Models of Biodiversity and Ecosystem Services. Secretariat of the Intergovernmental Science-Policy Platform on Biodiversity and Ecosystem Services. IPBES. pp. 323–369.
-
Understanding relationships among multiple ecosystem servicesEcology Letters 12:1394–1404.https://doi.org/10.1111/j.1461-0248.2009.01387.x
-
A quantitative review of relationships between ecosystem servicesEcological Indicators 66:340–351.https://doi.org/10.1016/j.ecolind.2016.02.004
-
Connectivity is a vital element of landscape structureOikos (Copenhagen, Denmark) 68:571.https://doi.org/10.2307/3544927
Article and author information
Author details
César Augusto Ruiz Agudelo

Ángela María Cortes Gómez
Publication history
Copyright
© 2022, Augusto Ruiz Agudelo and Cortes Gómez
This article is distributed under the terms of the Creative Commons Attribution License, which permits unrestricted use and redistribution provided that the original author and source are credited.
Metrics
-
- 593
- views
-
- 57
- downloads
-
- 0
- citations
Views, downloads and citations are aggregated across all versions of this paper published by eLife.
Download links
A two-part list of links to download the article, or parts of the article, in various formats.
Downloads (link to download the article as PDF)
Open citations (links to open the citations from this article in various online reference manager services)
Cite this article (links to download the citations from this article in formats compatible with various reference manager tools)
Ecosystem Services: Putting interactions on the map
eLife 11:e76801.
https://doi.org/10.7554/eLife.76801


