Cryo-EM structure of the human somatostatin receptor 2 complex with its agonist somatostatin delineates the ligand-binding specificity
- Department of Biochemistry, College of Life Science and Biotechnology, Yonsei University, Republic of Korea
- Department of Biological Sciences, Korea Advanced Institute of Science and Technology, Republic of Korea
- PCG-Biotech, Ltd., 508 KBIZ DMC Tower, Sangam-Ro, Republic of Korea
- Drug Design Laboratory, Graduate School of Medical Life Science, Yokohama City University, Japan
- Department of Chemistry, Seoul National University, Republic of Korea
Figures
Figure 1 with 5 supplements
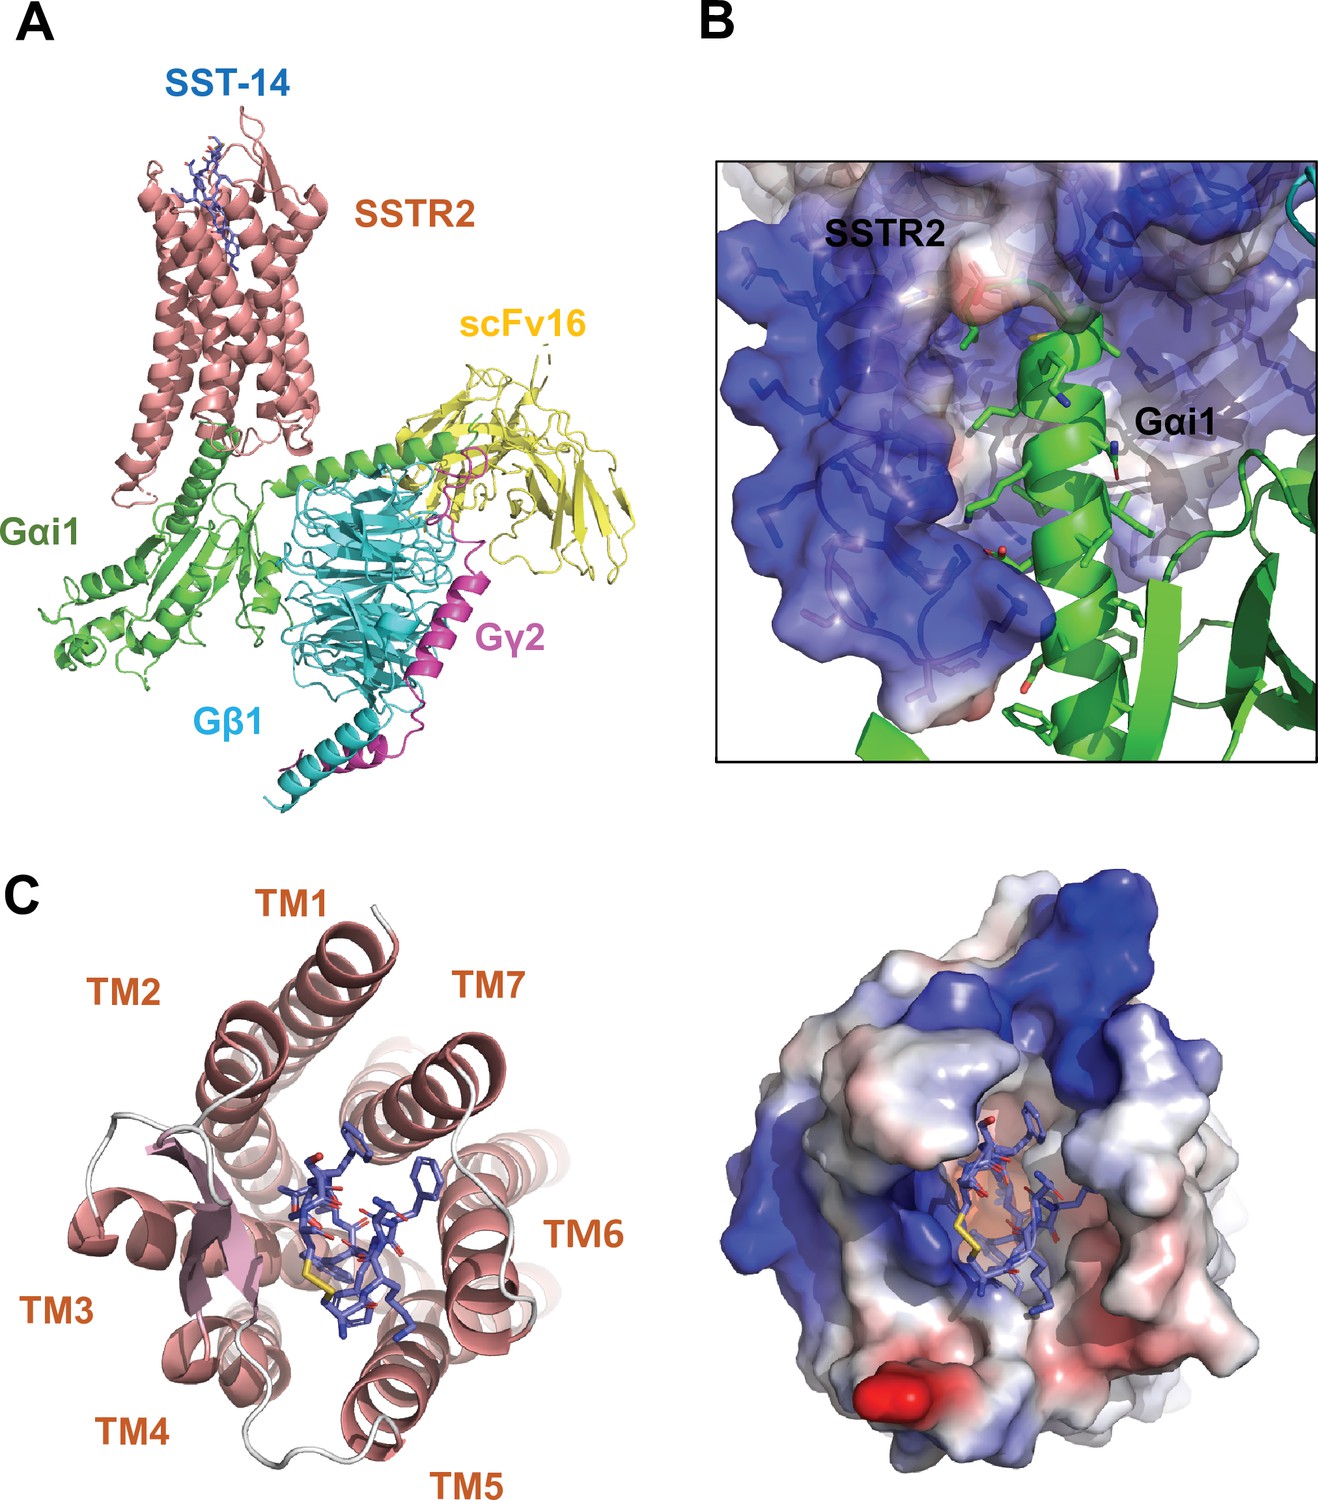
Cryo-EM structure of somatostatin receptor 2 (SSTR2) G-protein complex with SST-14.
(A) The atomic model of the SSTR2 complex is shown in a ribbon model. SSTR2, Gαi1, Gβ1, Gγ2, and scFv16 are shown in a ribbon diagram and colored in salmon, green, cyan, magenta, and yellow, respectively. The bound SST-14 cyclic peptide is shown in a ball-and-stick model and colored in navy blue. (B) The C-terminal of Gαi1 is inserted in the pocket formed by TM5–7 of SSTR2 forming hydrophobic interactions. (C) SST-14 (shown in a ball-and-stick) is bound to the pocket formed by seven TMs of SSTR2 (colored in salmon) at the extracellular side (left panel). SSTR2 is shown in an electrostatic surface representation (right panel).
Figure 1—figure supplement 1
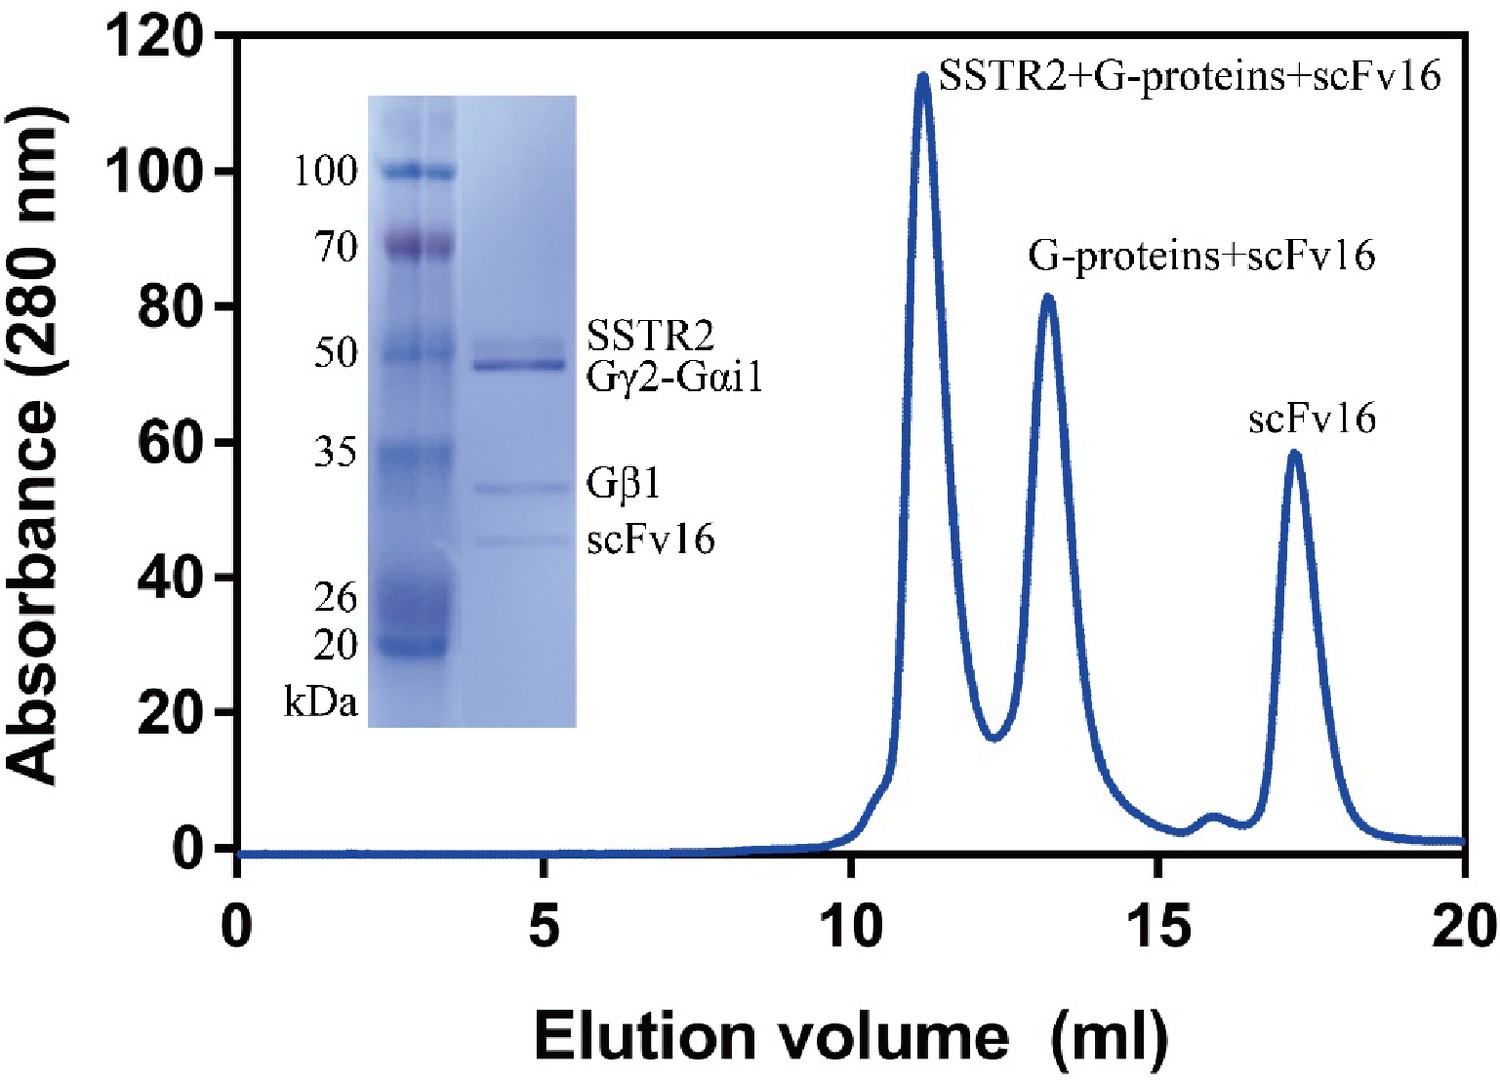
Purification of recombinant human somatostatin receptor 2 (SSTR2)-Gαi1/Gβ1γ2-scFv16 complex.
After injecting the complex sample into a size exclusion chromatography column, three peaks appeared. The complete complex of SSTR2, heterotrimeric Gαi1/Gβ1γ2, and scFv16 was eluted at the first peak around 11.25 mL (shown in an SDS-PAGE).
-
Figure 1—figure supplement 1—source data 1
An uncropped gel for the purification.
- https://cdn.elifesciences.org/articles/76823/elife-76823-fig1-figsupp1-data1-v2.zip
Figure 1—figure supplement 2
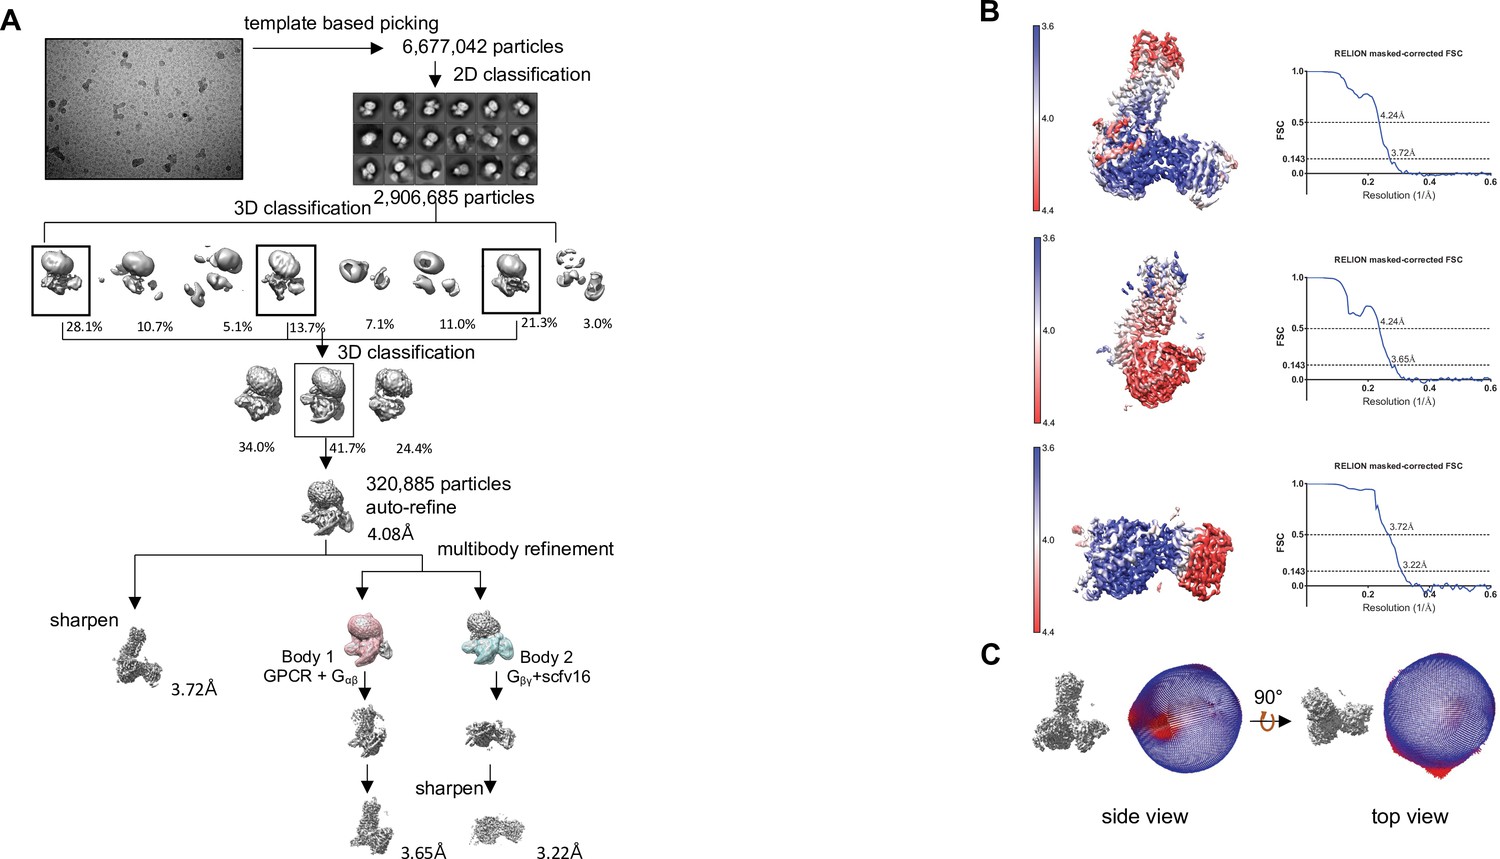
Cryo-EM processing.
(A) The collected data was processed using Relion 3.1. Through 2D and 3D classification, final 320,885 particles were selected for reconstruction. After sharpening, the resolution of somatostatin receptor 2 (SSTR2) complex was determined at 3.72 Å. (B) FSC curves of Body 1 and Body 2 as well as complete complex of SSTR2 were obtained. SSTR2 of Body 1 showed better resolution than SSTR2 of complete complex, and G-proteins of Body2 showed better resolution than G-proteins of complete complex. (C) Euler angle distribution of the particles for the 3D reconstruction.
Figure 1—figure supplement 3
Cryo-EM structure of somatostatin receptor 2 (SSTR2) complex.
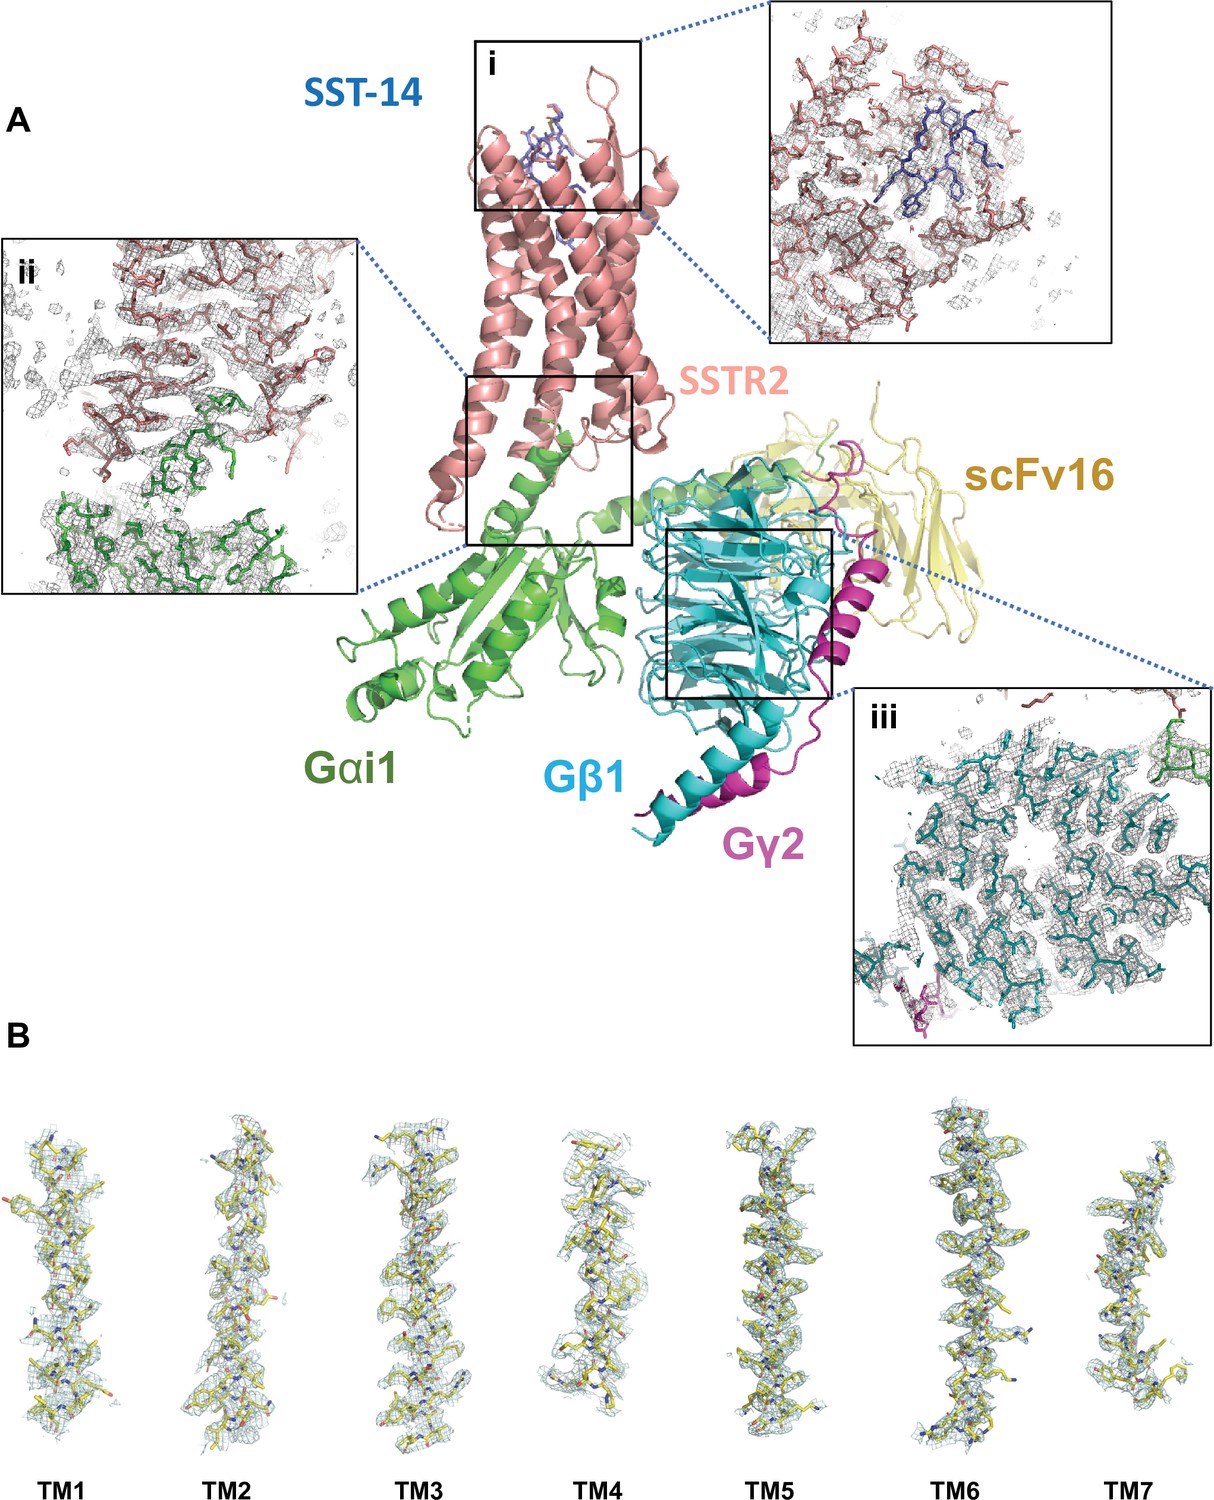
(A) The cryo-EM maps of SSTR2 complex at the ligand-binding pocket (i), the interface between SSTR2 and G-proteins (ii) and the G-protein (Gβ1) (iii). (B) The atomic models of the seven transmembrane helices (TM1: 43–69 a.a., TM2: 77–105 a.a., TM3: 111–145 a.a., TM4: 156–180 a.a., TM5: 203–237 a.a., TM6: 245–281 a.a., and TM7: 288–315 a.a.) are superimposed on the cryo-EM map.
Figure 1—figure supplement 4
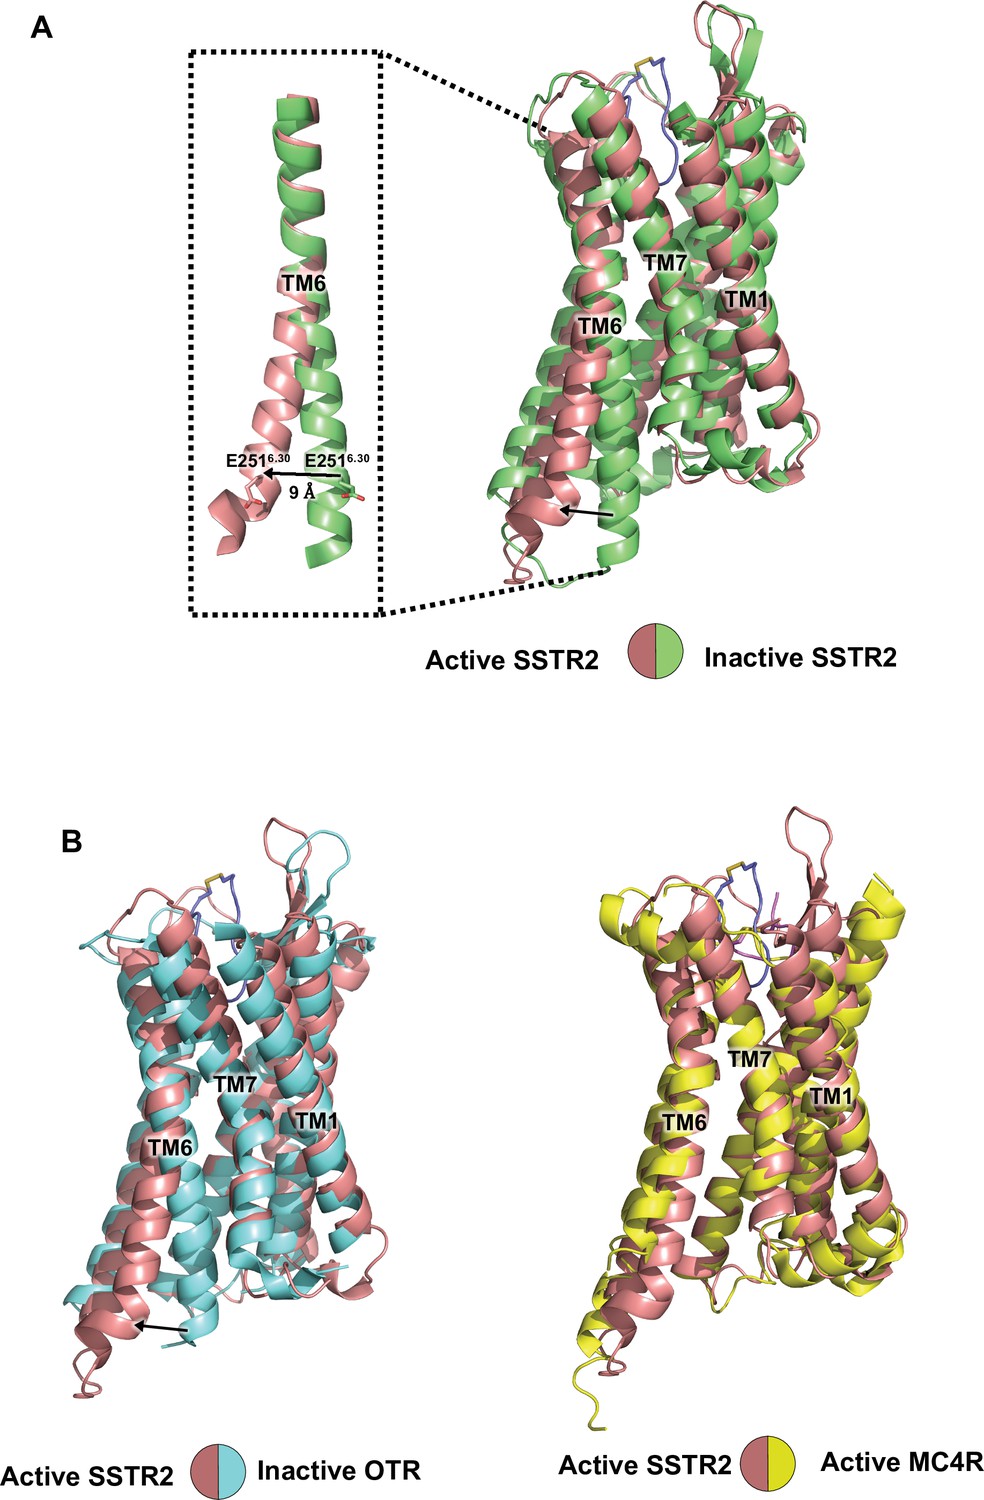
Comparison among somatostatin receptor 2 (SSTR2) and other G-protein-coupled receptor (GPCR) structures.
(A) The superimposition of SSTR2 in active and inactive conformations. The active structure of SSTR2 (in salmon) is from this study and the inactive structure of SSTR2 (in green) is predicted by AlphaFold. TM6 is displaced outward in the active form compared with the inactive form. (B) Comparison between SSTR2 and other GPCR structures in active and inactive forms. The active SSTR2 structure (in salmon) is superimposed with the inactive oxytocin receptor (OTR) structure (in cyan) (PDB ID: 6TPK) and with the active melanocortin receptor 4 (MC4R) structure (in yellow) (PDB ID:7AUE).
Figure 1—figure supplement 5
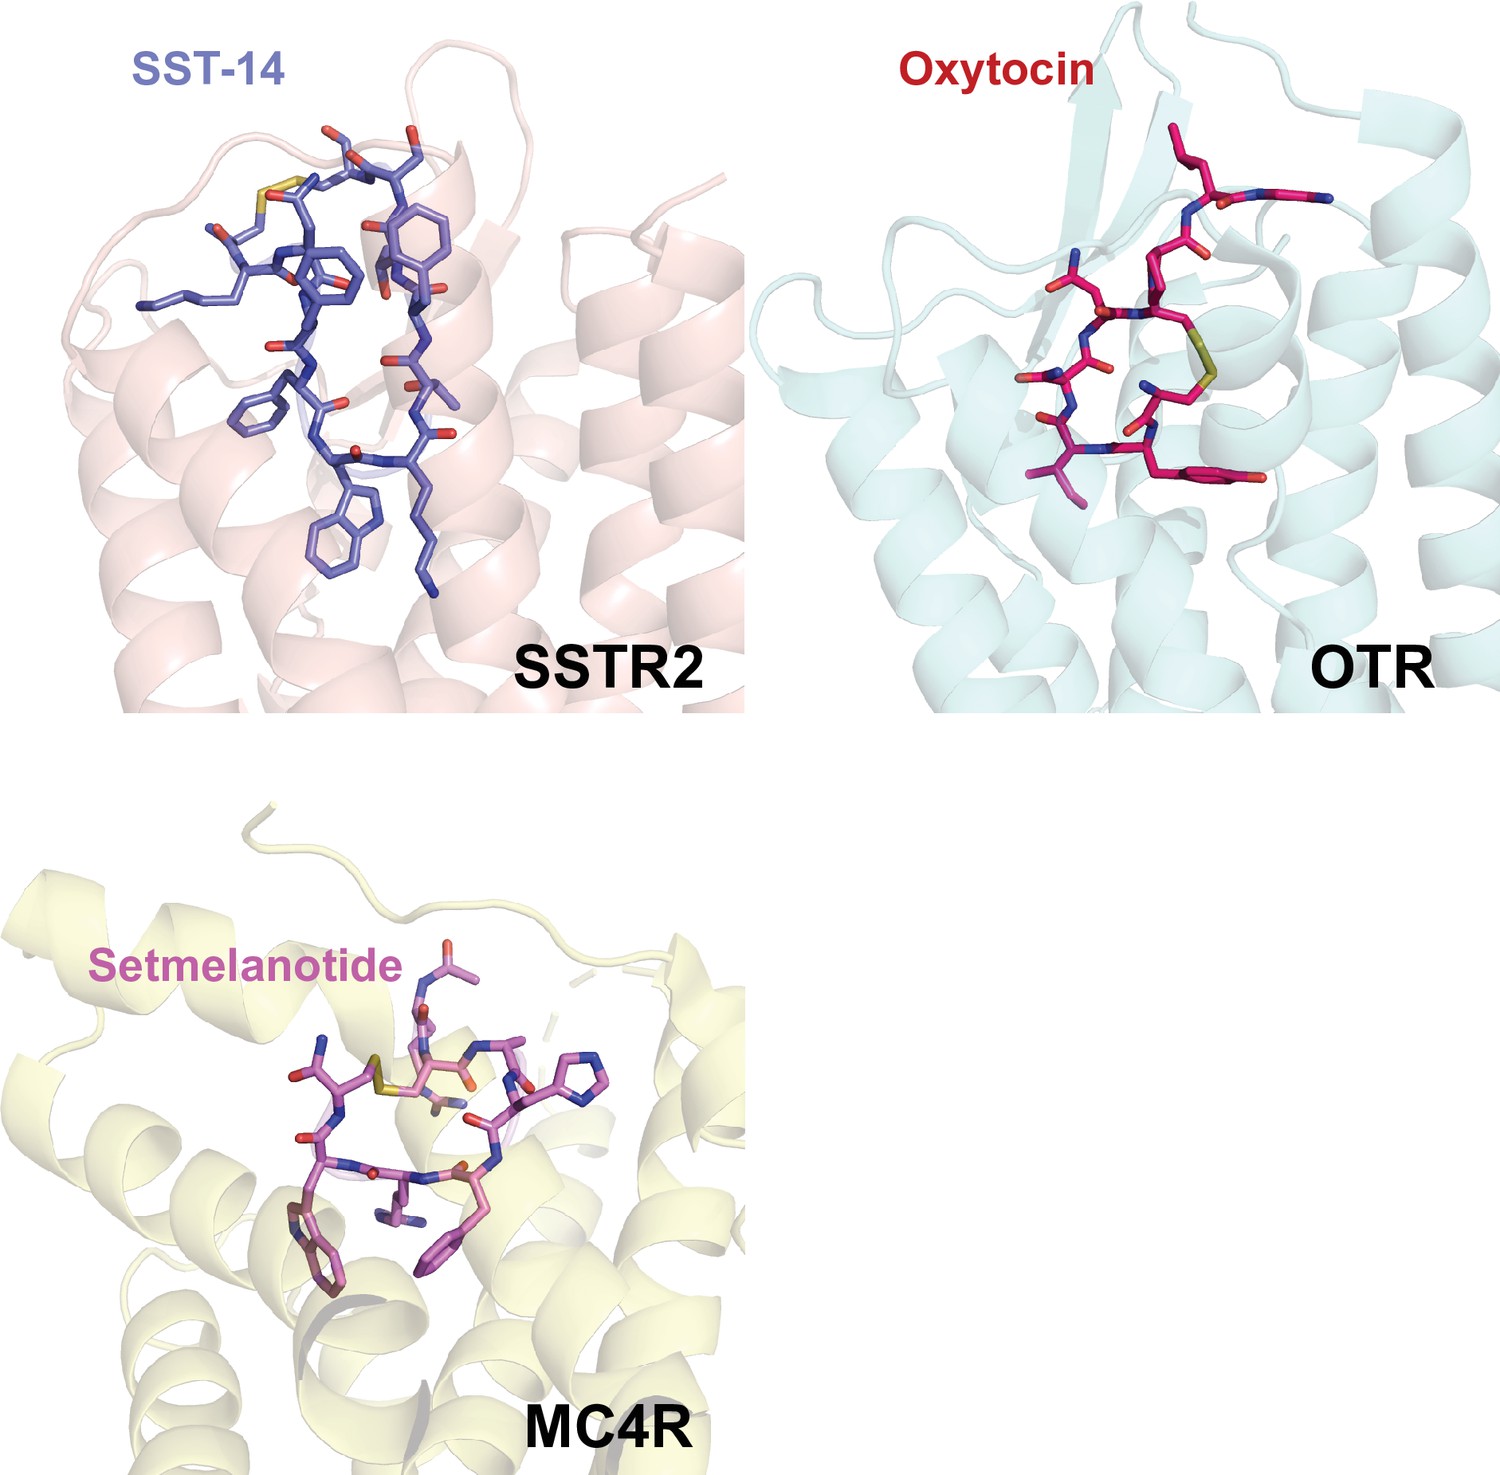
The binding modes of cyclic peptide ligands of somatostatin receptor 2 (SSTR2), oxytocin receptor (OTR), and melanocortin receptor 4 (MC4R) G-protein-coupled receptors (GPCRs).
SST-14, oxytocin, and setmelanotide cyclic peptide ligands bound to SSTR2, OTR, and MC4R are shown in a stick model.
Figure 2 with 1 supplement
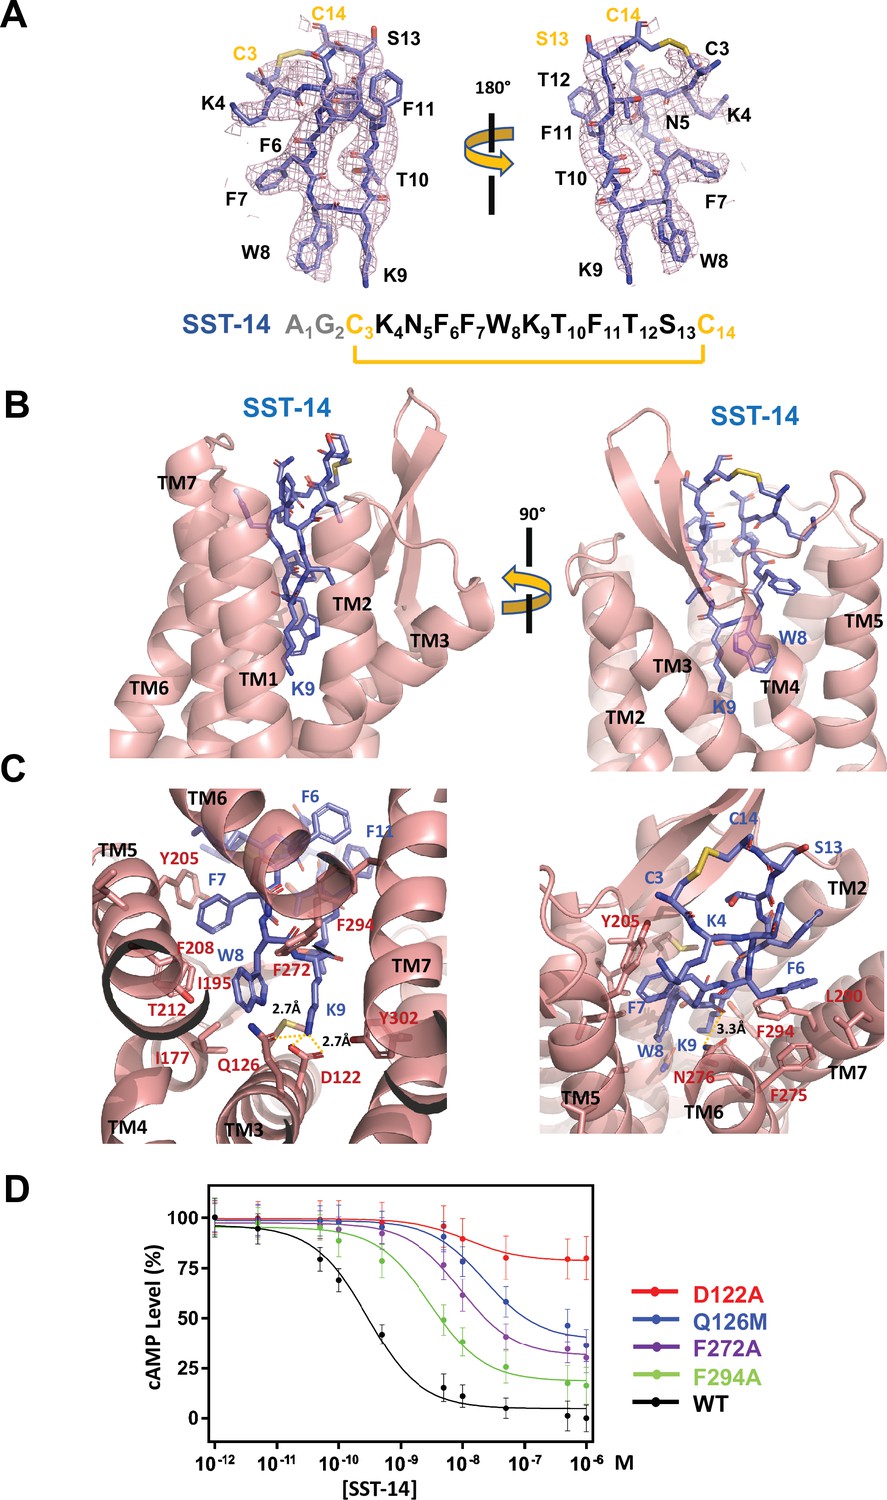
Somatostatin receptor 2 (SSTR2) recognition of SST-14 ligand.
(A) The cryo-EM map near the SST-14 ligand in two different orientations. The sequence of SST-14 is drawn at the below. Two amino acids, which are not visible, are colored in gray. C3 and C14 make a covalent bond to form a cyclic peptide. (B) The ligand-binding pocket of SSTR2 with SST-14 is shown in two different orientations. SSTR2 is shown in a ribbon diagram and SST-14 in a stick model. (C) Detailed interactions between SST-14 and SSTR2. The salt bridge between Lys9 and Asp122, and a hydrogen bonding between Lys9 and Gln126 are indicated with yellow dotted lines. (D) The dose-signal curves of SSTR2 for SST-14. WT, D122A, Q126M, F272A, F294A of SSTR2, measuring the inhibition of cAMP production upon forskolin stimulation (n = 3).
Figure 2—figure supplement 1
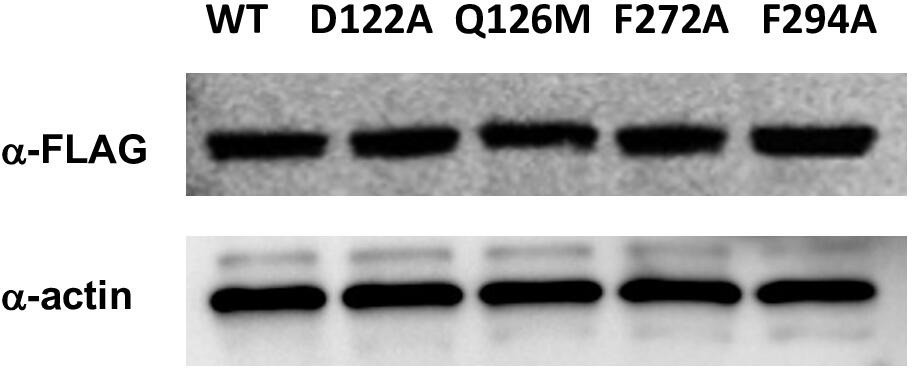
Western blot analysis of somatostatin receptor (SSTR) expression in HEK293 cells.
The expression levels of SSTR2 WT and mutants are similar. Actin was used for loading control.
-
Figure 2—figure supplement 1—source data 1
Uncropped Western blot images.
- https://cdn.elifesciences.org/articles/76823/elife-76823-fig2-figsupp1-data1-v2.zip
Figure 3 with 1 supplement
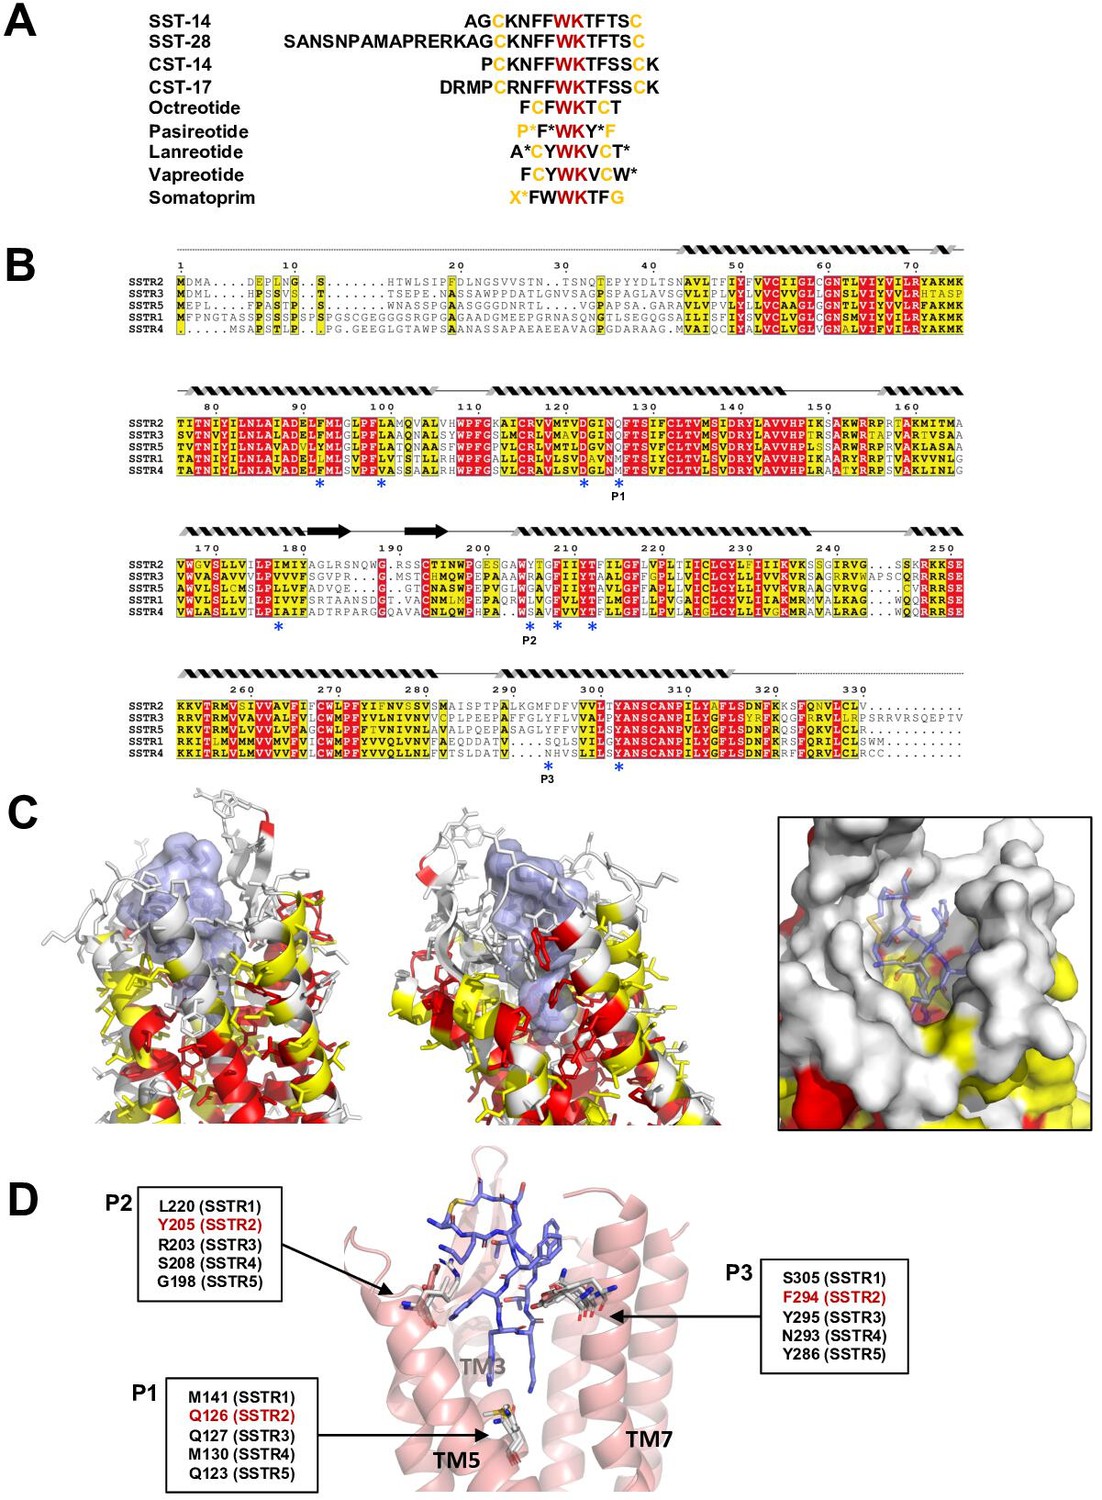
Sequence and structural analysis of ligand-binding pockets of somatostatin receptor (SSTR) isoforms.
(A) The sequences of somatostatins and its analogs. Trp-Lys motif is absolutely conserved among all SSTR-binding ligands, emphasizing the importance of the Trp-Lys motif for the function. Modified amino acids are marked with asterisks in pasireotide (P*: hydroxyproline, F*: 2-phenylglycine, Y*: phenylmethylated tyrosine), lanreotide (A*: D-2-naphthylalanine, T*: amidated threonine), vapreotide (W*: amidated tryptophan), and somatoprim (X*: ω-amino acid). (B) A sequence alignment among SSTR isoforms. The amino acids are colored in red or yellow depending the degree of sequence conservation among the isoforms. The secondary structures based on the cryo-EM structure of SSTR2 are shown above the sequences. Critical residues recognizing SST-14 are indicated with asterisks under the sequences. P1, P2, and P3 indicate highly variable sequences among the isoforms. (C) The conserved amino acids near the ligand-binding pocket are colored according to the sequence alignment in (B). Highly conserved amino acids are clustered near the inner bottom of the pocket, which interacts with the Trp-Lys motif, while amino acids near the upper part of the pocket are not well conserved. (D) Three variable positions (P1, P2, P3) in the ligand-binding pockets based on the cryo-EM structure of SSTR2 and AlphaFold modeled structure of SSTR1, SSTR3, SSTR4, and SSTR5.
Figure 3—figure supplement 1
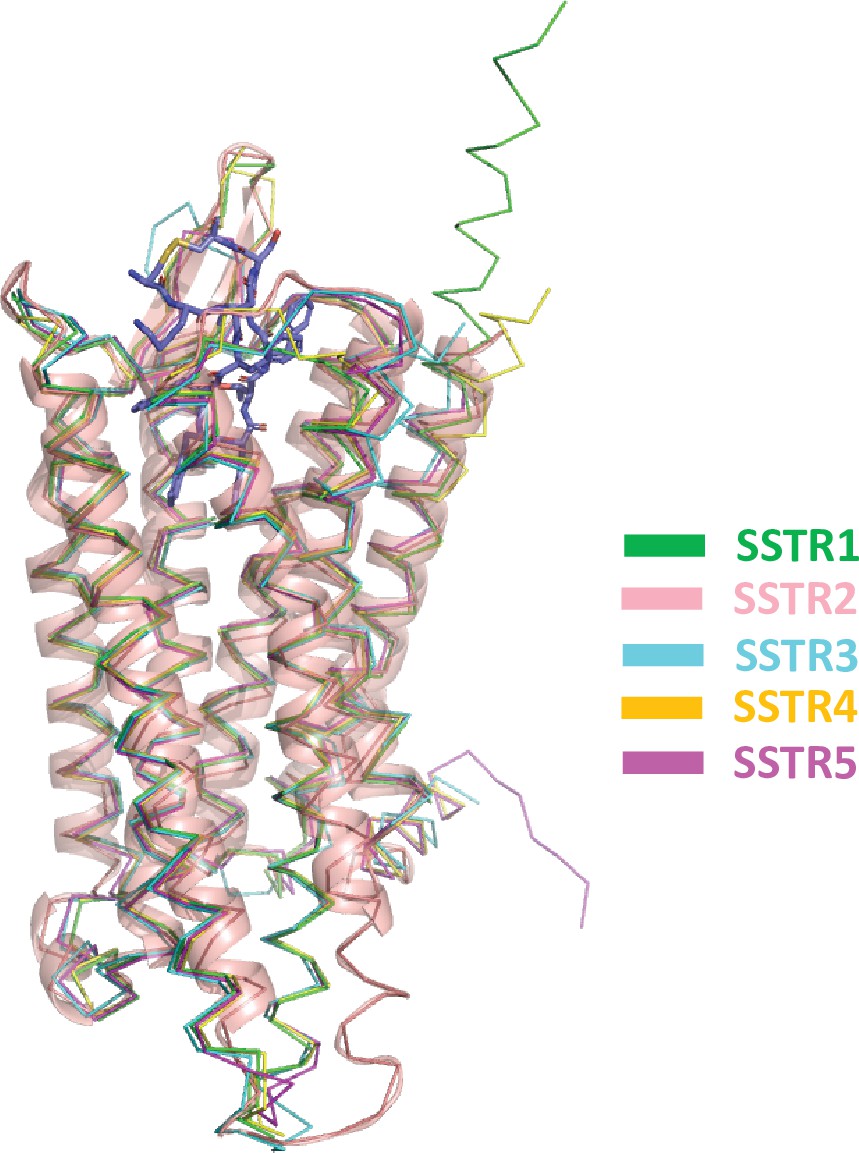
AlphaFold modeled structures of somatostatin receptor (SSTR) isoforms.
Structures of SSTR1, SSTR3, SSTR4, and SSTR5 from AlphaFold Protein Structure Database (alphafold.ebi.ac.uk) were superimposed on the cryo-EM structure of SSTR2. SSTR2 is shown in a ribbon diagram in salmon color. SSTR1 is shown as a Cα backbone model and colored in green, SSTR3 in cyan, SSTR4 in gold, and SSTR5 in magenta.
Tables
Table 1
Refinement statistics.
| Data collection and processing | ||
|---|---|---|
| Magnification | ||
| Voltage (kV) | 300 | |
| Total electron exposure/used (e/Å2) | 55.04/29.24 | |
| Defocus range (μm) | –0.8 ~ –2.0 | |
| Pixel size (Å2) | 0.829 | |
| Processing program | Relion 3.1 | |
| Obtained/used micrographs (no.) | 5523/5523 | |
| Initial/final particles used (no.) | 6,677,042/320,885 | |
| Symmetry imposed | C1 | |
| Resolution (Å) (FSC threshold) | ||
| GPCR + G-protein | 3.72 (0.143) | |
| Multibody refinement | GPCR + Gαβ | 3.65 (0.143) |
| Gβγ+scfv16 | 3.22 (0.143) | |
| Refinement | ||
| Refinement program | PHENIX | |
| Model composition | ||
| Nonhydrogen atoms | 8660 | |
| Protein residues | 1129 | |
| r.m.s. deviation | ||
| Bond length (Å) | 0.004 | |
| Bond angle (°) | 0.547 | |
| Validation | ||
| MolProbity score | 2.08 | |
| Clash score | 7.79 | |
| Ramachandran plot (%) | ||
| Favored/allowed/outliers | 95.86/4.24/0.0 | |
| Mask CC | 0.80 | |
Additional files
Download links
A two-part list of links to download the article, or parts of the article, in various formats.
Downloads (link to download the article as PDF)
Open citations (links to open the citations from this article in various online reference manager services)
Cite this article (links to download the citations from this article in formats compatible with various reference manager tools)
Cryo-EM structure of the human somatostatin receptor 2 complex with its agonist somatostatin delineates the ligand-binding specificity
eLife 11:e76823.
https://doi.org/10.7554/eLife.76823


