MicroRNA-eQTLs in the developing human neocortex link miR-4707-3p expression to brain size
- Department of Genetics, University of North Carolina at Chapel Hill, United States
- UNC Neuroscience Center, University of North Carolina at Chapel Hill, United States
- Department of Cell Biology and Physiology, The University of North Carolina at Chapel Hill, United States
- Carolina Institute for Developmental Disabilities, The University of North Carolina at Chapel Hill, United States
- Neurogenetics Program, Department of Neurology, David Geffen School of Medicine, University of California, Los Angeles, United States
- Center for Autism Research and Treatment, Semel Institute, David Geffen School of Medicine, University of California, Los Angeles, United States
- Department of Human Genetics, David Geffen School of Medicine, University of California, Los Angeles, United States
- Department of Psychiatry and Biobehavioral Sciences, Semel Institute, David Geffen School of Medicine, University of California, Los Angeles, United States
Figures
Figure 1 with 2 supplements
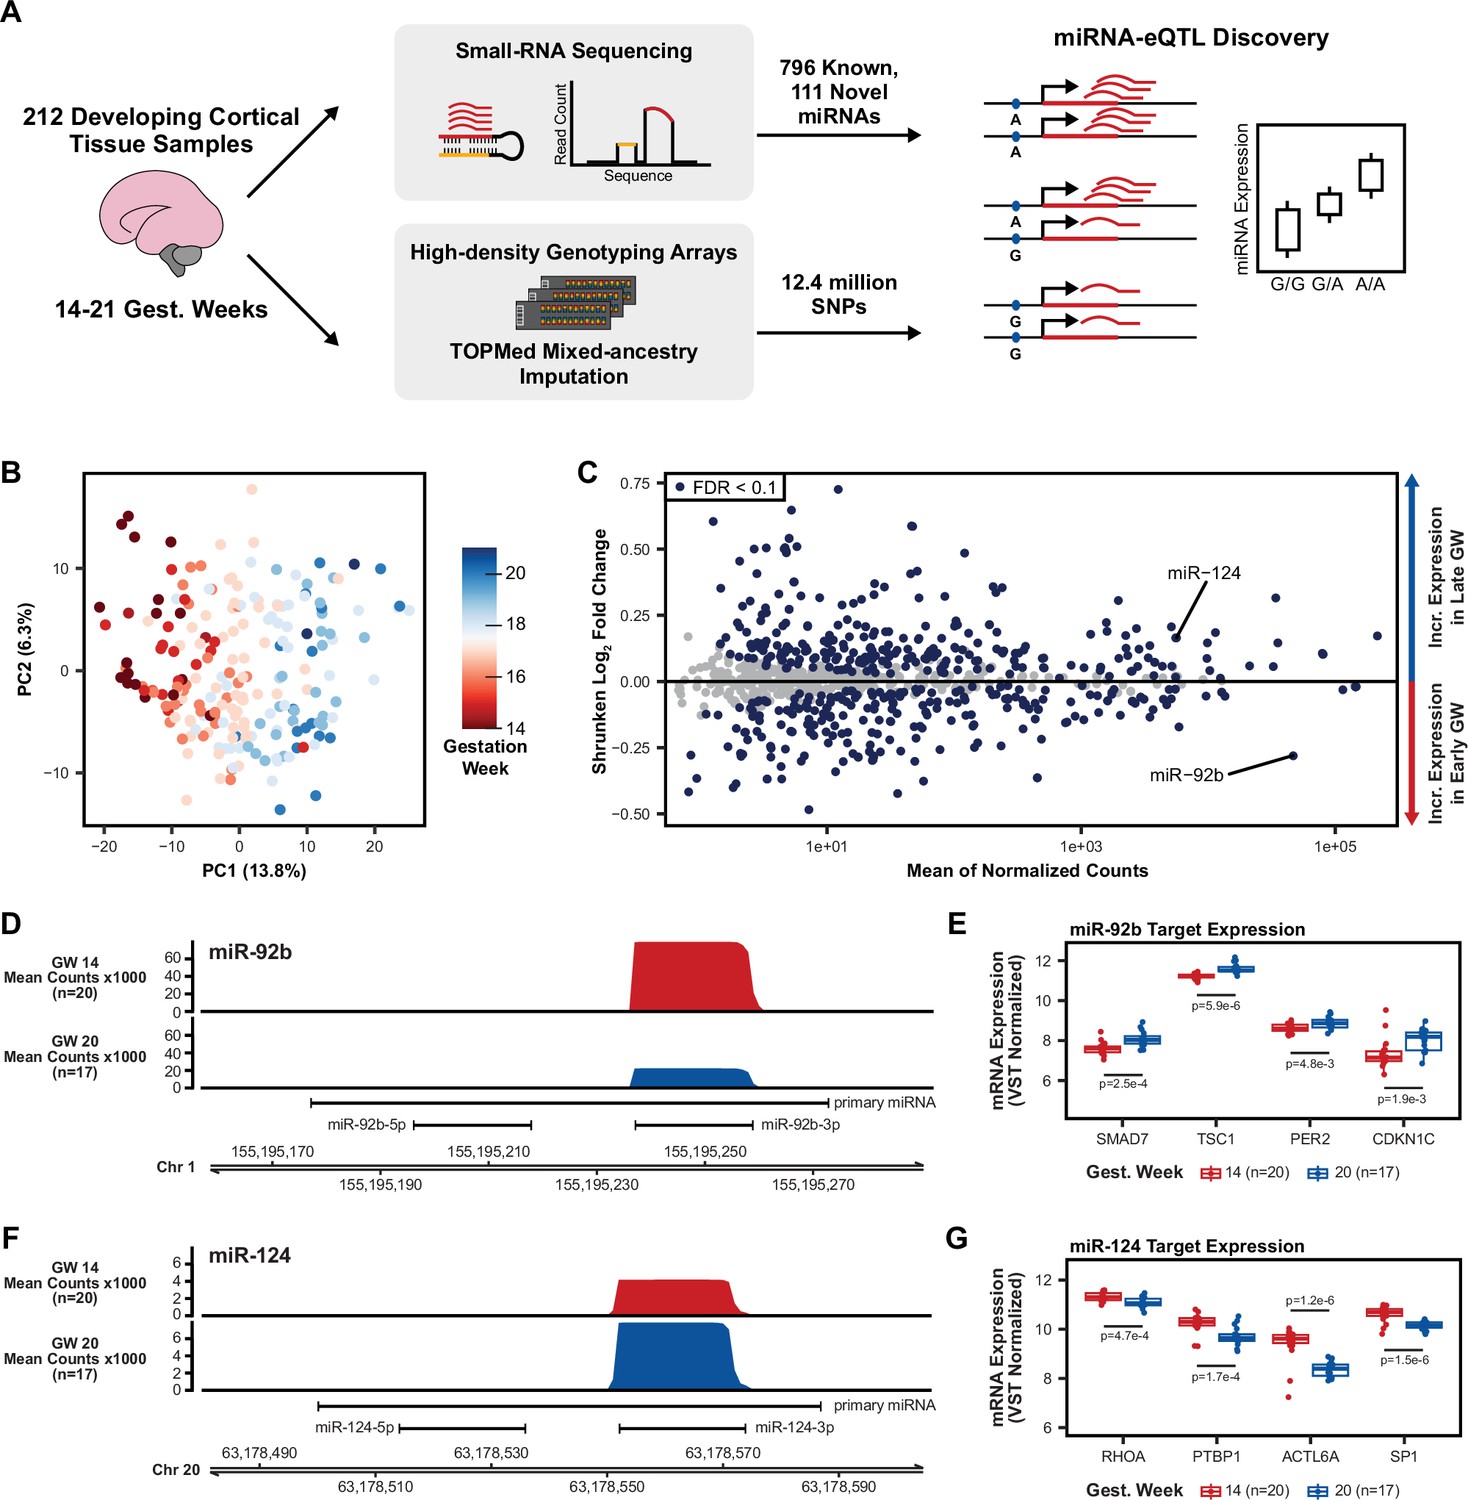
Study design and miRNA expression analysis.
(A) Small-RNA sequencing was used on a total of 212 cortical tissue samples between 14 and 21 gestation weeks to identify novel miRNAs and quantify expression of known and novel miRNAs. Combined with imputed genotypes, a genetic association analysis was performed to discover local-miRNA-eQTLs. (B) Principal component analysis (PCA) on miRNA expression (miRBase release 22) after correcting for the known technical batch effects of sequencing pool and RNA purification method and removal of outlier samples (Figure 1—figure supplement 1). (C) Differential miRNA expression analysis using gestation week as the comparison variable. MiR-124, with known roles in neurogenesis, is upregulated among late gestation week samples, miR-92b, with known roles in progenitor proliferation, is upregulated among early gestation week samples. miRNAs with an FDR adjusted p-value <0.1 were considered significantly differentially expressed. (D) Coverage plot of mean small-RNA sequencing read counts at the miR-92b locus on chromosome 1 for a set of early gestation week samples (gest. week 14, n=20) and a set of late gestation week samples (gest. week 20, n=17). (E) Known miR-92b targets exhibit expression patterns consistent with down-regulation by a miRNA when separated between early and late gestation week samples. p-Values using a two-sided t-test between early and late gestation week samples. (F) Coverage plot, as in D, but for the miR-124 locus on chromosome 20. (G) Known miR-124 targets expression patterns as in E. p-values comparing mean expression as in E.
Figure 1—figure supplement 1
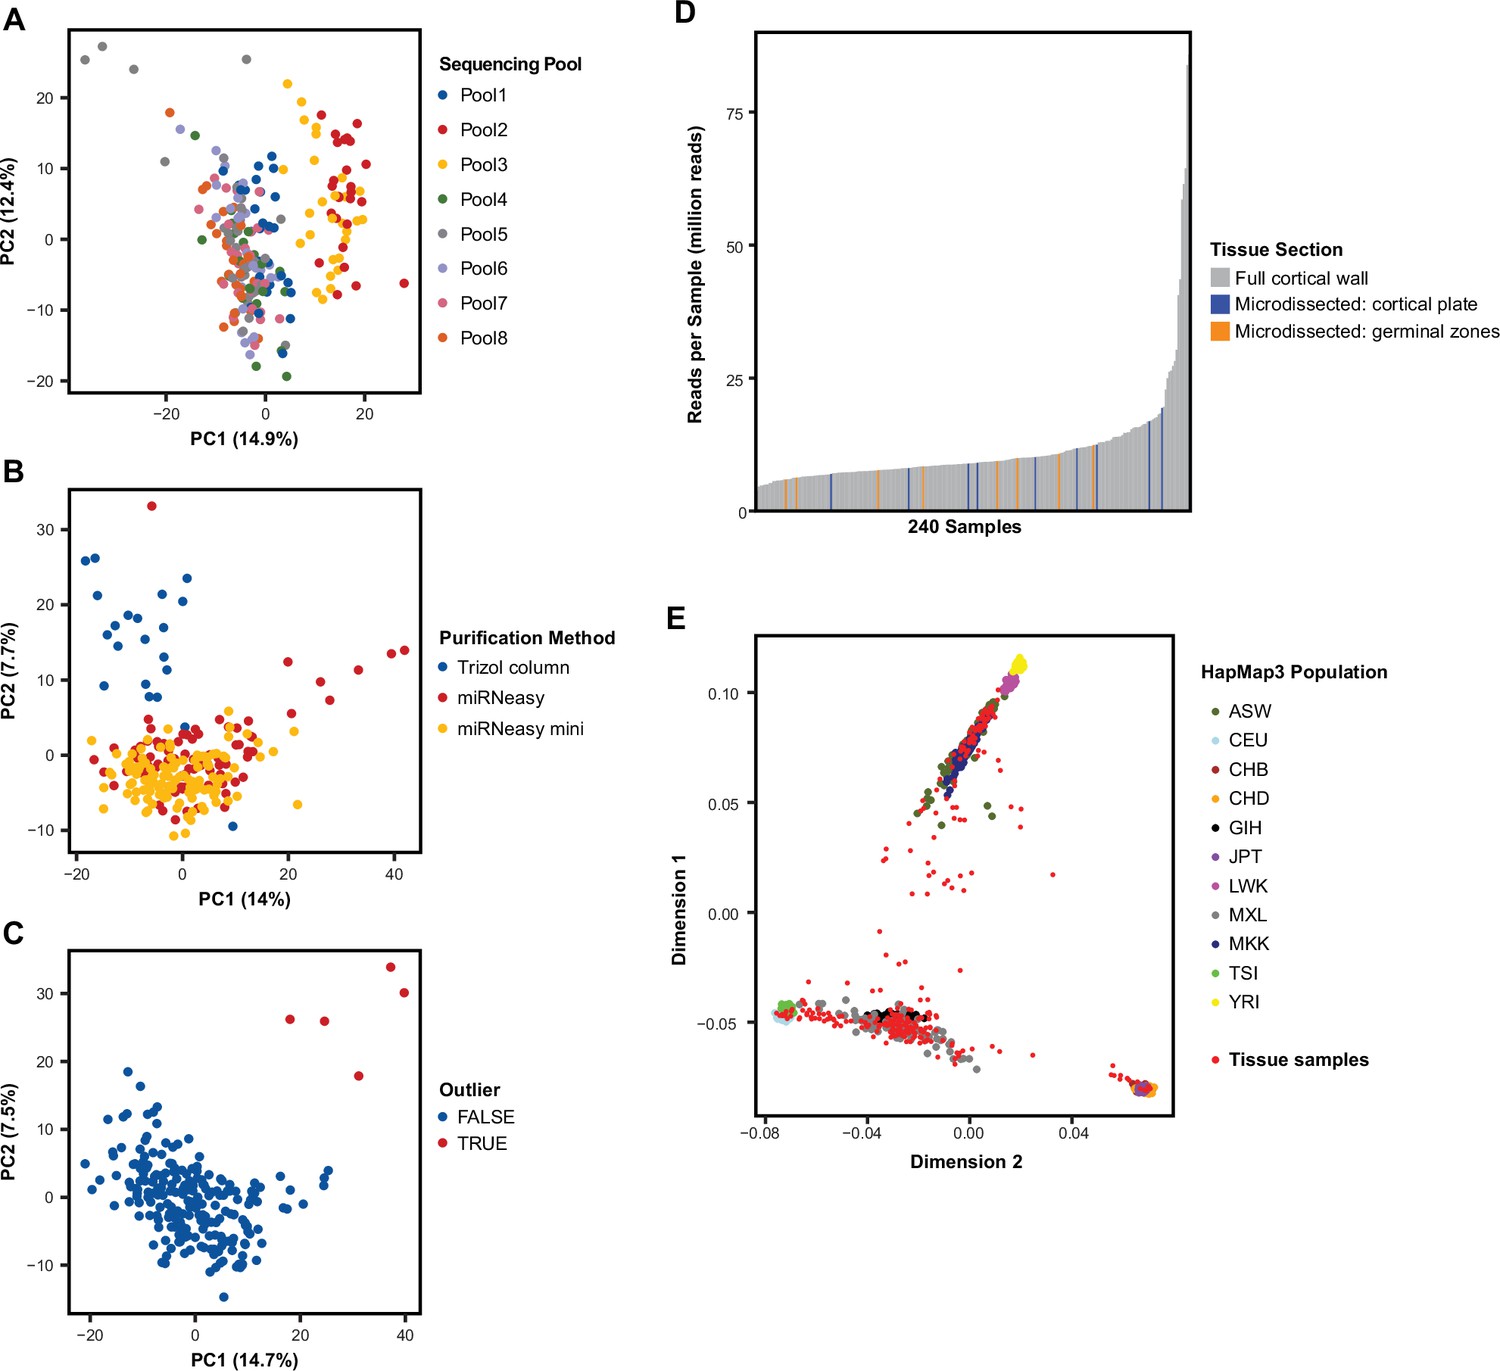
Tissue sample miRNA expression and sample ancestry.
(A) Principal component analysis (PCA) for uncorrected miRBase miRNA expression across the 217 quality controlled tissue samples shows sequencing-pool influences global miRNA expression and the primary driver of variation in PC1. (B) After correcting for sequencing-pool on miRNA expression using a linear model, PCA shows further influence by RNA purification method. (C) After correcting for sequencing-pool and purification method using a linear model, five samples remain as outliers in PCA and were removed from the study. (D) Small-RNA sequencing read depth across the 223 mid-gestation cortical wall samples used to discover novel miRNAs. Small-RNA sequencing data from 17 microdissected cortical plate and germinal zone samples were also included when detecting novel miRNAs. (E) Multidimensional scaling (MDS) of sample genotypes show diverse ancestry when overlaid on HapMap3 population samples. African ancestry in Southwest USA (ASW), Utah residents with Northern and Western European (CEU), Han Chinese in Beijing, China (CHB), Chinese in Metropolitan Denver, Colorado (CHD), Gujarati Indians in Houston, Texas (GIH), Japanese in Tokyo, Japan (JPT), Luhya in Webuye, Kenya (LWK), Mexican ancestry in Los Angeles, California (MXL), Maasai in Kinyawa, Kenya (MKK), Toscani in Italia (TSI), Yoruba in Ibadan, Nigeria (YRI).
Figure 1—figure supplement 2
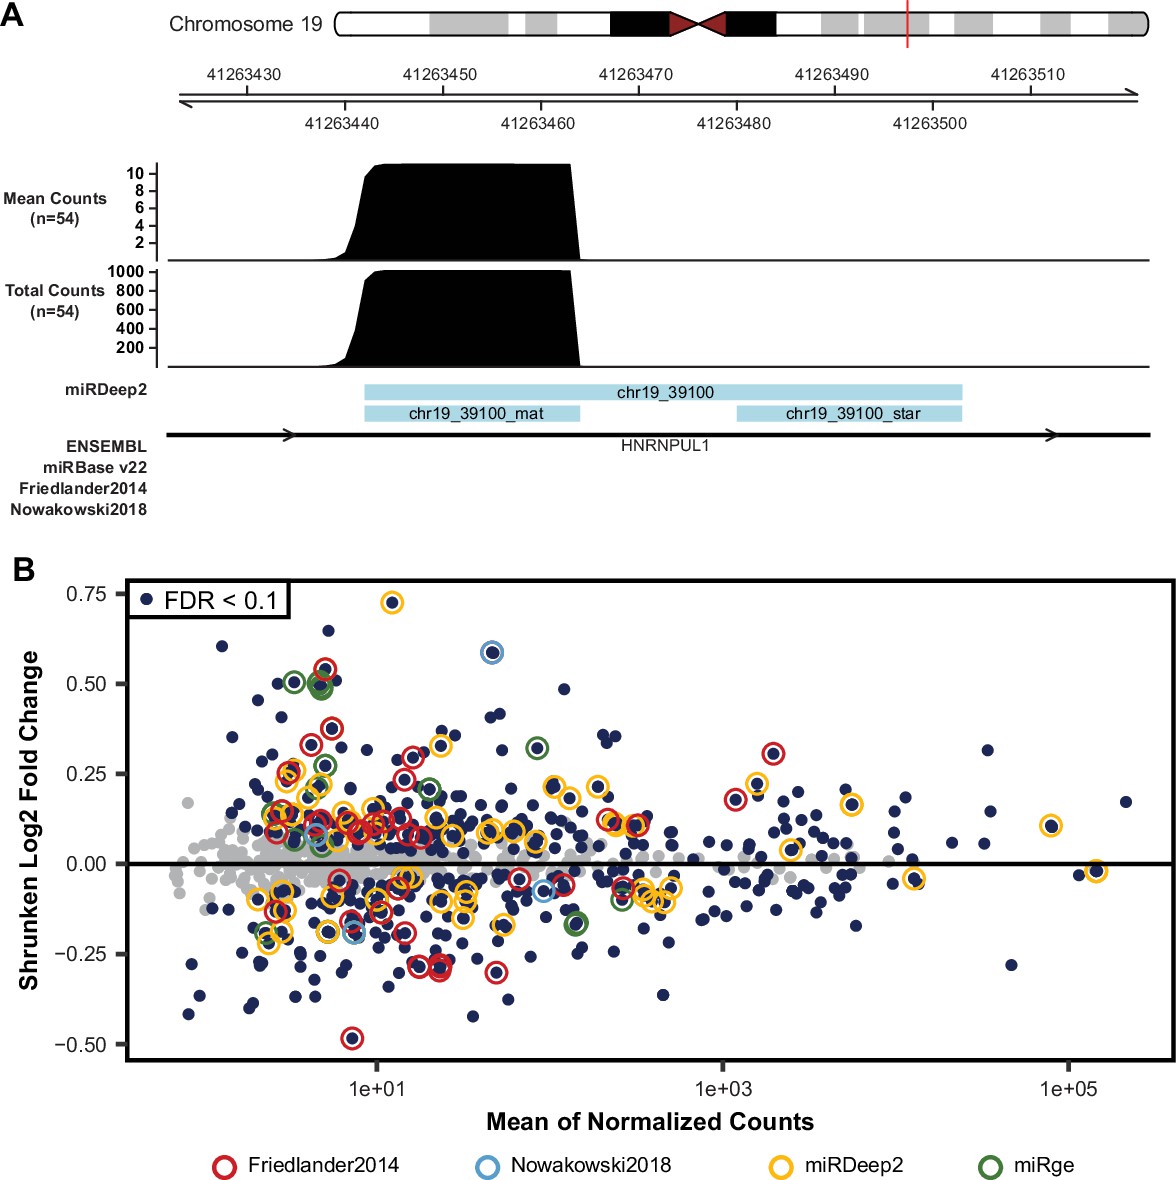
Evidence for novel miRNAs.
(A) Small-RNA sequencing read coverage for a putatively novel miRNA, detected using the miRDeep2 package, on chromosome 19 shows the characteristic read pile-up often seen from known miRNAs (Figure 1D and F). (B) Differential miRNA-expression analysis, as shown in Figure 1C, with miRNAs highlighted from Friedländer et al, Nowakowski et al, or novel miRNAs discovered in this study by either miRDeep2 or miRge2.0 packages. miRNAs with an FDR adjusted p-value <0.1 were considered significantly differentially expressed.
Figure 2 with 2 supplements
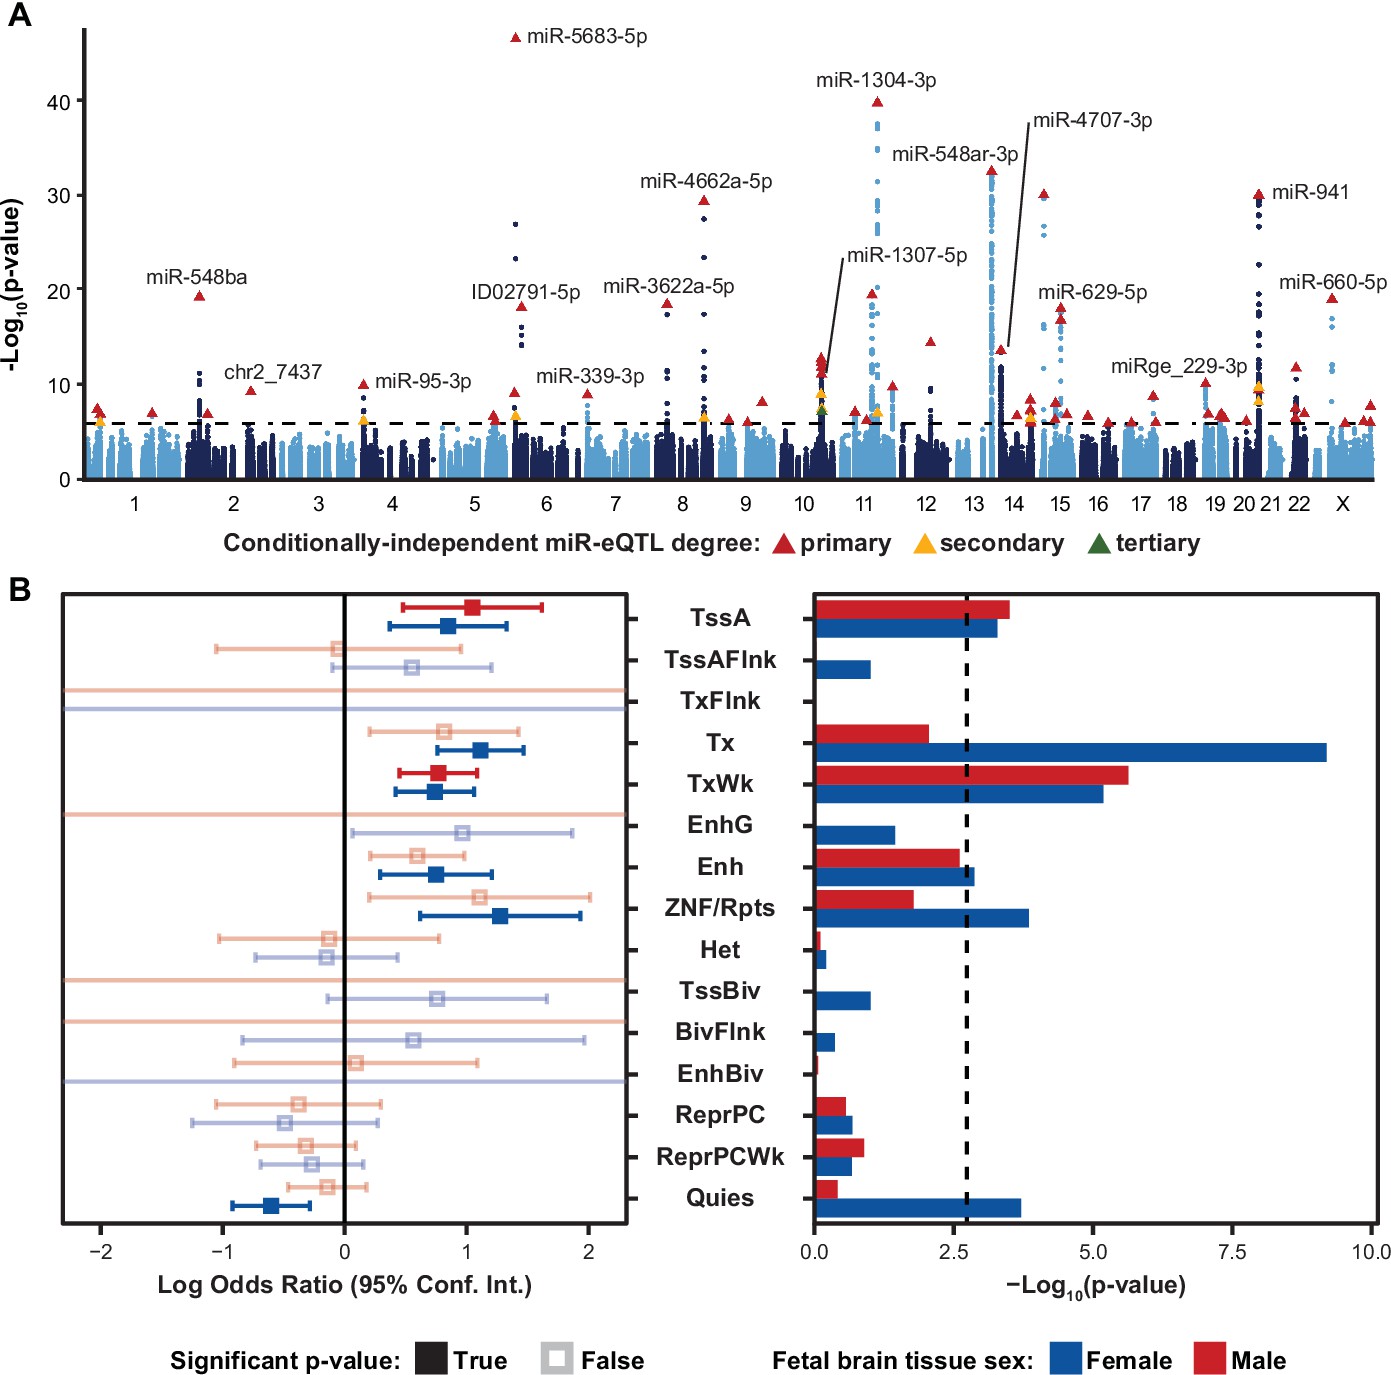
Local-miRNA-eQTLs and their enrichment in functional chromatin.
(A) Manhattan plot showing -Log10(p-values) for variants in a 2 Mb window around each expressed miRNA. Index variants for 70 primary, 14 secondary, and 1 tertiary eQTL denoted by triangles and colored by degree by which the eQTL is conditionally independent. Variants tested for association to more than one expressed miRNA are represented by independent points for each association p-value. Dotted line represents a stringent p-value significance threshold of 1.434x10⁻⁶ after local and global multiple testing correction at FDR <5%. (B) Enrichment of local-miRNA-eQTLs within functionally annotated chromatin states. Local-miRNA-eQTLs passing the stringent p-value significance threshold were used for enrichment analysis. For other p-value significance thresholds, see Figure 2—figure supplement 1. Chromatin states were predicted using ChromHMM for both male and female fetal brain tissue. Left, log odds ratio and 95% confidence interval for significant enrichments are in solid colors. Non-significant enrichments in faded color outlines. Right, -Log10(p-values) for each enrichment test. Dotted line represents a multiple testing corrected p-value threshold of 1.83x10⁻³ (Bonferroni correction at α<0.05). miRNA-eQTLs are significantly enriched within active transcription start sites (TssA) and chromatin associated with strong transcription (Tx), weak transcription (TxWk), enhancers (Enh), and ZNF genes and repeats (ZNF/Rpts). There is also a significant depletion of miRNA-eQTLs within quiescent chromatin (Quies). Other abbreviations: flanking active tss (TssAFlnk), transcription at gene 5’ and 3’ (TxFlnk), genic enhancers (EnhG), heterochromatin (Het), bivalent/poised TSS (TssBiv), flanking TssBiv (BivFlnk), bivalent enhancer (EnhBiv), repressed polycomb (ReprPC), and weak repressed polycomb (ReprPCWk).
Figure 2—figure supplement 1
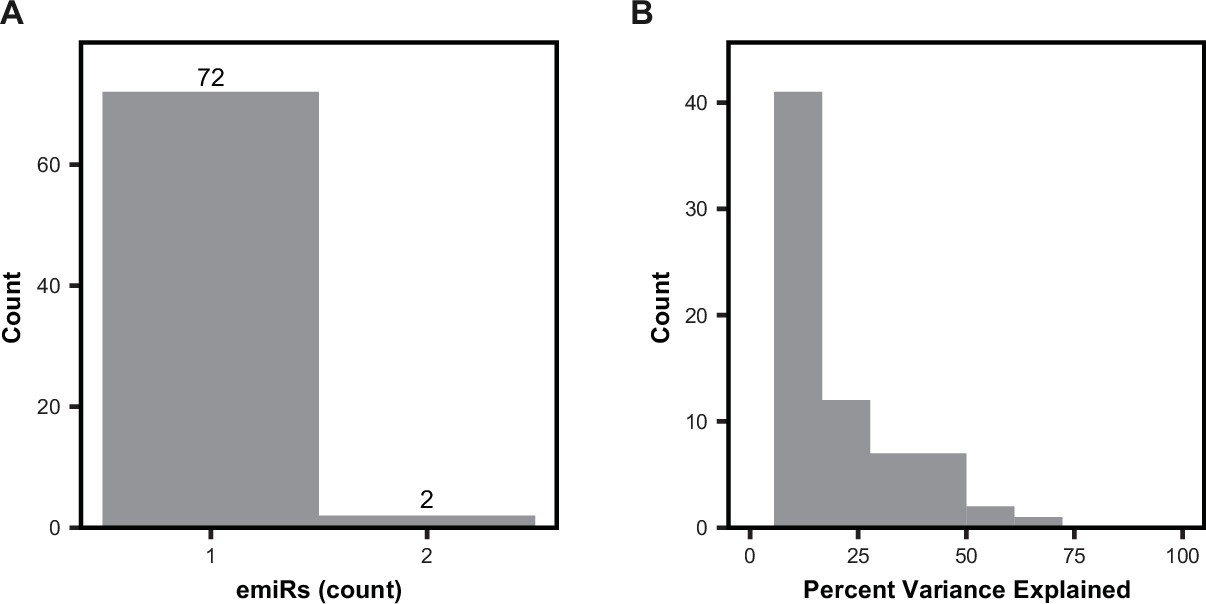
Characteristics of miRNA-eQTLs.
(A) The number of miRNAs (emiRs) affected per eSNP. Local-miRNA-eQTLs that regulated miRNA clusters with identical mature miRNA sequences were pooled as a single emiR. (B) The distribution of the percent of miRNA expression variance explained by each primary miRNA-eQTL discovered using the stringent significance threshold (p<1.434 × 10⁻⁶).
Figure 2—figure supplement 2

Enrichment in functional chromatin at various thresholds.
Enrichment of local-miRNA-eQTLs within functionally annotated chromatin states as in Figure 2B at multiple miRNA-eQTL p-value significance thresholds. Log odds ratio (beta) and 95% confidence interval for significant enrichments are in solid colors. Non-significant enrichments in faded color outlines. The stringent p-value significance threshold of 1.434x10⁻⁶ and the relaxed p-value threshold of 2.804x10⁻⁵ show similar enrichments. Abbreviations: active transcription start sites (TssA), chromatin associated with strong transcription (Tx), chromatin associated with weak transcription (TxWk), enhancers (Enh), ZNF genes and repeats (ZNF/Rpts), quiescent chromatin (Quies), flanking active tss (TssAFlnk), transcription at gene 5’ and 3’ (TxFlnk), genic enhancers (EnhG), heterochromatin (Het), bivalent/poised TSS (TssBiv), flanking TssBiv (BivFlnk), bivalent enhancer (EnhBiv), repressed polycomb (ReprPC), and weak repressed polycomb (ReprPCWk).
Figure 3
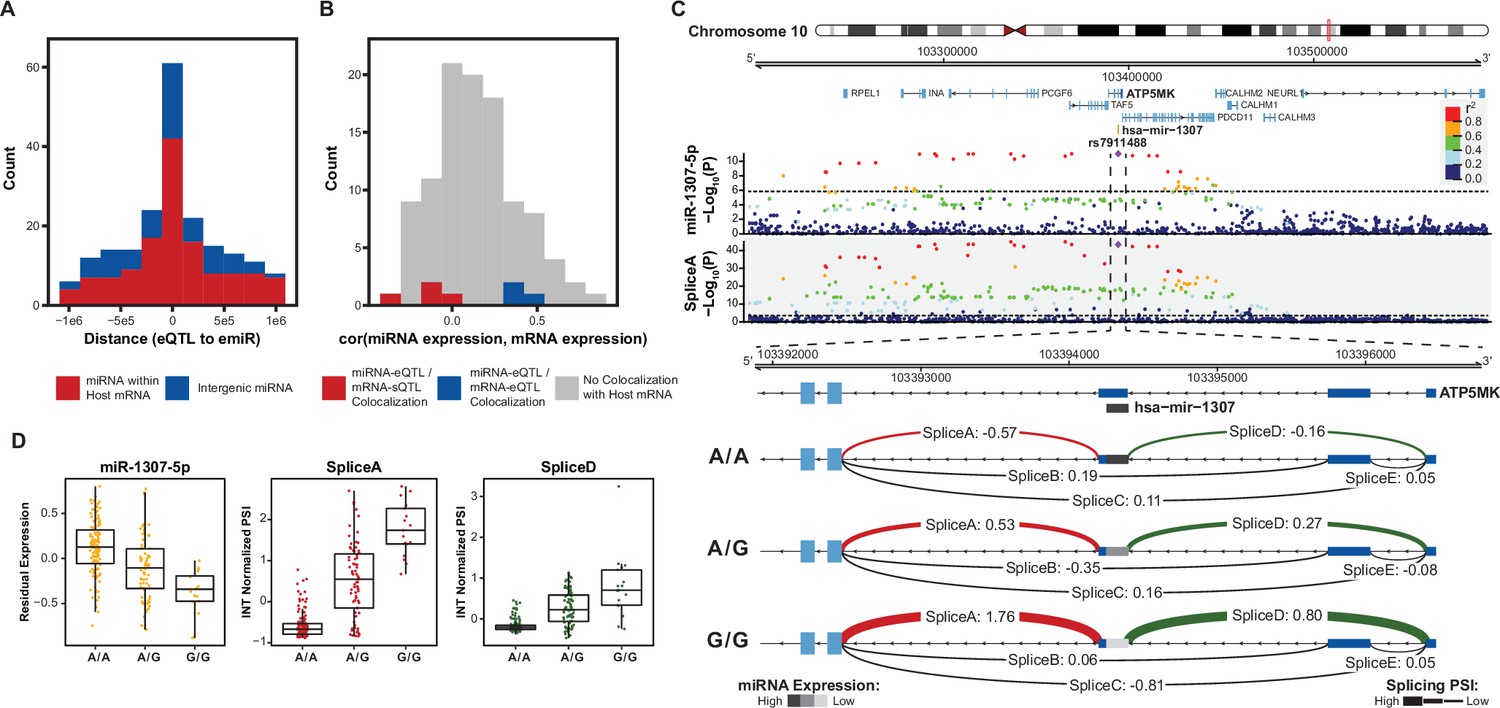
Colocalization of miRNA-eQTLs and mRNA-e/sQTLs.
(A) Histogram of distances from miRNA-eQTL to its significantly associated miRNA (eSNP to emiR distance in base pairs) for each of the 85 miRNA-eQTLs across 70 emiRs. Colored by whether the emiR resides within a host mRNA or intergenic. (B) For emiRs that reside within a host mRNA, histogram of expression correlation between miRNA and mRNA host. Colors represent correlations for miRNA-eQTLs that colocalize with mRNA-eQTLs or mRNA-sQTLs. (C) Example of a miRNA-eQTL, for miR-1307–5p expression, which colocalizes with a mRNA-sQTL for splice variants in the 5’ UTR of ATP5MK. Top locus dot-plot indicates -Log10(p-values) on variant associations to miR-1307–5p expression. Bottom locus dot-plot shows -Log10(p-values) for SpliceA utilization measured as inverse normal transformed (INT) percent spliced in (PSI). Variants are colored by pairwise linkage disequilibrium (LD, r2) to the index variant, rs7911488. Zoom-in shows the 5’ UTR of ATP5MK and the INT normalized PSI for each of five splice sites, labeled A-E, separated by genotype at rs7911488. Lines representing splice junctions at SpliceA and SpliceD are colored and weighted for relative PSI at the indicated genotypes. The line representing mir-1307 is shaded based on relative miR-1307–5p expression at the indicated genotypes. Dotted line in top and bottom locus dot-plot represents a stringent p-value significance threshold of 1.434x10⁻⁶ and 2.957x10⁻⁴, respectively, after local and global multiple testing correction at FDR <5%. (D) Residualized expression (after removal of known and unknown confounders) of miR-1307–5p at rs7911488 genotypes. INT normalized PSI values for SpliceA and SpliceD at rs7911488 genotypes.
Figure 4
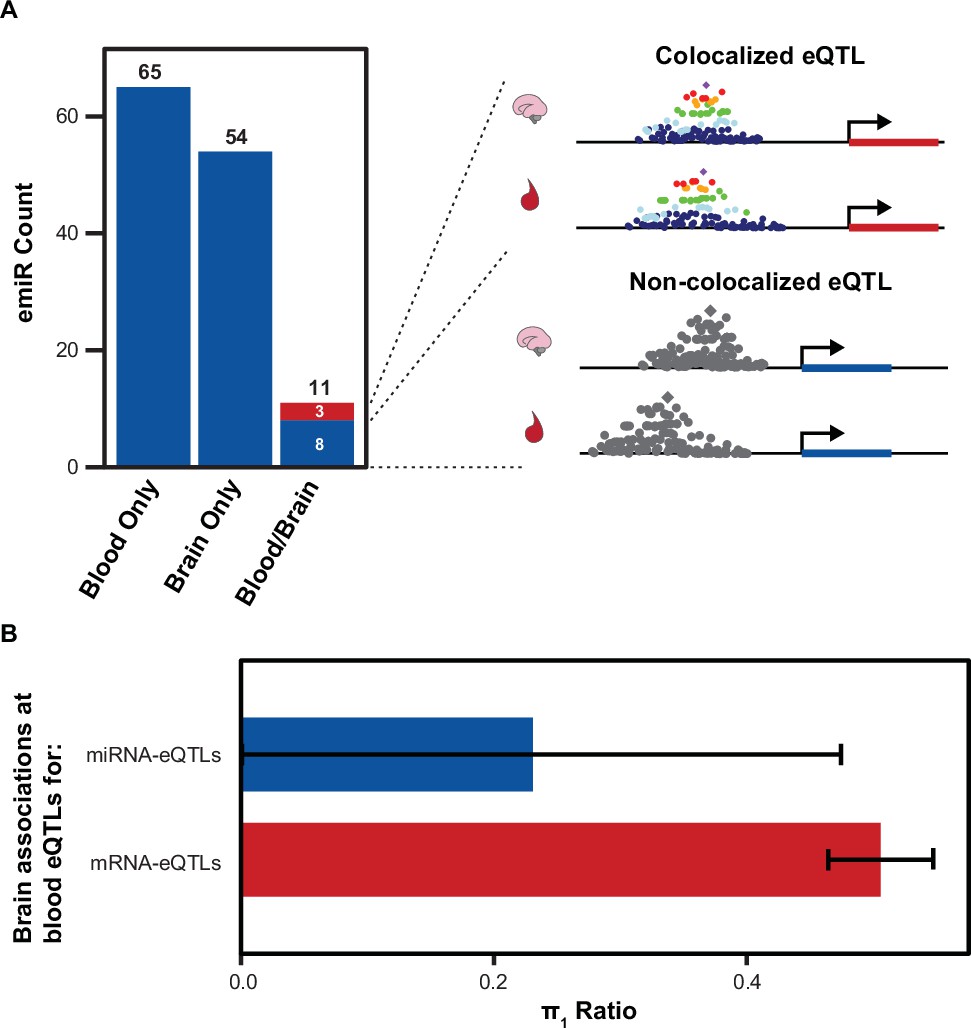
Comparison of Brain and Blood miRNA-eQTLs.
(A) MiRNAs with significant associations, emiRs, separated by unique to blood, unique to brain, or shared. Three of 11 shared emiRs have co-localized genetic signals in the blood and brain datasets. Cartoon locus dot-plot shows a representation of a colocalized genetic signal or a non-colocalized signal for a miRNA-eQTL that is present in both tissues. (B) The fraction of brain eQTL associations that are estimated non-null associations within the blood eQTL dataset (π1) separated by miRNA-eQTLs and mRNA-eQTLs. Error bars represent 95% upper and lower confidence intervals after 100 bootstrap samplings.
Figure 5 with 2 supplements
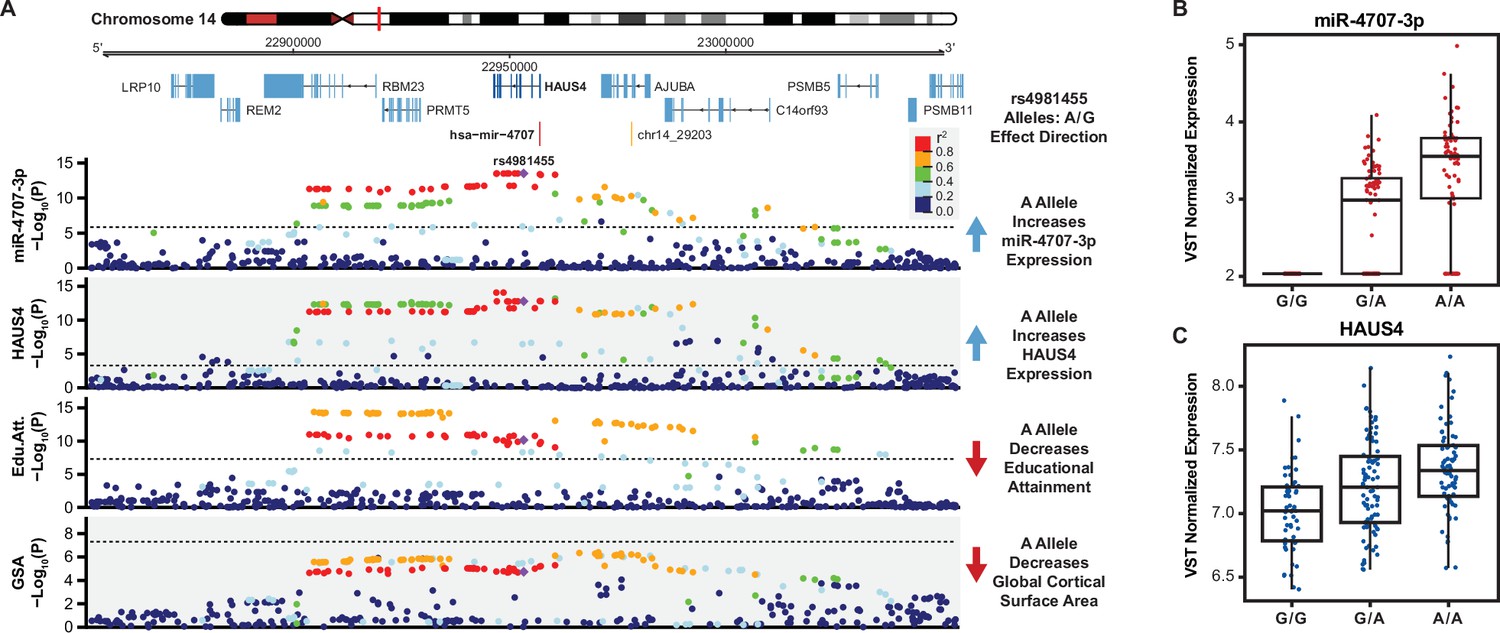
A miRNA-eQTL for miR-4707–3p colocalizes with multiple brain traits.
(A) A locus dot-plot surrounding hsa-mir-4707 on chromosome 14 showing -Log10(p-value) for various associations. Top track shows associations for expression of miR-4707–3p with the index variant, rs4981455. The second track shows associations surrounding a significant mRNA-eQTL to HAUS4 expression. The third track shows associations at this locus for a GWAS to educational attainment. The fourth track shows variant associations to global cortical surface area (GSA). Variants are colored by pairwise linkage disequilibrium (LD, r2) to rs4981455 in each of the four tracks. Dotted line in the first and second tracks represent a stringent p-value significance threshold of 1.43x10⁻⁶ and 8.17x10⁻⁴ respectively after local and global multiple testing correction at FDR <5%. Dotted lines in bottom two tracks represents the global genome-wide significance threshold of 5x10⁻⁸. (B) Boxplot showing variance stabilizing transformed (VST) expression of miR-4707–3p for samples with the indicated genotype at rs4981455. Samples with the G/G genotype show no expression of miR-4707–3p. (C) Boxplot showing VST expression of HAUS4, the host gene for mir-4707, at rs4981455.
Figure 5—figure supplement 1
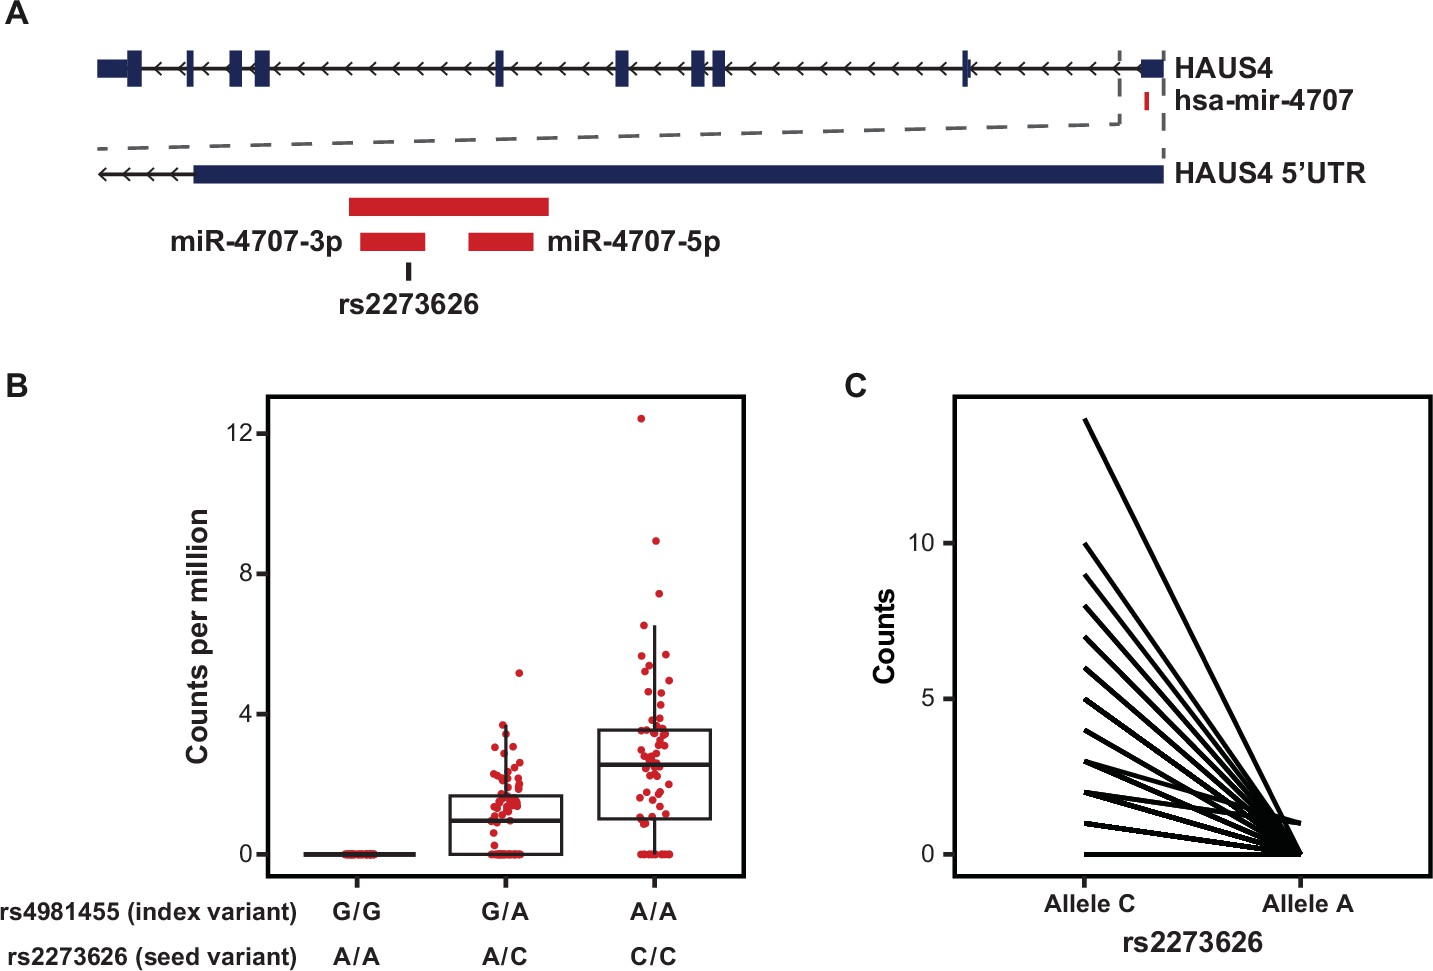
MiR-4707–3p Alternate Allele Expression.
(A) The primary sequence for hsa-mir-4707 is located within the 5’ UTR of the HAUS4 gene on chromosome 14. miR-4707–3p contains a variant, rs2273626 (reference allele C, alternate allele A), within the seed sequence in high LD with the index variant, rs4981455 (r2 >0.99). (B) Sequencing read counts per million, as quantified by miRge 2.0, across the three genotypes for both the index variant and seed variant. All samples with index variant G/G showed zero reads. (C) Allele specific expression for heterozygous samples at the seed variant, rs2273626. A total of three reads across three independent donors were observed with the A allele. p-value = 3.23 × 10⁻¹⁴ when using a paired, two-sided t-test.
Figure 5—figure supplement 2
Conditional analysis show miR-4707–3p colocalizes with educational attainment.
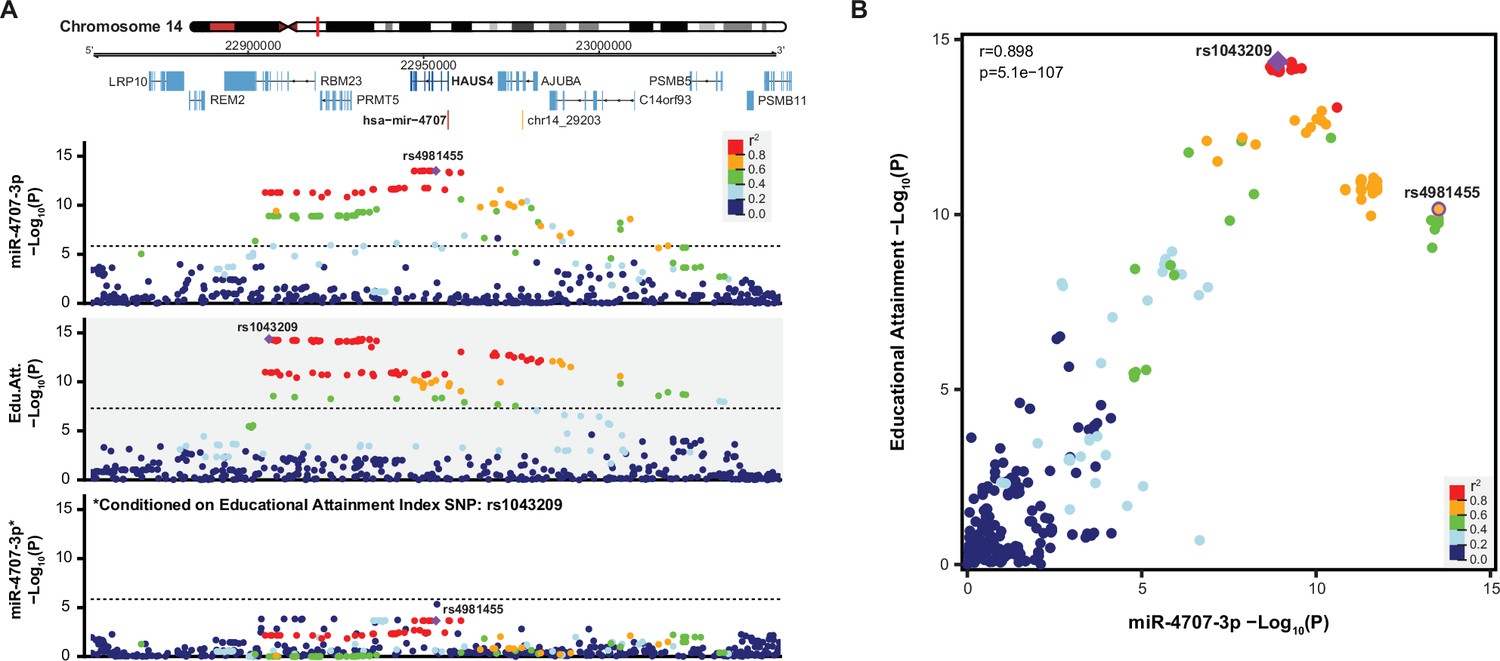
(A) A locus dot-plot surrounding hsa-mir-4707 on chromosome 14 showing -Log10(p-value) as in Figure 5A. Top track shows associations for expression of miR-4707–3p with the index variant, rs4981455. Variants are colored by LD to rs4981455 within the diverse ancestry population of this study. The second track shows associations to educational attainment and the index variant, rs1043209. Variants in this locus are colored by LD to rs1043209 within the 1000 Genomes European populations. The bottom track shows associations for miR-4707–3p expression after including rs1043209 genotypes in the regression equation. Dotted lines in the top and bottom tracks represent a stringent p-value significance threshold of 1.43x10⁻⁶. Dotted line in the middle track represents the global genome-wide significance threshold of 5x10⁻⁸. (B) Association p-values from the first and second track in panel A are plotted against each other. Variants are colored by LD to the educational attainment index variant, rs1043209, using the diverse ancestry population of this study. Index variant for miR-4707–3p expression, rs4981455, is also labeled. Pearson correlation coefficient of 0.898 with p-value of 5.1x10–107 show a significant correlation between variants in both datasets.
Figure 6 with 2 supplements
MiR-4707–3p overexpression in differentiating phNPCs.
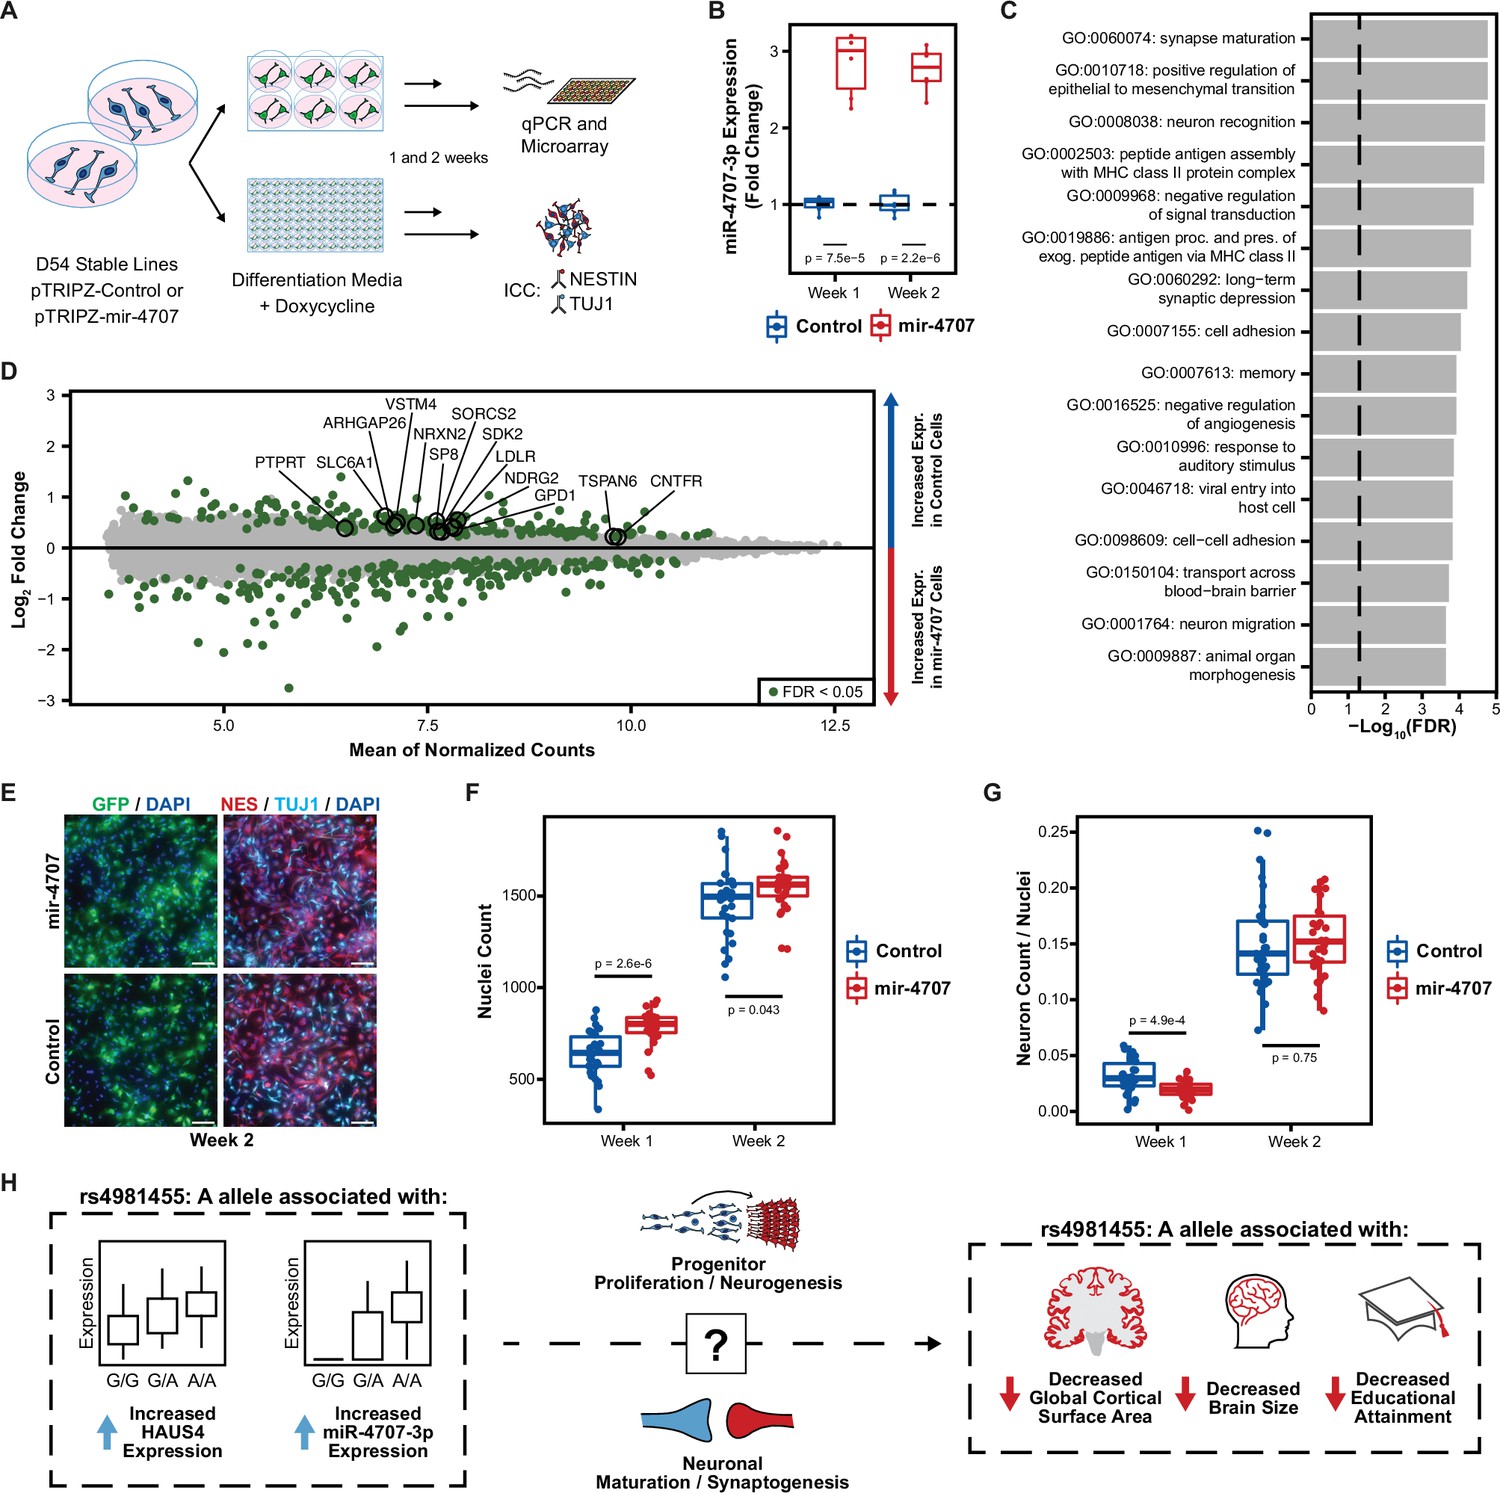
(A) Experiment overview. Primary human neural progenitor cells (phNPCs) from donor 54 (D54, genotype G/G at rs4981455) were transduced with pTRIPZ-mir-4707-EGFP (mir-4707) or a control pTRIPZ-EGFP and selected with puromycin to form stable lines in proliferation media. Stable lines were then plated in 6-well and 96-well plates into differentiation media with doxycycline to induce expression of miR-4707-3p+EGFP or control (EGFP only). At 1 and 2 weeks post plating in differentiation media, RNA was extracted from 6-well plates for qPCR and microarray experiments, and 96-well plates were fixed for ICC. (B) At 1 and 2 weeks post plating in differentiation media, D54 cells transduced with mir-4707 showed increased expression of miR-4707–3p as compared to control cell lines. p-Values from a two-sided t-test on 6 samples (wells) per condition. (C) Gene ontology analysis using all differentially expressed genes between mir-4707 and control cells at week 2 as seen in D. Enrichment p-values corrected by FDR. Dotted line represents an FDR corrected p-value of 0.05. (D) Differential mRNA expression between mir-4707 cells and control cells as measured by microarray assay at week 2. Positive log2 fold change indicates increased expression in control cells and decreased expression in mir-4707 cells. Selected genes are computationally predicted to be targets of miR-4707–3p and were down-regulated in mir-4707 cells at both 1 and 2 weeks. (E) Representative images from D54, week 2, mir-4707 and control cell lines stained with GFP, the neural progenitor marker NESTIN (NES), the neuronal marker TUJ1, and nuclear stain DAPI. Scale bars 100 μm. (F) DAPI stained nuclei per well at 1 and 2 weeks showed increased number of nuclei in mir-4707 cell lines as compared to control lines. p-Values from a two-sided t-test on 30 technical replicates (wells) per condition. (G) The fraction of neurons (cells labeled with higher TUJ1 expression as compared to NESTIN expression while also being GFP positive, see Methods) showed fewer neurons in mir-4707 lines at week 1 but no differences at week 2. p-Values from a two-sided t-test on 30 technical replicates (wells) per condition. (H) Summary of the genetic associations between rs4981455 and expression of HAUS4, expression of miR-4707–3p, global cortical surface area, brain size, and educational attainment. The molecular mechanism by which miR-4707–3p influences downstream traits may be mediated through neural progenitor fate decisions, neuronal maturation, or synaptogenesis. However, the colocalization of genetic associations between the molecular traits and the brain phenotypes may also be a result of confounding, pleiotropy, or other mechanisms yet to be investigated.
Figure 6—figure supplement 1
MiR-4707–3p overexpression in proliferating phNPCs.
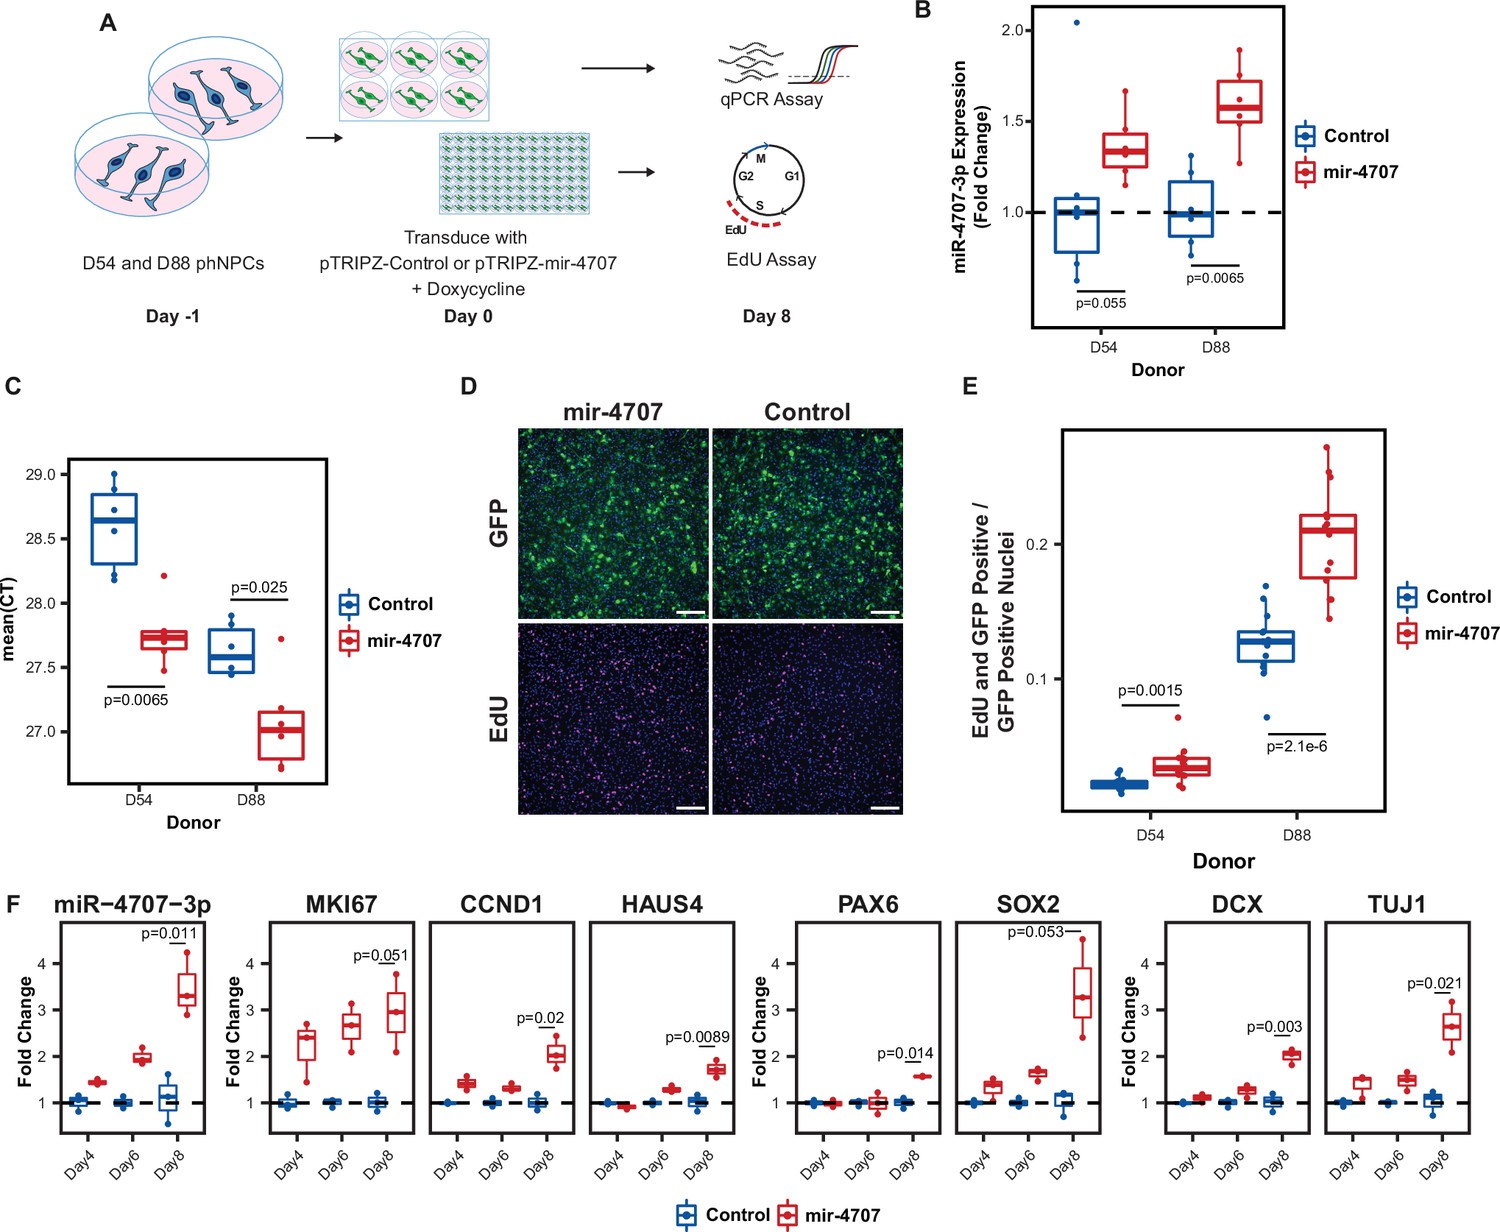
(A) Experiment overview. Primary human neural progenitor cells (phNPCs) from two donor lines (D54, genotype G/G at rs4981455, D88, genotype A/A at rs4981455) were maintained in proliferation media with growth factors that retain the phNPCs in a proliferative state and prevent differentiation into neurons. At day –1, cells were plated into 6-well and 96-well plates. The next day, day zero, cells are transduced with pTRIPZ-mir-4707-EGFP (pTRIPZ-mir-4707) or a control pTRIPZ-EGFP (pTRIPZ-Control). Addition of doxycycline in the proliferation media turns on mir-4707 and EGFP expression. Cells were assayed at eight days post transduction. (B) At 8 days post transduction, D54 and D88 transduced with pTRIPZ-mir-4707 showed an increase of miR-4707–3p expression over cells transduced with control virus. p-Values from a two-sided t-test on 6 samples per condition. (C) Mean qPCR cycle threshold (CT) values for D54 and D88 cells transduced with pTRIPZ-mir-4707 or control. D88 (genotype A/A at rs4981455) showed greater miR-4707–3p expression than D54 (genotype G/G at rs4981455). However, both lines expressed minimal amounts of miR-4707–3p despite tissue samples with G/G genotypes showing no expression of miR-4707–3p. p-Values from a two-sided t-test on 6 samples per condition. (D) GFP signal in both pTRIPZ-mir-4707 and pTRIPZ-Control at eight days post transduction. EdU pulse labeled nuclei also at 8 days post transduction. Nuclei in all four images are also stained with DAPI (blue signal). Scale bars 200 μm. (E) Proliferation assay using EdU pulse labeled cells. Both D54 and D88 cells transduced with pTRIPZ-mir-4707 showed an increased number of nuclei stained with both EdU and GFP. Each well was normalized for the total number of GFP-positive nuclei. p-values from a two-sided t-test on 14 technical replicates (wells) per condition. (F) Time course experiment using D88 cells transduced with pTRIPZ-mir-4707 or control virus as in A, but assayed at 4, 6, and 8 days post transduction. Gene expression measured with qPCR shows increased miR-4707–3p in cells transduced with pTRIPZ-mir-4707 over pTRIPZ-Control. Increased expression is also seen in the proliferation markers (MKI67, CCND1, and HAUS4), the progenitor markers (PAX6 and SOX2), and the neuronal markers (DCX and TUJ1). p-Values from a two-sided t-test on fold changes between samples transduced with pTRIPZ-mir-4707 and pTRIPZ-Control at 8 days post transduction for three samples in each condition.
Figure 6—figure supplement 2
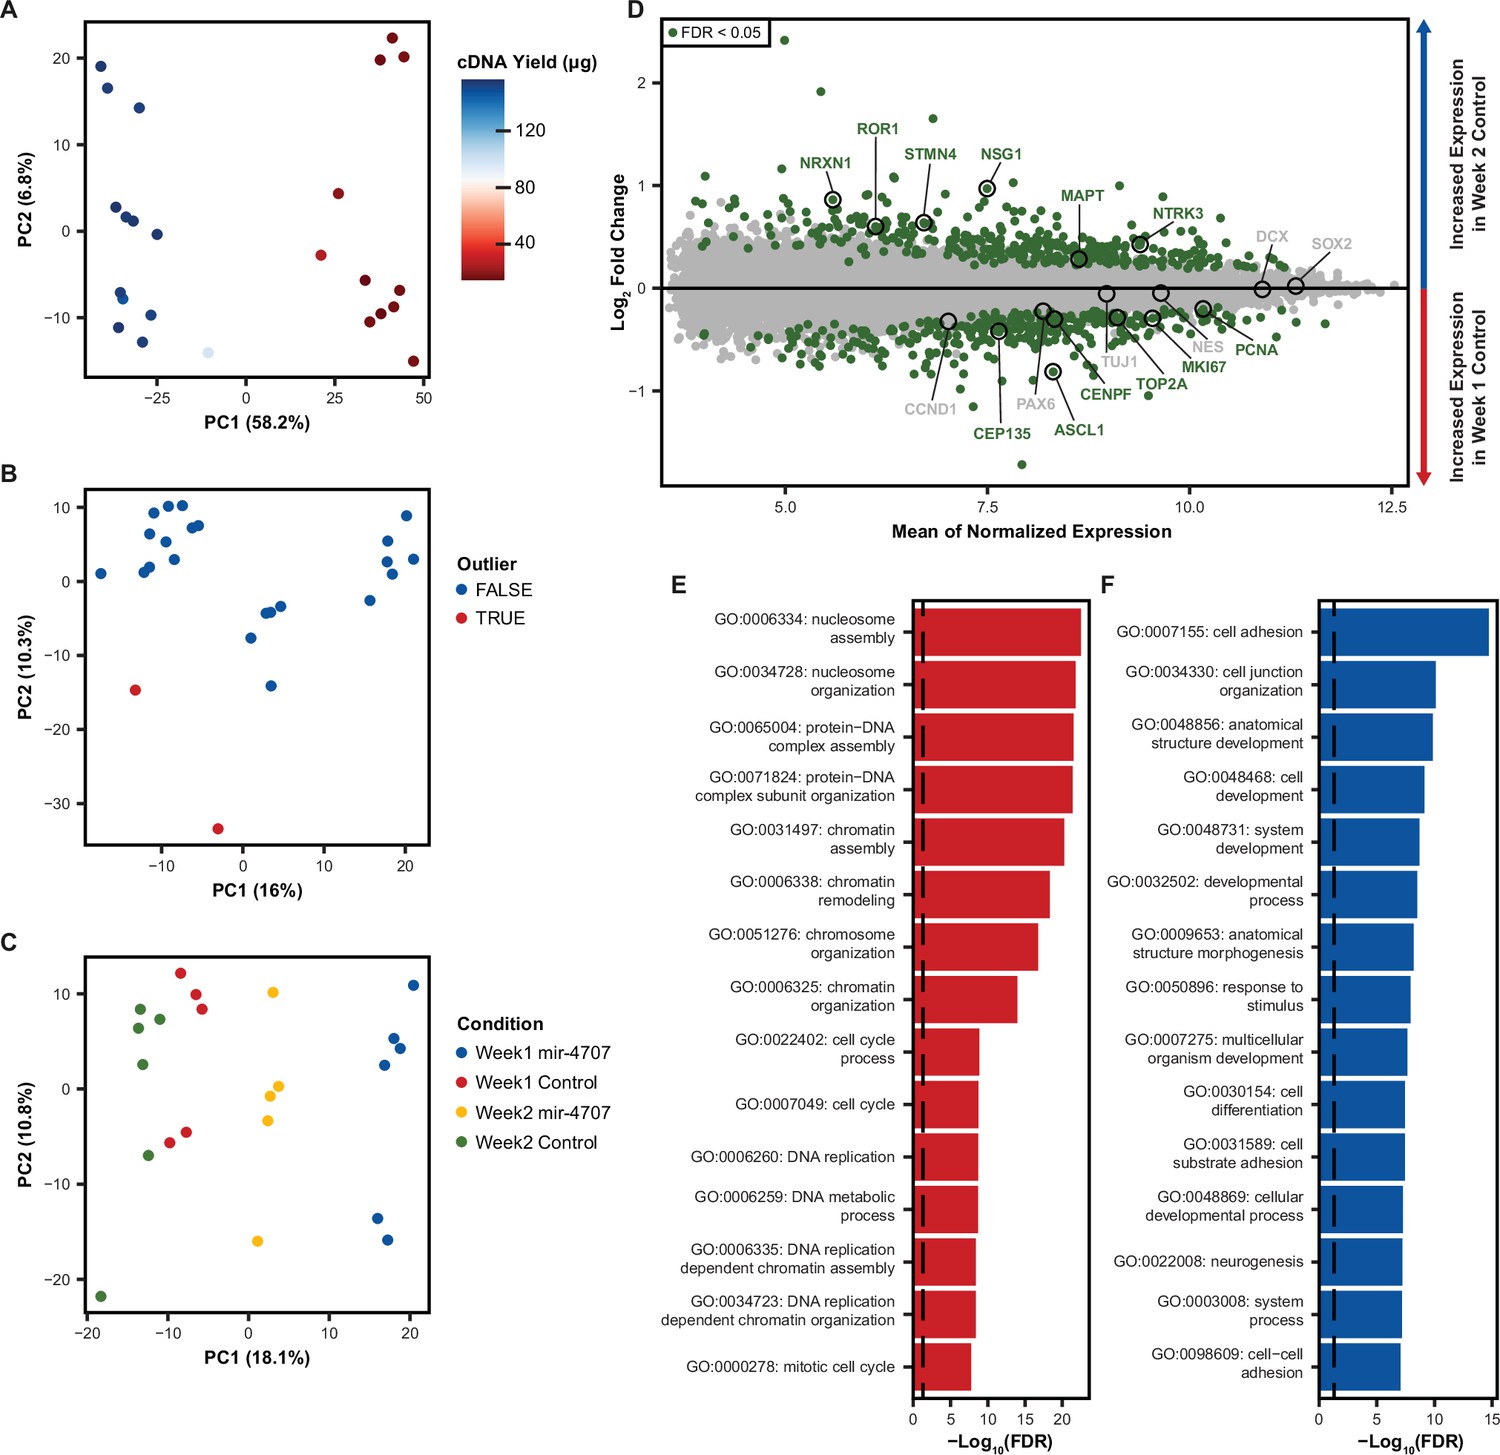
Microarray expression in differentiating phNPCs.
(A) Principal component analysis (PCA) on uncorrected mRNA expression as measured by microarray on mir-4707 and control cell lines at 1 and 2 weeks post plating in differentiation media. The primary source of variation (PC1) is associated with a technical variable, cDNA yield measured during sample preparation. (B) After correcting global mRNA expression for cDNA yield using a linear model, PCA revealed two sample outliers that were removed before proceeding with differential expression analysis. (C) PCA after outlier removal and correcting for cDNA yield showed samples primarily segregating by expression of mir-4707 and time point. (D) Differential mRNA expression analysis between week 1 and week 2 control samples showed an increase in neuron associated genes in week 2 samples and an increase in progenitor associated genes in week 1 samples. (E) Gene ontology analysis on differentially expressed genes upregulated in week 1 control cells as compared to week 2 control cells. Enrichment p-values corrected by FDR. Dotted line represents an FDR corrected p-value of 0.05. (F) Gene ontology analysis on differentially expressed genes upregulated in week 2 control cells as compared to week 1 control cells. Enrichment p-values corrected by FDR. Dotted line represents an FDR corrected p-value of 0.05.
Tables
Key resources table
| Reagent type (species) or resource | Designation | Source or reference | Identifiers | Additional information |
|---|---|---|---|---|
| Biological sample (Homo-sapiens) | Prenatal cortical tissue | UCLA Gene and Cell Therapy Core | ||
| Commercial assay or kit | miRNeasy-mini | QIAGEN | 217004 | |
| Commercial assay or kit | TruSeq Small RNA Library Prep Kits | Illumina | RS-200 | |
| Commercial assay or kit | TruSeq Stranded RNA Library Prep Kits | Illumina | 20020597 | |
| Software, algorithm | miRge 2.0 | DOI https://doi.org/10.1186/s12859-018-2287-y | ||
| Software, algorithm | miRDeep2 | DOI https://doi.org/10.1093/nar/gkr688 | ||
| Software, algorithm | Bowtie | DOI https://doi.org/10.1038/nmeth.1923 | v1.2.2 | |
| Software, algorithm | featureCounts | DOI https://doi.org/10.1093/bioinformatics/btt656 | ||
| Software, algorithm | STAR | DOI https://doi.org/10.1093/bioinformatics/bts635 | v2.5.4b | |
| Software, algorithm | PLINK | DOI https://doi.org/10.1186/s13742-015-0047-8 | v1.9 | |
| Software, algorithm | McCarthy Group’s HRC-1000G imputation preparation tool | https://www.well.ox.ac.uk/~wrayner/tools/ | ||
| Software, algorithm | Michigan Imputation Server | DOI https://doi.org/10.1038/ng.3656 | ||
| Software, algorithm | VerifyBamID | DOI https://doi.org/10.1016/j.ajhg.2012.09.004 | v1.1.3 | |
| Software, algorithm | DESeq2 | DOI https://doi.org/doi:10.18129/B9.bioc.DESeq2 | ||
| Software, algorithm | limma | DOI https://doi.org/doi:10.18129/B9.bioc.limma | ||
| Software, algorithm | EMMAX | DOI https://doi.org/10.1038/ng.548 | ||
| Software, algorithm | eigenMT | DOI https://doi.org/10.1016/j.ajhg.2015.11.021 | ||
| Software, algorithm | Summary-data-based Mendelian Randomization | DOI https://doi.org/10.1038/ng.3538 | ||
| Software, algorithm | GARFIELD | DOI https://doi.org/10.1038/s41588-018-0322-6 | v2 | |
| Software, algorithm | qvalue | DOI https://doi.org/doi:10.18129/B9.bioc.qvalue | ||
| Software, algorithm | RMA | DOI https://doi.org/10.1093/bioinformatics/btq431 | ||
| Software, algorithm | topGO | DOI https://doi.org/doi:10.18129/B9.bioc.topGO | ||
| Recombinant DNA reagent | pTRIPZ (plasmid) | ThermoFisher | RHS4750 | |
| Recombinant DNA reagent | pTRIPZ-EGFP (plasmid) | This paper | RFP of original pTRIPZ replaced with EGFP | |
| Recombinant DNA reagent | pTRIPZ-mir-4707-EGFP (plasmid) | This paper | mir-4707 primary sequence cloned into pTRIPZ-EGFP | |
| Recombinant DNA reagent | PAX2 (plasmid) | Addgene | 12260 | |
| Recombinant DNA reagent | pMD2.G | Addgene | 12259 | |
| Commercial assay or kit | qPCR Lentivirus Titration Kit | Applied Biological Materials | LV900 | |
| Commercial assay or kit | FUGENE HD | Promega | E2311 | |
| Cell line (Homo-sapiens) | HEK293T | ATCC | CRL-11268 | |
| Cell line (Homo-sapiens) | Donor 54 | This paper | D54 | primary human neural progenitor cells (male) |
| Cell line (Homo-sapiens) | Donor 88 | This paper | D88 | primary human neural progenitor cells (male) |
| Chemical compound, drug | DMEM | Life Technologies | 11995081 | |
| Chemical compound, drug | FBS | Sigma-Aldrich | F2442 | |
| Chemical compound, drug | Antibiotic-Antimycotic | Life Technologies | 15240096 | |
| Chemical compound, drug | Growth Factor Reduced Matrigel | Corning | 354230 | |
| Chemical compound, drug | Neurobasal A | Life Technologies | 10888–022 | |
| Chemical compound, drug | Primocin | Invivogen | ant-pm-2 | |
| Chemical compound, drug | BIT 9500 | Stemcell Technologies | 9500 | |
| Chemical compound, drug | Glutamax | Life Technologies | PHG0313 | |
| Chemical compound, drug | Heparin | Sigma-Aldrich | H3393-10KU | |
| Chemical compound, drug | EGF | Life Technologies | PHG0313 | |
| Chemical compound, drug | FGF | Life Technologies | PHG0023 | |
| Chemical compound, drug | LIF | Life Technologies | PHC9481 | |
| Chemical compound, drug | PDGF | Life Technologies | PHG1034 | |
| Chemical compound, drug | Trypsin-EDTA | Life Technologies | 25300062 | |
| Chemical compound, drug | Doxycycline | Sigma-Aldrich | D9891 | |
| Chemical compound, drug | B27 | Life Technologies | 17504–044 | |
| Chemical compound, drug | NT-3 | Life Technologies | PHC7036 | |
| Chemical compound, drug | BDNF | Life Technologies | PHC7074 | |
| Commercial assay or kit | Dnase | QIAGEN | 79254 | |
| Commercial assay or kit | iScript cDNA Synthesis Kit | Bio-Rad | 1708891 | |
| Commercial assay or kit | TaqMan Advanced miRNA cDNA Synthesis Kit | ThermoFisher | A28007 | |
| Commercial assay or kit | SsoAdvanced Universal SYBR Green Supermix | Bio-Rad | 1725271 | |
| Commercial assay or kit | TaqMan Advanced miRNA Assays | ThermoFisher | A25576 | |
| Commercial assay or kit | TaqMan Fast Advanced Master Mix | ThermoFisher | 4444557 | |
| Commercial assay or kit | Clariom S Pico Assay | ThermoFisher | 902963 | |
| Commercial assay or kit | Click-iT EdU Imaging Kit (AF647) | Invitrogen | C10340 | |
| Chemical compound, drug | Paraformaldehyde in PBS | FisherScientific | 50-980-487 | |
| Chemical compound, drug | Triton X-100 | Sigma-Aldrich | T8787 | |
| Chemical compound, drug | Goat serum | MP Biomedicals | 219135680 | |
| Chemical compound, drug | Tween-20 | FisherScientific | BP337500 | |
| Antibody | anti-GFP (chicken polyclonal) | FisherScientific | AB16901 | (1:500) |
| Antibody | anti-chicken-AF488 (goat polyclonal) | ThermoFisher | A11011 | (1:1000) |
| Antibody | anti-NESTIN (rabbit polyclonal) | Millipore | ABD69 | (1:500) |
| Antibody | anti-TUJ1 (mouse monoclonal) | BioLegend | 801202 | (1:1000) |
| Antibody | anti-rabbit-AF568 (goat polyclonal) | ThermoFisher | A11036 | (1:1000) |
| Antibody | anti-mouse-AF750 (goat polyclonal) | ThermoFisher | A21037 | (1:1000) |
| Chemical compound, drug | DAPI | ThermoFisher | 62248 |
Additional files
-
Supplementary file 1
Expressed known and novel miRNAs.
UNIQUE_NAME: combination of primary-miRNA and mature-miRNA name to create a unique identifier for miRNAs with the same sequence that originate from multiple genomic loci. ID: miRBase ID, NAME for non-miRBase miRNAs. ALIAS: miRBase alias, NAME for non-miRBase miRNAs. NAME: miRBase name, for non-miRBase miRNAs the identifier given in the respective publications or identifier given by miRge2.0 or miRDeep2 packages. DERIVES_FROM: ID of primary-miRNA. DERIVES_FROM_NAME: NAME of primary-miRNA. SOURCE: miRBase_v22 for known miRNAs cataloged in miRBase release 22. Friedlander2014 or Nowakowski2018 for novel miRNAs reported in those respective publications. miRge or miRDeep2 for novel miRNAs discovered in this study. TYPE: miRNA for mature miRNAs in miRBase, miRNA_putative_mature or miRNA_putative_star for novel miRNAs. SCORE: NA for miRBase and Nowakowski2018 miRNAs. Friedlander2014 miRNAs reported a confidence score 1–4. miRge quality scores 0–1. miRDeep2 scores ≥ 0. CHR: chromosome where the mature miRNA is located. START_hg38: start base-pair position for mature miRNA using hg38. END_hg38: end base-pair position for the mature miRNA using hg38. WIDTH: base-pair width of the mature miRNA. STRAND: genomic strand of the mature miRNA. SEQUENCE: miRNA sequence. MEAN_VST_EXPRESSION: mean variance-stabilizing transformation expression.
- https://cdn.elifesciences.org/articles/79488/elife-79488-supp1-v2.xlsx
-
Supplementary file 2
Differentially expressed known and novel miRNAs.
BASE_MEAN: mean expression as reported by DESeq2. LOG2_FOLD_CHANGE: log2 transformed fold-change as reported by DESeq2 on the treatment variable, gestation week. Positive values indicate enrichment within late gestation week tissues. Negative values indicate enrichment within early gestation week tissue. LFC_SE: standard error on fold change as reported by DESeq2. PVALUE: p-value as reported by DESeq2. PADJ: Benjamini-Hochberg adjusted p-value as reported by DESeq2. SIGNIFICANT: logical, TRUE if PADJ is below 0.1. NAME: same as in Supplementary file 1. ID: same as in Supplementary file 1. ALIAS: same as in Supplementary file 1. DERIVES_FROM: same as in Supplementary file 1. SOURCE: same as in Supplementary file 1. TYPE: same as in Supplementary file 1. SCORE: same as in Supplementary file 1. SEQUENCE: same as in Supplementary file 1.
- https://cdn.elifesciences.org/articles/79488/elife-79488-supp2-v2.xlsx
-
Supplementary file 3
Mid-gestation cortical tissue miRNA-eQTLs.
eQTL: unique eQTL identifier, combination of emiR and eSNP. emiR: same as UNIQUE_NAME in Supplementary file 1. eSNP: unique variant identifier, combination of chromosome, base-pair position, and variants. BETA: eQTL association effect size after fitting to the linear mixed model using EMMAX. P: nominal p-value on linear mixed model fitting using EMMAX. DEGREE: degree to which the eQTL is conditionally-independent. SNP_CHR: variant chromosome. SNP_BP_hg38: variant base-pair position using hg38. EFFECT_ALLELE: effect allele used in the linear mixed model association by EMMAX. REF: reference allele using hg38. ALT: alternate allele using hg38. ALT_CTS: alternate allele counts. Summed allelic dosage across all samples in the analysis. OBS_CT: total allele counts. Number of samples x2. A1: A1 allele as defined by plink1.9, usually minor allele. A2: A2 allele as defined by plink1.9, usually major allele. A1_HOM_COUNT: number of homozygous A1 samples. HET_COUNT: number of heterozygous samples. A2_HOM_COUNT: number of homozygous A2 samples. miR_CHR: miRNA chromosome. miR_START_hg38: miRNA start position using hg38. miR_END_hg38: miRNA end position using hg38. miR_WIDTH: miRNA width in base pairs. miR_STRAND: miRNA genomic strand. SOURCE: same as in Supplementary file 1. TYPE: same as in Supplementary file 1. ID: same as in Supplementary file 1. ALIAS: same as in Supplementary file 1. NAME: same as in Supplementary file 1. DERIVES_FROM: same as in Supplementary file 1. DERIVES_FROM_NAME: same as in Supplementary file 1. SEQUENCE: same as in Supplementary file 1. SIGNIFICANCE: label for significance threshold used to define significant eQTLs, eigenMT_fdr5percent is the stringent threshold and fdr5percent is the relaxed threshold, see Methods. NOM_P_VALUE_THRESHOLD: nominal p-value threshold used to define significant eQTLs.
- https://cdn.elifesciences.org/articles/79488/elife-79488-supp3-v2.xlsx
-
Supplementary file 4
Colocalizations.
Sheet1: miRNA-eQTL/mRNA-eQTL colocalizations. Columns with.mirQTL suffix refer to the miRNA-eQTL analysis while.mQTL refer to the mRNA-eQTL analysis (Aygün et al., 2021; Walker et al., 2019). eQTL.mirQTL: unique miRNA-eQTL identifier, combination of emiR and eSNP. emiR.mirQTL: same as UNIQUE_NAME in Supplementary file 1. eSNP.mirQTL: unique variant identifier, combination of chromosome, base-pair position, and variants. BETA.mirQTL: eQTL association effect size after fitting to the linear mixed model using EMMAX. P.mirQTL: nominal p-value on linear mixed model fitting using EMMAX. DEGREE.mirQTL: degree to which the eQTL is conditionally-independent.SNP.CHR.mirQTL: variant chromosome. SNP.BP.hg38.mirQTL: variant base-pair position using hg38. EFFECT.ALLELE.mirQTL: effect allele used in the linear mixed model association by EMMAX. REF.mirQTL: reference allele using hg38. ALT.mirQTL: alternate allele using hg38. SIGNIFICANCE.mirQTL: label for significance threshold used to define significant eQTLs, eigenMT_fdr5percent is the stringent threshold and fdr5percent is the relaxed threshold, see Methods. SNP.mQTL: variant identifier. ENSG.mQTL: Ensembl gene ID. BETA.mQTL: mRNA-eQTL beta value. P.mQTL: mRNA-eQTL p-value. CHR.mQTL: variant chromosome. BP.mQTL: variant base-pair position on hg38. RANK.mQTL: conditional analysis rank. BETA.CONDITIONAL.mQTL: beta after conditioning. P.CONDITIONAL.mQTL: p-value after conditioning. ALLELE_MINOR.mQTL: minor allele in the mRNA-eQTL dataset. ALLELE_MAJOR_EFFECT.mQTL: effect allele. Major allele in the mRNA-eQTL dataset. eQTL.mQTL: unique mRNA-eQTL identifier, combination of SNP.mQTL and ENSG.mQTL. Sheet2: miRNA-eQTL/mRNA-sQTL colocalizations. Columns with.mirQTL suffix refer to the miRNA-eQTL analysis while.mQTL refer to the mRNA-sQTL analysis (Aygün et al., 2021; Walker et al., 2019). eQTL.mirQTL: see Sheet 1. emiR.mirQTL: see Sheet 1. eSNP.mirQTL: see Sheet 1. BETA.mirQTL: see Sheet 1. P.mirQTL: see Sheet 1. DEGREE.mirQTL: see Sheet 1. SNP.CHR.mirQTL: see Sheet 1. SNP.BP.hg38.mirQTL: see Sheet 1. EFFECT.ALLELE.mirQTL: see Sheet 1. REF.mirQTL: see Sheet 1. ALT.mirQTL: see Sheet 1. SIGNIFICANCE.mirQTL: see Sheet 1. snp.mQTL: unique variant identifier, combination of chromosome, base-pair position, and variants. intron.mQTL: unique intron identifier, combination of chromosome, base-pair start and end positions, and cluster identifier. beta.mQTL: mRNA-sQTL beta value. pvalue.mQTL: mRNA-sQTL p-value. chr.mQTL: sQTL chromosome. rank.mQTL: degree to which the sQTL is conditionally independent. cond.beta.mQTL: mRNA-sQTL beta value at conditional rank. cond.pval.mQTL: mRNA-sQTL p-value at conditional rank. clusterID.mQTL: unique cluster identifier. gene.mQTL: gene symbol. ensemblID.mQTL: Ensembl gene ID. transcripts.mQTL: Ensembl transcript ID. BP.mQTL: sQTL base-pair. rsid.mQTL: rsid of sQTL. Sheet3: miRNA-eQTL brain/blood colocalizations eQTL.mirQTL: see Sheet 1. emiR.mirQTL: see Sheet 1. eSNP.mirQTL: see Sheet 1. BETA.mirQTL: see Sheet 1. P.mirQTL: see Sheet 1. DEGREE.mirQTL: see Sheet 1. SNP.CHR.mirQTL: see Sheet 1. SNP.BP.hg38.mirQTL: see Sheet 1. EFFECT.ALLELE.mirQTL: see Sheet 1. REF.mirQTL: see Sheet 1. ALT.mirQTL: see Sheet 1. SIGNIFICANCE.mirQTL: see Sheet 1. NOM.P.VALUE.THRESH.mirQTL: see Sheet 1. snpID.bloodQTL: rsid for blood eQTL. Estimate.bloodQTL: blood eQTL beta. Pval.bloodQTL: blood eQTL p-value. hsa_miR_name.bloodQTL: miRBase miRNA name. effect.bloodQTL: effect variant for blood eQTL. noneffect.bloodQTL: non-effect variant for blood eQTL. Sheet4: GWAS data sources TRAIT: trait or disorder name. PMID: PubMed ID for published article associated with each dataset. DATA_LINK: link to data download site.
- https://cdn.elifesciences.org/articles/79488/elife-79488-supp4-v2.xlsx
-
Supplementary file 5
qPCR primers.
GENE: gene name. NCBI_GENE_ID: NCBI gene ID. PRIMER_BANK_ID: primer bank ID. AMPLICON_SIZE: distance between forward and reverse primer on gene transcript. FORWARD_PRIMER: forward primer. REVERSE_PRIMER: reverse primer.
- https://cdn.elifesciences.org/articles/79488/elife-79488-supp5-v2.xlsx
-
Supplementary file 6
Differentially expressed genes in phNPCs.
Sheet1: Expression in Week1: microarray differential gene expression associated with over-expression of miR-4707–3p at week 1. PROBEID: pd.clariom.s.human.ht probe IDs. SYMBOL: gene symbol. GENENAME: gene name. ENSEMBL: Ensembl gene ID. ENTREZID: Entrez gene ID. duplicate.annotation: TRUE if probe ID is associated with more than one ensembl gene id. logFC: log-fold-change values as reported by limma. Positive values represent increased expression in control samples relative to mir-4707 samples. AveExpr: average normalized expression. t: absolute t-statistic as reported by limma. P.Value: raw p-values as reported by limma. adj.P.Val: Benjamini-Hochberg adjusted p-value as reported by limma. B: B-statistic as reported by limma. Sheet2: Expression in Week2: microarray differential gene expression associated with over-expression of miR-4707–3p at week 2. PROBEID: pd.clariom.s.human.ht probe IDs. SYMBOL: gene symbol. GENENAME: gene name. ENSEMBL: Ensembl gene ID. ENTREZID: Entrez gene ID. duplicate.annotation: TRUE if probe ID is associated with more than one ensembl gene id. logFC: log-fold-change values as reported by limma. Positive values represent increased expression in control samples relative to mir-4707 samples. AveExpr: average normalized expression. t: absolute t-statistic as reported by limma. P.Value: raw p-values as reported by limma. adj.P.Val: Benjamini-Hochberg adjusted p-value as reported by limma. B: B-statistic as reported by limma. Sheet3: Diff in Control: microarray differential gene expression associated with differentiation (week1 vs week2) in control samples. PROBEID: pd.clariom.s.human.ht probe IDs.SYMBOL: gene symbol. GENENAME: gene name. ENSEMBL: Ensembl gene ID. ENTREZID: Entrez gene ID. duplicate.annotation: TRUE if probe ID is associated with more than one ensembl gene id. logFC: log-fold-change values as reported by limma. Positive values represent increased expression in week 2 control samples relative to week 1 control samples. AveExpr: average normalized expression. t: absolute t-statistic as reported by limma. P.Value: raw p-values as reported by limma. adj.P.Val: Benjamini-Hochberg adjusted p-value as reported by limma. B: B-statistic as reported by limma. Sheet4: Diff in 4707: microarray differential gene expression associated with differentiation (week1 vs week2) in miR-4707–3p over-expression samples. PROBEID: pd.clariom.s.human.ht probe IDs. SYMBOL: gene symbol. GENENAME: gene name. ENSEMBL: Ensembl gene ID. ENTREZID: Entrez gene ID. duplicate.annotation: TRUE if probe ID is associated with more than one ensembl gene id. logFC: log-fold-change values as reported by limma. Positive values represent increased expression in week 2 mir-4707 samples relative to week 1 mir-4707 samples. AveExpr: average normalized expression. t: absolute t-statistic as reported by limma. P.Value: raw p-values as reported by limma. adj.P.Val: Benjamini-Hochberg adjusted p-value as reported by limma. B: B-statistic as reported by limma.
- https://cdn.elifesciences.org/articles/79488/elife-79488-supp6-v2.xlsx
-
MDAR checklist
- https://cdn.elifesciences.org/articles/79488/elife-79488-mdarchecklist1-v2.docx
Download links
A two-part list of links to download the article, or parts of the article, in various formats.
Downloads (link to download the article as PDF)
Open citations (links to open the citations from this article in various online reference manager services)
Cite this article (links to download the citations from this article in formats compatible with various reference manager tools)
MicroRNA-eQTLs in the developing human neocortex link miR-4707-3p expression to brain size
eLife 12:e79488.
https://doi.org/10.7554/eLife.79488


