Melanopsin activates divergent phototransduction pathways in intrinsically photosensitive retinal ganglion cell subtypes
- Department of Neurobiology, Northwestern University, United States
- Northwestern University Interdisciplinary Biological Sciences Program, Northwestern University, United States
- Northwestern University Interdepartmental Neuroscience Program, Northwestern University, United States
- Laboratory of Signal Transduction, National Institute of Environmental Health Sciences, United States
- Institute of Biomedical Research (BIOMED), Catholic University of Argentina, Argentina
- Department of Ophthalmology, Feinberg School of Medicine, United States
Figures
Figure 1 with 1 supplement
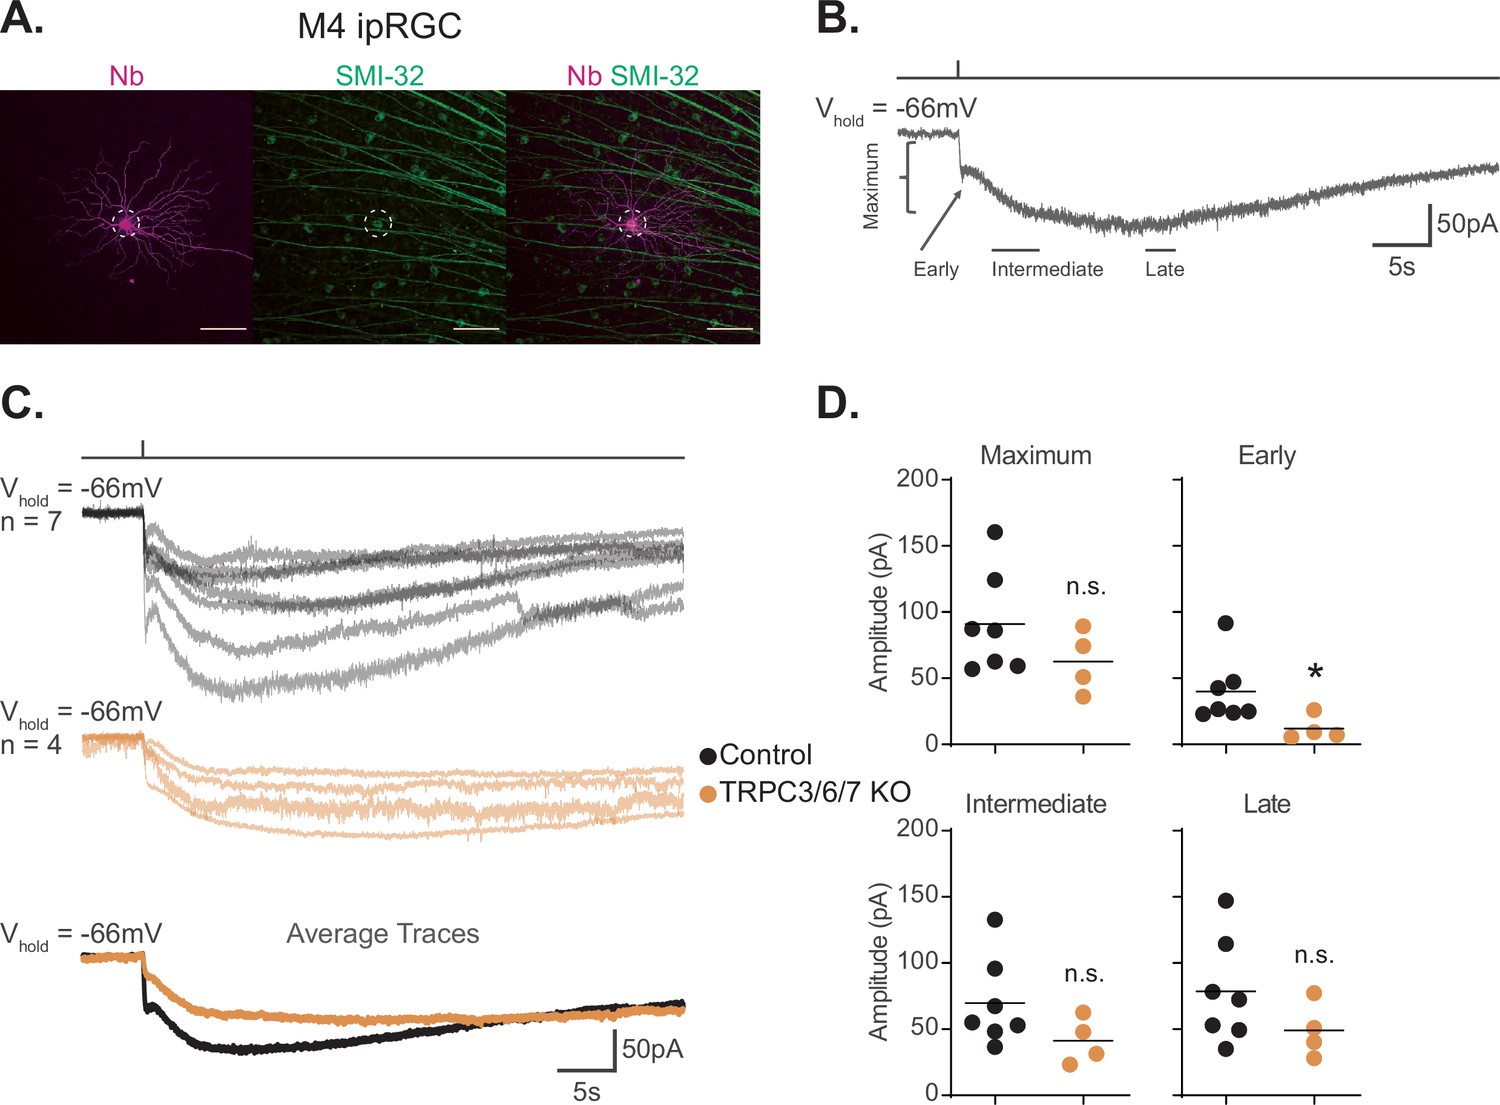
TRPC3/6/7 channels make a detectable, but minor, contribution to the melanopsin photocurrent in M4 intrinsically photosensitive retinal ganglion cells (ipRGCs).
(A) M4 ipRGC filled with Neurobiotin (Nb, magenta) in a Control retina and immunolabeled for the M4 marker SMI-32 (green). Right panel shows merged image of overlap, M4 cell outlined with white dotted circle. Scale bar 100 µm. (B) Example whole-cell voltage-clamp recording of M4 ipRGC photocurrent in a Control retina stimulated by a 50 ms, full-field 480 nm light (6.08 × 10¹⁵ photons · cm–2 · s–1) pulse in the presence of synaptic blockers. The trace is labeled with the Maximum, Early, Intermediate, and Late components used in the analysis (see ‘Materials and methods’). (C) Individual light responses of Control (top row, black, n = 7) and TRPC3/6/7 KO (middle row, orange, n = 4) M4 ipRGCs. The bottom row are the overlaid averages of M4 Control (black) and TRPC3/6/7 KO (orange) light response. (D) The absolute values of the current amplitudes for light responses in panel (C) are quantified. The graphs for the Maximum, Early, Intermediate, and Late components compare the current amplitude for Control (black, n = 7) and TRPC3/6/7 KO (orange, n = 4) M4 ipRGCs. The Early component of TRPC3/6/7 KO M4 ipRGCs is significantly reduced compared to Control (*p=0.0424). Recordings are in the presence of synaptic blockers. All cells were stimulated with a 50 ms flash of blue (480 nm) light (6.08 × 10¹⁵ photons · cm–2 · s–1). *p<0.05. n.s., not significant. Analysis performed using the Mann–Whitney U test (see ‘Materials and methods’). Bars in (D) indicate mean.
-
Figure 1—source data 1
Photocurrent components for Control and TRPC3/6/7 KO M4 intrinsically photosensitive retinal ganglion cells (ipRGCs).
- https://cdn.elifesciences.org/articles/80749/elife-80749-fig1-data1-v2.xlsx
Figure 1—figure supplement 1

Control and TRPC3/6/7 KO M4s have similar capacitance and input resistance.
(A) Cells were held at –66 mV followed by a 10 mV hyperpolarization step and capacitance was calculated from the trace using Ohm’s law. The capacitance of Control (black, n = 12) and TRPC3/6/7 KO (orange, n = 11) M4 cells is not significantly different. (B) The input resistance for recorded M4 intrinsically photosensitive retinal ganglion cells (ipRGCs) was quantified, and there is no significant difference between Control (black, n = 12) and TRPC3/6/7 KO (orange, n = 11) M4 cells. Analysis performed using the Mann–Whitney U test (see 'Materials and methods'). Bars in (A-B) indicate mean.
-
Figure 1—figure supplement 1—source data 1
Capacitance and input resistance values for Control and TRPC3/6/7 KO M4 cells.
- https://cdn.elifesciences.org/articles/80749/elife-80749-fig1-figsupp1-data1-v2.xlsx
Figure 2 with 2 supplements
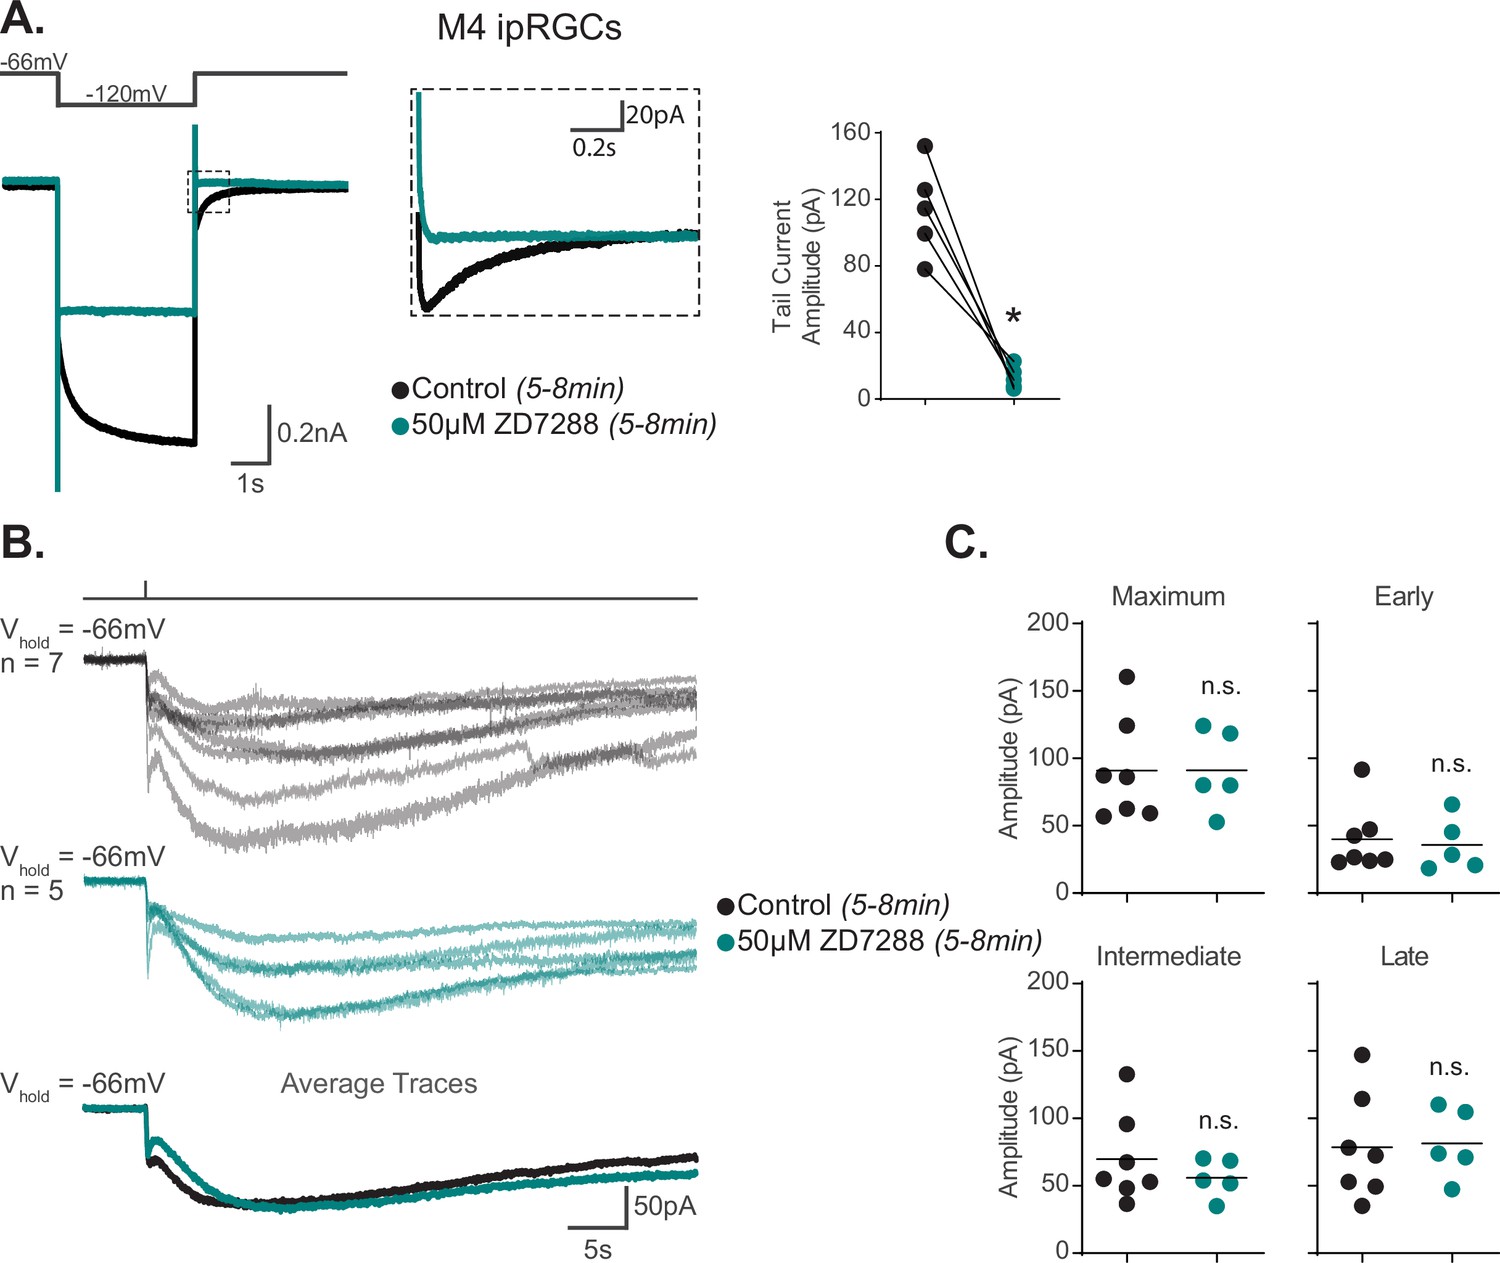
Hyperpolarization-activated cyclic nucleotide-gated (HCN) channels are not required for M4 phototransduction.
(A) Left: representative recording a typical Control M4 intrinsically photosensitive retinal ganglion cell (ipRGC) (black), hyperpolarized from –66 mV to –120 mV and stepped back to the original holding potential. Cell was then incubated for 5–8 min with 50 μM ZD7288 (teal) and subjected to the same voltage-clamp protocol. Tail currents are boxed. Middle: magnified boxed tail currents. Right: absolute value of the tail current amplitude of Control M4 cells (black, n = 5) before and after application of 50 μM ZD7288 for 5–8 min (teal, n = 5). 50 μM ZD7288 for 5–8 min successfully blocked HCN-mediated tail currents of M4 ipRGCs (p=0.0079). Analysis performed using Wilcoxon signed-rank test (see 'Materials and methods'). (B) Individual light responses of M4 cells recorded in control solution (black, n = 7) or M4 cells incubated with 50 μM ZD7288 for 5–8 min (teal, n = 5, same cells for which tail current was quantified in panel A). Bottom row shows the overlaid average light response trace for Control (black) and 50 μM ZD7288 for 5–8 min (teal) M4 cells. (C) Maximum, Early, Intermediate, and Late absolute value amplitudes of Control (black, n = 7) M4 ipRGCs or cells exposed to 5–8 min of 50 μM ZD7288 (teal, n = 5). The photocurrent of M4 cells in 5–8 min of 50 μM ZD7288 is unaffected by blockade of HCN channels as shown in by the insignificant change in all the analyzed components. n.s., not significant. Analysis performed using the Mann–Whitney U test (see 'Materials and methods'). Bars in (C) indicate mean.
-
Figure 2—source data 1
Hyperpolarization-activated cyclic nucleotide-gated (HCN) tail current and photocurrent components of M4 intrinsically photosensitive retinal ganglion cells (ipRGCs) in the 5–8 min of 50 μM ZD7288.
- https://cdn.elifesciences.org/articles/80749/elife-80749-fig2-data1-v2.xlsx
Figure 2—figure supplement 1

The M4 hyperpolarization-activated cyclic nucleotide-gated (HCN) current and tail current are not modulated by light.
(A) Control M4 intrinsically photosensitive retinal ganglion cell (ipRGC) in dark (black) hyperpolarized from –66 mV to –120 mV and stepped back to the original holding potential. The cell was then placed in 90 s of 480 nm light (6.08 × 10¹⁵ photons · cm–2 · s–1) (light gray) and subjected to the same voltage-clamp protocol. Tail currents are boxed and expanded in inset. (B) Absolute value of the tail current amplitude is plotted for M4 cells in dark (black, n = 4) and in light (gray, n = 4). There is no significant change in the tail current amplitude in light. (C) Absolute value of the HCN current amplitude is plotted for M4 cells in light (gray, n = 4) versus dark (black, n = 4). There is no significant change in the HCN inward current in light. (D) Example traces of a Control M4 ipRGC shown in (A) but without normalization for both dark (black) and light (gray). The change in holding current (ΔIhold) at –66 mV is boxed and expanded in inset. For the example traces Ihold dark = 31.28 pA and Ihold light = -27.48 pA resulting in a change in holding current of ΔIhold = –58.76 pA. (E) Change in holding current in dark versus light is plotted for individual cells in dark (black, n = 4) and in light (gray, n = 4). The holding current became more negative following light exposure, as expected with activation of melanopsin phototransduction. Recordings made in the presence of synaptic blockers. n.s., not significant. Performed statistical analysis with Wilcoxon signed-rank test (see 'Materials and methods').
-
Figure 2—figure supplement 1—source data 1
M4 hyperpolarization-activated cyclic nucleotide-gated (HCN) current and tail current in dark vs. light.
- https://cdn.elifesciences.org/articles/80749/elife-80749-fig2-figsupp1-data1-v2.xlsx
Figure 2—figure supplement 2

Prolonged application of ZD7288 reduces the M4 photocurrent via off-target effects.
(A) Control M4 intrinsically photosensitive retinal ganglion cell (ipRGC) hyperpolarized from –66 mV to –120 mV and stepped back to the original holding potential after 20 min in control solution (black, n = 5) or after 20 min incubation with 50 μM ZD7288 (blue, n = 5). Tail currents are boxed and expanded in inset. Absolute value of the tail current amplitude is plotted for each cell. The hyperpolarization-activated cyclic nucleotide-gated (HCN) tail current amplitude was significantly reduced after 20 min incubation in 50 μM ZD7288 (p=0.0079). (B) M4 photocurrent recorded after 20 min in control solution (black, n = 4) or after 20 min incubation with 50 μM ZD7288 (blue, n = 4). Bottom row: overlaid average light response trace for each group. (C) Absolute value of the Maximum, Early, Intermediate, and Late photocurrent amplitudes of M4 cells in 20 min Control solution and 20 min of 50 μM ZD7288 (blue, n = 4). The Maximum (p=0.0286), Early (p=0.0286), Intermediate (p=0.0286), and Late (p=0.0286) photocurrent amplitudes of M4 cells in 20 min of 50 μM ZD7288 are significantly reduced. This recapitulates the results noted in Jiang et al., 2018. (D) Absolute value of HCN tail currents is similar after 5–8 min or 20 min incubation with 50 μM ZD7288, indicating no further blockade of HCN channels with longer incubation. (E) Input resistance of M4 cells after 5 min in Control solution (gray, n = 5), 5–8 min of 50 μM ZD7288 (teal, n = 5), 20 min Control solution (black, n = 5), or 20 min of 50 μM ZD7288 (blue, n = 5). Input resistance significantly increased after 20 min incubation with 50 μM ZD7288 compared to 20 min in Control solution (p=0.0317). Analysis performed with Mann–Whitney U test (see 'Materials and methods'). *p<0.05. n.s., not significant. Bars in (A,C-E) indicate mean.
-
Figure 2—figure supplement 2—source data 1
Hyperpolarization-activated cyclic nucleotide-gated (HCN) tail current and photocurrent components of M4 intrinsically photosensitive retinal ganglion cells (ipRGCs) in the 20 min of 50 μM ZD7288.
- https://cdn.elifesciences.org/articles/80749/elife-80749-fig2-figsupp2-data1-v2.xlsx
Figure 3
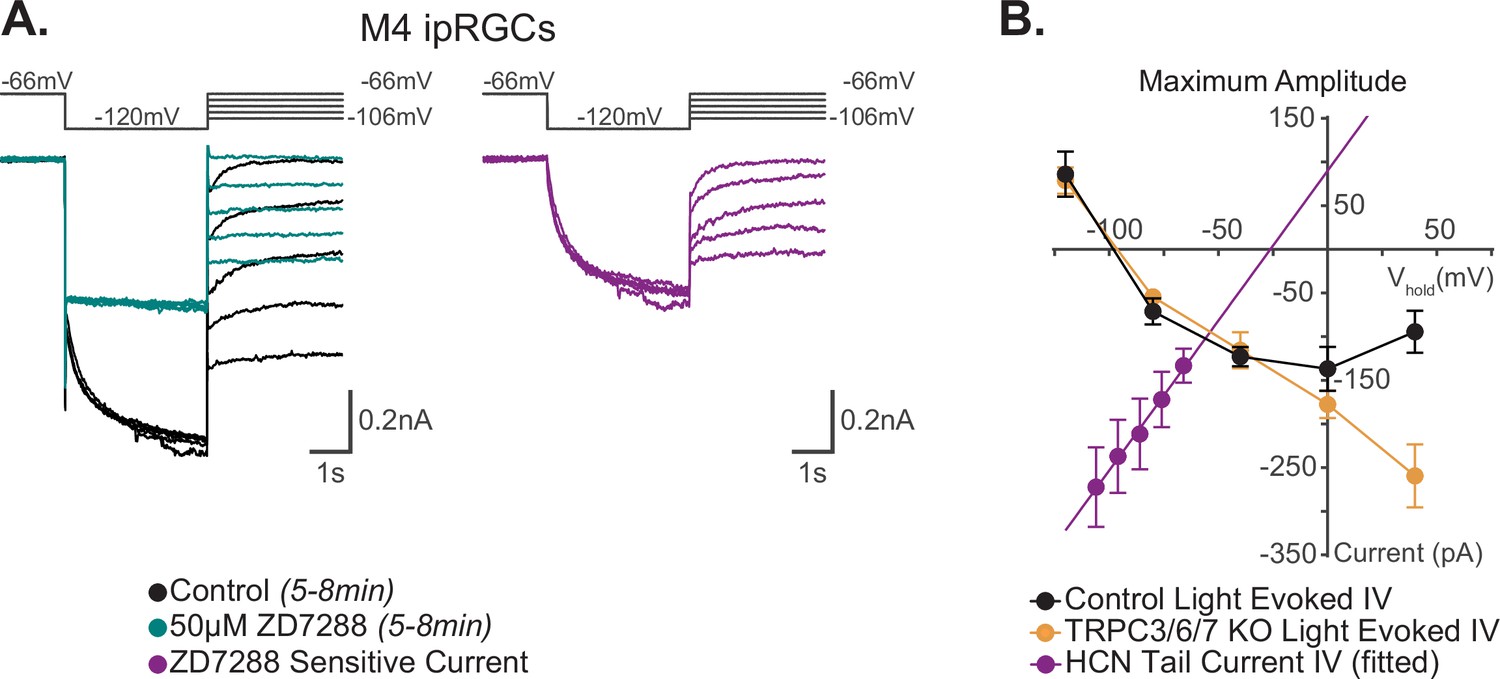
I–V relationship of M4 photocurrent reversal is distinct from extrapolated M4 hyperpolarization-activated cyclic nucleotide-gated (HCN) tail current reversal.
(A) Left: example Control (black) M4 cell hyperpolarized to –120 mV to activate HCN channels followed by a step to various test potentials ranging from –106 mV to –66 mV. The voltage protocol is then repeated in the same cell following 50 μM ZD7288 for 5–8 min (teal). Right: the ZD-sensitive currents (magenta) are obtained by subtracting the application of 50 μM ZD7288 for 5–8 min (teal) from Control (black). (B) Current–voltage (I–V) relationship of M4 HCN tail current derived from the ZD-sensitive trace (magenta) in (A). A linear fit is used to extrapolate the reversal potential of the HCN tail current as described previously (Chen and Yang, 2007; Van Hook and Berson, 2010). The HCN-mediated tail current has a positive slope and reversed at –26 mV (magenta, n = 7). Data are represented as mean ± SEM. I–V relationship of HCN channels (magenta) in M4 intrinsically photosensitive retinal ganglion cells (ipRGCs) is compared to the 10 s light step (1012 photons · cm-2 · s-1) I–V relationships of the maximum photocurrent of Control (black, n = 25, 5 cells/group) and TRPC3/6/7 KO M4 cells (orange, n = 23 cells, 4–6 cells/group) reported by Sonoda et al., 2018. Data are represented as mean ± SEM. The light-evoked I–V relationships for both Control (black) and TRPC3/6/7 KO (orange) M4 cells have a negative slope and reverse at –90 mV (see Figure 7D [10 s light step], and Figure 6 [100 ms light step] in Sonoda et al., 2018). This contrasts with the reversal of the calculated HCN tail current reversal of –26 mV (magenta) of M4 ipRGCs.
-
Figure 3—source data 1
I–V relationship of the M4 photocurrent and the I–V relationship of the M4 hyperpolarization-activated cyclic nucleotide-gated (HCN) tail current.
- https://cdn.elifesciences.org/articles/80749/elife-80749-fig3-data1-v2.xlsx
Figure 4 with 2 supplements
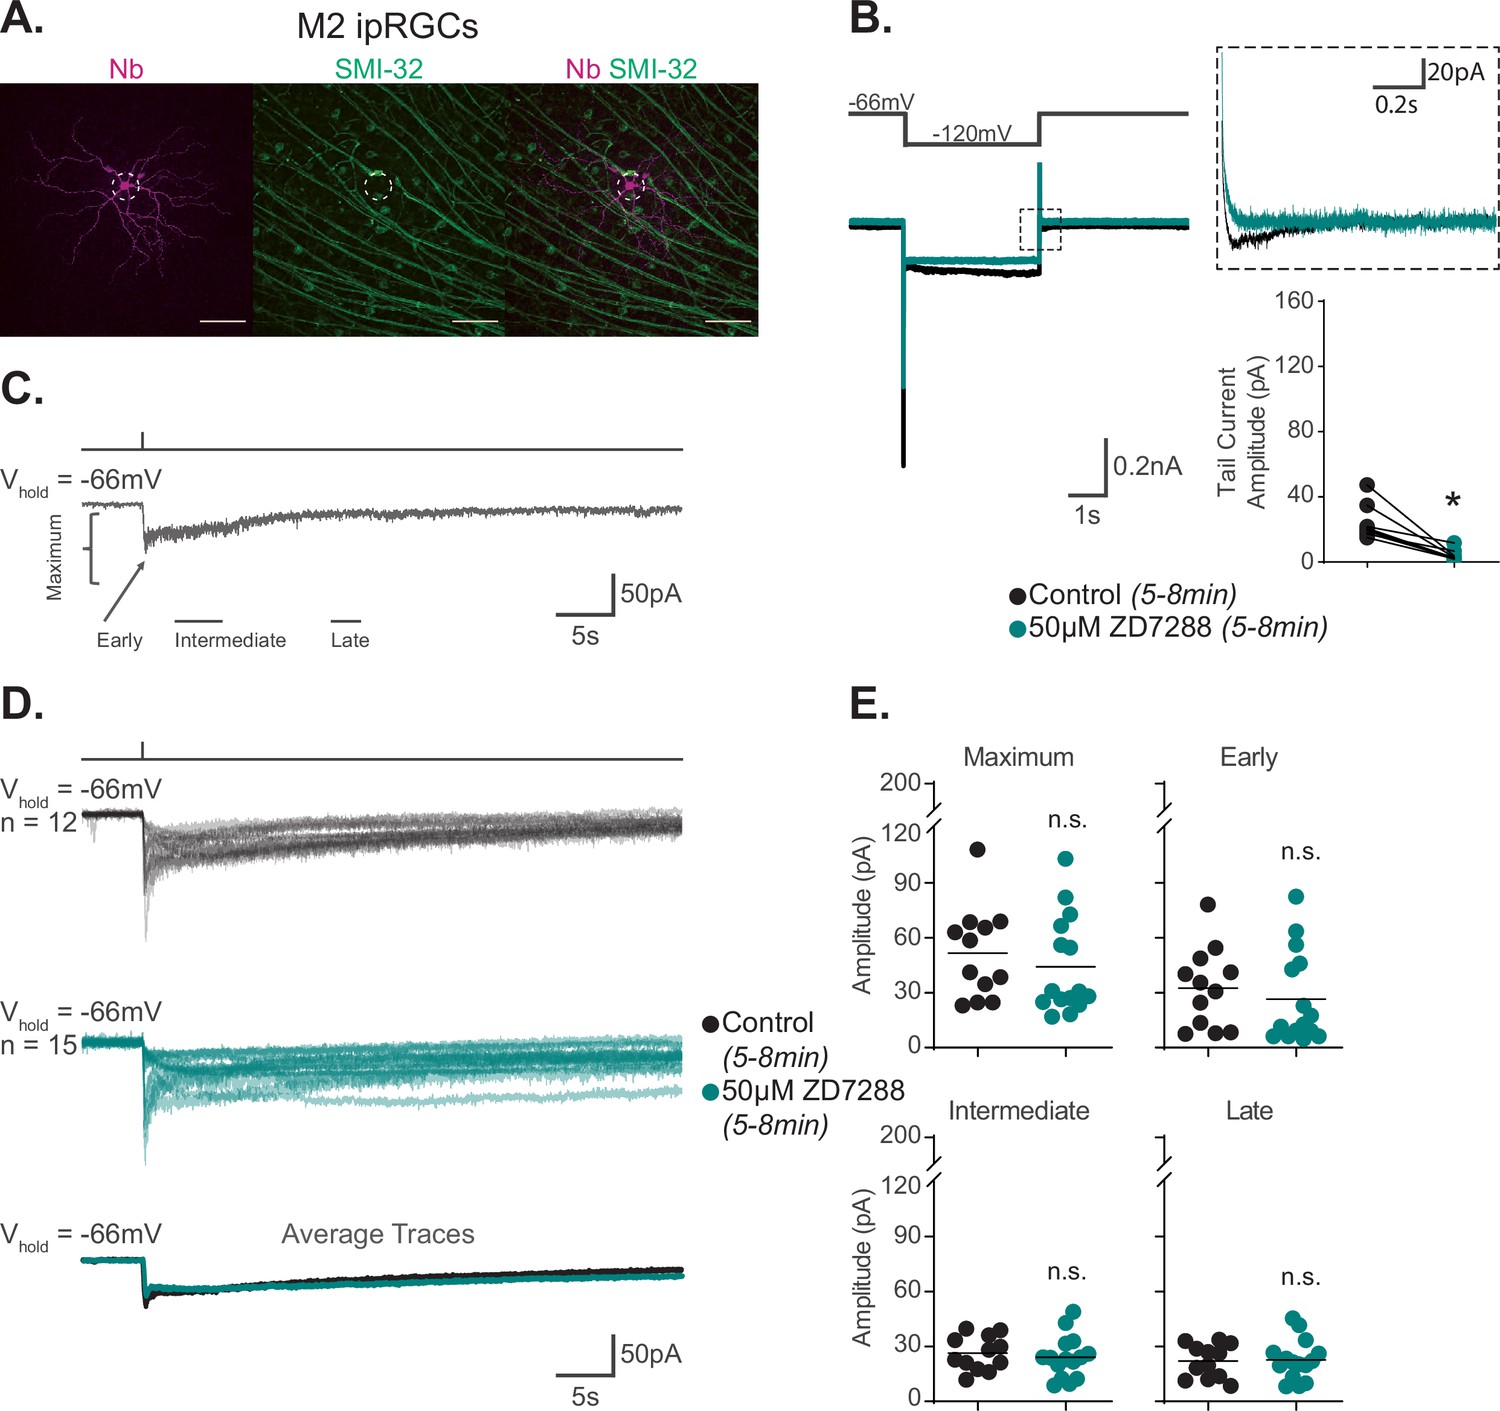
Hyperpolarization-activated cyclic nucleotide-gated (HCN) channels are not required for M2 phototransduction.
(A) M2 intrinsically photosensitive retinal ganglion cell (ipRGC) filled with Neurobiotin (Nb, magenta) in a Control retina and immunolabeled for the M4 marker SMI-32 (green). Right panel shows merged image and lack of immunolabeling of filled cell with SMI-32, confirming identity as an M2 ipRGC. Scale bar 100 μm. (B) Left: representative recording a typical Control M2 ipRGC (black), hyperpolarized from –66 mV to –120 mV and stepped back to the original holding potential. Cell was then incubated for 5–8 min with 50 μM ZD7288 (teal) and subjected to the same voltage-clamp protocol. Tail currents are boxed. Middle: magnified boxed tail currents. Right: absolute value of HCN tail current amplitude of Control M2 cells (black, n = 9) before and after application of 50 μM ZD7288 for 5–8 min (teal, n = 9). 50 μM ZD7288 for 5–8 min successfully blocked HCN tail currents of M4 ipRGCs (p=0.0039). Performed statistical analysis with Wilcoxon signed-rank test (see 'Materials and methods'). (C) Example light response of Control M2 ipRGC to a 50 ms, 480 nm light pulse (6.08 × 10¹⁵ photons · cm–2 · s–1) in the presence of synaptic blockers. Trace is labeled with the Maximum, Early, Intermediate, and Late components used in the analysis (see 'Materials and methods'). (D) Individual light responses of Control (black, n = 12) M2 cells and M2 cells incubated with 50 μM ZD7288 for 5–8 min (teal, n = 15). Bottom row shows the overlaid average light response trace for Control (black) and 50 μM ZD7288 for 5–8 min (teal) M2 cells. (E) Absolute value of photocurrent amplitudes quantified for cells in (C). Photocurrent of M2 cells in 50 μM ZD7288 for 5–8 min is unaffected despite full blockade of HCN channels shown in (B). Performed statistical analysis with Mann–Whitney U test (see 'Materials and methods'). n.s., not significant. Bars in (E) indicate mean.
-
Figure 4—source data 1
Hyperpolarization-activated cyclic nucleotide-gated (HCN) tail current and photocurrent components of Control M2 intrinsically photosensitive retinal ganglion cells (ipRGCs) in the 5–8 min of 50 μM ZD7288.
- https://cdn.elifesciences.org/articles/80749/elife-80749-fig4-data1-v2.xlsx
Figure 4—figure supplement 1

M2 hyperpolarization-activated cyclic nucleotide-gated (HCN) current and tail current are not modulated by light.
(A) Control M2 intrinsically photosensitive retinal ganglion cell (ipRGC) in dark (black) hyperpolarized from –66 mV to –120 mV and stepped back to the original holding potential. Cell was then placed in 90 s of 480 nm light (6.08 × 10¹⁵ photons · cm–2 · s–1) (light gray) and subjected to the same voltage-clamp protocol (gray). Tail currents are boxed and expanded in inset. (B) Absolute value of HCN tail current amplitude is plotted for M2 cells in dark (black, n = 5) and in light (gray, n = 5). There is no significant change in the tail current amplitude in light. (C) Absolute value of the HCN current amplitude is plotted for M2 cells in light (gray, n = 5) versus dark (black, n = 5). There is no significant change in the HCN current in light. (D) Example traces of a Control M2 ipRGC shown in (A) but without normalization for both dark (black) and light (gray). The change in holding current (ΔIhold) at –66 mV is boxed and expanded in inset. For the example traces Ihold dark = 6.91 pA and Ihold light = -24.94 pA resulting in a change in holding current of ΔIhold = -31.85 pA. (E) Change in holding current in dark versus light is plotted for individual cells in dark (black, n = 4) and in light (gray, n = 4). The holding current became more negative following light exposure, as expected with activation of melanopsin phototransduction. Recordings made in the presence of synaptic blockers. n.s., not significant. Performed statistical analysis with Wilcoxon signed-rank test (see 'Materials and methods').
-
Figure 4—figure supplement 1—source data 1
Control M2 hyperpolarization-activated cyclic nucleotide-gated (HCN) current and tail current in dark vs. light.
- https://cdn.elifesciences.org/articles/80749/elife-80749-fig4-figsupp1-data1-v2.xlsx
Figure 4—figure supplement 2

Prolonged application of ZD7288 reduces the M2 photocurrent via off-target effects.
(A) Control M2 intrinsically photosensitive retinal ganglion cell (ipRGC) is hyperpolarized from –66 mV to –120 mV and stepped back to the original holding potential after 20 min in control solution (black, n = 5) or after 20 min incubation with 50 μM ZD7288 (blue, n = 5). Tail currents are boxed and expanded in inset. The absolute value of the tail current amplitude is plotted for each cell. The hyperpolarization-activated cyclic nucleotide-gated (HCN) tail current amplitude was significantly reduced after 20 min incubation in 50 μM ZD7288 (p=0.0317). (B) Absolute value of HCN tail current amplitudes is similar after 5–8 (teal, n = 9) vs. 20 min incubation with 50 μM ZD7288 (blue, n = 5), indicating no further blockade of HCN channels with longer incubation. (C) M2 photocurrent recorded after 20 min in control solution (black, n = 11) or after 20 min incubation with 50 μM ZD7288 (blue, n = 8). Bottom row: overlaid average light response trace for each group. (D) Maximum, Early, Intermediate, and Late photocurrent amplitudes of M2 cells in 20 min Control solution (black, n = 11) and 20 min of 50 μM ZD7288 (blue, n = 8). The absolute value of the Maximum (p=0.0409) amplitude of M2 cells incubated in 50 μM ZD7288 for 20 min is significantly reduced. The Early, Intermediate, and Late photocurrent amplitudes were reduced but are not statistically significant. The results show a partial reduction of the M2 photocurrent as reported by Jiang et al., 2018. Analysis performed with Mann–Whitney U test (see 'Materials and methods'). *p<0.05. n.s., not significant. Bars in (A-B,D) indicate mean.
-
Figure 4—figure supplement 2—source data 1
Hyperpolarization-activated cyclic nucleotide-gated (HCN) tail current and photocurrent components of M2 intrinsically photosensitive retinal ganglion cells (ipRGCs) in the 20 min of 50 μM ZD7288.
- https://cdn.elifesciences.org/articles/80749/elife-80749-fig4-figsupp2-data1-v2.xlsx
Figure 5 with 3 supplements
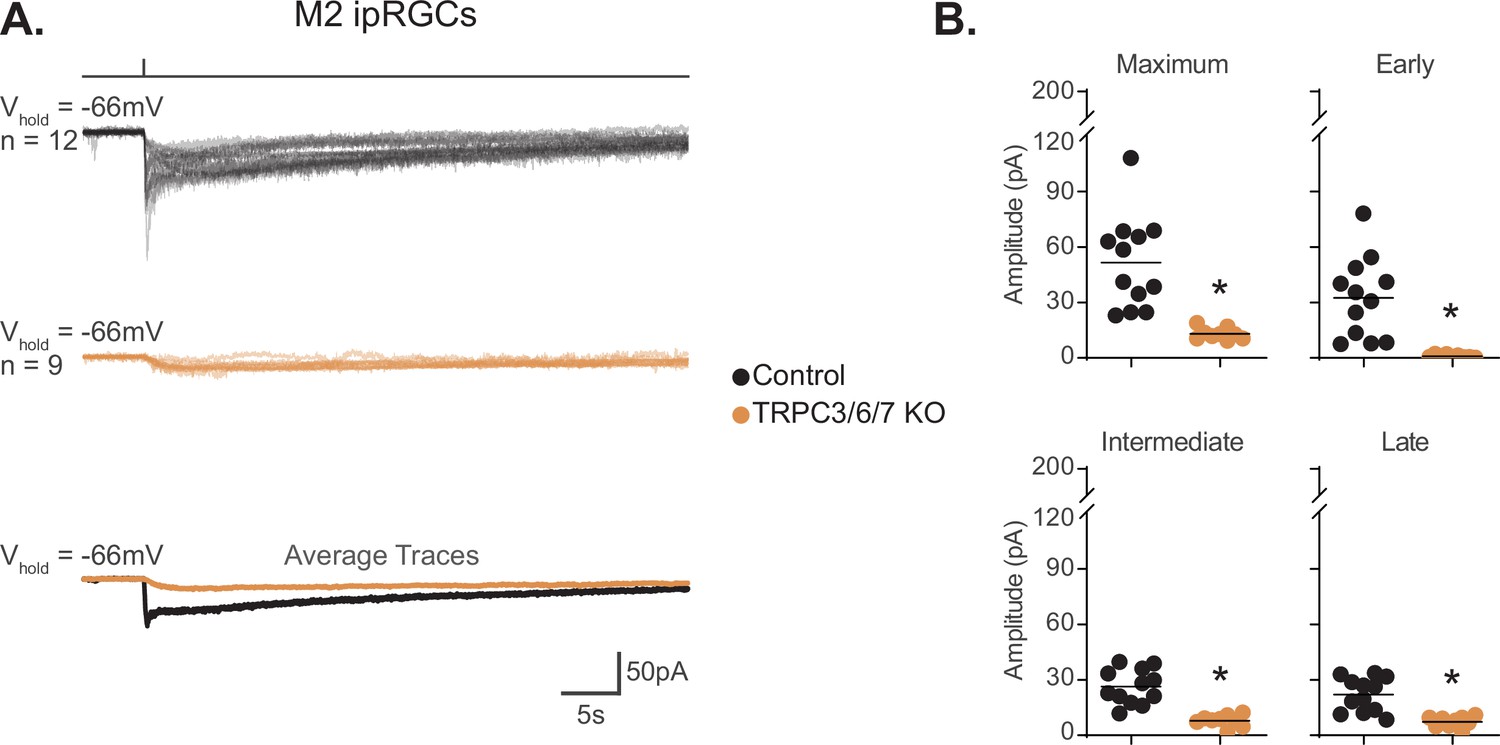
TRPC3/6/7 channels are a major phototransduction target in M2 intrinsically photosensitive retinal ganglion cells (ipRGCs).
(A) Individual photocurrent recordings of Control (Opn4-GFP, black, n = 12) and TRPC3/6/7 KO (Opn4-GFP; TRPC 3/6/7 KO, orange, n = 9) M2 ipRGCs to a 50 ms, 480 nm light pulse (6.08 × 10¹⁵ photons · cm–2 · s–1) in the presence of synaptic blockers. Bottom row shows the overlaid average light response trace for Control (black) and TRPC3/6/7 KO (orange). (B) Absolute value of photocurrent amplitudes quantified for cells in (A). The photocurrent was significantly reduced for all components in TRPC3/6/7 KO M2 cells (*p<0.0001). Analysis performed with Mann–Whitney U test (see 'Materials and methods'). Bars in (B) indicate mean.
-
Figure 5—source data 1
Photocurrent components for Control and TRPC3/6/7 KO M2 intrinsically photosensitive retinal ganglion cells (ipRGCs).
- https://cdn.elifesciences.org/articles/80749/elife-80749-fig5-data1-v2.xlsx
Figure 5—figure supplement 1

Control and TRPC3/6/7 KO M2s have similar capacitance and input resistance.
(A) Cells were held at –66 mV followed by a 10 mV hyperpolarization step and capacitance was calculated from the trace using Ohm’s law. The capacitance of Control (black, n = 11) and TRPC3/6/7 KO (orange, n = 9) M2 cells is not significantly different. (B) Input resistance for recorded M2 intrinsically photosensitive retinal ganglion cells (ipRGCs) was quantified, and there is no significant difference between Control (black, n = 11) and TRPC3/6/7 KO (orange, n = 9) M2 cells. Analysis performed using the Mann–Whitney U test (see 'Materials and methods'). Bars in (A-B) indicate mean.
-
Figure 5—figure supplement 1—source data 1
Capacitance and input resistance values for Control and TRPC3/6/7 KO M2 cells.
- https://cdn.elifesciences.org/articles/80749/elife-80749-fig5-figsupp1-data1-v2.xlsx
Figure 5—figure supplement 2
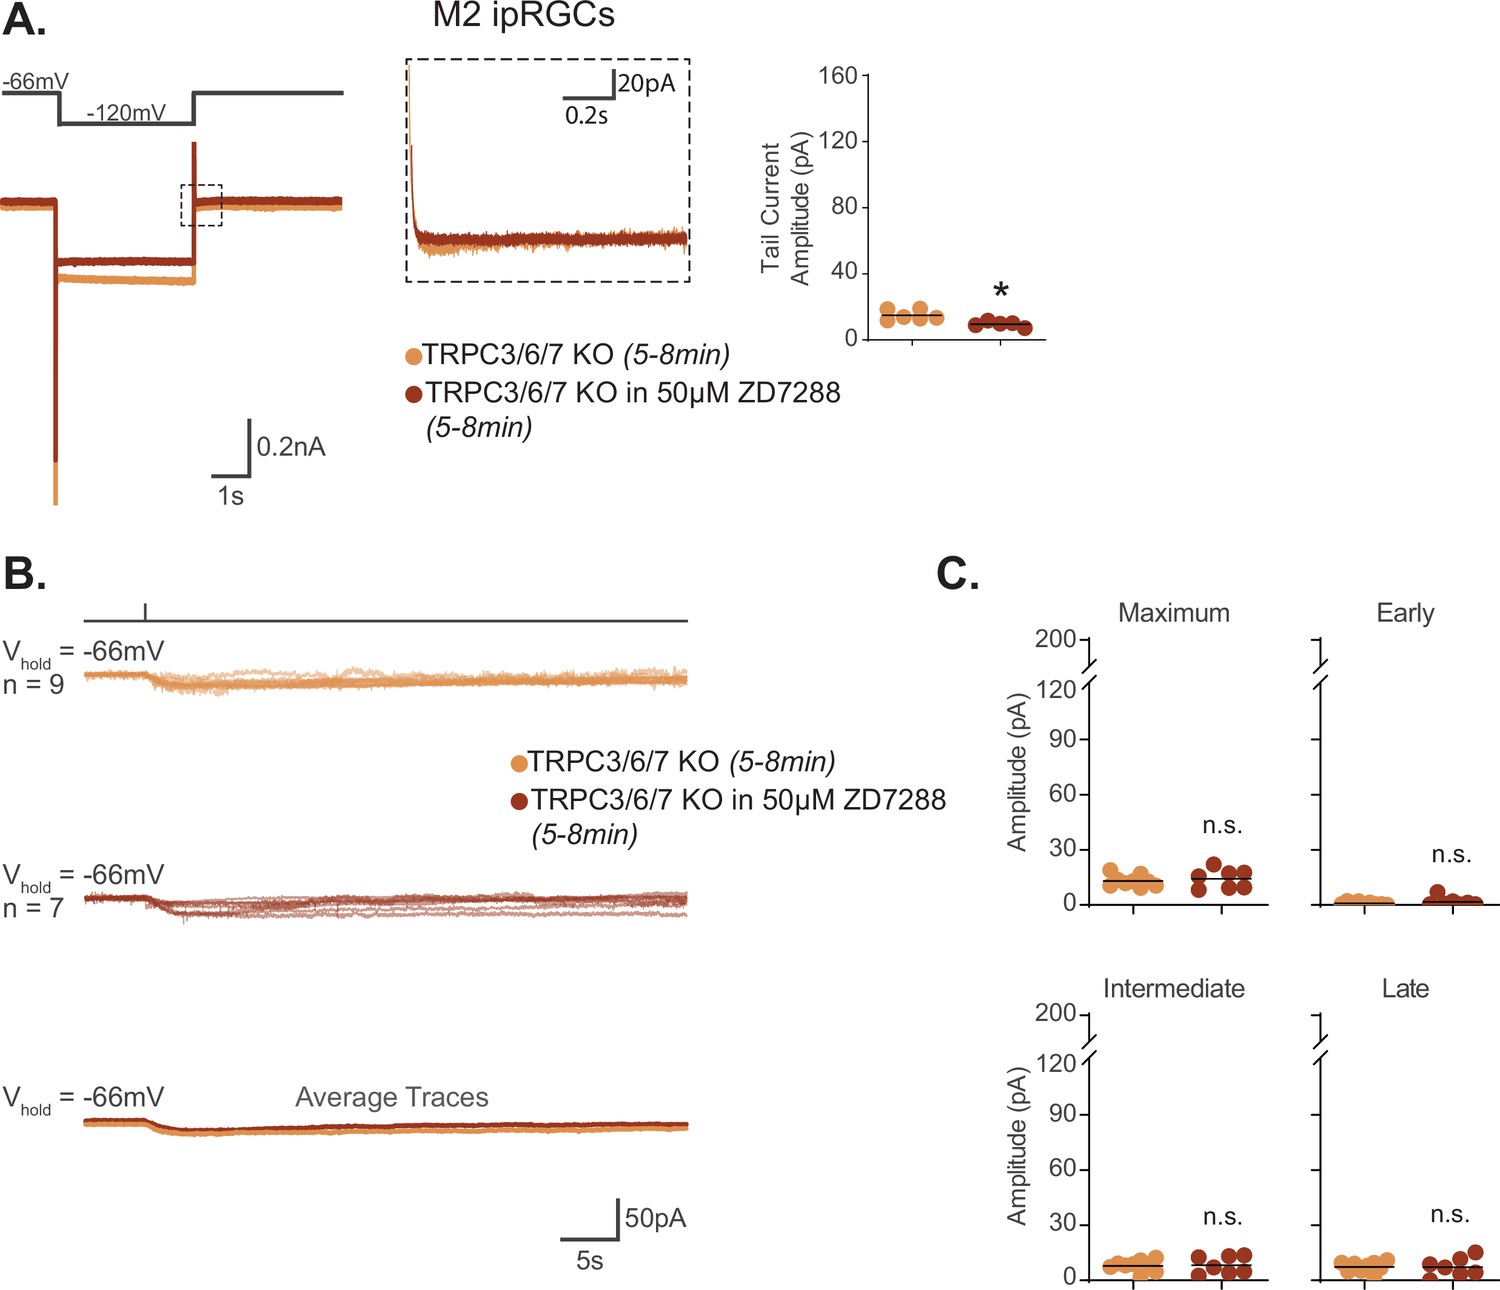
Blockade of hyperpolarization-activated cyclic nucleotide-gated (HCN) channels does not reduce the TRPC3/6/7 KO M2 photocurrent.
(A) TRPC3/6/7 KO M2 ipRGC (orange), hyperpolarized from –66 mV to –120 mV and stepped back to the original holding potential. TRPC3/6/7 KO M2 cell is incubated in 50 μM ZD7288 for 5–8 min (maroon) and subjected to the same voltage protocol. Tail currents are boxed and magnified in inset. Right, top row: magnified boxed tail currents. Absolute value of the HCN tail current amplitude for TRPC3/6/7 KO M2 cells (orange, n = 6) and cells incubated in 50 μM ZD7288 for 5–8 min (maroon, n = 5). 50 μM ZD7288 for 5–8 min fully blocked HCN-mediated tail currents in M2 ipRGCs lacking TRPC3/6/7 channels (p=0.0043). (B) Individual light responses of TRPC3/6/7 KO M2 cells (orange, n = 9) or cells in 50 μM ZD7288 for 5–8 min (maroon, n = 7). Bottom row shows the overlaid average light response trace for TRPC3/6/7 KO (orange) and in 50 μM ZD7288 for 5–8 min (maroon). (C) Absolute value of the current amplitudes for the light responses in (B) is graphed to compare the Maximum, Early, Intermediate, and Late component amplitudes of TRPC3/6/7 KO cells (orange, n = 9) and cells in 50 μM ZD7288 for 5–8 min of (maroon, n = 7). Light response of TRPC3/6/7 KO M2 cells in 50 μM ZD7288 for 5–8 min is unaffected despite blockade of HCN channels. Performed statistical analysis with Mann–Whitney U test (see 'Materials and methods'). *p<0.05. n.s., not significant. Bars in (A,C) indicate mean.
-
Figure 5—figure supplement 2—source data 1
Hyperpolarization-activated cyclic nucleotide-gated (HCN) tail current and photocurrent components of TRPC3/6/7 KO M2 intrinsically photosensitive retinal ganglion cells (ipRGCs) in the 5–8 min of 50 μM ZD7288.
- https://cdn.elifesciences.org/articles/80749/elife-80749-fig5-figsupp2-data1-v2.xlsx
Figure 5—figure supplement 3
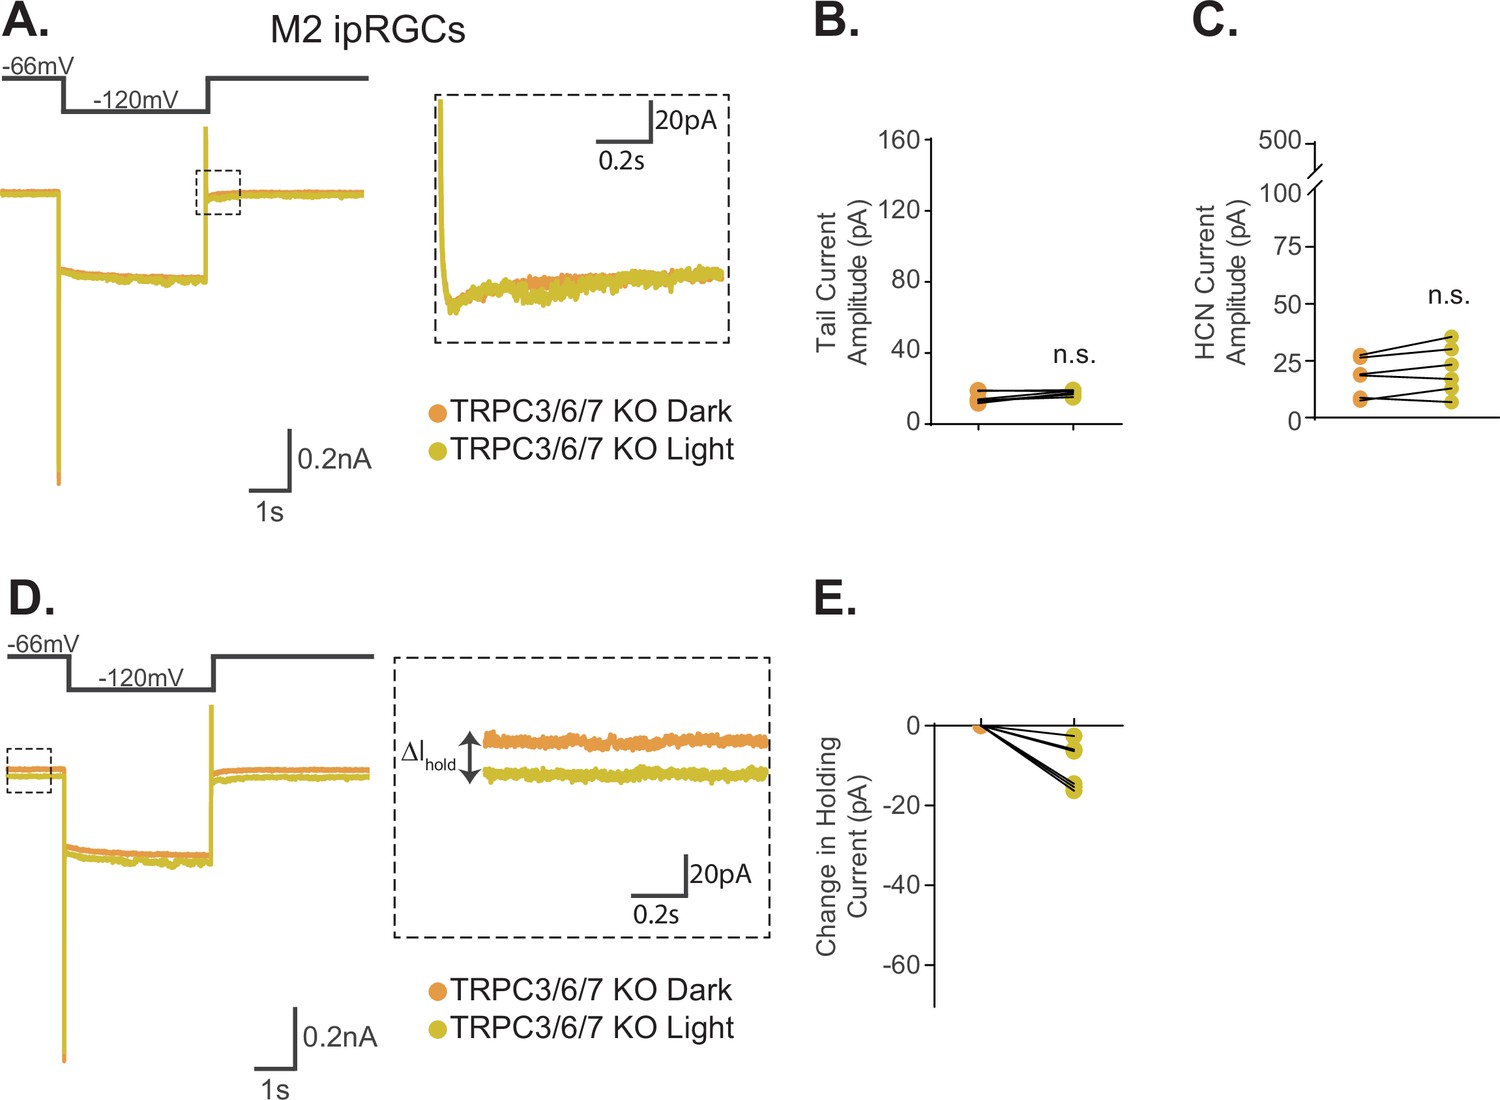
Hyperpolarization-activated cyclic nucleotide-gated (HCN) current and tail current are not modulated by light in M2 intrinsically photosensitive retinal ganglion cells (ipRGCs) lacking TRPC3/6/7 channels.
(A) TRPC3/6/7 KO M2 ipRGC in dark (orange) hyperpolarized from –66 mV to –120 mV and stepped back to the original holding potential. Cell was then placed in 90 s of 480 nm light (6.08 × 10¹⁵ photons · cm–2 · s–1) (yellow) and subjected to the same voltage-clamp protocol. Tail currents are boxed and expanded in inset. (B) Absolute value of the tail current amplitude is plotted for TRPC3/6/7 KO M2 cells in dark (orange, n = 6) and in light (yellow, n = 6). There is no significant change in the tail current amplitude in light. (C) Absolute value of the HCN current amplitude is plotted for TRPC3/6/7 KO M2 cells in dark (orange, n = 6) and in light (yellow, n = 6). There is no significant change in the HCN current in light in TRPC3/6/7 KO M2 cells. (D) Example traces of a TRPC3/6/7 KO M2 cell shown in (A) but without normalization for both dark (orange) and light (yellow). The change in holding current (ΔIhold) at –66 mV is boxed and expanded in inset. For the example traces Ihold dark = 6.35 pA and Ihold light = -9.97 pA resulting in a change in holding current of ΔIhold = –16.32 pA. (E) Change in holding current in dark versus light is plotted for individual cells in dark (orange, n = 6) and in light (yellow, n = 6). The holding current became more negative following light exposure, as expected with activation of melanopsin phototransduction. Recordings made in the presence of synaptic blockers. n.s., not significant. Performed statistical analysis with Wilcoxon signed-rank test (see 'Materials and methods').
-
Figure 5—figure supplement 3—source data 1
TRPC3/6/7KO M2 hyperpolarization-activated cyclic nucleotide-gated (HCN) current and tail current in dark vs. light.
- https://cdn.elifesciences.org/articles/80749/elife-80749-fig5-figsupp3-data1-v2.xlsx
Figure 6 with 1 supplement
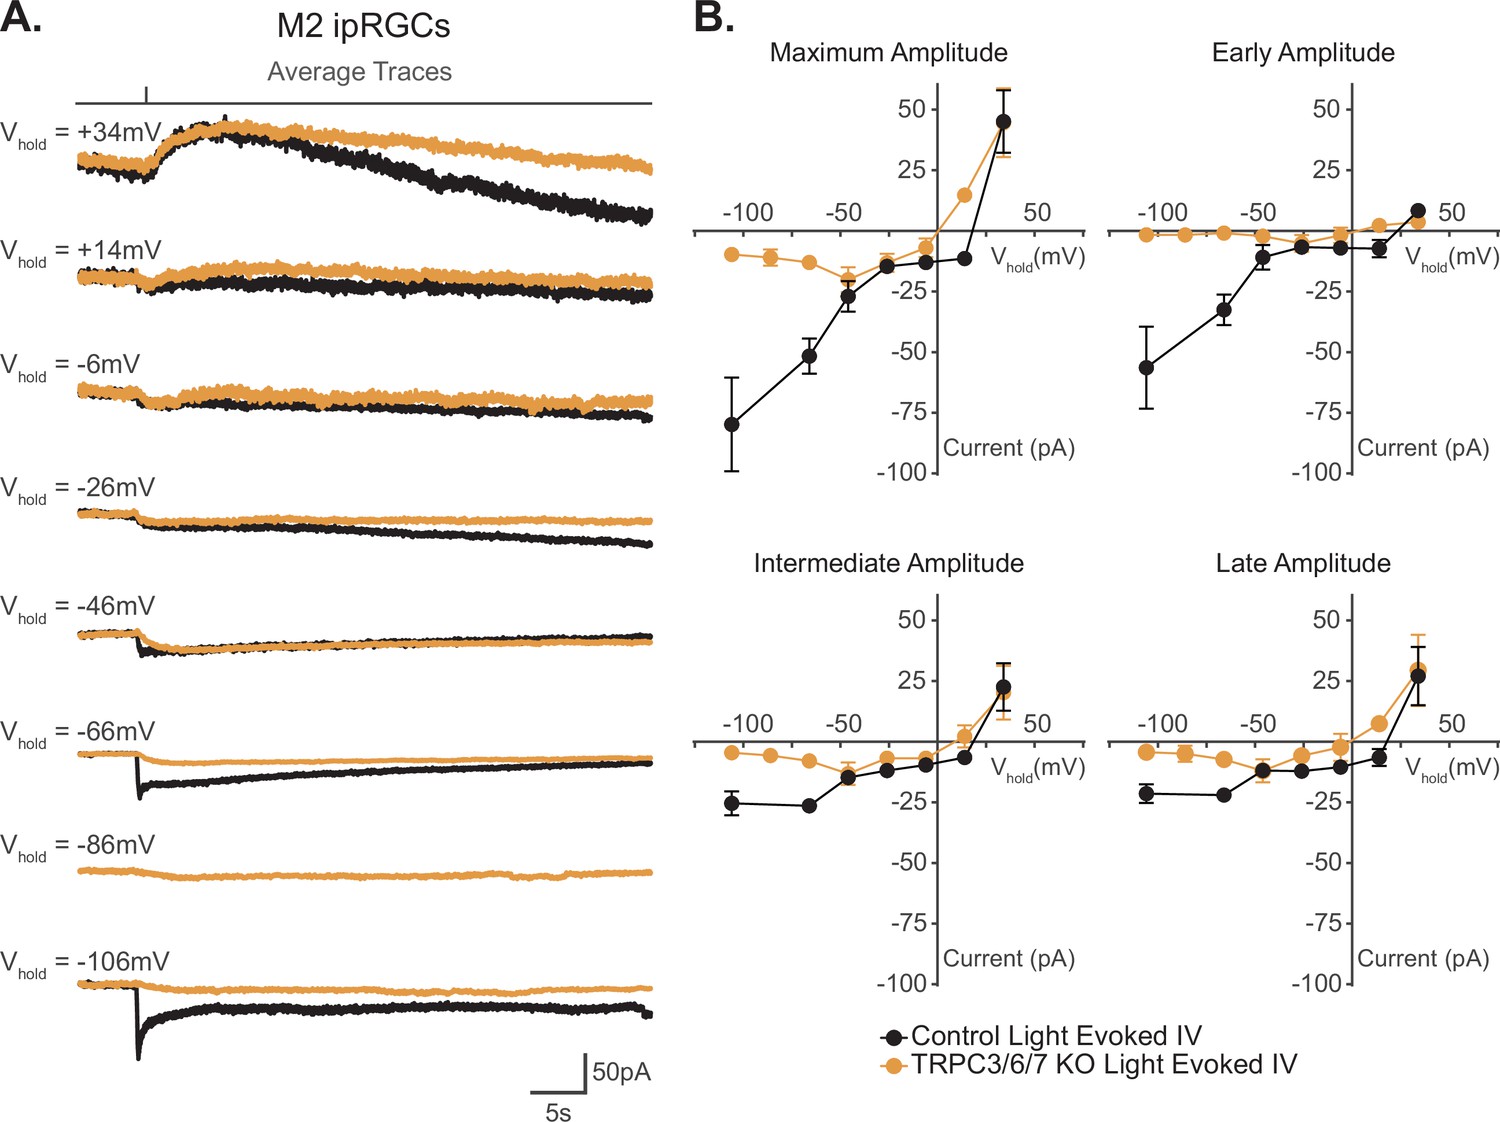
I–V relationship of M2 photocurrent.
(A) Average photocurrent traces for Control (black) and TRPC3/6/7 KO (orange) M2 intrinsically photosensitive retinal ganglion cells (ipRGCs) at various holding potentials (–106 mV to +34 mV) to a 50 ms, 480 nm light pulse (6.08 × 10¹⁵ photons · cm–2 · s–1) in the presence of synaptic blockers. Individual traces for all cells are shown in Figure 6—figure supplement 1. (B) Photocurrent amplitudes for all Control (black, n = 52, 4–12 cells/group) and TRPC3/6/7 KO (orange, n = 43, 2-9 cells/group) M2 ipRGCs at various holding potentials for Maximum, Early, Intermediate, and Late components. I–V relationships for Control M2 cells reverse between +10–25 mV and have a positive slope. Data are represented as mean ± SEM.
-
Figure 6—source data 1
I–V relationship of M2 photocurrent for Control and TRPC3/6/7 KO cells.
- https://cdn.elifesciences.org/articles/80749/elife-80749-fig6-data1-v2.xlsx
Figure 6—figure supplement 1

Individual M2 photocurrents used to plot the I–V relationship.
M2 photocurrent for individual (A) Control (black) or (B) TRPC3/6/7 KO M2 cells at various holding potentials (–106 mV to +34 mV). For each holding potential, 4–12 Control cells were recorded for a total of n = 52 cells and 2–9 TRPC3/6/7 KO cells were recorded for a total of n = 43 cells. Cell recordings were made in Opn4-GFP retinas in the synaptic blockers and presented with a flash of blue (480 nm) light (6.08 × 10¹⁵ photons · cm–2 · s–1).
Figure 7
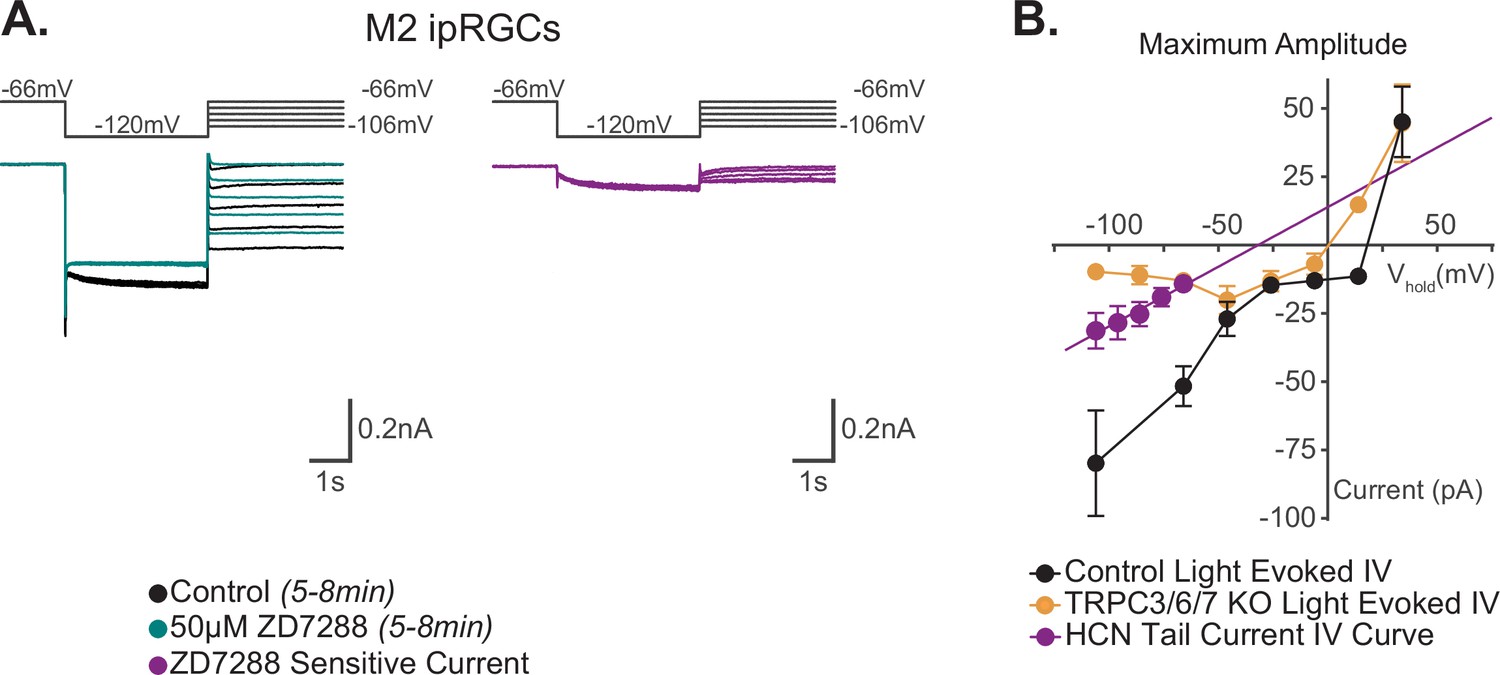
Reversal potential of M2 photocurrent is distinct from extrapolated reversal of M2 hyperpolarization-activated cyclic nucleotide-gated (HCN) tail current.
(A) Left: example Control (black) M2 cell hyperpolarized to –120 mV to activate HCN channels followed by a step to various test potentials ranging from –106 mV to –66 mV. The voltage protocol was then repeated in the same cell following 50 μM ZD7288 for 5–8 min (teal). Right: the ZD-sensitive currents (magenta) are obtained by subtracting the application of 50 μM ZD7288 for 5–8 min (teal) from Control (black). (B) I–V relationship of M2 HCN tail current derived from the ZD-sensitive trace (magenta) in (A) and M2 photocurrent I–V curves derived from the maximum component amplitudes for Control (black, n = 52, 4–12 cells/group) and TRPC3/6/7 KO (orange, n = 43, 2–9 cells/group) cells from Figure 6B. A linear fit was used to extrapolate a reversal potential of –32 mV for HCN tail currents (magenta, n = 5), which is distinct from the photocurrent reversal of Control M2 ipRGCs of +19 mV. All data are represented as mean ± SEM.
-
Figure 7—source data 1
I–V relationship of the M2 photocurrent compared to the I–V relationship of the M2 hyperpolarization-activated cyclic nucleotide-gated (HCN) tail current.
- https://cdn.elifesciences.org/articles/80749/elife-80749-fig7-data1-v2.xlsx
Figure 8
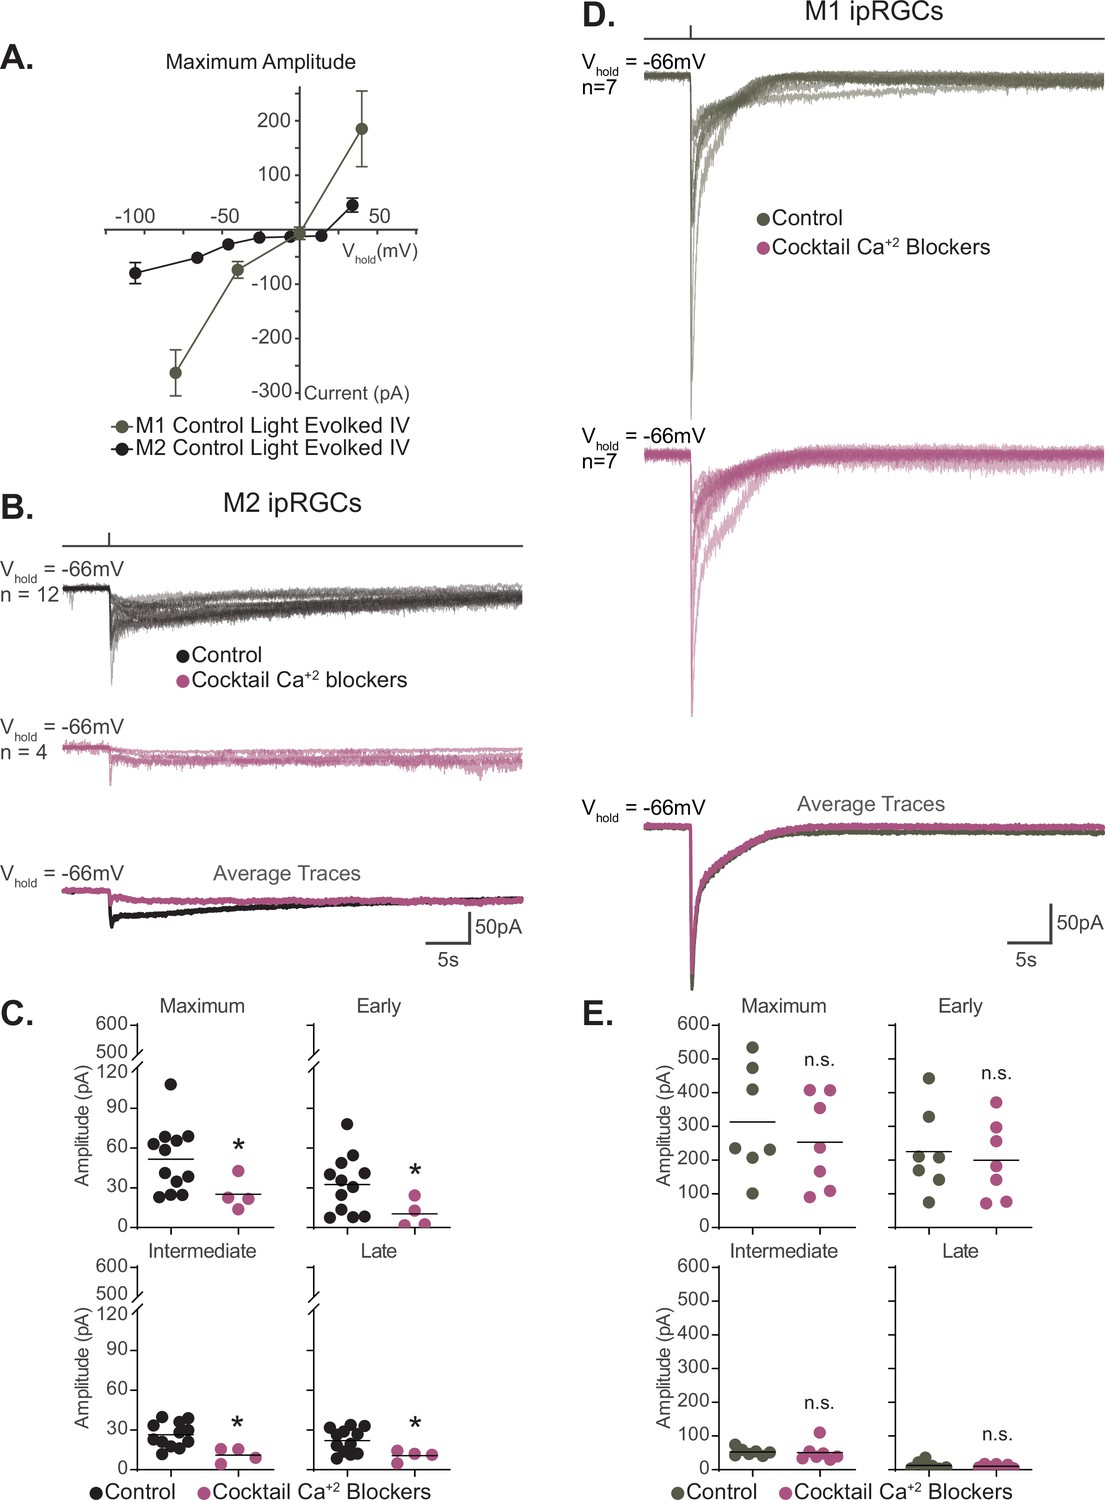
Voltage-gated calcium channels are required for M2, but not M1, phototransduction.
(A) Light-evoked I–V relationships for the maximum amplitude of the photocurrent in Control M2 (black, n = 52, 4–12 cells/group, from Figure 6B) and M1 (gray, n = 19, 4–6 cells/group, replotted from Sonoda et al., 2018) intrinsically photosensitive retinal ganglion cells (ipRGCs). Control M2 ipRGCs (black) reversal is +19 mV compared to 0 mV in Control M1 cells (gray), despite major contribution of TRPC channels to M1 and M2 phototransduction. M1 photocurrents are in response to a 10 second blue (480 nm) light step (1012 photons · cm-2 · s-1) reported in Sonoda et al., 2018. Data are represented as mean ± SEM. (B) Photocurrent of Control (black, n = 12) M2 ipRGCs in synaptic blocker cocktail and M2 ipRGCs incubated in a cocktail also containing voltage-gated calcium channel (VGCC) antagonists (plum, n = 4). Bottom row: overlaid average light response traces for Control cells (black) and cells in a cocktail of calcium blockers (plum). VGCC antagonists were dissolved in the synaptic blocker cocktail and consisted of: 10 μM nifedipine, 5 μM nimodipine, 400 nM ω-agatoxin IVA, 3 μM ω-conotoxin GVIA, 3 nM SNX-482, and 10 μM mibefradil dihydrochloride. (C) Absolute value of the photocurrent of cells in (B) are quantified. The Maximum (p=0.0297), Early (p=0.0418), Intermediate (p=0.0044), and Late (p=0.0418) component amplitudes of the photocurrent are significantly reduced in the M2 ipRGCs in the presence of a cocktail of calcium blockers compared to Control. (D) Photocurrent of Control (gray, n = 7) M1 ipRGCs in synaptic blocker cocktail and M1 ipRGCs incubated in a cocktail also containing VGCC antagonists (plum, n = 7). Bottom row: overlaid average light response traces for Control cells (black) and cells in a cocktail of calcium blockers (plum). VGCC antagonists were dissolved in the synaptic blocker cocktail and consisted of 10 μM nifedipine, 5 μM nimodipine, 400 nM ω-agatoxin IVA, 3 μM ω-conotoxin GVIA, 3 nM SNX-482, and 10 μM mibefradil dihydrochloride. (E) Absolute value of photocurrent for cells in (D) is quantified. There is no significant difference in any of the photocurrent components in M1 cells treated with a cocktail of calcium blockers. All recordings for M1 and M2 ipRGCs were made in Control (Opn4-GFP) retinas in response to a 50 ms flash of blue (480 nm) light (6.08 × 10¹⁵ photons · cm–2 · s–1) and in the presence of synaptic blockers. *p<0.05. n.s., not significant. Performed statistical analysis with Mann–Whitney U test (see 'Materials and methods'). Bars in (C,E) represent mean.
-
Figure 8—source data 1
M1 and M2 photocurrent components in a cocktail of voltage-gated calcium channel antagonists.
- https://cdn.elifesciences.org/articles/80749/elife-80749-fig8-data1-v2.xlsx
Figure 9 with 3 supplements
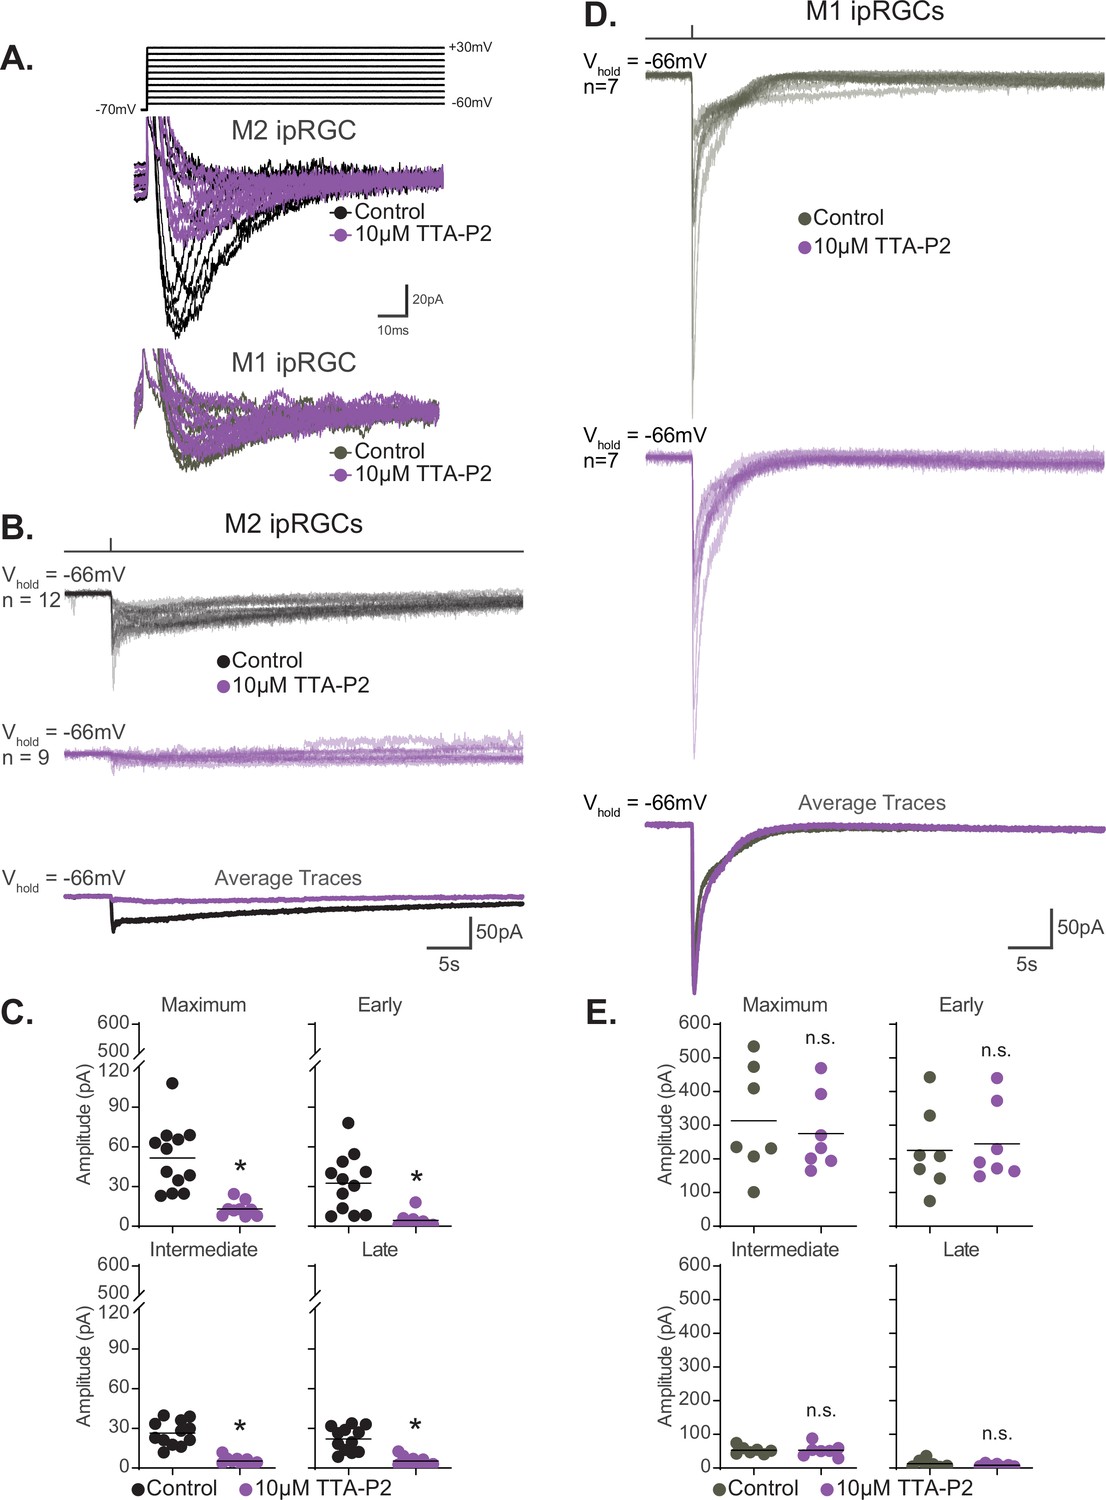
T-type voltage-gated calcium channels are required for M2, but not M1, phototransduction.
(A) Top: calcium currents were isolated from Control M2 intrinsically photosensitive retinal ganglion cells (ipRGCs) (black, n = 4) held at –70 mV and depolarized to multiple voltage steps from –60 mV to +30 mV. Cells were subsequently exposed to 5 min of the T-type voltage-gated calcium currents 10 μM TTA-P2 (purple, n = 4) to block T-type voltage-gated channels followed by the same voltage step commands. Bottom: calcium currents were recorded from Control M1 ipRGCs (gray, n = 2) and then in the presence of 10 μM TTA-P2 (purple, n = 2). (B) Individual light responses of Control (black, n = 12) M2 cells and M2 cells incubated with 10 μM TTA-P2 (purple, n = 9). Bottom row shows the overlaid average light response trace for Control (black) and 10 μM TTA-P2 (purple) M2 cells. (C) Absolute value of photocurrent amplitudes quantified for cells in (B). The photocurrent of M2 cells in 10 μM TTA-P2 is significantly reduced for all components (*p<0.0001) when T-type voltage calcium channels are blocked shown in (A). (D) Individual light responses of Control (gray, n = 7) M1 cells and M1 cells incubated with 10 μM TTA-P2 (purple, n = 7). Bottom row shows the overlaid average light response trace for Control (gray) and 10 μM TTA-P2 (purple) M1 cells. (E) Absolute value of photocurrent amplitudes quantified for cells in (D). Photocurrent of M1 cells in 10 μM TTA-P2 is unaffected. All recordings for M1 and M2 ipRGCs were made in Control (Opn4-GFP) retinas in response to a 50 ms flash of blue (480 nm) light (6.08 × 10¹⁵ photons · cm–2 · s–1) and in the presence of synaptic blockers. * p<0.05. n.s., not significant. Performed statistical analysis with Mann–Whitney U test (see 'Materials and methods'). Bars in (C,E) represent mean.
-
Figure 9—source data 1
Photocurrent components for M1 and M2 intrinsically photosensitive retinal ganglion cells (ipRGCs) in the presence of the T-type voltage-gated calcium channel antagonist, TTA-P2.
- https://cdn.elifesciences.org/articles/80749/elife-80749-fig9-data1-v2.xlsx
Figure 9—figure supplement 1
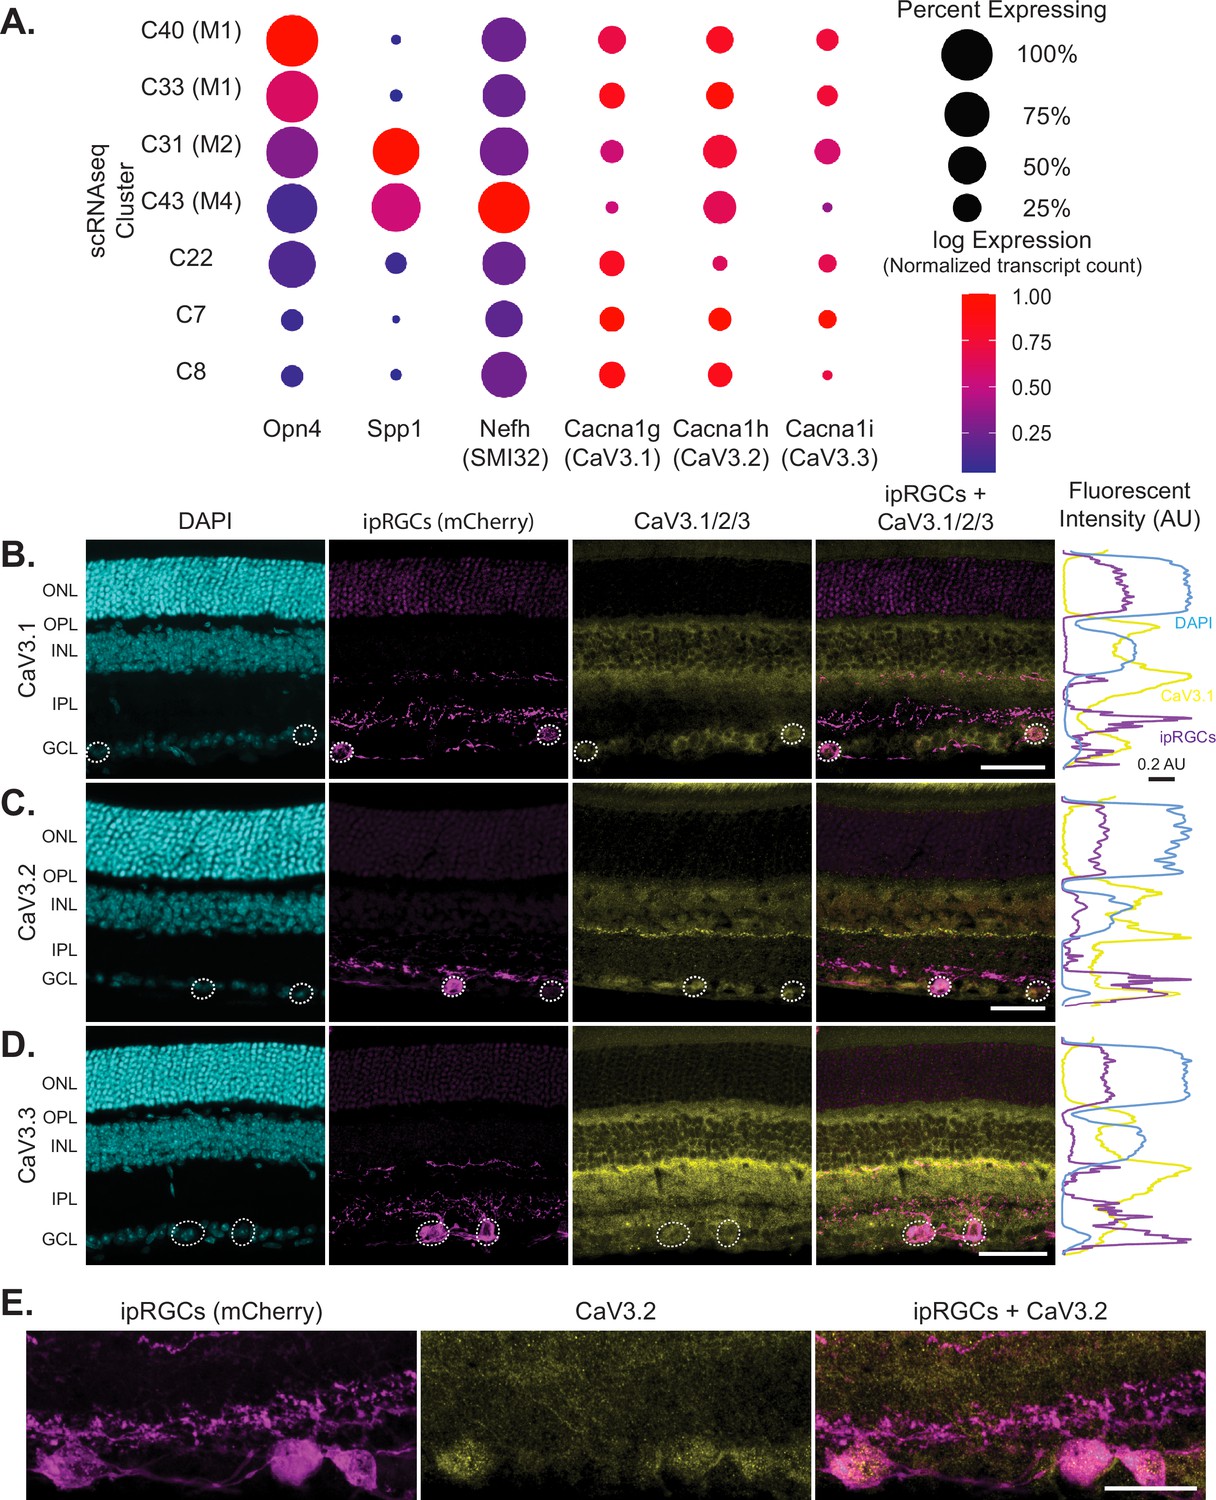
T-type voltage-gated calcium channels (VGCCs) are expressed in intrinsically photosensitive retinal ganglion cells (ipRGCs).
(A) Single-cell RNA sequencing data for the expression of T-type voltage-gated calcium channels in ipRGC clusters. ipRGCs clusters (expressing Opn4), express mRNA for Cacna1/2/3 which encode the T-type VGCCs Cav3.1/2/3. Spp1 is a marker for M2 and M4 ipRGCs (Tapia et al., 2022) and Nefh encodes neurofilament heavy chain, which is a marker for M4 ipRGCs in its non-phosphorylated form (Schmidt et al., 2014) Data replotted from Tran et al., 2019. (B) Representative retinal cross sections showing DAPI (cyan), ipRGCs labeled with mCherry (magenta), and CaV3.1 (yellow; scale bar, 50 µm) and average intensity plot showing CaV3.1/2/3 expression across the retinal layers (right). (C) Representative retinal cross sections showing DAPI (cyan), ipRGCs labeled with mCherry (magenta), and CaV3.2 (yellow, scale bar, 50 µm) and average intensity plot showing CaV3.1/2/3 expression across the retinal layers (right). (D) Representative retinal cross sections showing DAPI (cyan), ipRGCs labeled with mCherry (magenta), and CaV3.3 (yellow, scale bar, 50 µm). (E) Higher magnification image of CaV3.2 (yellow) in ipRGC (magenta) somas (scale bar, 25 µm). ONL, outer nuclear layer; OPL, outer plexiform layer; INL, inner nuclear layer; IPL, inner plexiform layer; GCL, ganglion cell layer.
Figure 9—figure supplement 2
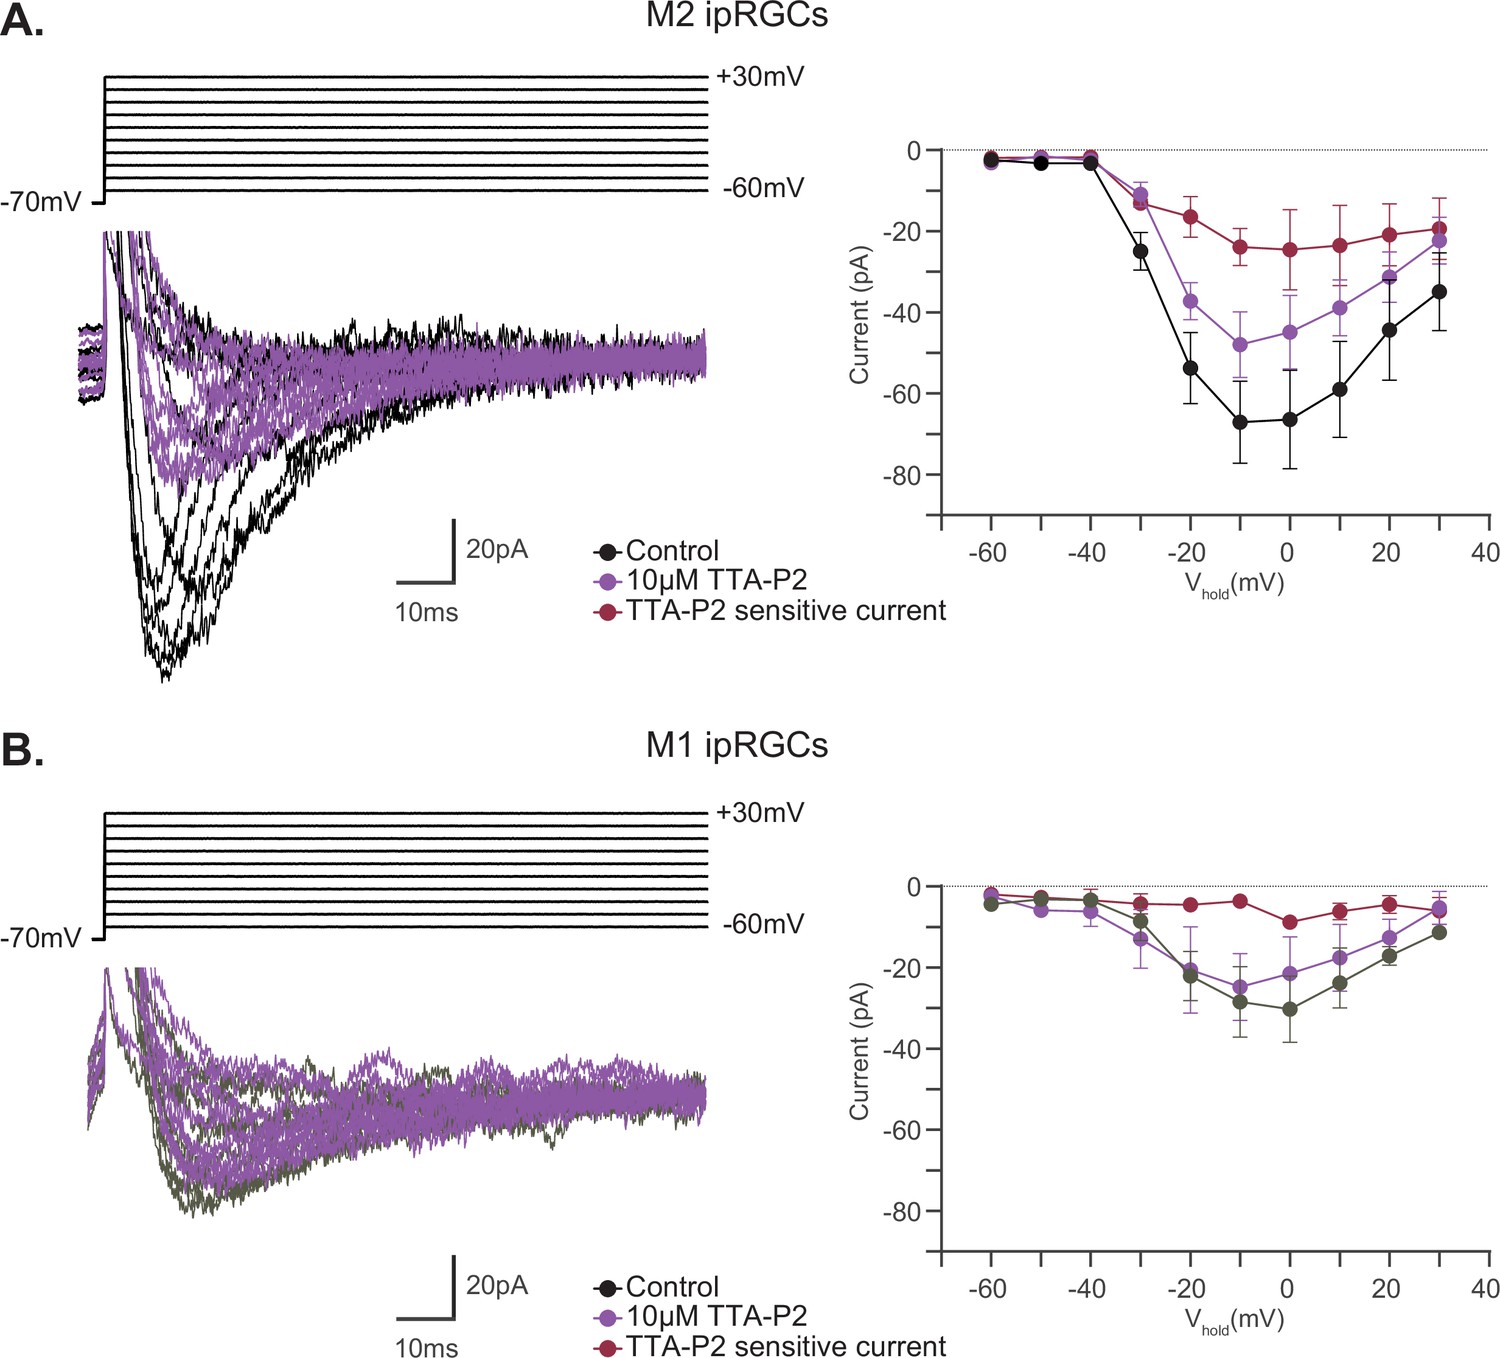
M2 intrinsically photosensitive retinal ganglion cells (ipRGCs) have T-type currents.
(A) Calcium currents were recorded with cesium internal to block potassium and hyperpolarization-activated cyclic nucleotide-gated (HCN) currents and synaptic blockers with 2.5 mM TEA to block additional potassium currents. M2 ipRGCs have functional T-type calcium currents (black, n = 4) which are sensitive to TTA-P2 (purple, n = 4). The TTA-P2 sensitive current (Control – 10 μM TTA-P2) is shown in (burgundy, n = 4). The average I–V relationship is plotted (right). (B) Calcium currents were recorded with cesium internal to block potassium and HCN currents and synaptic blockers with 2.5 mM TEA to block additional potassium currents. Calcium currents in M1 ipRGCs (gray, n = 2) are not sensitive to TTA-P2 (purple, n = 2). The TTA-P2 sensitive current (Control – 10 μM TTA-P2) is shown in (burgundy, n = 2). The average I–V relationship is plotted (right). Data are represented as mean ± SEM.
-
Figure 9—figure supplement 2—source data 1
M1 and M2 calcium currents in the presence of TTA-P2.
- https://cdn.elifesciences.org/articles/80749/elife-80749-fig9-figsupp2-data1-v2.xlsx
Figure 9—figure supplement 3

TTA-P2 does not block hyperpolarization-activated cyclic nucleotide-gated (HCN) channels.
(A) Left: example trace showing HCN tail currents before (black) and after the application of TTA-P2 (purple). Right: quantification of tail current amplitude in the presence (black, n = 9) and absence of TTA-P2 (purple, n = 6). Analysis performed with Mann–Whitney U test (see 'Materials and methods'). n.s., not significant. Bars represent mean.
-
Figure 9—figure supplement 3—source data 1
M2 hyperpolarization-activated cyclic nucleotide-gated (HCN) tail currents in the presence of TTA-P2.
- https://cdn.elifesciences.org/articles/80749/elife-80749-fig9-figsupp3-data1-v2.xlsx
Figure 10 with 1 supplement
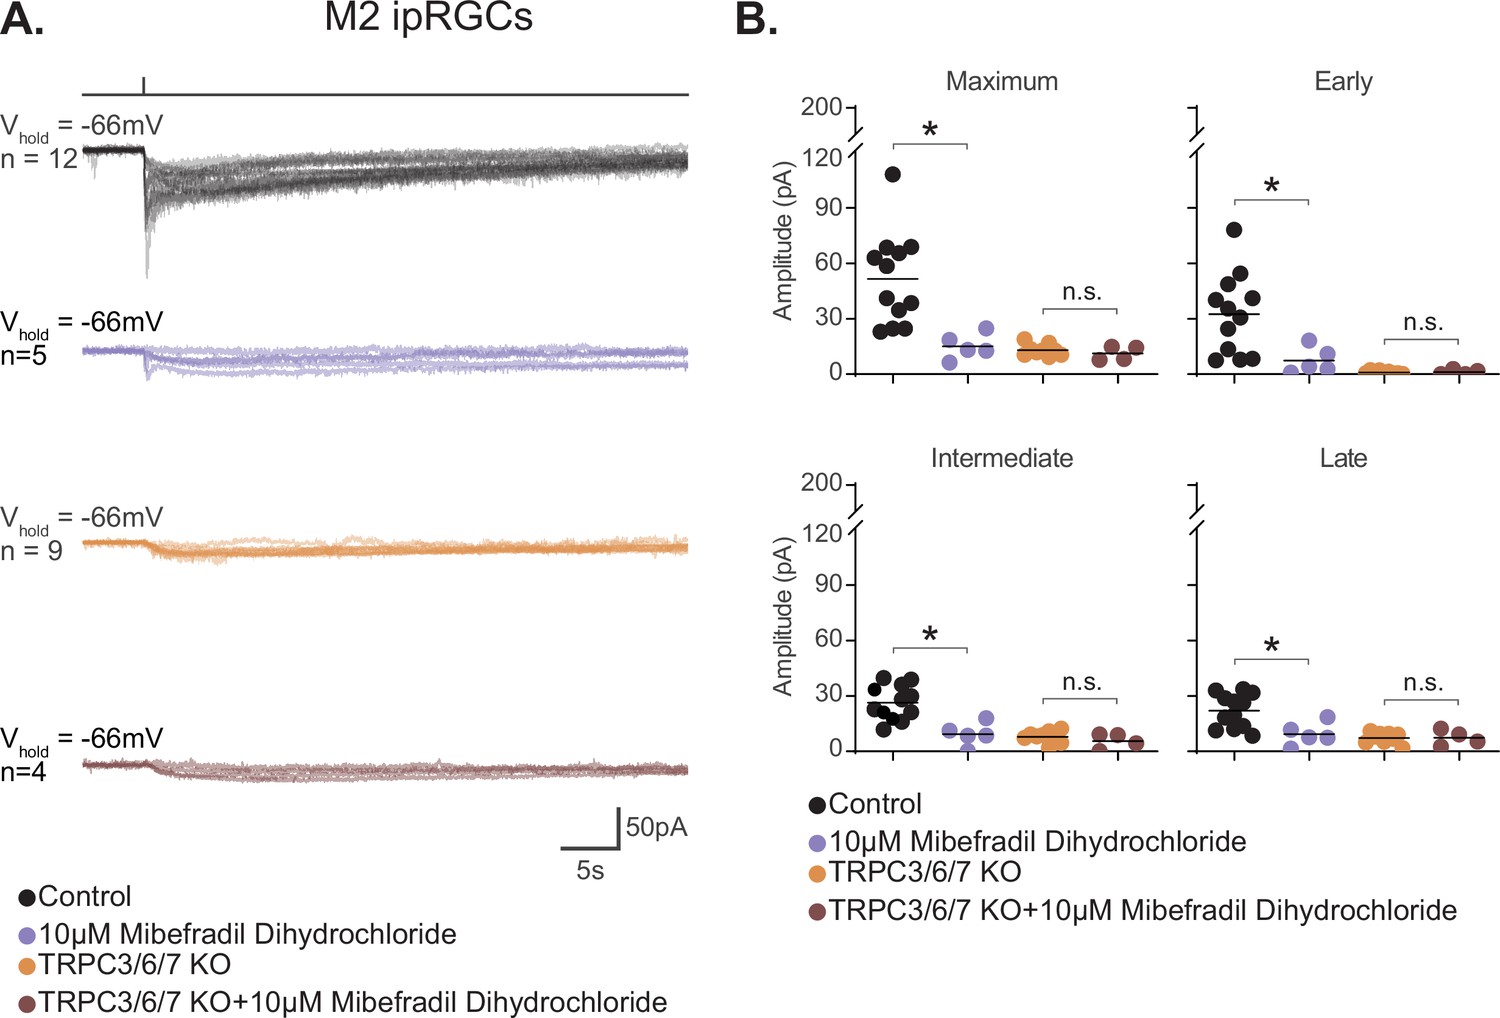
M2 photocurrent is blocked by a second T-type voltage-gated calcium channel (VGCC) antagonist, mibefradil dihydrochloride.
(A) Photocurrent of Control (black, n = 12) and TRPC3/6/7 KO (orange, n = 9) M2 cells recorded in synaptic blockers alone. Control and TRPC3/6/7KO M2 cells incubated in the T-type VGCC antagonist 10 μM mibefradil dihydrochloride. Control (lilac, n = 5) and TRPC3/6/7 KO (brown, n = 4) M2 cells in synaptic blockers plus 10 μM mibefradil dihydrochloride. Cells were stimulated with a 50 ms flash of blue (480 nm) light (6.08 × 10¹⁵ photons · cm–2 · s–1). (B) Absolute value of photocurrent amplitudes for cells recorded in (A). The Maximum (p=0.0023), Early (p=0.0136), Intermediate (p=0.0023), and Late (p=0.0136) component amplitudes of the photocurrent are significantly reduced in the M2 intrinsically photosensitive retinal ganglion cells (ipRGCs) in the presence of 10 μM mibefradil dihydrochloride (lilac, n = 5). No further reduction of photocurrent was observed when TRPC3/6/7 M2 cells were incubated with 10 μM mibefradil dihydrochloride, indicating that TRPC3/6/7 channels and T-type VGCCs are acting in the same pathway. Bars in (B) represent mean.
-
Figure 10—source data 1
Photocurrent components for Control and TRPC3/6/7 KO M2 cells exposed to a second T-type voltage-gated calcium channel antagonist, mibefradil dihydrochloride.
- https://cdn.elifesciences.org/articles/80749/elife-80749-fig10-data1-v2.xlsx
Figure 10—figure supplement 1

Blockade of non-T-type voltage-gated calcium channels (VGCCs) does not reduce M2 photocurrent.
(A) Photocurrent of M2 intrinsically photosensitive retinal ganglion cells (ipRGCs) in Control solution containing synaptic blockers alone (black, n = 12) or in a cocktail of synaptic blockers and VGCC blockers except for 10 μM mibefradil dihydrochloride (sky blue, n = 5). Blockers used 10 μM nifedipine, 5 μM nimodipine, 400 nM ω-agatoxin IVA, 3 μM ω-conotoxin GVIA, and 3 nM SNX-482. Bottom row are the overlaid average light response traces. (B) Absolute value of photocurrent amplitudes for cells in (A). Analysis performed with Mann–Whitney U test (see 'Materials and methods'). n.s., not significant. Bars in (B) represent mean.
-
Figure 10—figure supplement 1—source data 1
Photocurrent components for M2 intrinsically photosensitive retinal ganglion cells (ipRGCs) in a cocktail of voltage-gated calcium channel (VGCC) antagonist except for T-type VGCC antagonist.
- https://cdn.elifesciences.org/articles/80749/elife-80749-fig10-figsupp1-data1-v2.xlsx
Figure 11
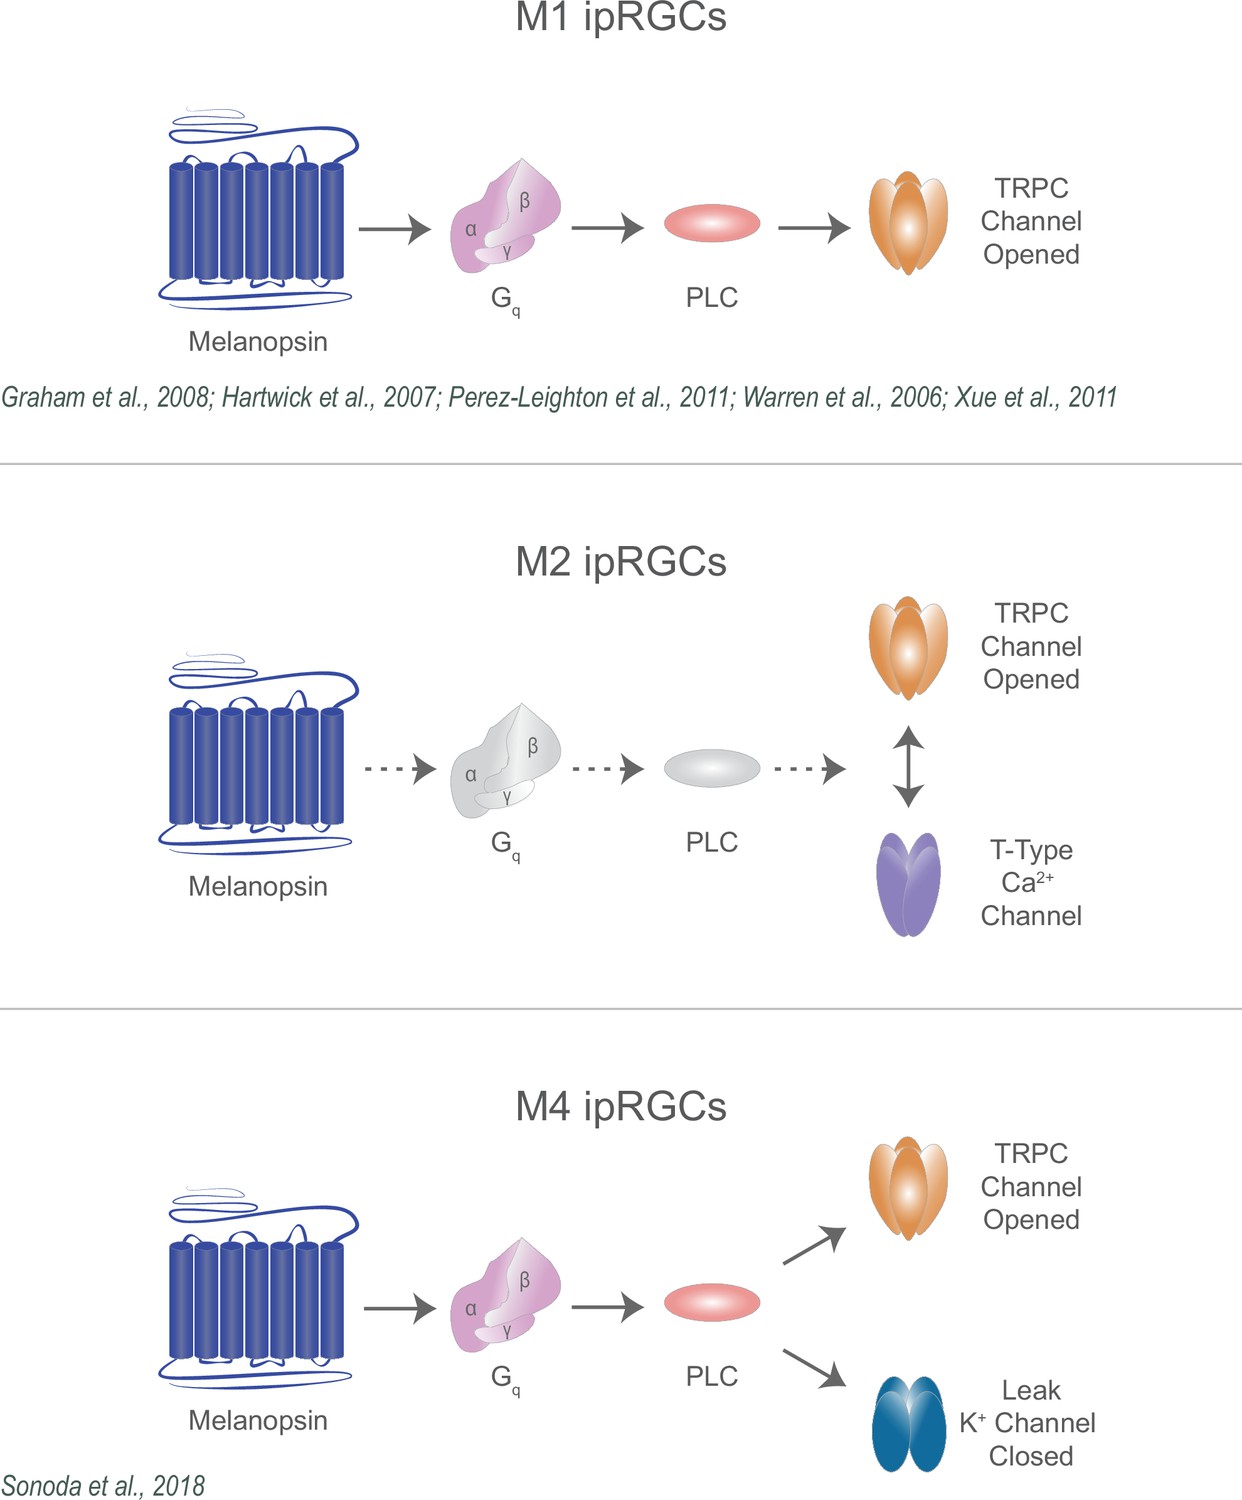
Diverse melanopsin phototransduction pathways in intrinsically photosensitive retinal ganglion cell (ipRGC) subtypes.
Diagram depicting melanopsin phototransduction in M1, M2, and M4 ipRGCs updated from previous work based on current findings. Figure adapted from Figure 3 of Contreras et al., 2021 (Warren et al., 2006; Graham et al., 2008; Xue et al., 2011; Jiang et al., 2018; Sonoda et al., 2018; Perez-Leighton et al., 2011).
Tables
Table 1
Side-by-side comparison of parameters and cell subtype identification criteria in the current study and Jiang et al., 2018.
Citations provided in ‘Materials and methods’.
| Current study | Jiang et al., 2018 | |||
|---|---|---|---|---|
| M2 | M4 | M2 | M4 | |
| Mouse models | Opn4-GFP Trpc3-/-; Trpc6-/-; Trpc7-/- | WT Trpc3-/-; Trpc6-/-; Trpc7-/- | Opn4-tdTomato Primarily: Trpc6-/-; Trpc7-/- Figure 2: Trpc1-/-; Trpc3-/-; Trpc4-/-; Trpc5-/-; Trpc6-/-; Trpc7-/- | Opn4-tdTomato Primarily: Trpc6-/-; Trpc7-/- Figure 2: Trpc1-/-; Trpc3-/-; Trpc4-/-; Trpc5-/-; Trpc6-/-; Trpc7-/- |
| Cell targeting ex vivo | Epifluorescence intensity | IR-DIC/soma size and ON-sustained light response | Epifluorescence intensity/soma size | Epifluorescence intensity/soma size |
| Subtype identity | During recording:
| During recording:
| Intracellular dye filling: Alexa 568 for morphological analysis of dendritic arbors (criteria unspecified) | Intracellular dye filling: Alexa 568 for morphological analysis of dendritic arbors (criteria unspecified) |
| Mice dark-adapted | Vernight | 3 hr | ||
| Technique | Whole-cell voltage-clamp recording | Whole-cell voltage-clamp recording | ||
| Holding potential | –66 mV for all experiments unless otherwise mentioned | –66 mV for all experiments except Figure 4 | ||
| Internal Solution (mM) | 120 K-gluconate, 5 NaCl, 4 KCl, 10 HEPES, 2 EGTA, 4 ATP-Mg, 0.3 GTP-Na2 and 7-Phosphocreatine-Tris, with the pH adjusted to 7.3 with KOH | 120 K-gluconate, 5 NaCl, 4 KCl, 10 HEPES, 2 EGTA, 4 ATP-Mg, 0.3 GTP-Na2 and 7-Phosphocreatine-Tris, with the pH adjusted to 7.3 with KOH | ||
| Synaptic Blockers | 100 μM DNQX, 20 μM L-AP4, 100 μM picrotoxin, and 20 μM strychnine | 20 μM DNQX, 50 μM AP5, 100 μM Hexamethonium, 100 μM picrotoxin, and 1 μM Strychnine | ||
| Recording Temperature | 30–32°C | 30–32°C | ||
| ZD7288 Conditions | Concentration: 50 μM Incubation time for effective HCN blockade: 5–8 min Incubation time driving off-target effects: 20 min | Concentration: 50 μM Incubation time: not reported | ||
| Light step | 50 ms | 200 ms | ||
| Light intensity | 6.08 × 10¹⁵ photons · cm–2 · s–1 blue LED light (480 nm) | White light of an intensity equivalent to 1.75 × 10¹⁸ photons cm–2 s–1 of 480 nm light for melanopsin (conversion done by response-matching in the linear range) | ||
-
IR-DIC, infrared differential interference contrast; ipRGCs, intrinsically photosensitive retinal ganglion cells.
Additional files
Download links
A two-part list of links to download the article, or parts of the article, in various formats.
Downloads (link to download the article as PDF)
Open citations (links to open the citations from this article in various online reference manager services)
Cite this article (links to download the citations from this article in formats compatible with various reference manager tools)
Melanopsin activates divergent phototransduction pathways in intrinsically photosensitive retinal ganglion cell subtypes
eLife 12:e80749.
https://doi.org/10.7554/eLife.80749


