MorphoFeatures for unsupervised exploration of cell types, tissues, and organs in volume electron microscopy
- Cell Biology and Biophysics Unit, European Molecular Biology Laboratory (EMBL), Germany
- European Bioinformatics Institute, European Molecular Biology Laboratory (EMBL), United Kingdom
- Developmental Biology Unit, European Molecular Biology Laboratory (EMBL), Germany
Figures
Figure 1
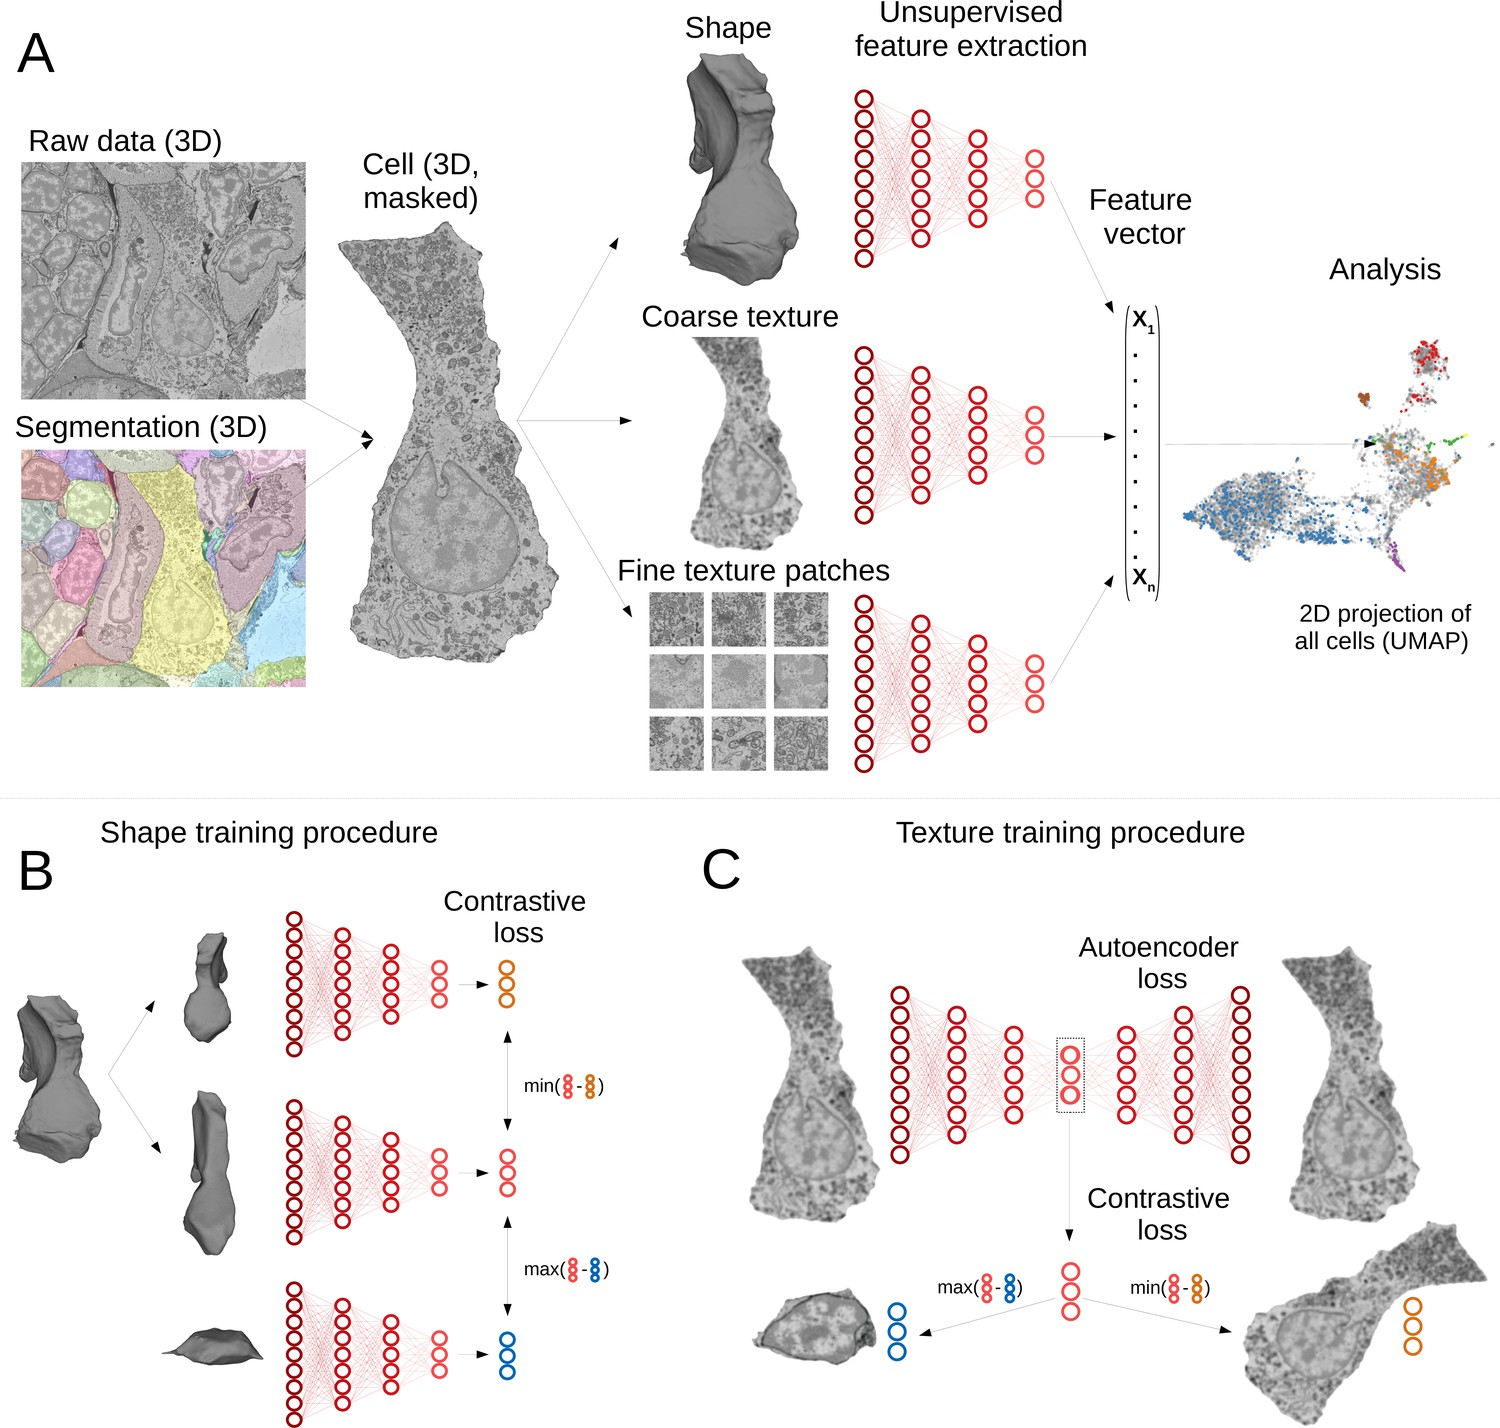
Deep-learning pipeline for extracting MorphoFeatures.
(A) Cell segmentation is used to mask the volume of a specific cell (and its nucleus) in the raw data. Neural networks are trained to represent shape, coarse, and fine texture from the cell volume (separately for cytoplasm and nuclei). The resulting features are combined in one MorphoFeatures vector that is used for the subsequent analysis. (B) Training procedure for the shape features. A contrastive loss is used to decrease the distance between the feature vectors of two augmented views of the same cell and increase the distance to another cell. (C) Training procedure for the coarse and fine texture features (here illustrated by coarse texture). Besides the contrastive loss, an autoencoder loss is used that drives the network to reconstruct the original cell from the feature vector.
Figure 2 with 2 supplements
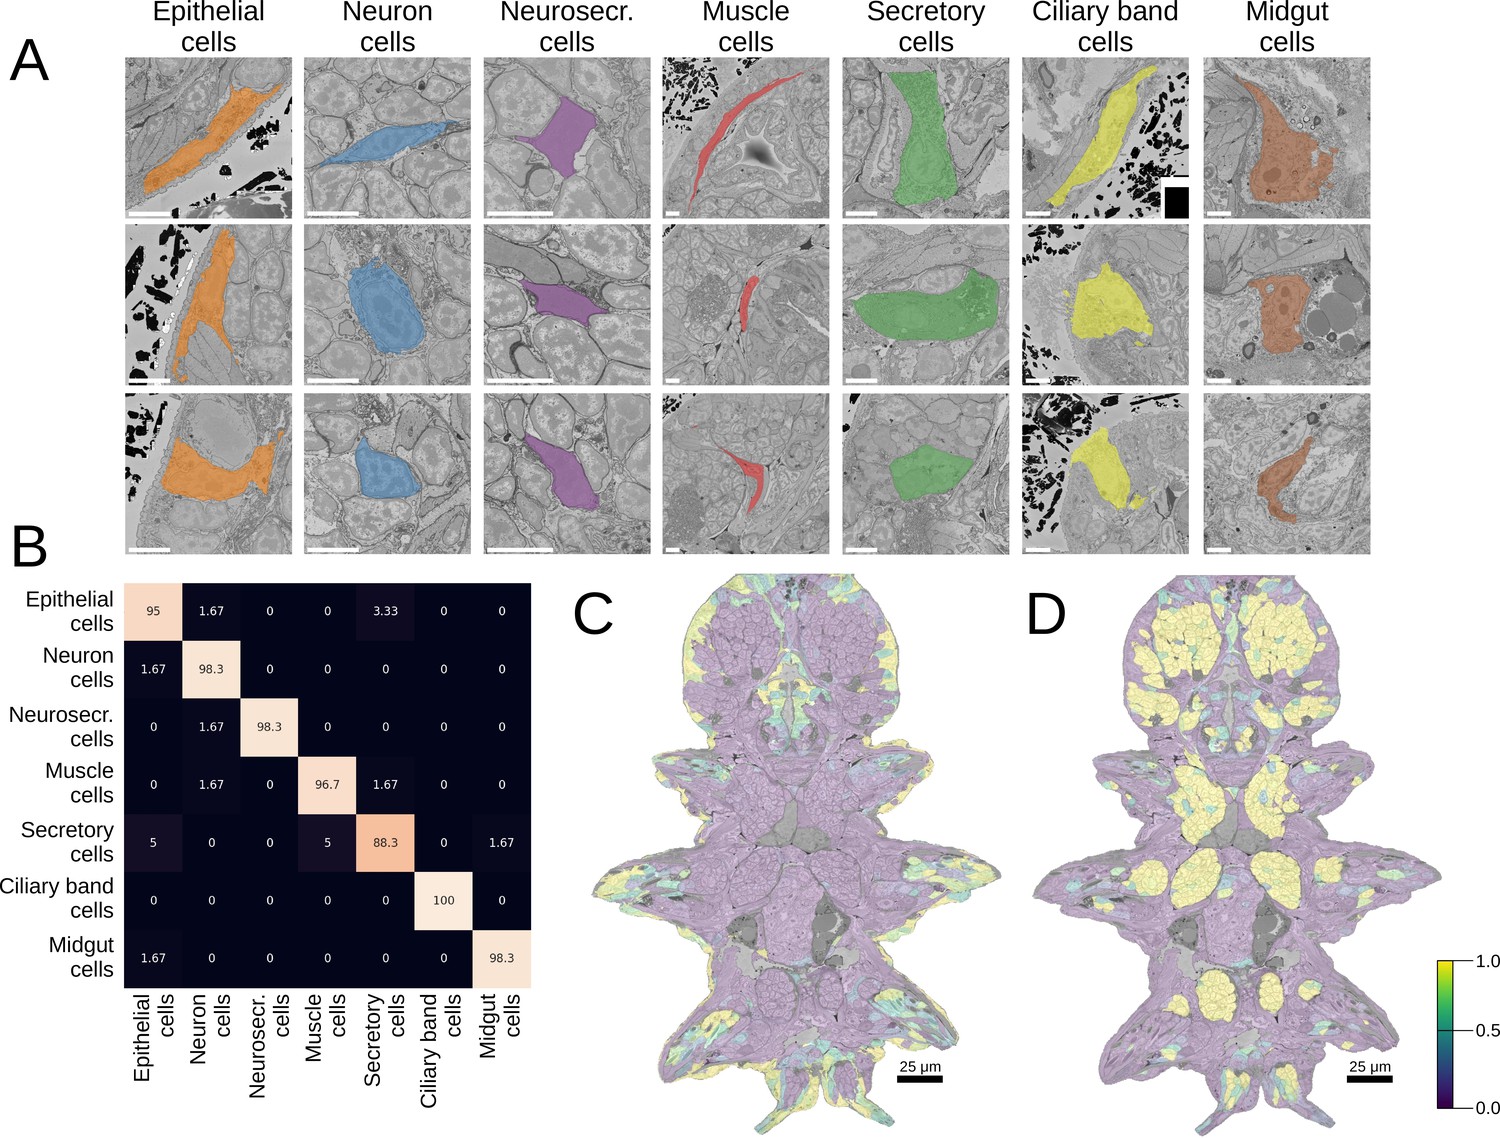
Morphological class prediction.
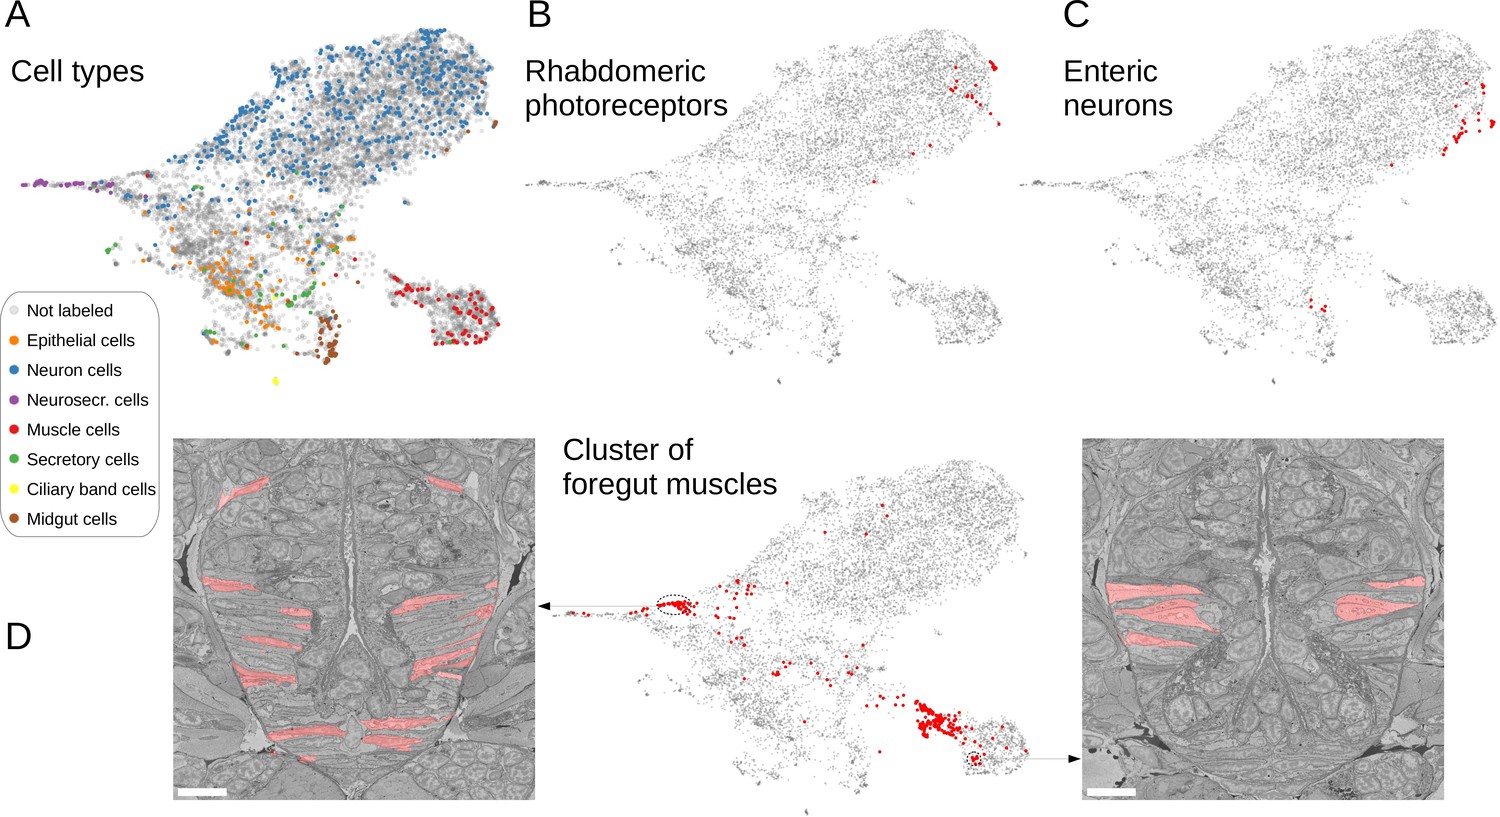
(A) Examples of cells from seven manually defined morphological classes used for evaluation. (B) Confusion matrix of class prediction for the logistic regression model. Rows are the labels, and columns are the predictions. Scale bars: 5 μm. (C) The predicted probability of the epithelial class in the whole animal. Note that while a few cells on the animal surface have been used for training of the logistic regression, no labels were given in the foregut opening or chaetae which are still correctly recognised as epithelial. (D) The predicted probability of neural cells in the whole animal.
Figure 2—figure supplement 1
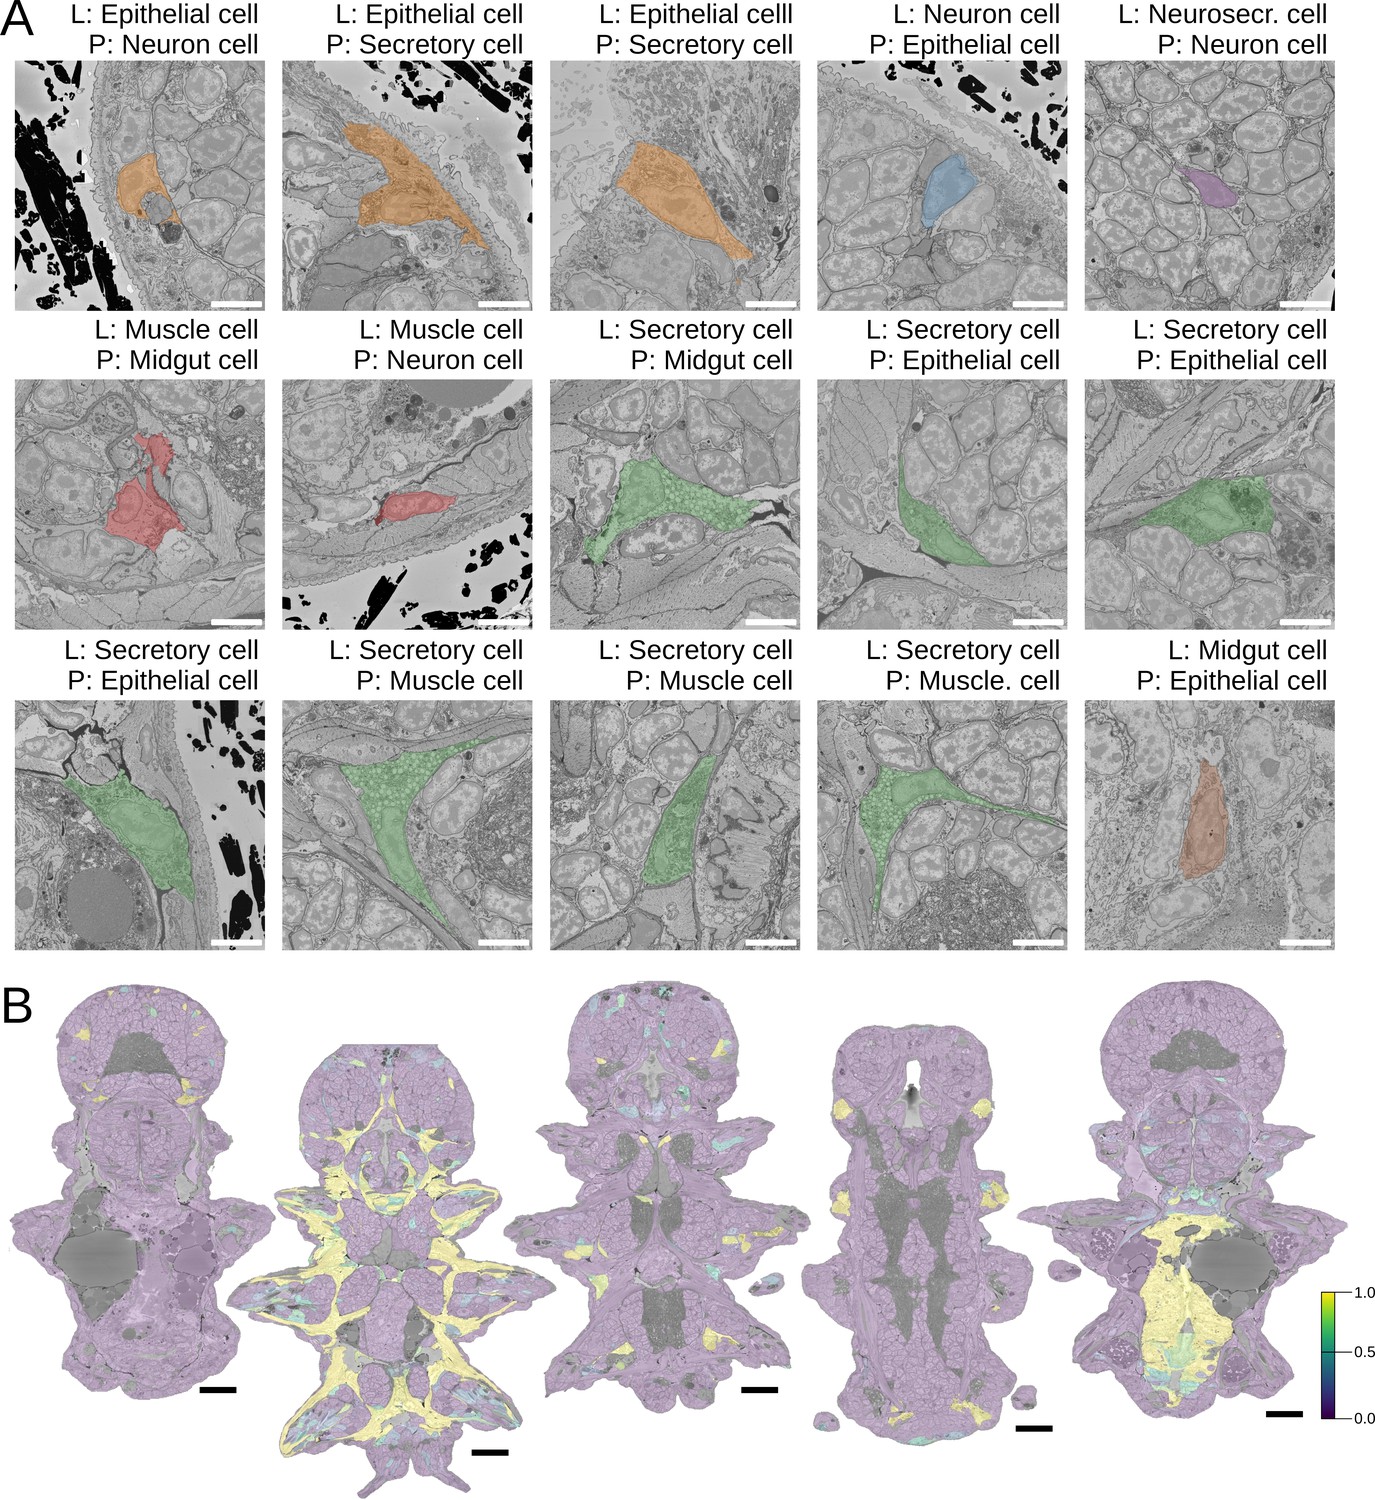
Morphological class predictions.
(A) All the errors made during any of the cross-validation runs of the logistic regression model (L – true label, P – prediction, scale bars: 5 µm). B. Whole-animal prediction of (from left to right) dark neurosecretory, muscle, secretory, ciliary band, and midgut cells (scale bars: 25 µm).
Figure 2—figure supplement 2
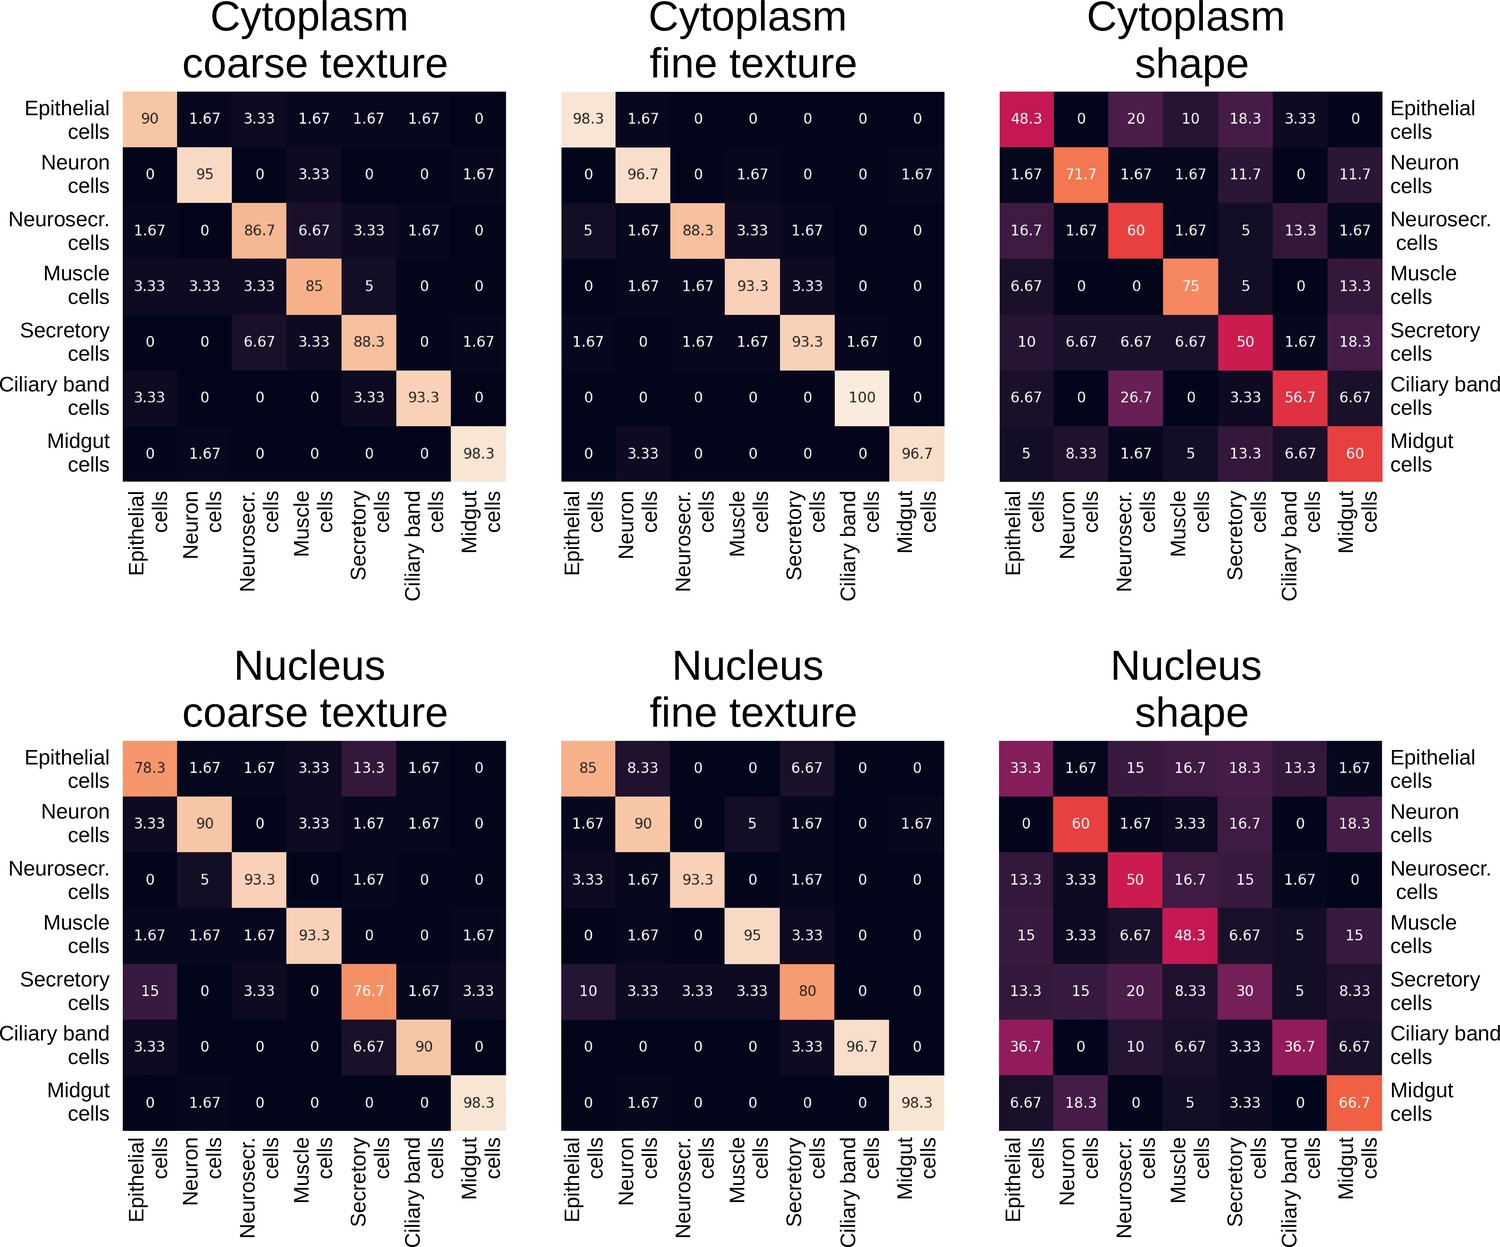
Confusion matrix of class predictions for the logistic regression model using separate morphological components.
Rows are the labels, and columns are the predictions.
Figure 3 with 2 supplements
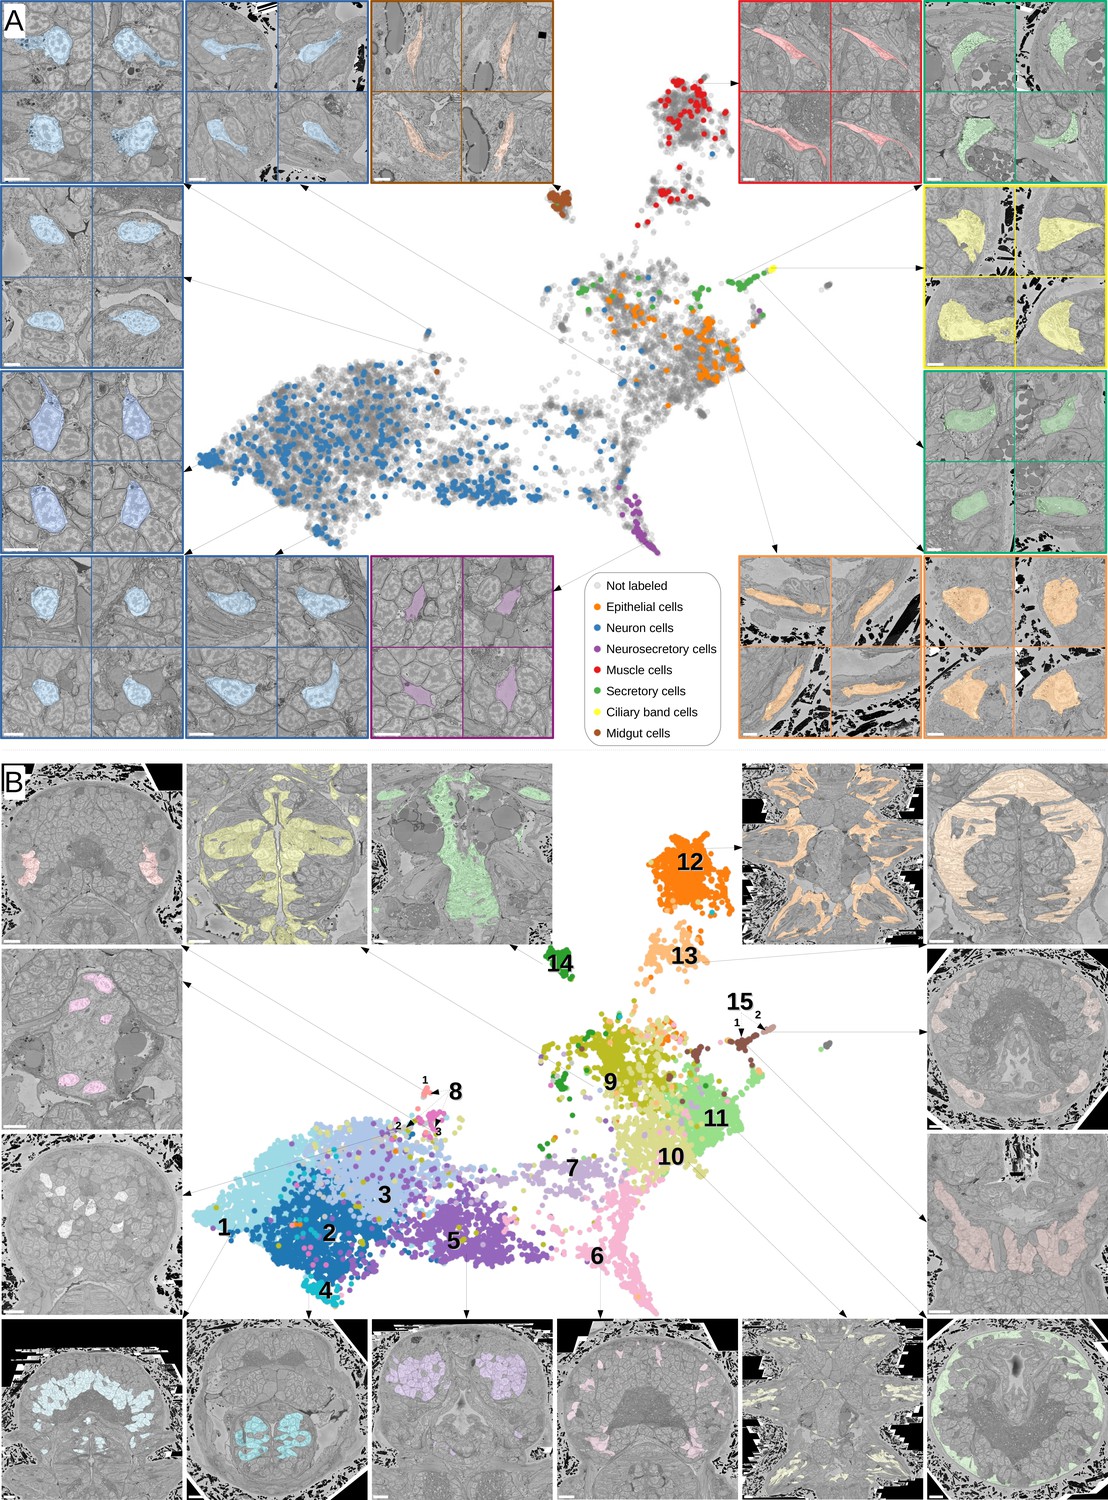
Visual analysis of MorphoFeatures representations.
(A) Finding visually similar cells using MorphoFeatures. Multidimensional features are visualised in 2D using UMAP. Each point represents a feature vector of a cell from the dataset. The cells for which annotations are available are visualised in respective colours. For a random cell, the cell and its three closest neighbours in the UMAP space are visualised in the electron microscopy (EM) volume. Scale bars: 5 μm. (B) Visualising morphological clusters. Clustering results are visualised on the MorphoFeatures UMAP representation. For some clusters, the cells comprising the cluster are shown in the animal volume to visualise the cell type. For example, cluster 6 precisely picks out the dark neurosecretory cells, while cluster 14 corresponds to the midgut cells (see Text for more details). Scale bars: 10μm.
Figure 3—figure supplement 1
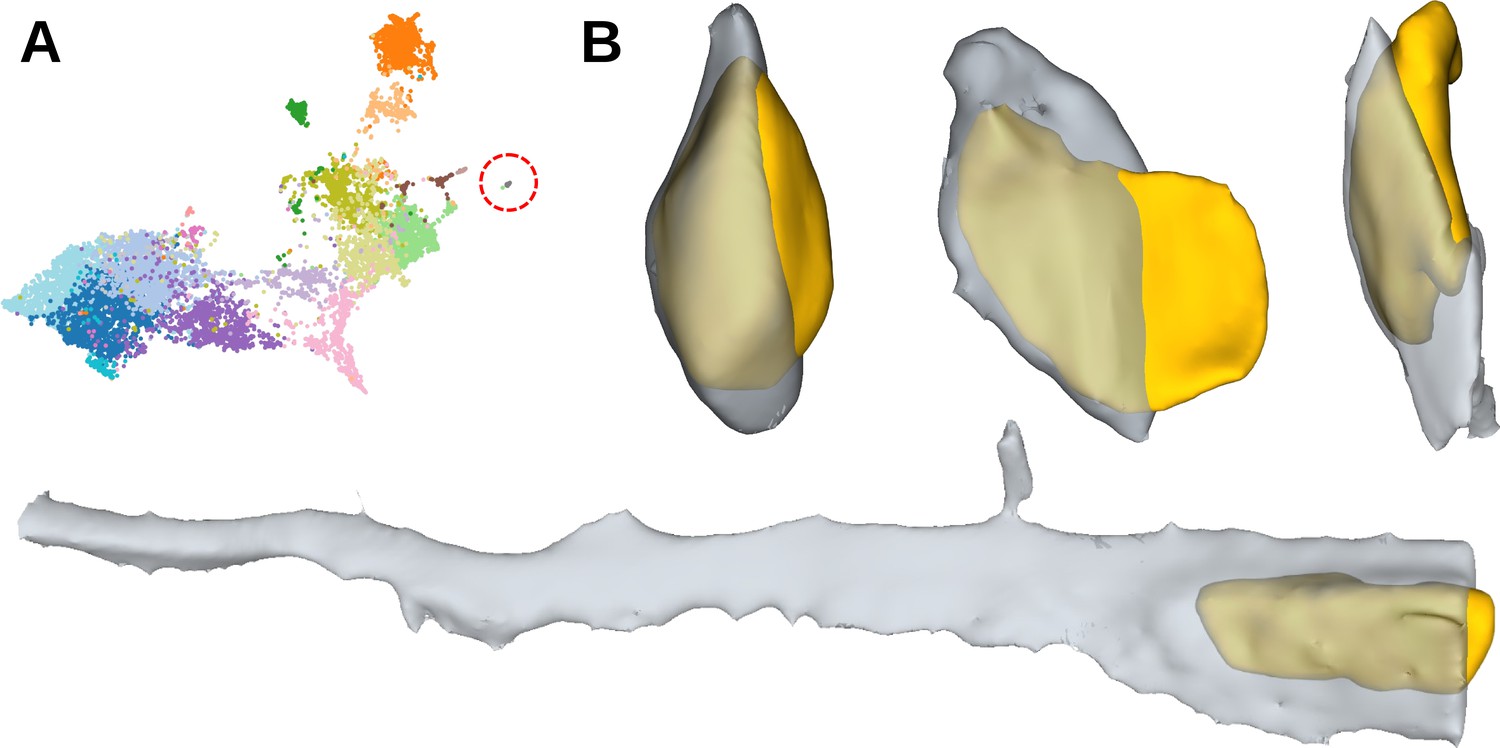
Cluster of split segmentation errors.
(A) The cluster visualised on the UMAP representation. (B) Examples of the cluster cell shapes. Cytoplasm is shown in grey, nuclei - in yellow.
Figure 3—figure supplement 2
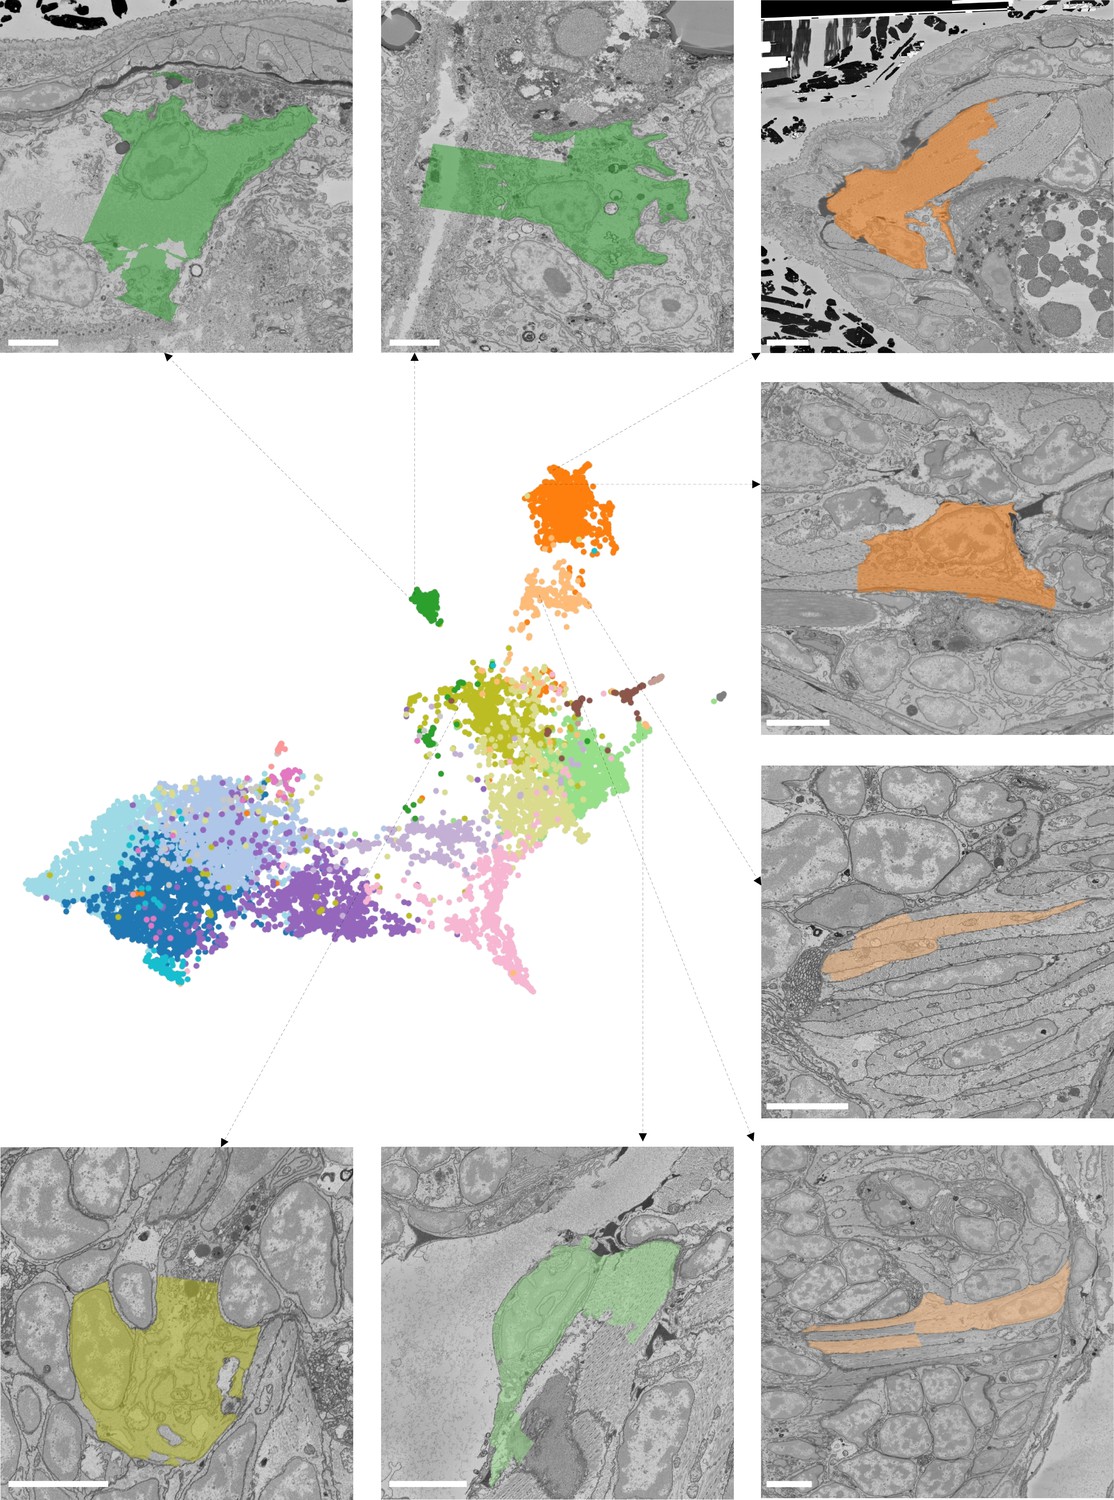
Cells with segmentation errors.
Midgut cells (dark green), long muscles (dark orange), foregut muscles (light orange), and epithelial cell (light green) still get assigned to the correct cluster. Neuron (dark yellow) get wrongly assigned to epithelial cells cluster. Scale bars: 5 μm.
Figure 4 with 2 supplements
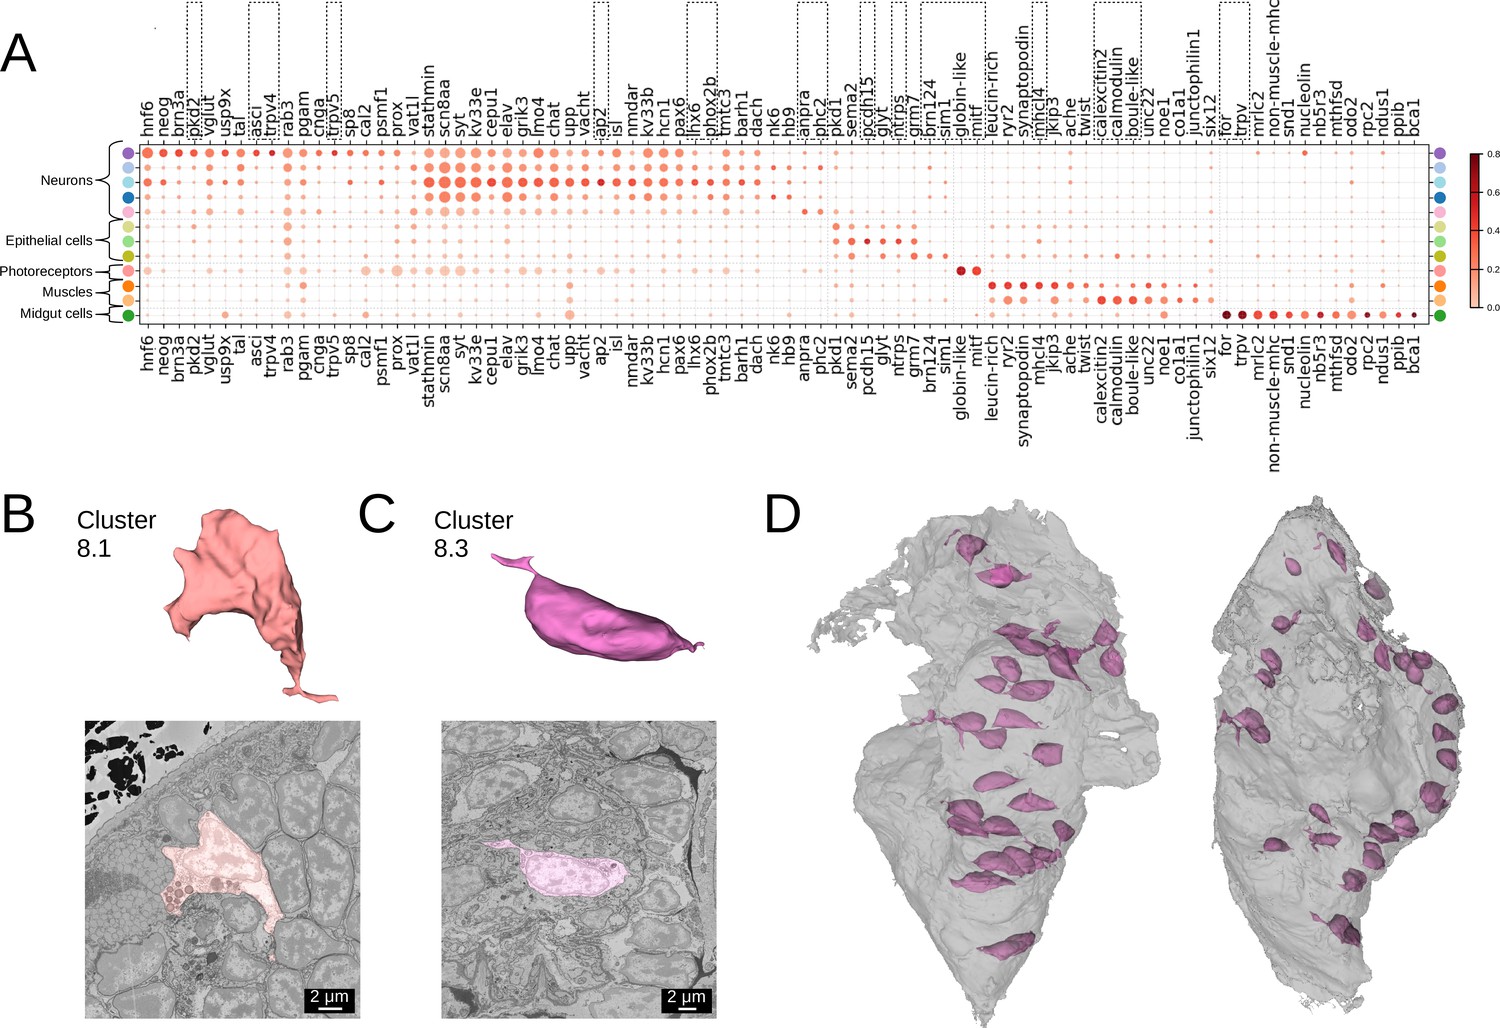
Clustering and gene analysis.
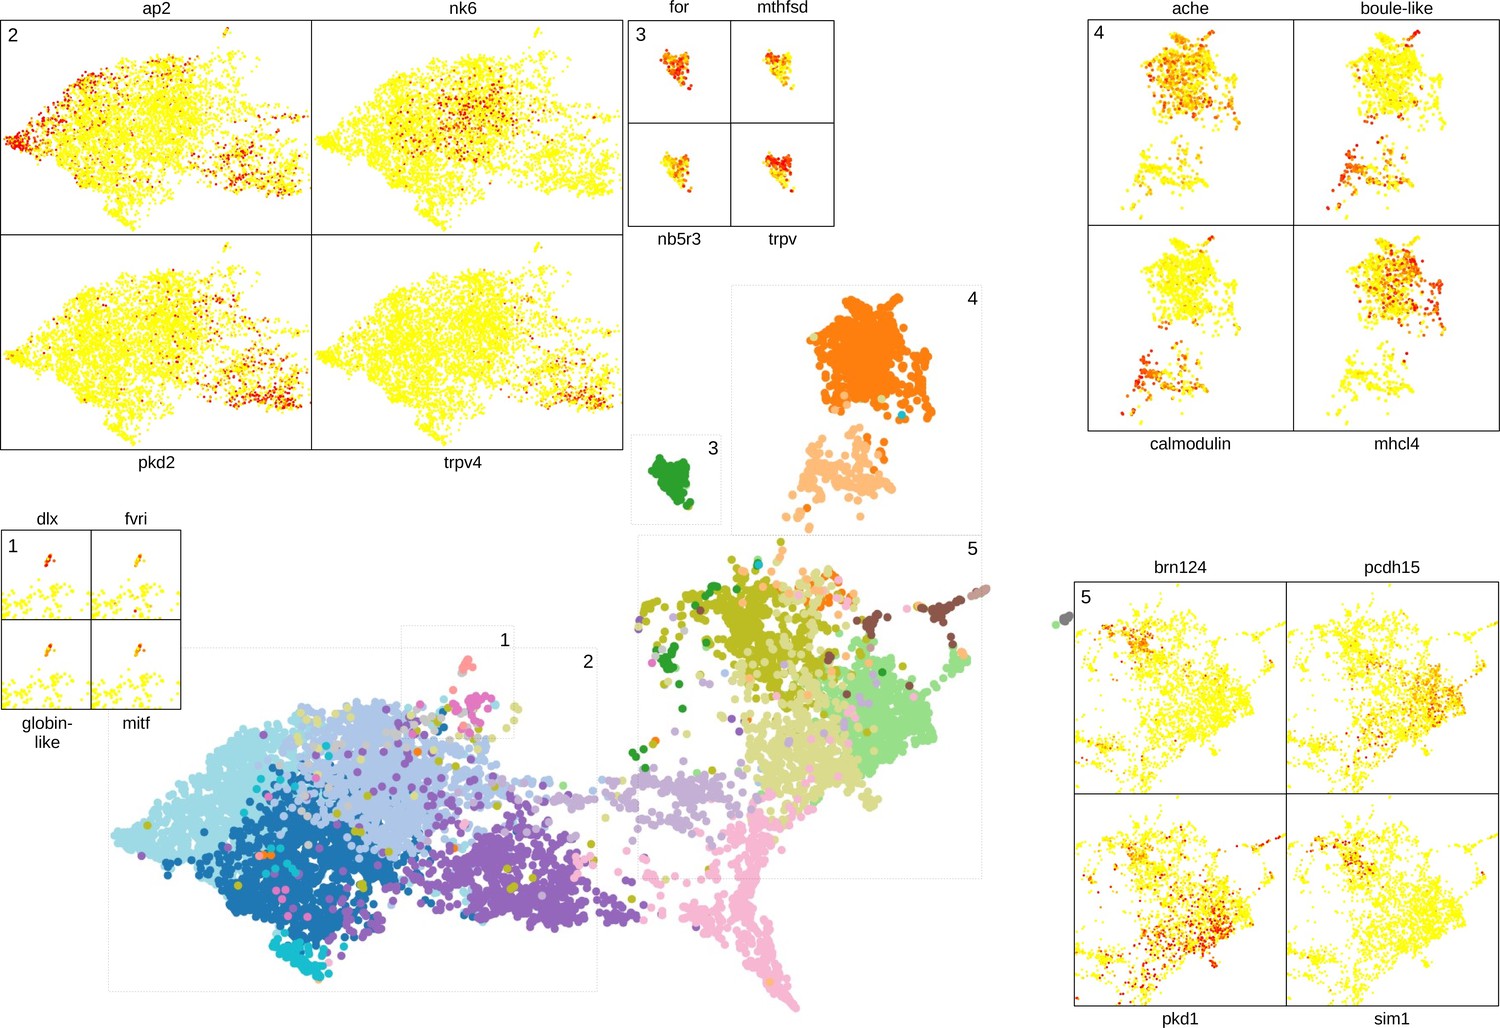
(A) Gene expression dot plot. The size of the dots shows how much of a cluster expresses a gene; the colour shows how much of the expression of a gene is confined to a cluster (see Materials and methods). The genes mentioned in the text are enboxed. The clusters lacking highly specific gene expression were not included. (B-C) The average shape and texture (see Materials and methods) of (B) rhabdomeric photoreceptors (cluster 8.1) and (C) the enteric neurons (cluster 8.3). (D) Localisation of the enteric neurons (pink) in the midgut volume (grey). Left: frontal view and right: side view.
Figure 4—figure supplement 1
Clustering and gene analysis.
Some of the genes shown to be differentially expressed in neuron, midgut, muscle, and epithelial clusters and in the photoreceptor cells are visualised on the UMAP representation.
Figure 4—figure supplement 2
Comparing MorphoFeatures to a set of manually defined features from Vergara et al., 2021.
(A) The set of manually defined features is visualised in 2D using UMAP. The cells for which annotations are available are visualised in respective colours. (B and C) The MorphoFeatures cluster of (B) the rhabdomeric photoreceptors and (C) enteric neurons is visualised on the UMAP representation of the manually defined features, showing a bigger spread of cells across the morphological space. (D) The MorphoFeatures cluster of the foregut muscles is split into multiple groups on the UMAP representation of the manually defined features. For two groups, cells are visualised in the animal volume, showing similarity of the cells comprising them. Scale bars: 10μm.
Figure 5
Midgut cell types with defining genes.
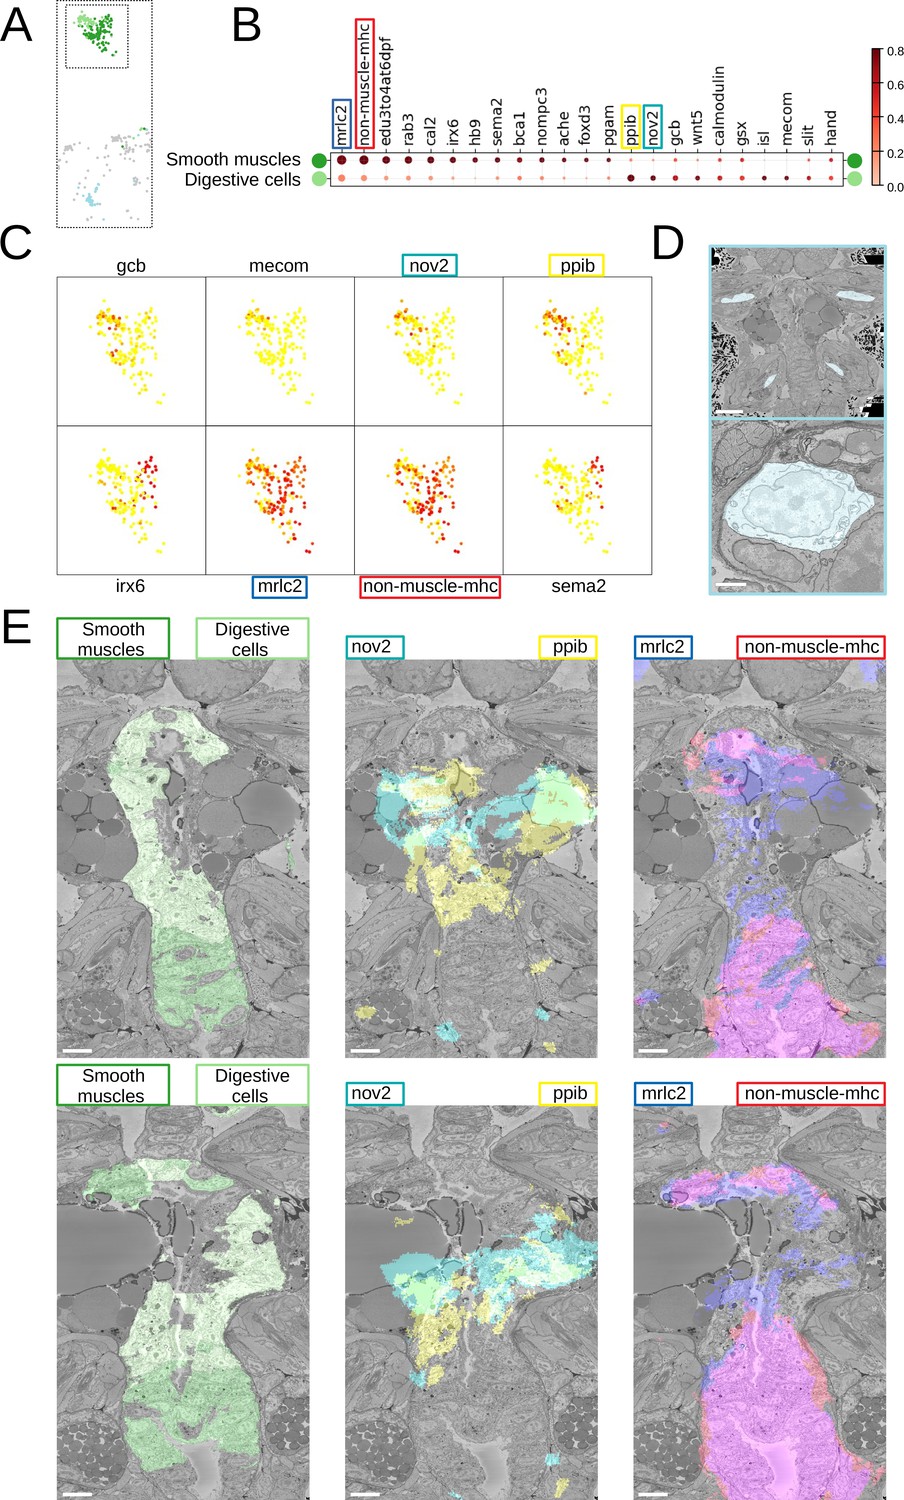
(A) Finer clustering of the midgut cluster results in three subclusters. (B) Gene expression dot plot of the two midgut subclusters that are presumably developing smooth muscles and digestive cells of the midgut. The size of the dots shows how much of a cluster expresses a gene; the colour shows how much of the expression of a gene is confined to a cluster (see Materials and methods). (C) Some of the genes shown to be differentially expressed in the two subclusters, plotted on the UMAP representation. (D) The location (upper panel) and an example cell (lower panel) of the subcluster located in the animal parapodia. Scale bars: upper panel - 25μm, lower panel - 5μm. (E) Cells belonging to the two cell types (left panels) and the genes differentiating them (centre and right panels) are visualised in the animal volume, with colour representing gene expression overlayed on the electron microscopy (EM) plane view. Scale bar: 10μm.
Figure 6 with 1 supplement
Visualisation of the learned features.
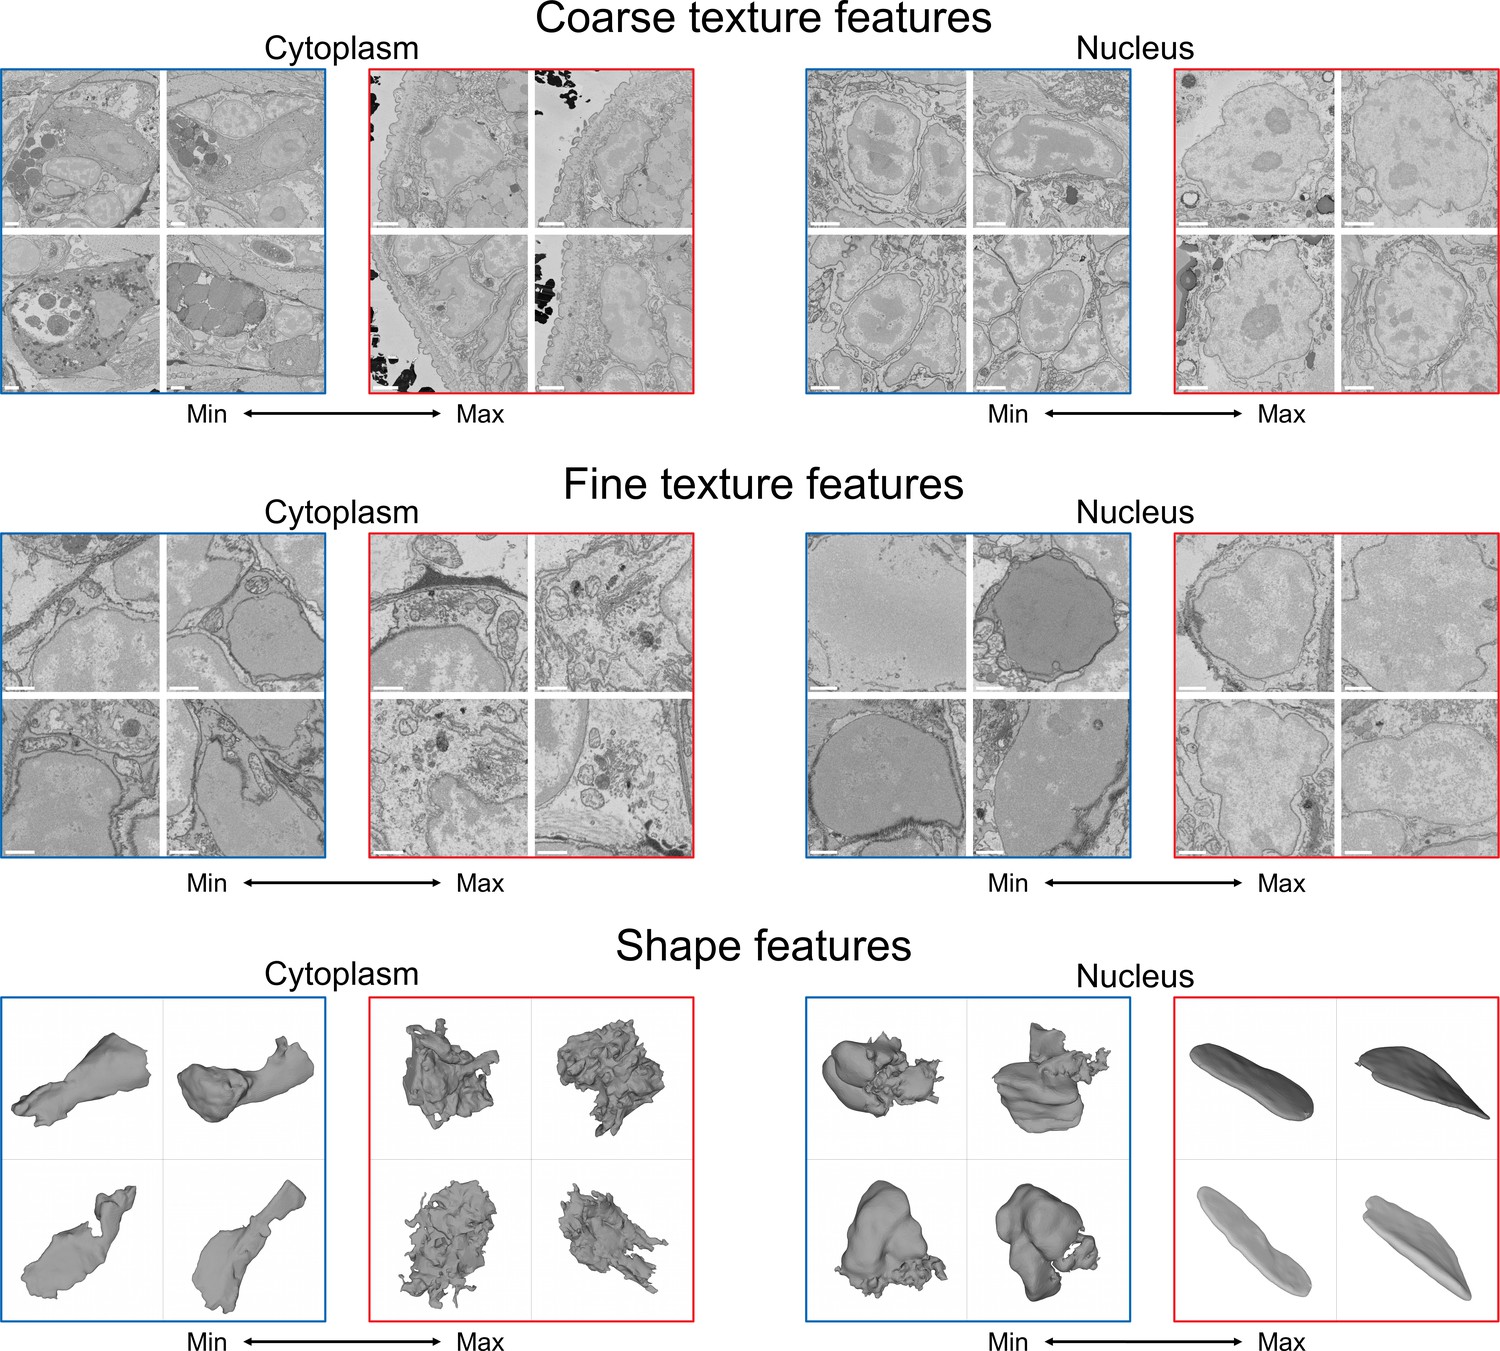
For each feature, four cells with a minimal (blue) and four cells with a maximal (red) value of the feature are shown, see text for detailed analysis. Shown are cytoplasm coarse texture feature 21, nuclear coarse texture feature 4, cytoplasm fine texture feature 50, nuclear fine texture feature 7, cytoplasm shape feature 14, and nuclear shape feature 66. Scale bars: coarse texture - 2μm, fine texture - 1μm.
Figure 6—figure supplement 1
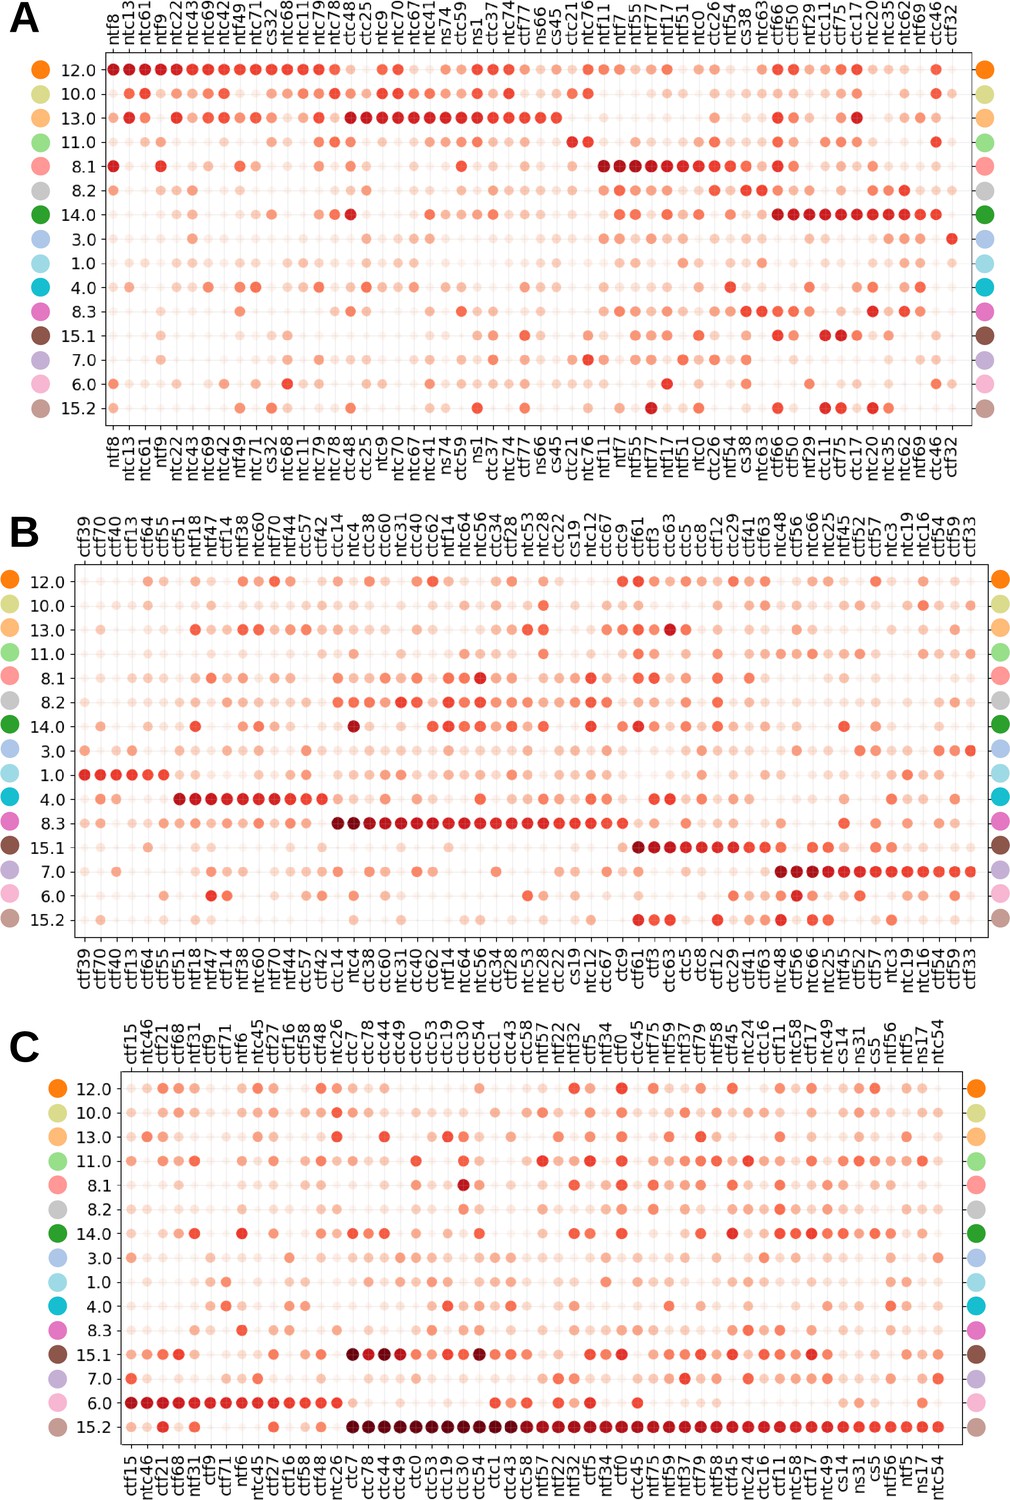
Dot plot of MorphoFeatures specific to clusters (A) 10–14, 8.1, 8.2, and 3, (B) 1, 4, 8.3, 15.1, and 7, and (C) 6 and 15.2.
Figure 7
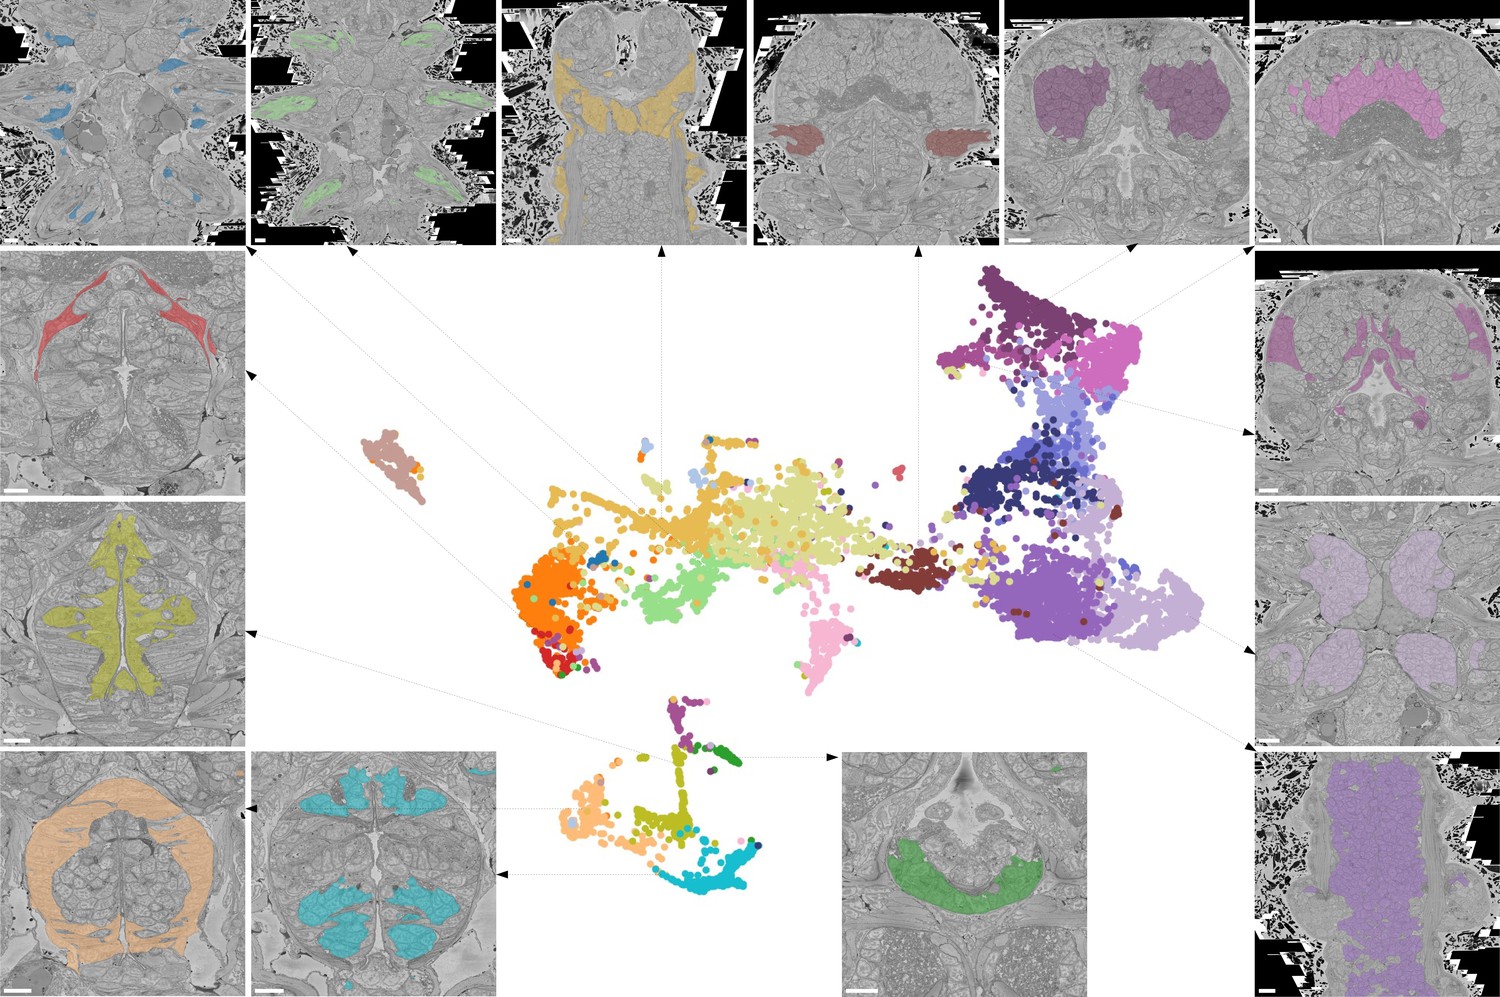
Characterising neighbourhoods with MorphoContextFeatures.
Clustering results are visualised on the MorphoContextFeatures UMAP representation. For some clusters, the cells comprising the cluster are shown in the animal volume to visualise the cell type. Upper panels (from left to right): secretory (blue) and epithelial (green) cells of parapodia, epithelial, and secretory cells of the head, cirral, palpal, and dorsal ganglia. Lower panels (from left to right): foregut muscles, foregut neurons, infracerebral gland, and ventral nerve cord. Left panels (from top to bottom): muscles surrounding the foregut and foregut epithelium. Right panels (from top to bottom): epithelial-sensory circumpalpal cells and peripheral ganglia. Scale bars: 10μm.
Figure 8 with 1 supplement
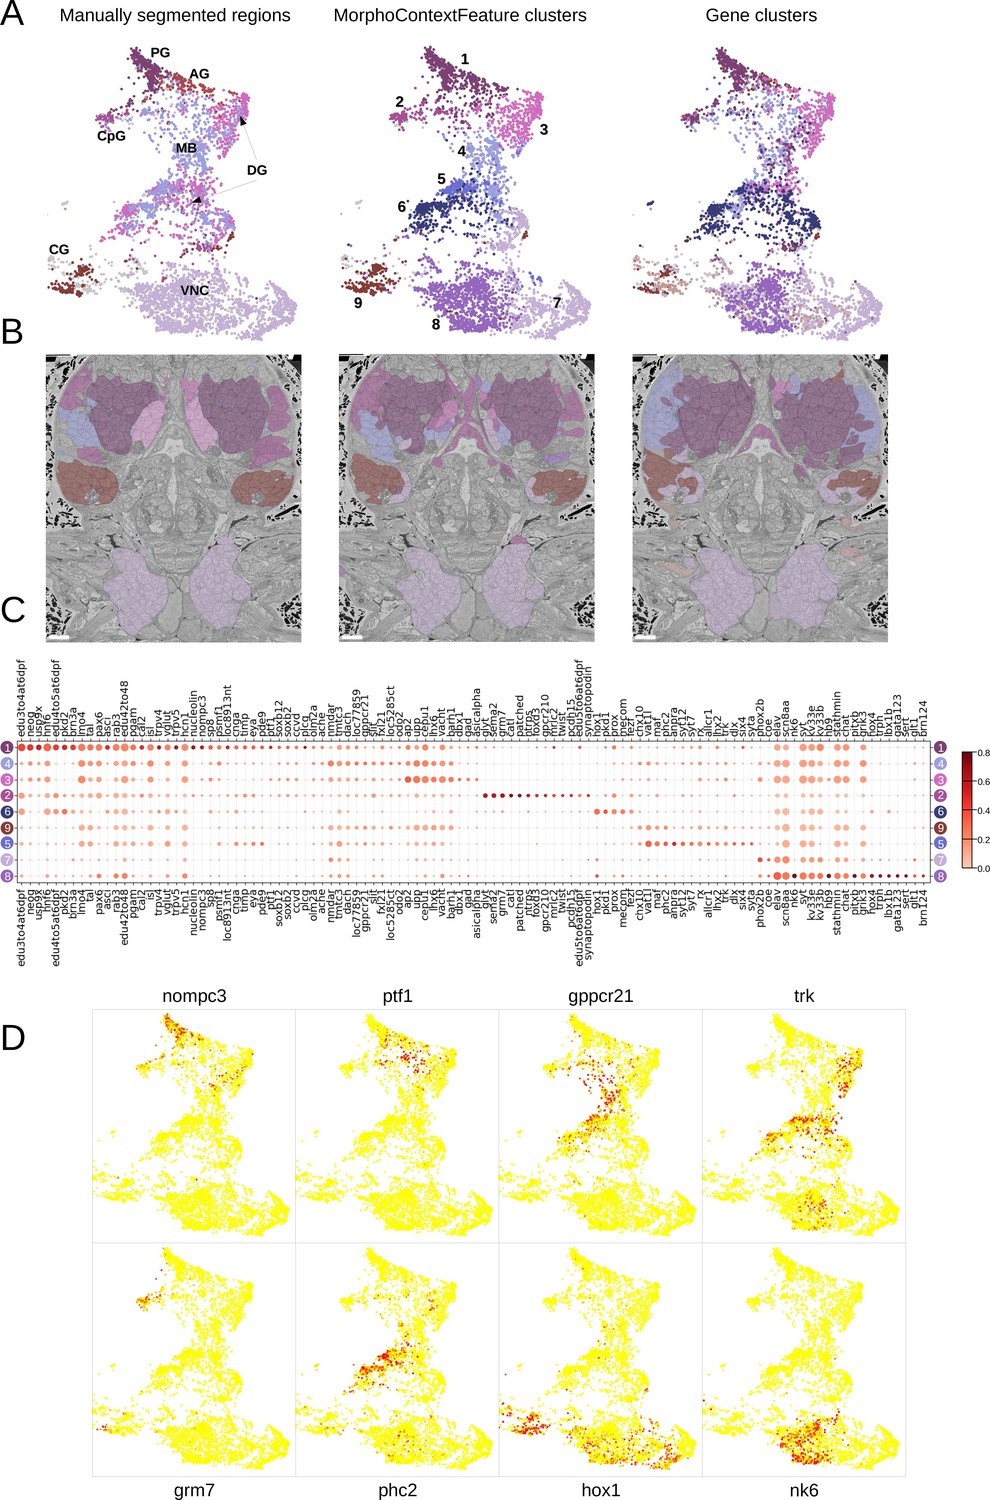
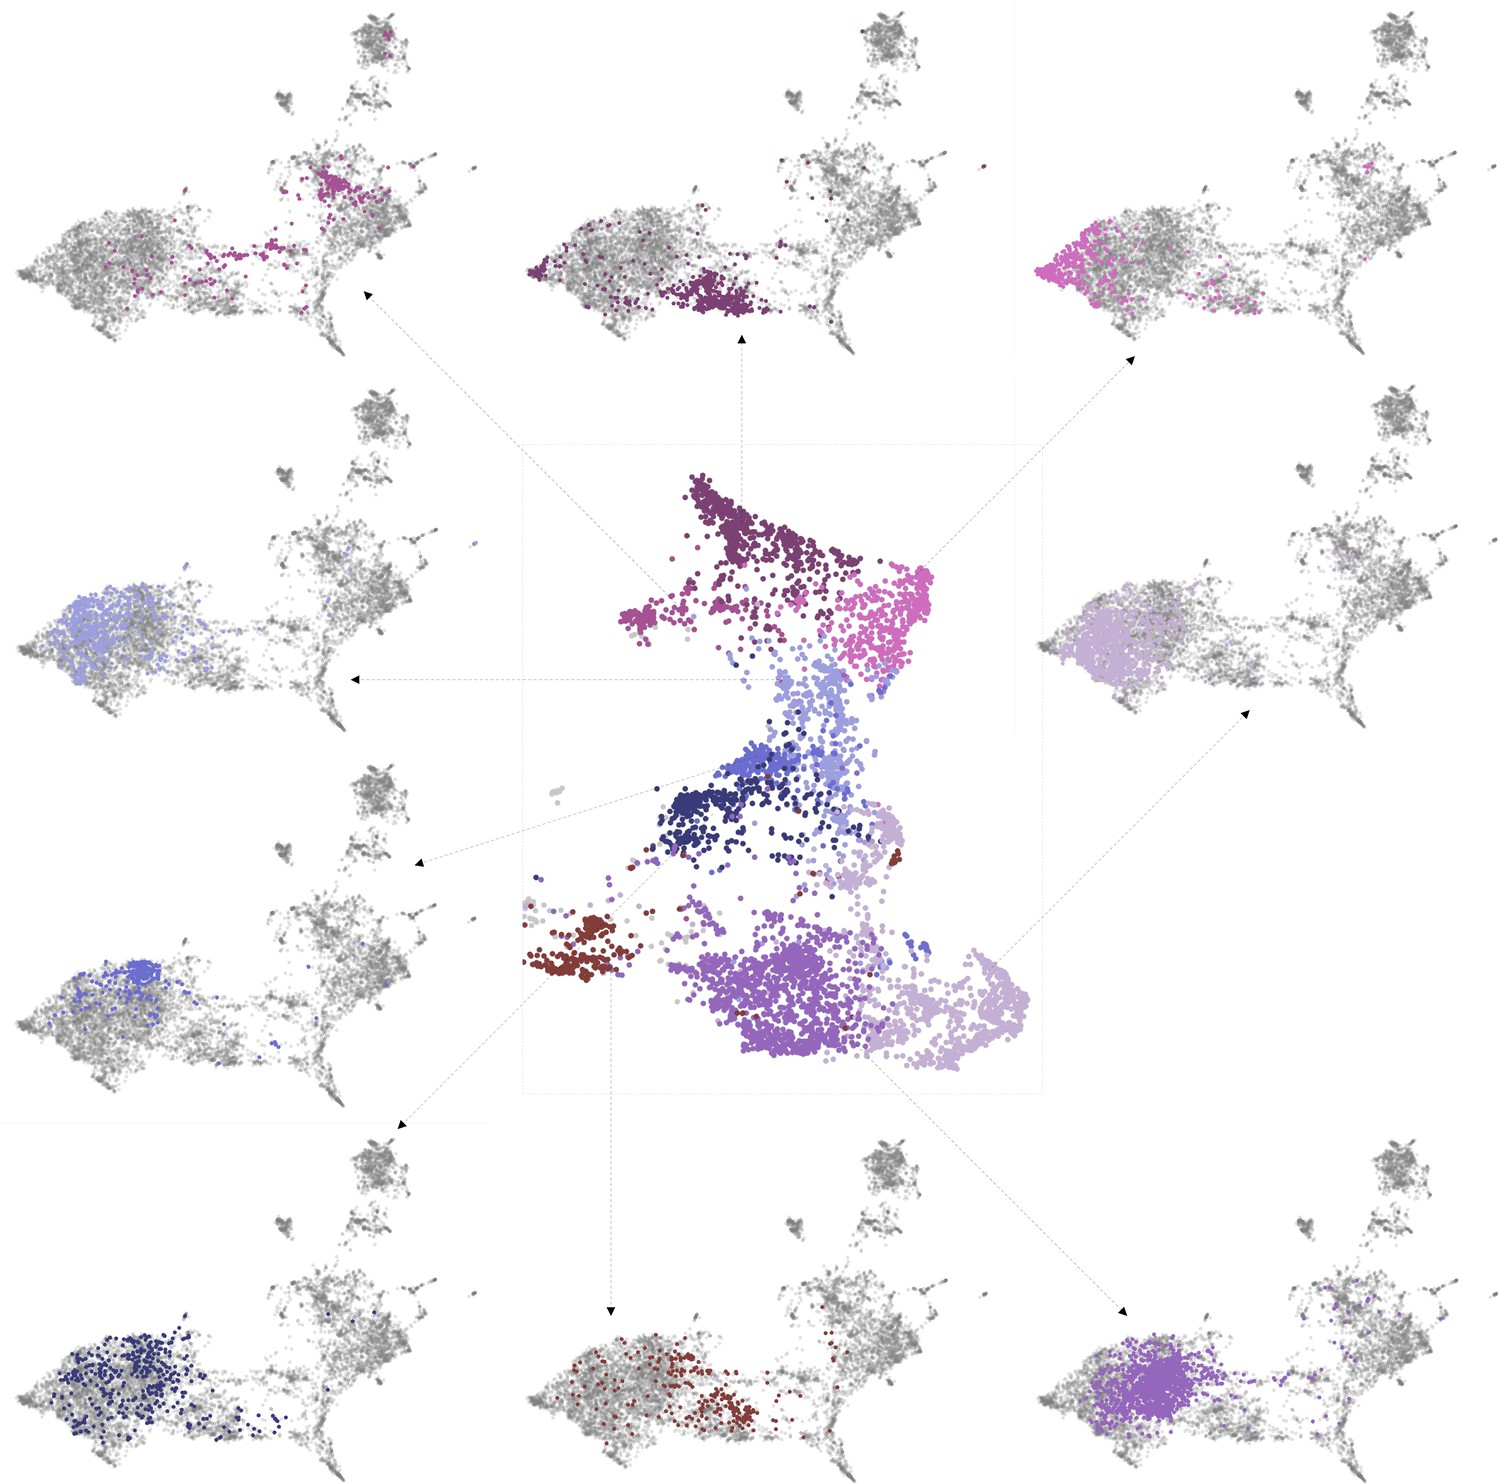
MorphoContextFeatures define ganglionic nuclei.
(A and B) The animal ganglia as defined by manual segmentation (Vergara et al., 2021), our MorphoContextFeature clustering and gene expression clustering displayed on (A) the UMAP representation and (B) in the animal volume. PG, palpal ganglia; CpG, circumpalpal ganglia; AG, antennal ganglia; MB, mushroom bodies; DG, dorsal ganglion; CG, cirral ganglia; VNC, ventral nerve cord. Scale bars: 10μm. (C) Gene expression dot plot of the ganglia defined by MorphoContextFeature clustering. The size of the dots shows how much of a cluster expresses a gene; the colour shows how much of the expression of a gene is confined to a cluster (see Materials and methods). (D) Some of the genes shown to be differentially expressed in the ganglia defined by MorphoContextFeature clustering, plotted on the UMAP representation.
Figure 8—figure supplement 1
Ganglia clusters on the MorphoFeatures representation.
Figure 9 with 2 supplements
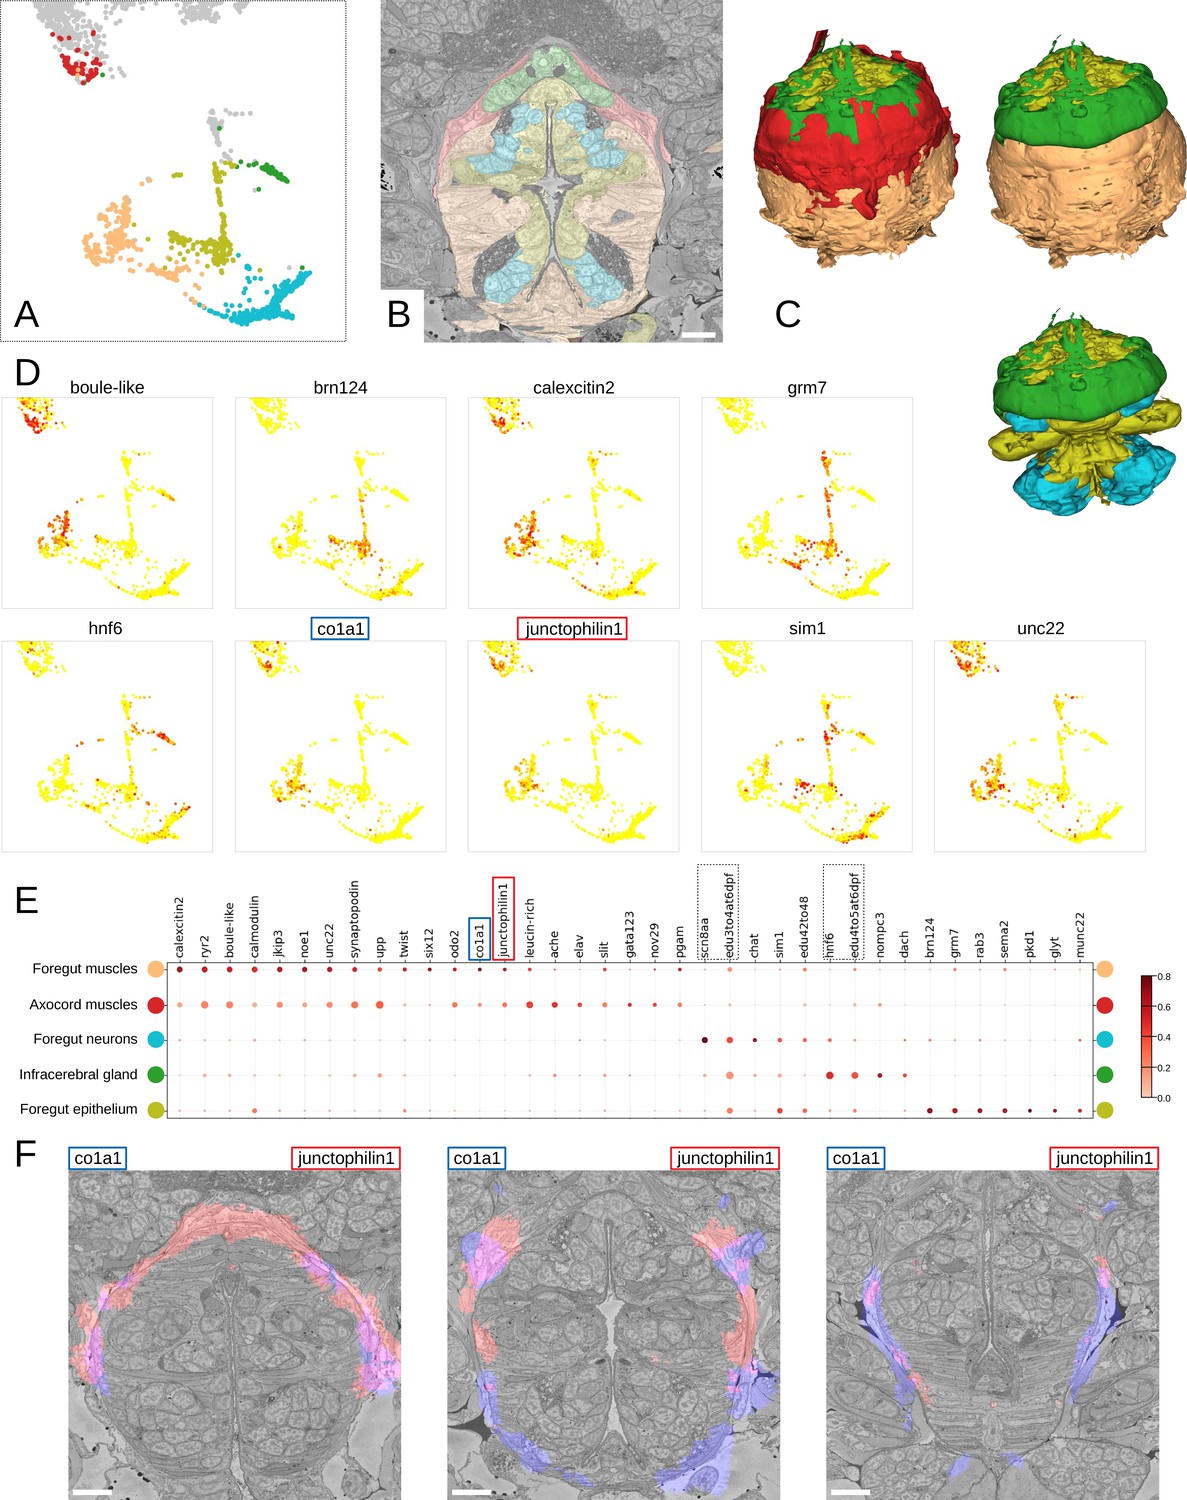
Detailed characterisation of the foregut.
(A) Foregut region clusters plotted on the UMAP representation. (B) The foregut tissues, as defined by the MorphoContextFeatures clustering, shown in the animal volume. Scale bar: 10μm. (C) A 3D visualisation of the foregut tissues, as defined by the MorphoContextFeatures clustering: all tissues (upper left panel), surrounding muscles removed (upper right panel), both muscle groups removed (lower panel). (D) Some of the genes shown to be differentially expressed in the foregut region clusters, plotted on the UMAP representation. (E) Gene expression dot plot of the foregut region clustering. The size of the dots shows how much of a cluster expresses a gene; the colour shows how much of the expression of a gene is confined to a cluster (see Materials and methods). The genes mentioned in the text are enboxed. (F) The genes specific to the axocord muscles, visualised on the animal volume. Scale bars: 10μm.
Figure 9—figure supplement 1
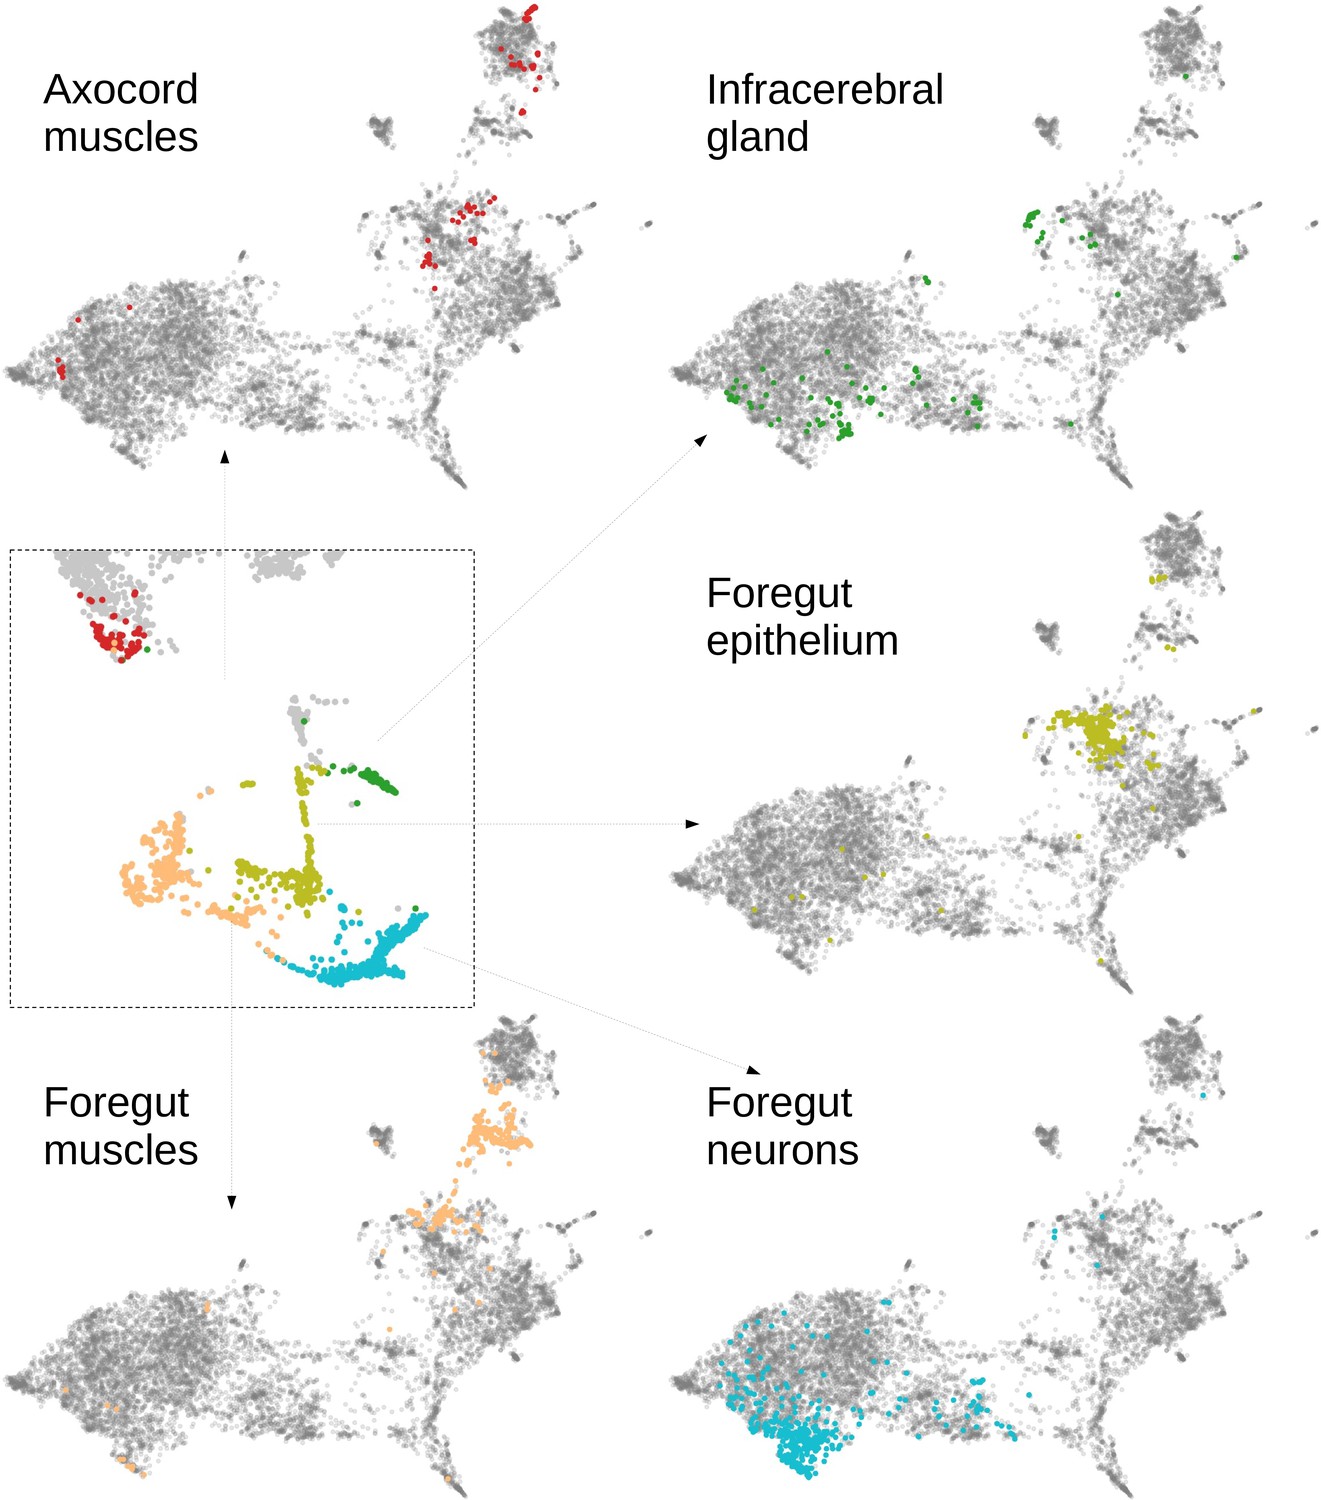
Foregut clusters on the MorphoFeatures representation.
Figure 9—figure supplement 2
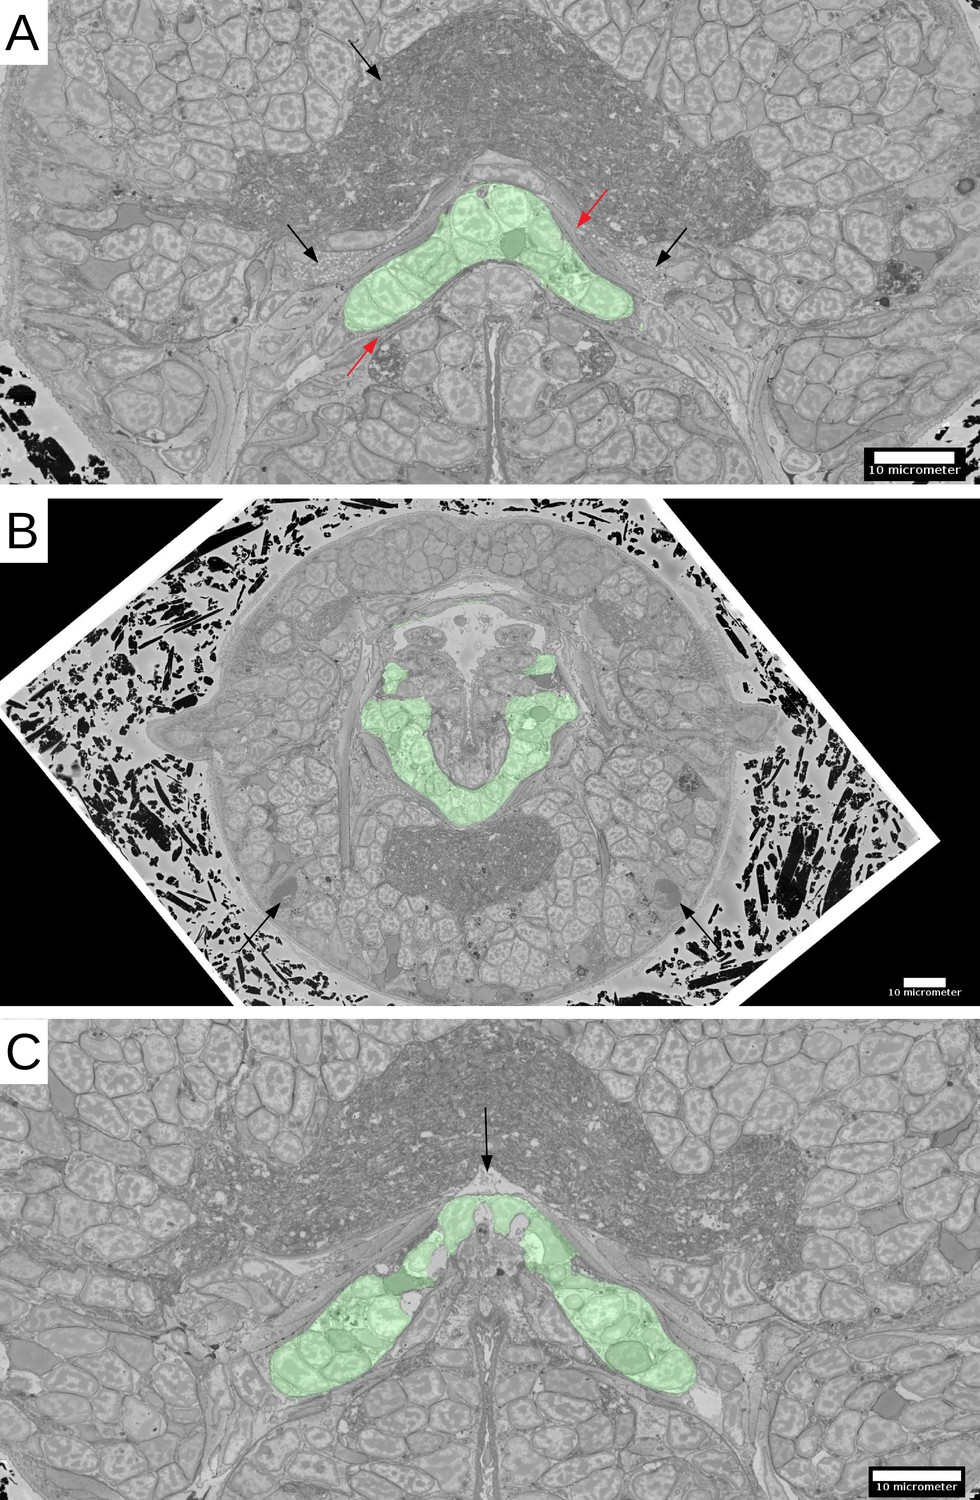
Infracerebral gland.
(A) The location of the gland in the head. The neuropil and the secretory cells are pointed up by black arrows, the surrounding muscle layers - by red arrows. (B) The shape of the gland and its position relative to the posterior pair of adult eyes (black arrows). (C) A cavity likely to be a developing blood vessel (black arrow) on top of the gland.
Additional files
Download links
A two-part list of links to download the article, or parts of the article, in various formats.
Downloads (link to download the article as PDF)
Open citations (links to open the citations from this article in various online reference manager services)
Cite this article (links to download the citations from this article in formats compatible with various reference manager tools)
MorphoFeatures for unsupervised exploration of cell types, tissues, and organs in volume electron microscopy
eLife 12:e80918.
https://doi.org/10.7554/eLife.80918


