Global analysis of cytosine and adenine DNA modifications across the tree of life
- Department of Biochemistry, Charité Universitätsmedizin, Germany
- The Molecular Biology of Metabolism Laboratory, The Francis Crick Institute, United Kingdom
- Department of Biochemistry and Cambridge Systems Biology Center, University of Cambridge, United Kingdom
- Wellcome Trust Sanger Institute, Wellcome Trust Genome Campus, United Kingdom
- Core Facility-High Throughput Mass Spectrometry, Charité Universitätsmedizin, Germany
Figures
Figure 1 with 4 supplements
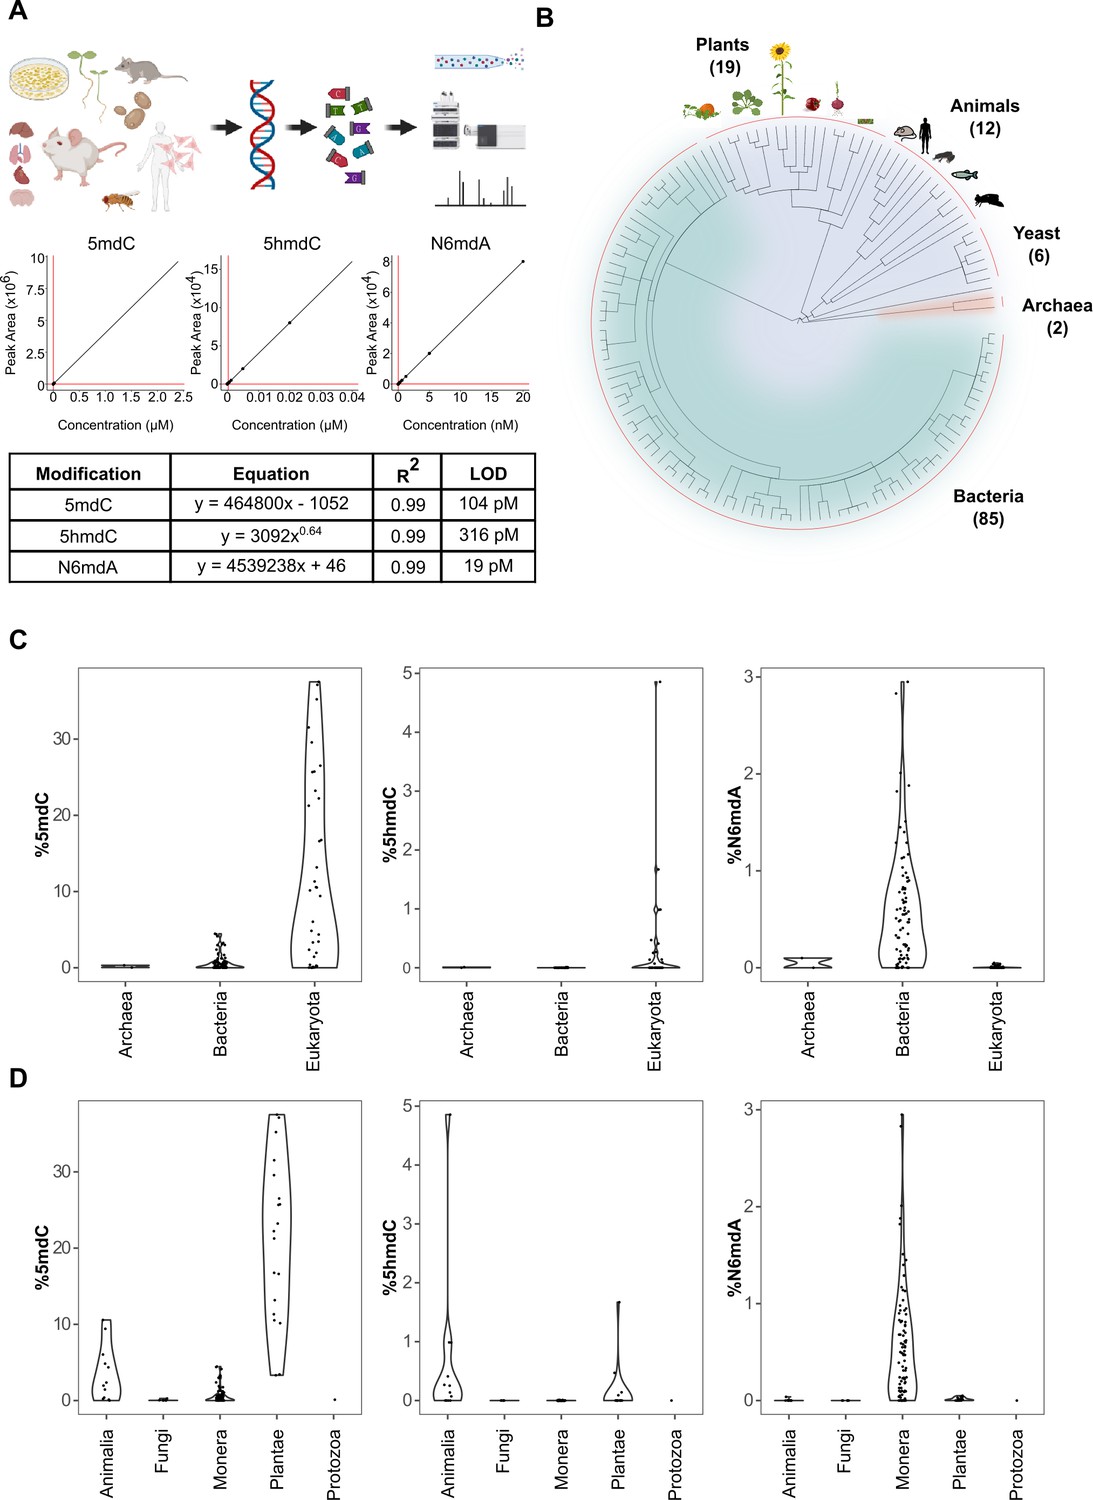
Quantification of DNA modifications across species.
(A) Multiplex analysis of various genomic DNA modifications using liquid chromatography-multiple reaction monitoring following enzymatic digestion of DNA. The regression curves and limit of detection (LOD) for modifications 5mdC, 5hmdC, and N6mdA are represented. Although our method also quantifies cadC and fdC, we did not detect significant concentrations of these in any of the measured samples; these modifications were hence omitted from the graphical illustrations. (B) A total of 286 tissue samples from 124 species were analyzed in the present study: 19 species from plants, 12 from animals, 6 from yeast, 2 from archaea, and 85 from bacteria. (C–D) Distribution of 5mdC, 5hmdC, and N6mdA across (C) archaeal, bacterial, and eukaryotic domains, and (D) animal, fungi, monera, plant, and protozoan kingdoms. The values depict percentage of cytosine residues bearing either methyl (%5mdC) or hydroxymethyl (%5hmdC) modification and percentage of adenine residues bearing methyl modification (N6mdA). Percentage modifications were calculated as ratio of modified cytosine residue and guanosine for 5mdC and 5hmdC; and ratio of modified adenine residue and thymine for N6mdA. The limits of detection for 5mdC, 5hmdC, and N6mdA are 4.6 nM, 320 pM, and 19 pM, respectively.
Figure 1—figure supplement 1
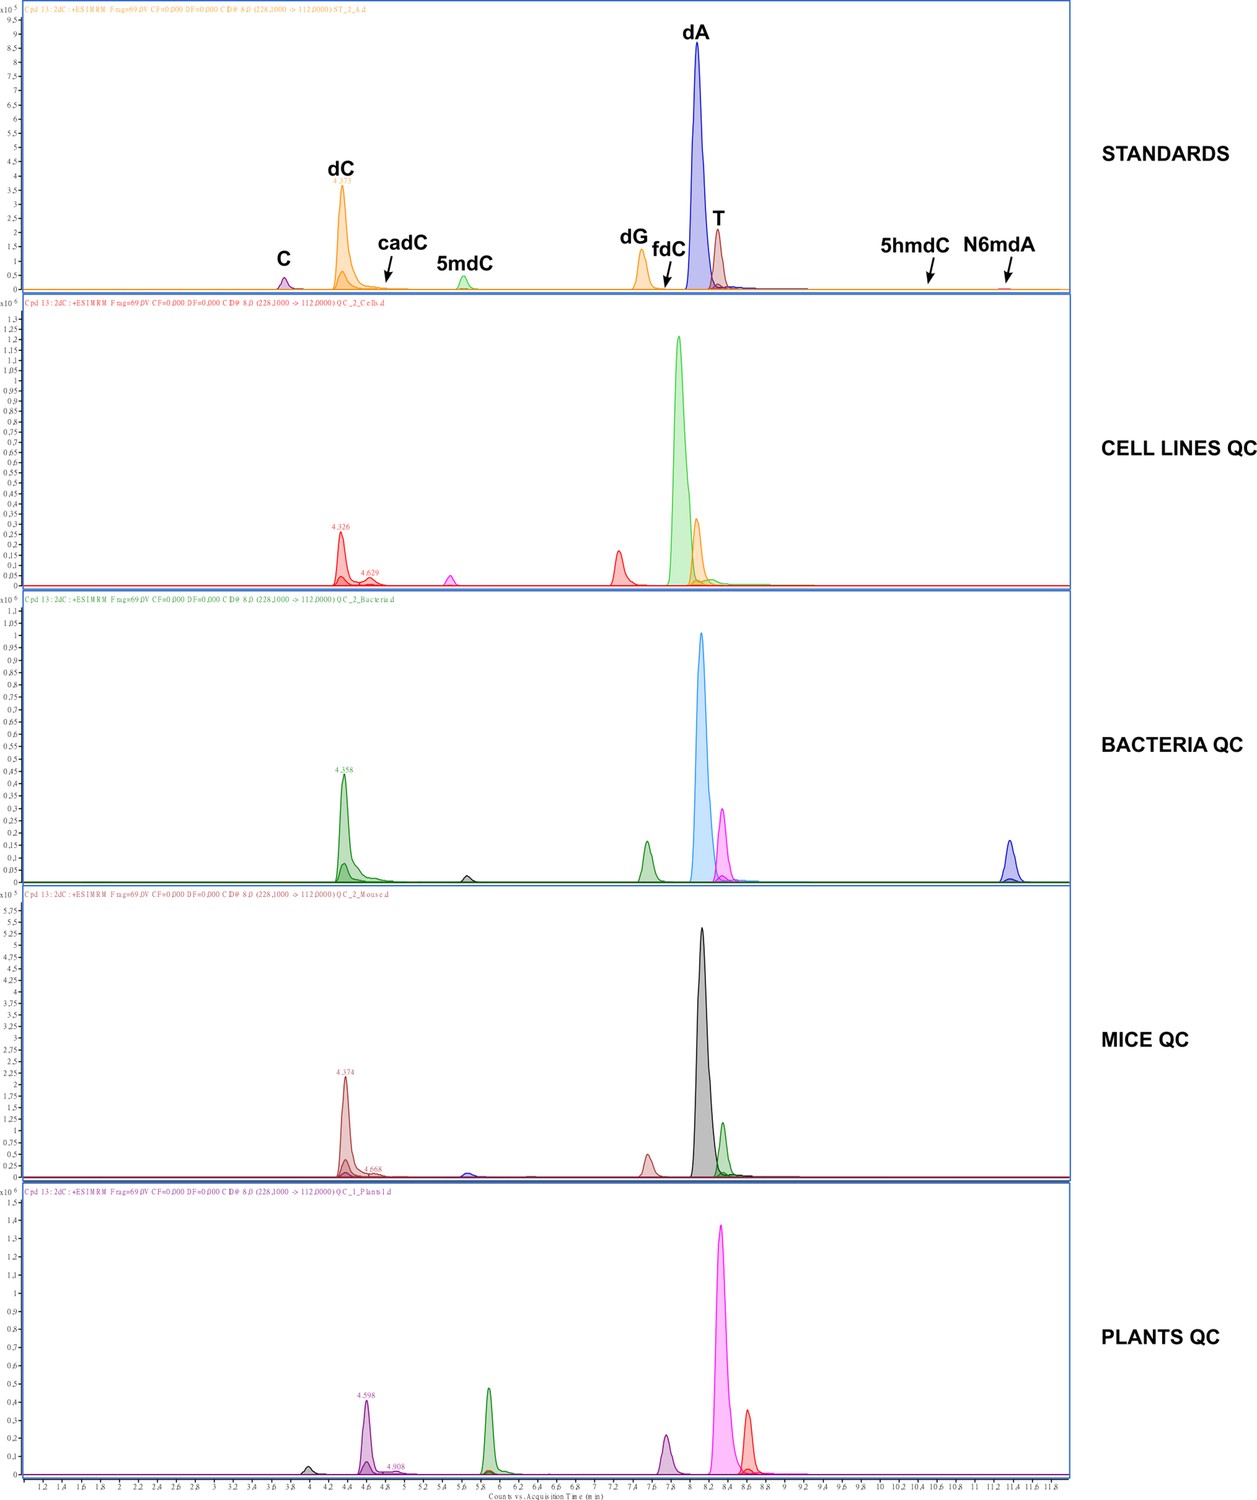
Representative extracted ion chromatograms for the standards and QC samples from different sample types.
Figure 1—figure supplement 2
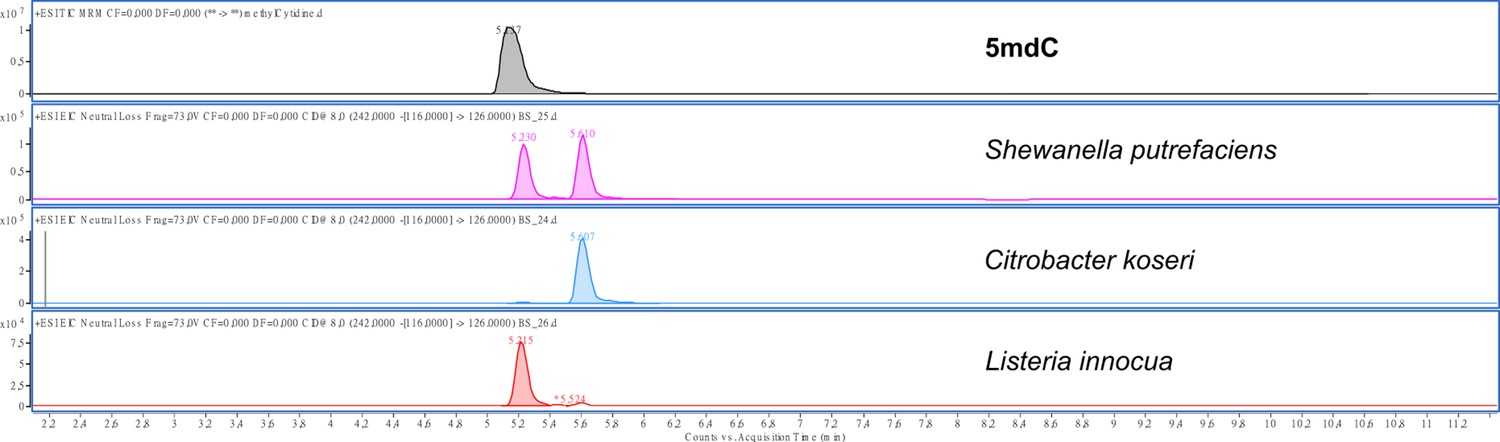
Neutral loss chromatograms corresponding to the transition 242->126 for the loss of ribose sugar moiety (M=116).
TIC (Total Ion Chromatogram) of an authentic sample of 5mdC is shown as a comparison.
Figure 1—figure supplement 3

The variation observed for samples measured in replicates.
The broad range in cytosine hydroxymethylation in case of Garra barreimiae and Monodelphis domestica as well as methylation in Homo sapiens is due to the multiple tissues present. They have been deliberately combined to show the narrow distribution in other modifications. Please refer for tissue specific distribution.
Figure 1—figure supplement 4

The variation of the three modifications 5mdC, 5hmdC, and N6mdA in Drosophila melanogaster.
In (A) bleached (microbiota removed via bleaching) vs. unbleached (intact microbiota) flies and in (B) bleached flies fed with a sterilized vs. non-sterilized diet.
Figure 2 with 1 supplement
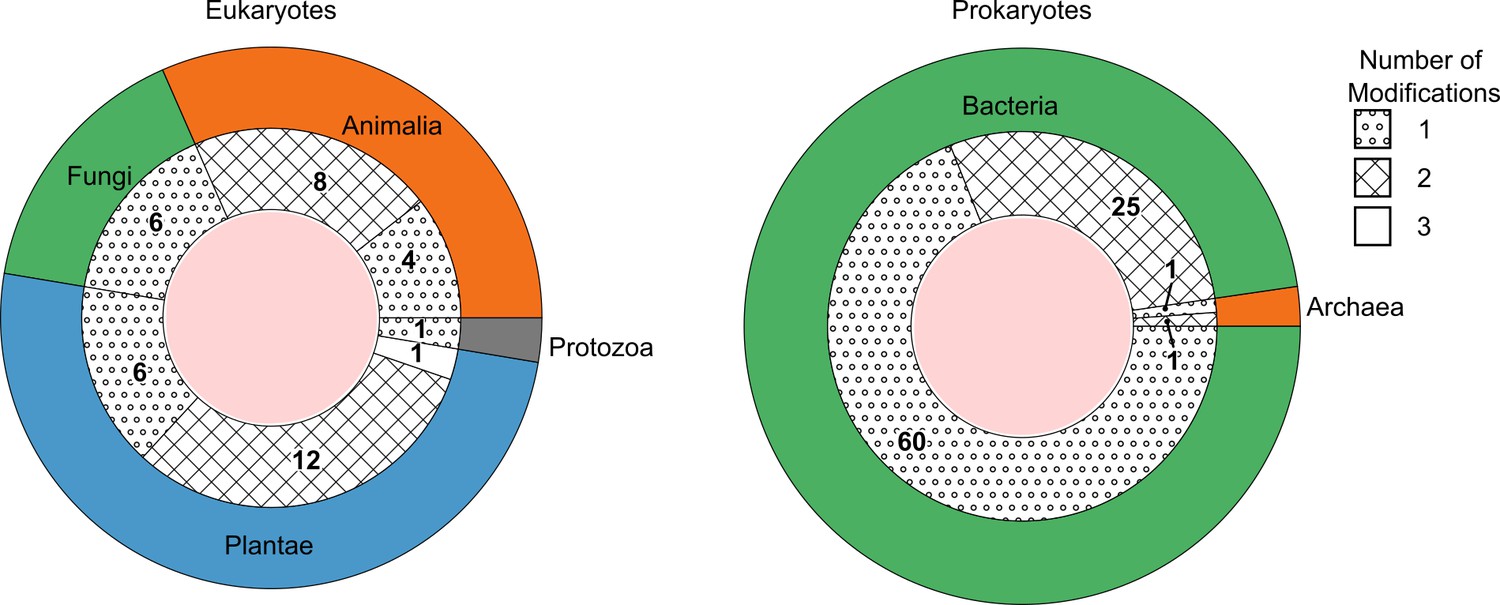
The number of species detected containing one, two, or three DNA modification types above picomolar detection limit, grouped as eukaryotes (left) and prokaryotes (right).
The outer ring represents the kingdoms present within these domains. The groupings per number of modifications are shown as fill patterns on the inner ring, where dots represent species in which only one among 5mdC, 5hmdC, and N6mdA were found; crosses represent species bearing two modifications simultaneously; and no fill represents species carrying all three modifications.
Figure 2—figure supplement 1

Distribution of modifications across species.
Figure 3 with 1 supplement
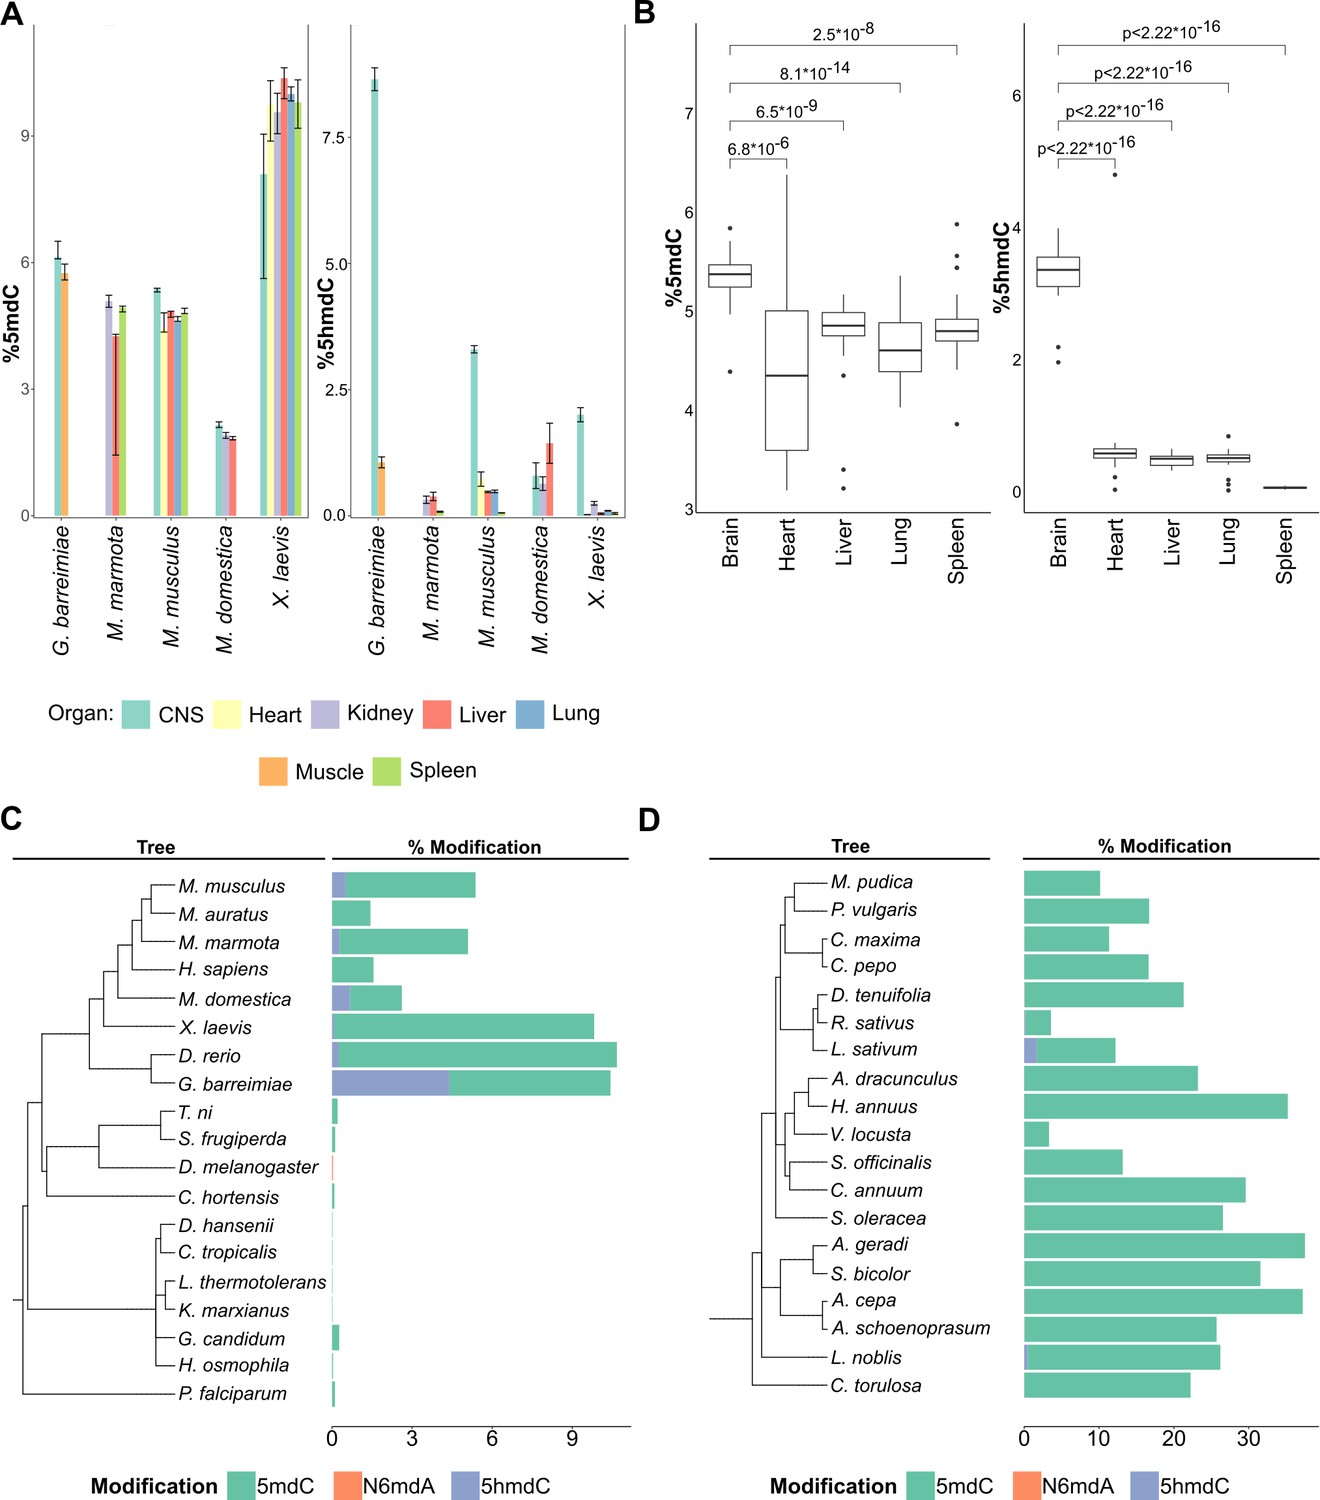
Distribution of DNA modifications in eukaryotes.
(A) The concentration of 5-methyl deoxycytidine (left) and 5-hydroxymethyl deoxycytidine (right) in different vertebrate genomes.n = 4 for G. barreimiae, M. marmota, M. musculus, X. laevis and n=3 for M. domestica.(B) Distribution of 5-methyl deoxycytidine (left) and 5-hydroxymethyl deoxycytidine (right) in different mouse tissues (n=5). Variations in percentage modification across different (C) non-plant eukaryotes including representatives from vertebrates like mammals, amphibians, and fish, invertebrates like insects and mollusks, and unicellular fungi and protozoa (D) plants species comprising both gymnosperms and angiosperms.
Figure 3—figure supplement 1

Variation in % modification (as log10) in HeLa cells cultured under different growth environments: standard media, media with no penicillin/streptomycin, media with 10x penicillin/streptomycin concentration, incubation at 40°C, treatment with 2.5 mM DTT, treatment with 200 µM H2O2, and interferon gamma treatment.
5hmdC was below the detection limit for all samples.
Figure 4 with 2 supplements
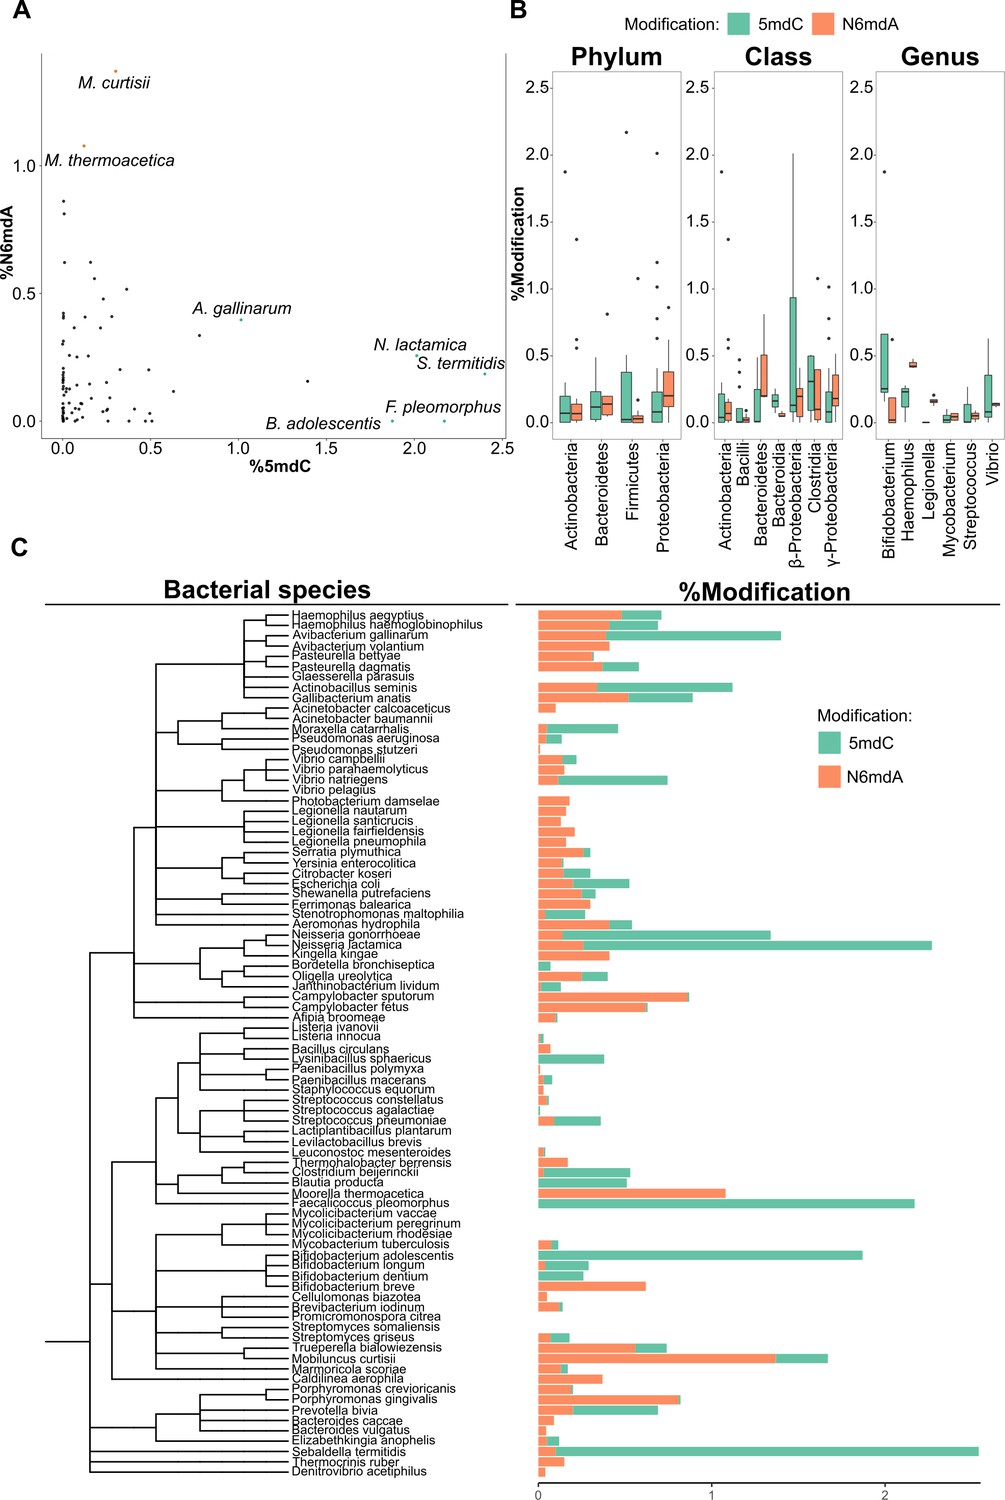
DNA modifications in bacteria.
(A) Percentage of cytidine methylated against the percentage of adenine methylated in bacterial species. (B) Variation of % 5-methyl deoxycytidine and % N6-methyl deoxyadenosine among taxonomic divisions: phylum, class, and genus. One-way ANOVA, p-values for phylum, class, and genus are 0.017, 7×10⁻⁴, and 0.16, respectively. (C) Distribution of 5mdC and N6mdA among 85 bacterial species depicted together with their phylogenetic relationships. Percentage modifications are calculated as ratio of modified cytosine residue and guanosine for 5mdC and 5hmdC; and ratio of modified adenine residue and thymine for N6mdA.
Figure 4—figure supplement 1
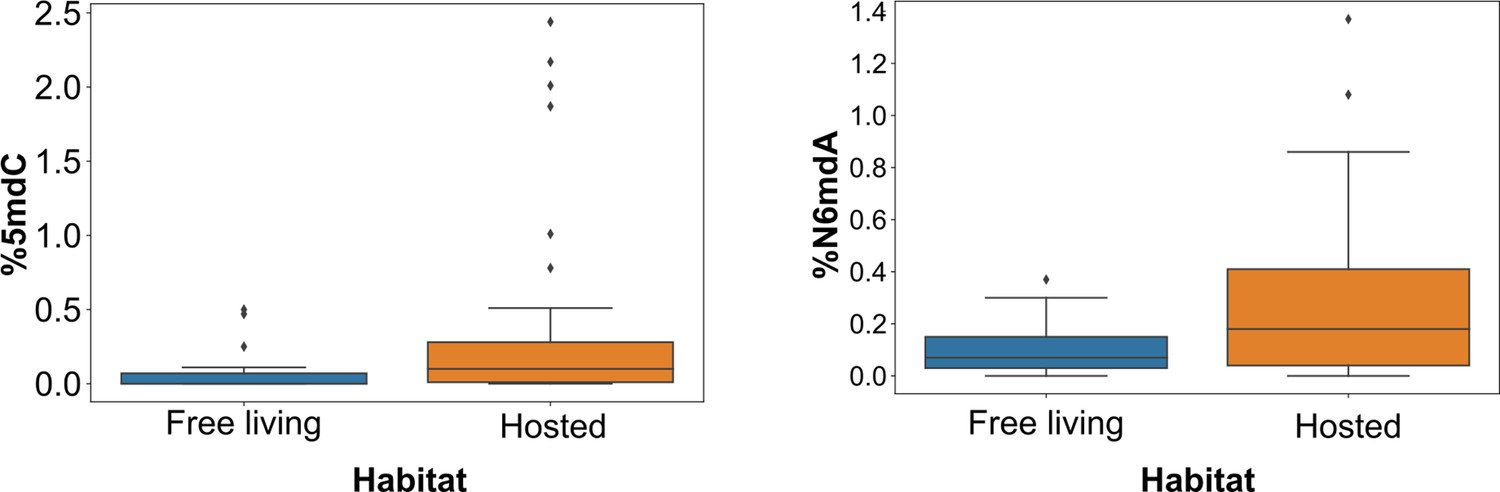
Variation of 5mdC and N6mdA among hosted and free-living bacteria.
Figure 4—figure supplement 2
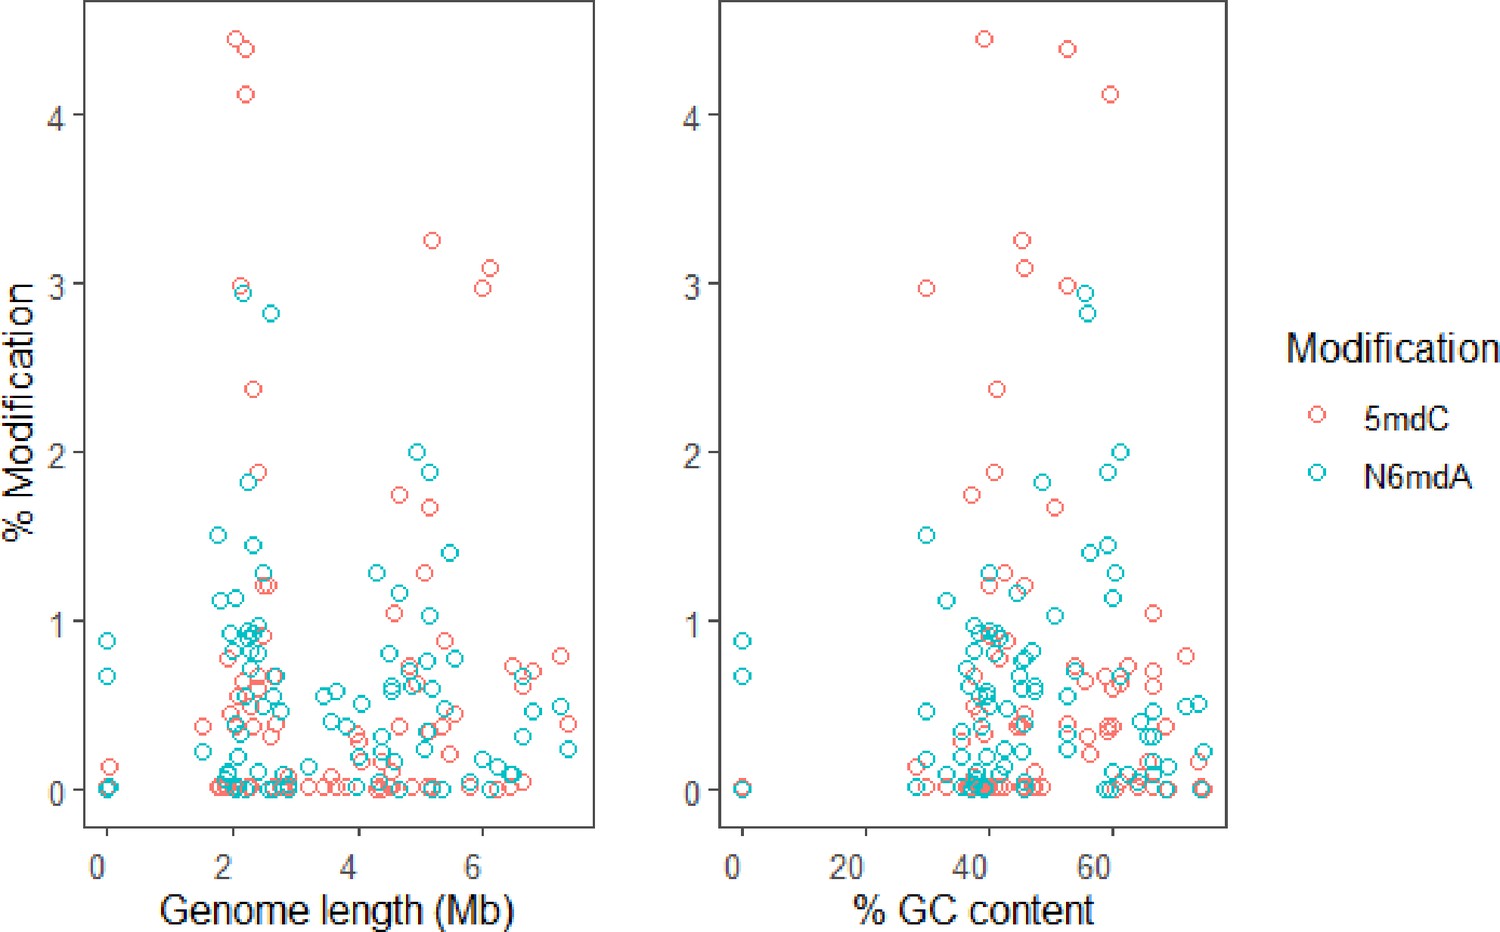
Variation of 5mdC and N6mdA according to genome length and % GC content.
Tables
Table 1
Concentrations of pure nucleoside standards and their sources.
| Molecule: vendor/code | Pure stock concentration(µM) | Pool concentration(µM) |
|---|---|---|
| 2dC: Sigma/D3897-100MG | 5,000 | 100 |
| 5hmdC: Berry and Associates/PY7588 | 0.5 | 0.04 |
| 5mdC: Santa Cruz/ sc-278256 | 100 | 0.02 |
| cadC: Berry and Associates/PY7593 | 0.5 | 0.02 |
| dA: Sigma/D7400-250MG | 5,000 | 100 |
| dG: Sigma/854999 | 5,000 | 100 |
| fdC: Berry and Associates/PY 7589 | 0.5 | 0.02 |
| N6mdA: Alfa Aesar/ J64961 | 0.5 | 0.02 |
| T: Sigma/89270–1G | 5,000 | 100 |
Table 2
Retention times and transitions for nucleosides analyzed.
| Molecule | Precursor ion | Qualifier Product ion | Quantifier Product ion | Retention time (min) |
|---|---|---|---|---|
| 2dC | 228.1 | 95 | 112.0 | 4.362 |
| cadC | 272.0 | 137.9 | 155.9 | 5.193 |
| 5mdC | 242.0 | 108.6 | 126.0 | 5.130 |
| dG | 268.1 | – | 151.9 | 7.546 |
| fdC | 256.0 | 97 | 139.9 | 7.868 |
| dA | 252.1 | – | 136.0 | 8.128 |
| T | 243.1 | 54.1 | 126.9 | 8.349 |
| 5hmdC | 258.0 | 141.9 | 81.1 | 10.585 |
| N6mdA | 266.3 | 117 | 150.0 | 11.391 |
Additional files
-
MDAR checklist
- https://cdn.elifesciences.org/articles/81002/elife-81002-mdarchecklist1-v1.docx
-
Supplementary file 1
Percentages of 5mdC (wrt dG), 5hmdC (wrt dG), and N6mdA (wrt T) of different samples measured*.
The values are presented as % modification: %5mdC as (5mdC/dG)*100, %5hmdC as (5hmdC/dG)*100 and %N6mdA as (N6mdA/T)*100.* Percentages are NOT normalized to genome size.
- https://cdn.elifesciences.org/articles/81002/elife-81002-supp1-v1.xlsx
-
Supplementary file 2
Percentages of 5mdC (wrt dG), 5hmdC (wrt dG), and N6mdA (wrt T) of different bacterial samples measured and their habitats*.
Information regarding bacterial habitats was retrieved from the bacterial metadatabase BacDive (http://bacdive.dsmz.de, Accessed 14 April, 2020) (Reimer et al., 2019).*Percentages are normalized to genome size.
- https://cdn.elifesciences.org/articles/81002/elife-81002-supp2-v1.xlsx
Download links
A two-part list of links to download the article, or parts of the article, in various formats.
Downloads (link to download the article as PDF)
Open citations (links to open the citations from this article in various online reference manager services)
Cite this article (links to download the citations from this article in formats compatible with various reference manager tools)
Global analysis of cytosine and adenine DNA modifications across the tree of life
eLife 11:e81002.
https://doi.org/10.7554/eLife.81002


