The regional distribution of resident immune cells shapes distinct immunological environments along the murine epididymis
- Institute of Anatomy and Cell Biology, Unit of Reproductive Biology, Justus-Liebig-University Giessen, Germany
- Hessian Center of Reproductive Medicine, Justus-Liebig-University of Giessen, Germany
- ECCPS Bioinformatics and Deep Sequencing Platform, Max Planck Institute for Heart and Lung Research, Germany
- Ted Rogers Center of Heart Research, Peter Munk Cardiac Centre, Toronto General Hospital Research Institute, University Health Network, Canada
- Institute of Immunology, Hannover Medical School, Germany
- Institute of Anatomy and Cell Biology, Unit of Signal Transduction, Justus-Liebig-University of Giessen, Germany
- Department of Dermatology and Allergology, Philipps-University of Marburg, Germany
- Centre of Reproductive Health, Hudson Institute of Medical Research, Australia
- Department of Molecular and Translational Sciences, School of Clinical Sciences, Monash Medical Centre, Monash University, Australia
Figures
Figure 1 with 3 supplements
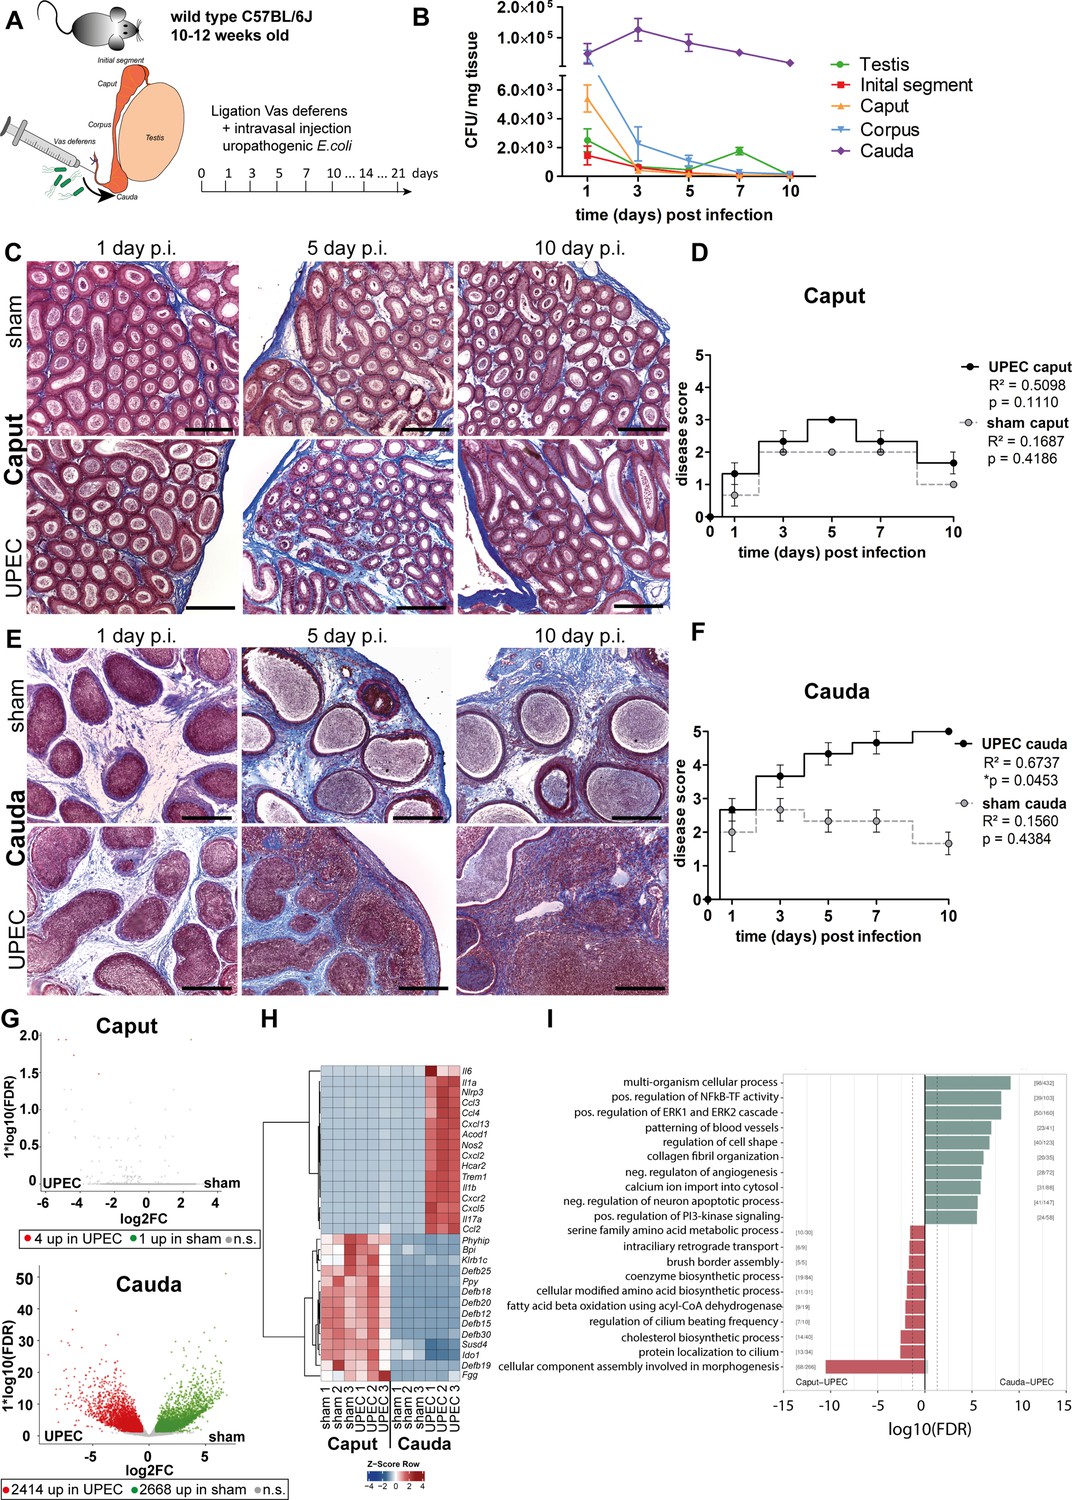
Analysis of differential immune responses of caput and cauda epididymides following uropathogenic Escherichia coli (UPEC) infection in C57BL/6J wild type mice.
(A) Male C57BL/6J mice (10–12 weeks of age) were intravasally injected with UPEC or saline vehicle alone (sham) after ligation of the vas deferens. For the study organs were harvested and analyzed at the indicated time points. (B) Bacterial loads were assessed by determining colony forming units per mg tissue at the indicated time points within testis and the four main epididymal regions (initial segment [IS], caput, corpus, cauda; n=4 per time point, mean ± SD). (C and D) Modified Masson-Goldner trichrome staining of caput (C) and cauda (D) epididymides showing histological differences between sham- and UPEC-infected mice at day 1, day 5, and day 10 post infection. Scale bar 50 µm. (E and F) Pearson’s correlation plot of infection time point (days post infection) and disease score of caput (E) and cauda (F). The average ± SEM disease score per time point (n=4 per time point) for sham- and UPEC-infected mice is shown. Pearson’s correlation was considered to be statistically significant at p<0.05. (G) Volcano plot of differentially expressed genes (DEG) identified between sham- and UPEC-infected mice within caput and cauda epididymides by RNASeq analysis. Numbers of DEG are indicated below the respective plot. Cut-off criteria: FDR ≤0.05, –1 < logFC > 1. (H) Top 30 DEG by comparing caput and cauda epididymides of sham- and UPEC-infected mice. Cut-off criteria: FDR ≤0.05, –1 < logFC > 1. (I) Gene set enrichment analysis using DEG between caput and cauda epididymides of UPEC-infected mice. Cut-off criteria: FDR < 0.2, Top up/downregulated gene sets based on gene ontology.
Figure 1—figure supplement 1
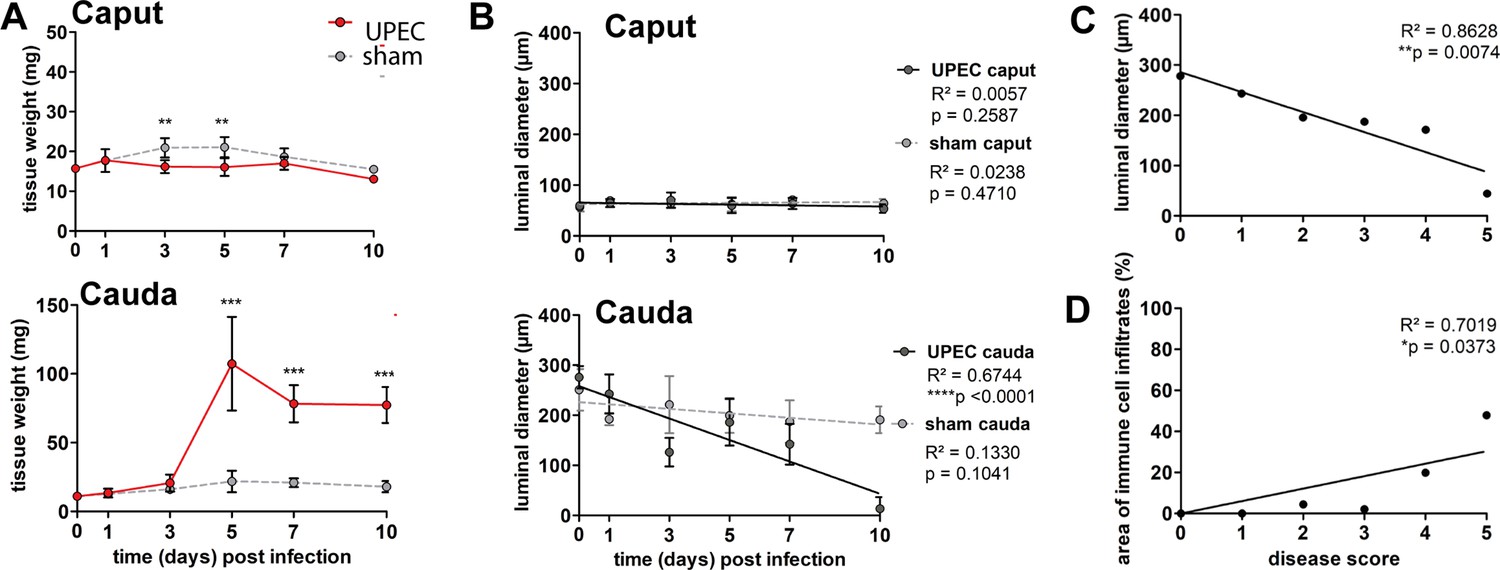
Morphometric assessment of the differential immune responses within caput and cauda epididymides in C57BL/6J mice.
(A) Changes in weight (in mg) of caput and cauda epididymides throughout different infection time points post infection (mean ± SD, n=4–5, two-way ANOVA with Bonferroni post hoc test, *p<0.05, **p<0.005, ***p<0.001). (B) Luminal diameter of the epididymal duct (in µm) within caput and cauda epididymides; 30–50 duct cross sections were measured per region of the biological replicate and averaged (mean ± SD, n=4–5, two-way ANOVA with Bonferroni post hoc test, *p<0.05, **p<0.005, ***p<0.001). (C) Pearson’s correlation plot of disease score and luminal diameter. The average luminal diameter per disease score is shown. A Pearson’s correlation was considered to be statistically significant at p<0.05. (D) Pearson’s correlation plot of disease score and area of immune cell infiltrates assessed by histological measurement. The average area of immune cell infiltrates per disease score is shown. A Pearson’s correlation was considered to be statistically significant at p<0.05.
Figure 1—figure supplement 2
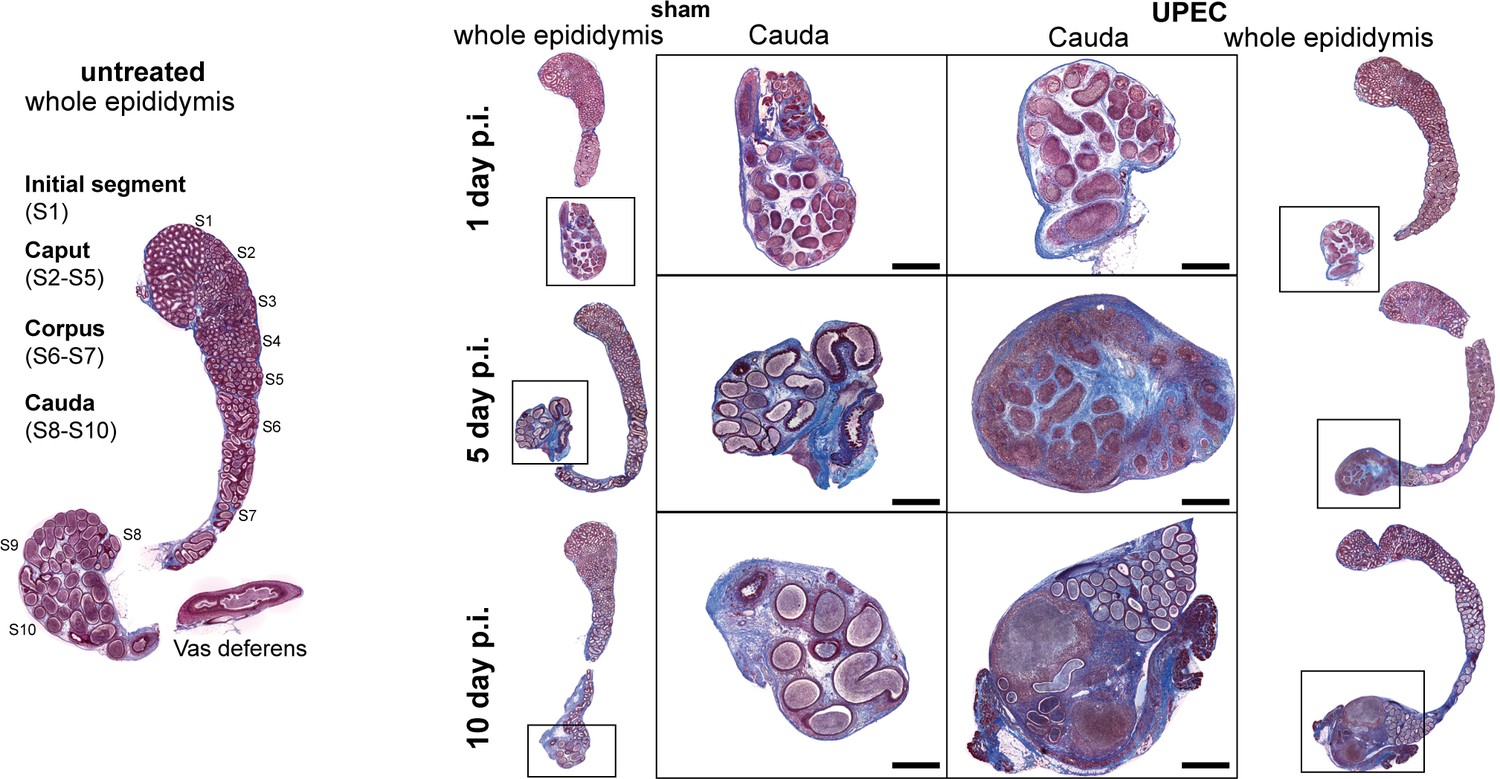
Histological images (modified Masson-Goldner trichrome staining) of the epididymis of naïve, sham- and uropathogenic Escherichia coli (UPEC)-infected C57BL/6J mice at different time points (day 1, 5, 10 post infection).
Scale bar = 100 µm.
Figure 1—figure supplement 3
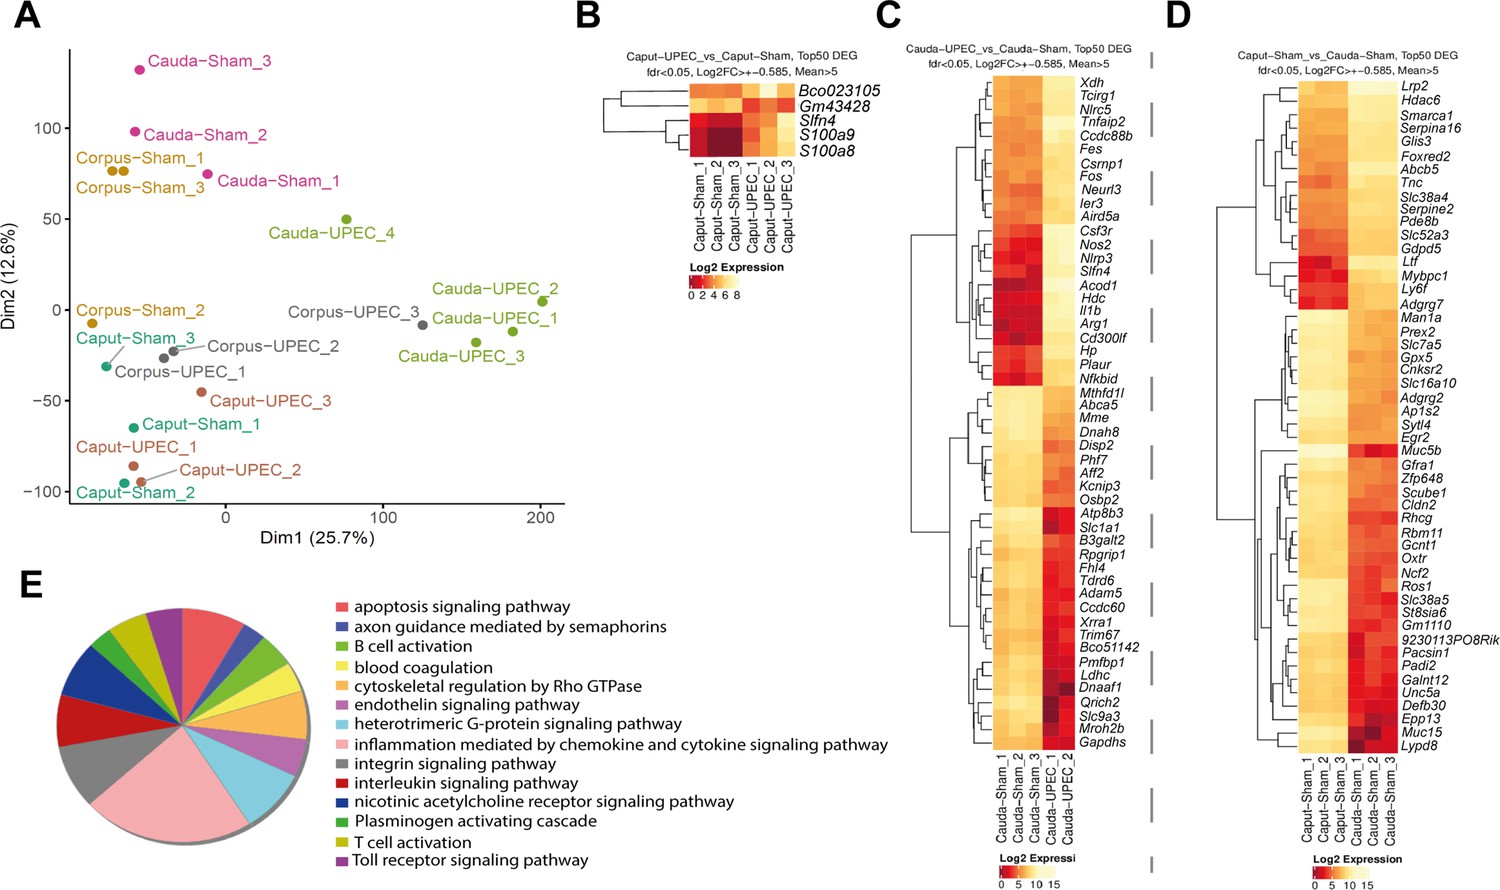
RNASeq analyses of sham- and uropathogenic Escherichia coli (UPEC)-infected C57BL/6J wild type mice.
(A) Principal component analysis of all investigated in vivo epididymitis samples in RNASeq analysis (n=3–4 per group). (B) Heatmap showing differentially expressed genes (DEG) between the caput of sham- and UPEC-infected mice in vivo – related to the volcano plot shown in Figure 1G, cut-off criteria are indicated above the heatmap. (C) Heatmap showing DEG between the cauda of sham- and UPEC-infected mice in vivo – related to the volcano plot shown in Figure 1G, cut-off criteria are indicated above the heatmap. (D) Heatmap showing DEG between the caput sham and cauda of sham mice in vivo – related to the volcano. Cut-off criteria are indicated above the heatmap. (E) Pie chart showing upregulated gene sets and pathway enrichment within cauda epididymidis of UPEC-infected mice 10 days post infection (p.i.) (compared to sham control mice, based on Panther database analysis).
Figure 2 with 3 supplements

Analysis of changes in immune cell populations following infection with uropathogenic Escherichia coli (UPEC) in C57BL/6J wild type mice.
(A) Pearson’s correlation plot of infection time points (days post infection) and the area of immune cell infiltration within the total cauda area (%) determined by histological evaluation. Mean ± SD of at least two independent experiments with each n=4 are plotted per time point for sham- and UPEC-infected mice. Pearson’s correlation was considered to be statistically significant at p<0.05 (*p<0.05, **p<0.005, ***p<0.001). (B) Percentage of CD45+ cells in single live cells within caput and cauda assessed by flow cytometry at different time points (days) post infection (mean ± SD, n=4, two-way ANOVA with Bonferroni post hoc test, *p<0.05, **p<0.005, ***p<0.001). (C) Pearson’s correlation plot showing disease score and percentage of CD45+ cells in single live cells. Pearson’s correlation was considered to be statistically significant at p<0.05. (D) FltSNE plots of CD45+ populations in naïve, sham- and UPEC-infected mice 10 days after infection. Cells were gated as described in Figure 2—figure supplement 1 and downsampled to equal cell numbers for each segment. Samples from all biological groups (three biological replicates, respectively) were concatenated, FltSNE plots (perplexity: 20, max. iterations 1000, exaggeration factor: 12) were generated and individually gated cell populations were overlaid using FlowJo software and colored according to the legend on the right. (E) Bar diagram showing the ratio of neutrophils (GR-1+SSChi cells) within single live cells in initial segment (IS), caput, corpus, cauda of naïve, sham- and UPEC-infected mice 10 days after infection, 4–6 biological replicates from two independent experiments were grouped, mean ± SD, two-way ANOVA with Bonferroni post hoc test, *p<0.05, **p<0.005, ***p>0.001. (F) Bar diagram showing the ratio of monocytes (GR-1+SSClo cells) within single live cells in IS, caput, corpus, cauda of naïve, sham- and UPEC-infected mice 10 days after infection (4–6 biological replicates from two independent experiments were grouped, mean ± SD, two-way ANOVA with Bonferroni post hoc test, *p<0.05, **p<0.005, ***p>0.001). (G) Stacked bar diagrams showing the ratio of analyzed GR-1- immune cells within single live cells in IS, caput, corpus, cauda of naïve, sham- and UPEC-infected mice 10 days after infection (4–6 biological replicates from two independent experiments were grouped, mean ± SD, two-way ANOVA with Bonferroni post hoc test, *p<0.05, **p<0.005, ***p>0.001). Identified immune cells are colored equally to the FltSNE plots shown in (D). In both panels indicated immune cells were identified according to the gating strategy displayed in Figure 2—figure supplement 1. (H) Bar diagram showing the ratio of CCR2+ cells in the total macrophage population (F4/80+CX3CR1+/-), 4–6 biological replicates from two independent experiments were grouped, mean ± SD, two-way ANOVA with Bonferroni post hoc test, *p<0.05, **p<0.005, ***p>0.001. (I) Confocal microscopy images showing the location of Ly6G+Ly6C+ cells (GR-1+, red) within caput and cauda of UPEC-infected mice 5, 10, and 14 days post infection (nuclei in gray) including bar diagrams showing the semi-quantified summary of all immunostained tissues (by counting Ly6G+Ly6C+ cells within caput and cauda of sham- and UPEC-infected mice, n=4, for each biological replicate three representative areas were counted, mean ± SD). Scale bar 50 µm.
Figure 2—figure supplement 1
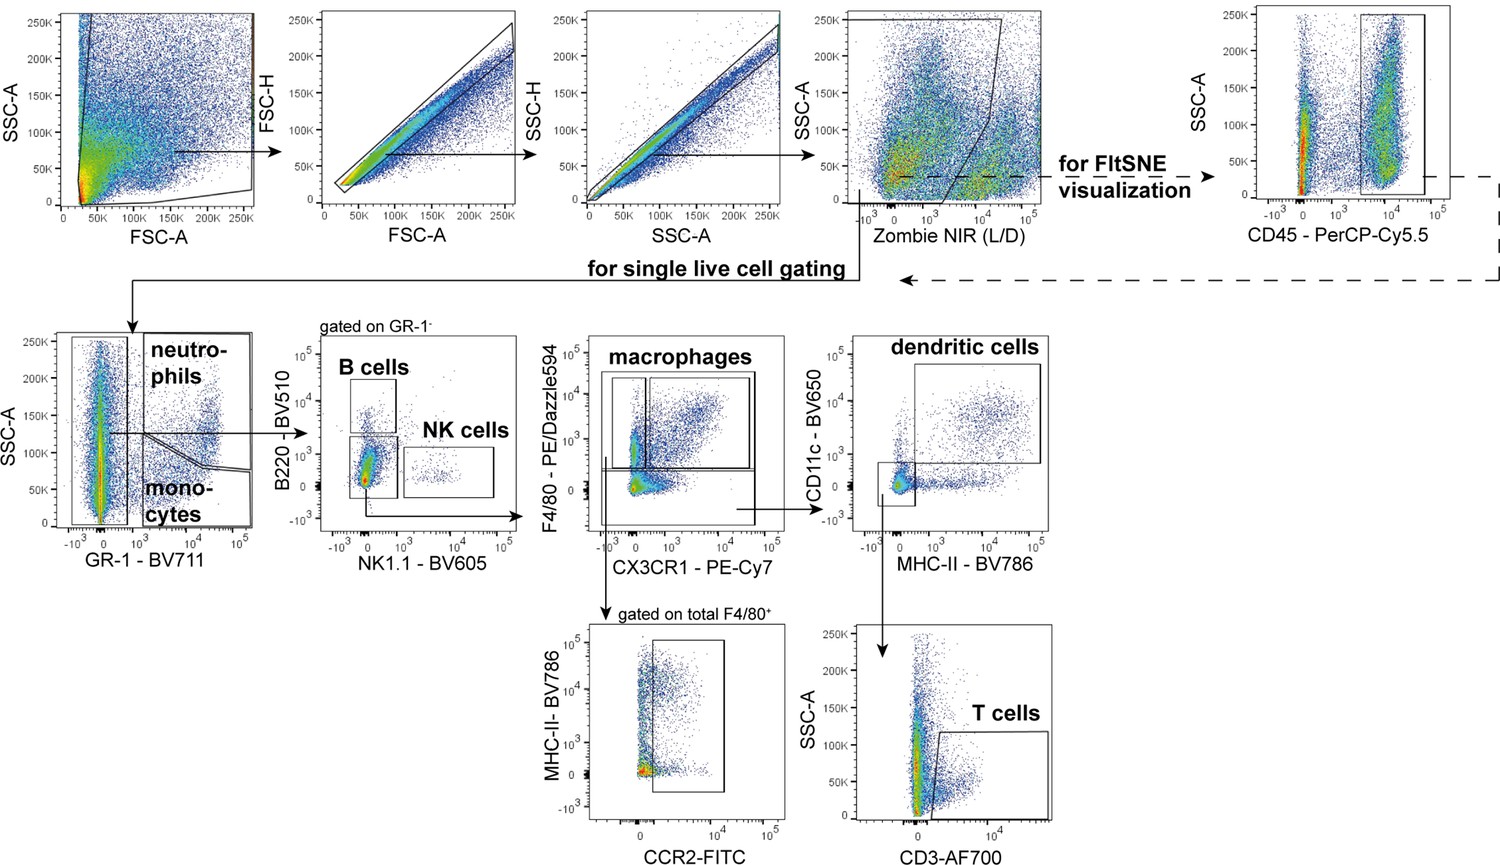
Gating strategy behind flow cytometry analyses of all immune cell populations under pathological conditions (displayed Figure 2).
Representative plots from a sham-infected corpus epididymis.
Figure 2—figure supplement 2
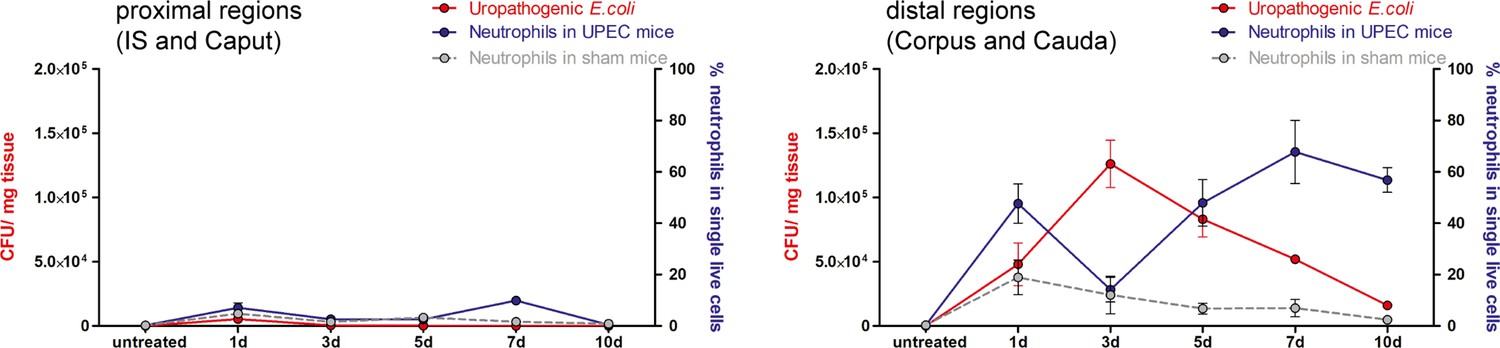
Infiltration of neutrophils in relation the bacterial appearance.
Percentage of infiltrating neutrophil granulocytes (blue) in relation to colony forming units (CFU)/mg tissue in proximal (IS/caput) and distal epididymis (corpus/cauda) of sham- and uropathogenic Escherichia coli (UPEC)-infected mice at indicated time points.
Figure 2—figure supplement 3
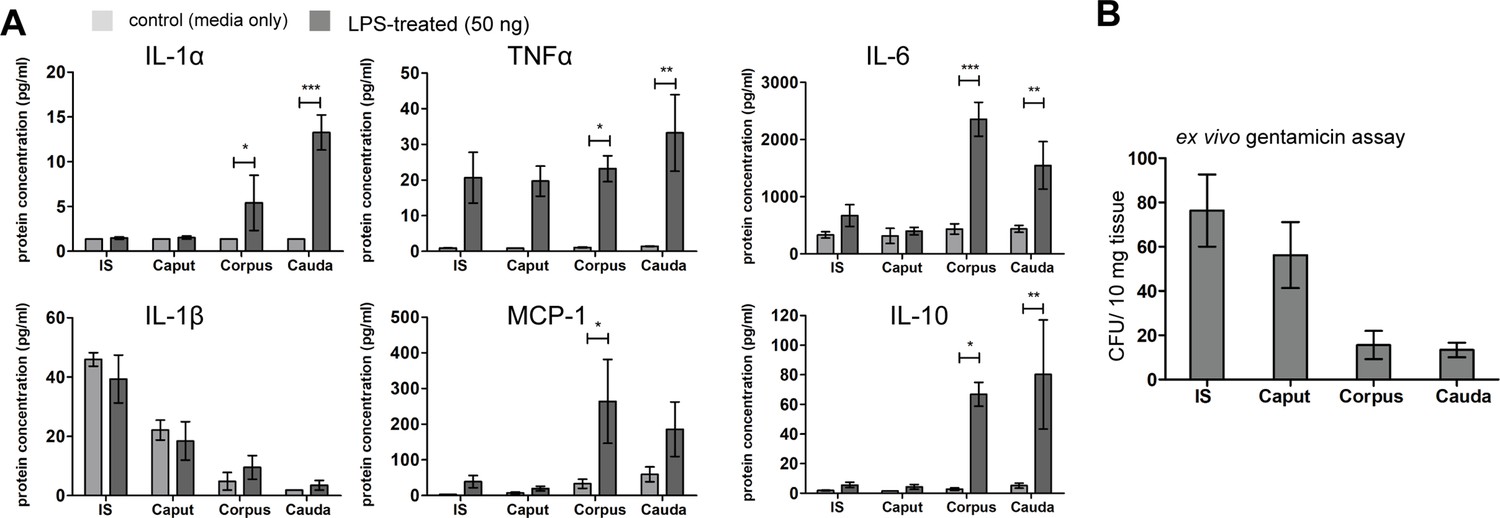
Multiplex assay-based determination of cytokine levels from ex vivo organ culture.
Related to Figure 2. (A) Indicated cytokines (IL-1α, IL-1β, TNFα, MCP-1, IL-6, IL-10) were measured within the culture media after ex vivo stimulation of the indicated epididymal regions with lipopolysaccharide (LPS) (50 ng) for 6 hr, (n = 4 biological replicates, mean ± SD, Student´s t-test pairwise comparison for each region control vs. LPS-treated, *p<0.05, **p<0.005, ***p>0.001). (B) Bacterial uptake potential of the different epididymal regions (initial segment [IS], caput, corpus, cauda) was determined by assessing the intracellular bacterial load after 4 hr ex vivo organ culture with 1×10⁶ uropathogenic Escherichia coli (UPEC) and subsequent treatment with gentamicin to eliminate extracellular bacteria (n=4, mean ± SD).
Figure 3 with 3 supplements
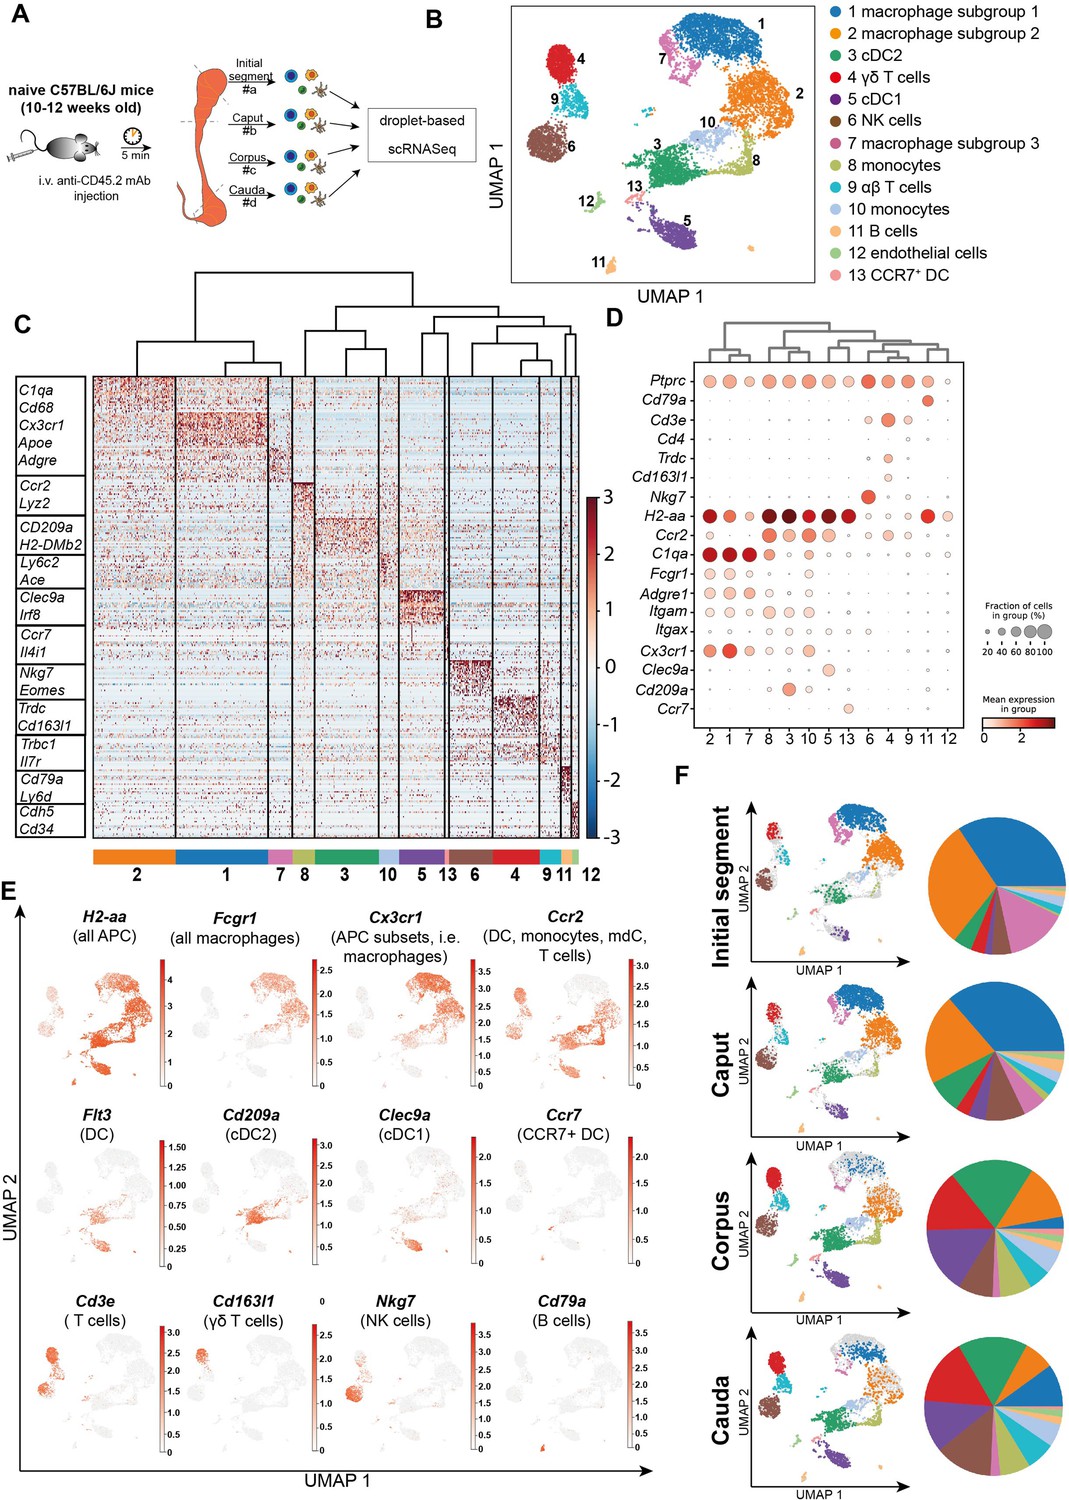
Single-cell RNA sequencing (scRNASeq) of different epididymal regions reveals immune cell heterogeneity within the murine epididymis under physiological conditions.
(A) Schematic overview of the experimental procedure for isolating extravascular CD45+ cells from different epididymal regions. (B) Uniform manifold approximation and projection (UMAP) plot of 12,966 FACS-sorted CD45+ cells isolated from the four epididymal regions, showing immune cell populations identified by unsupervised clustering. (C) Heatmap of the Top45 marker by stringent selection of markers (only present in one cluster, 585 in total) showing expression differences among clusters. (D) Dot plot corresponding to the UMAP plot showing the expression of selected subset-specific genes – dot size resembles the percentage of cells within the cluster expressing the respective gene and dot color reflects the average expression within the cluster. (E) UMAP plots showing the expression of selected key markers for the indicated immune cell population (APC – antigen-presenting cells, mdC – monocyte-derived cells, DC – dendritic cells). (F) UMAP plots and pie charts showing regional distribution of identified clusters.
Figure 3—figure supplement 1
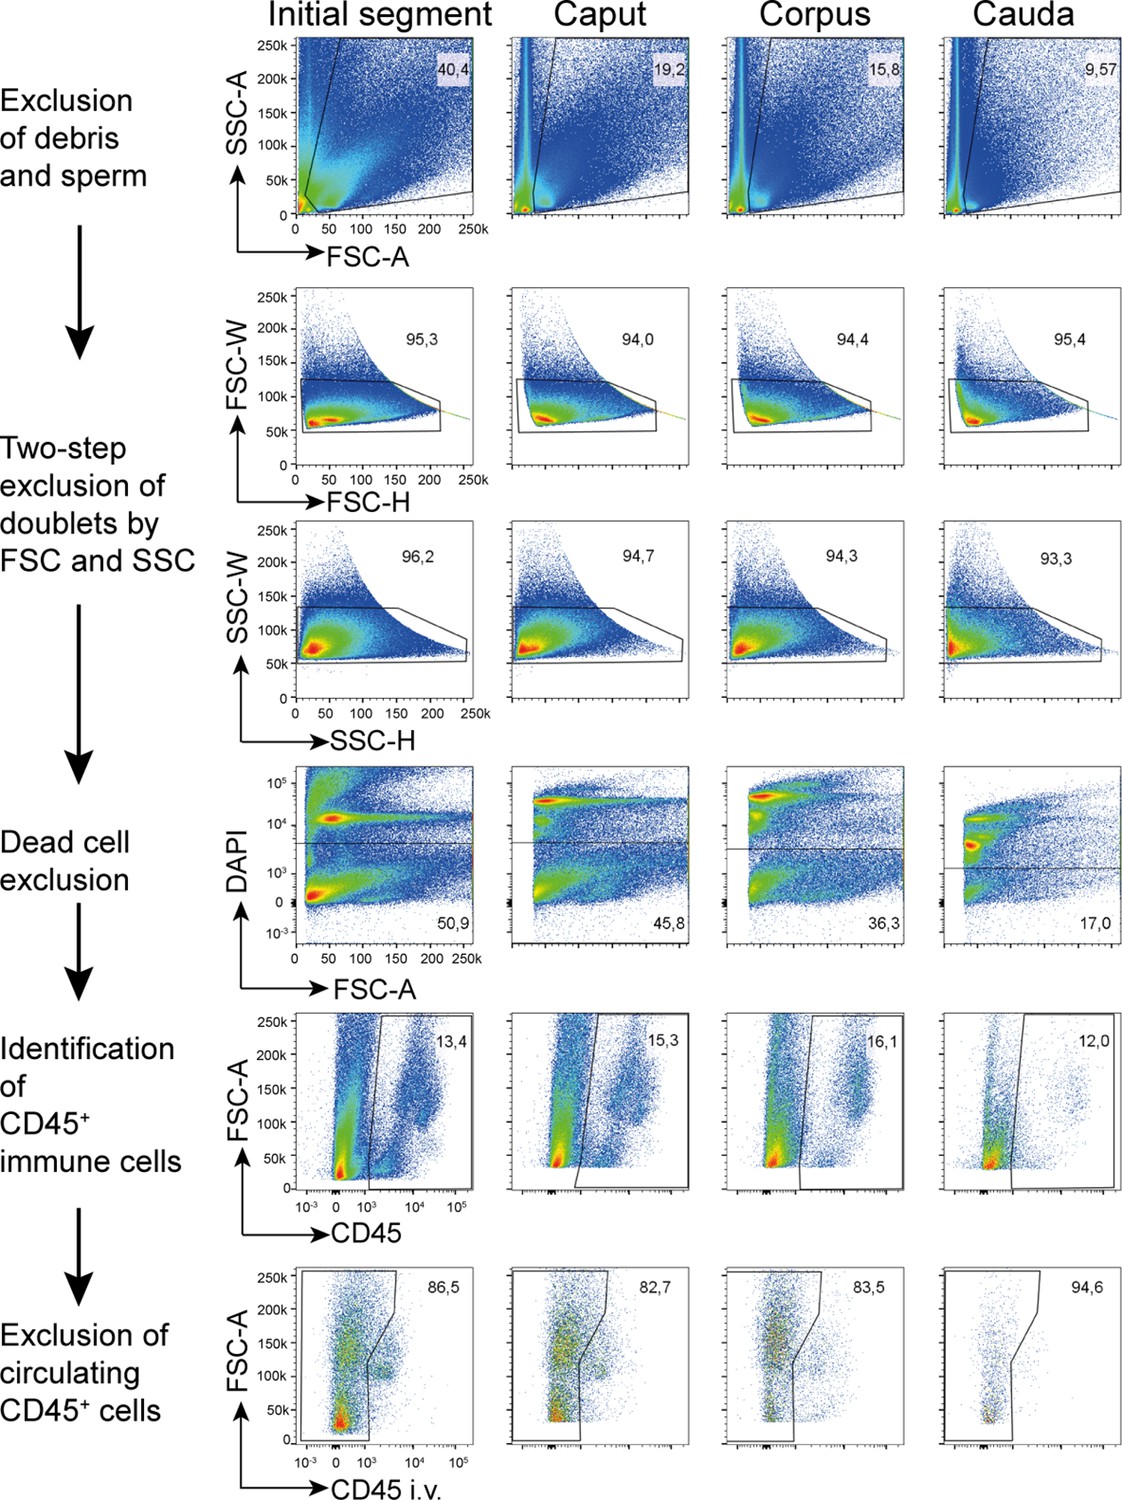
Extravascular CD45+ cells of different epididymal regions were sorted following the indicated gating strategy prior to single-cell RNASeq.
Figure 3—figure supplement 2
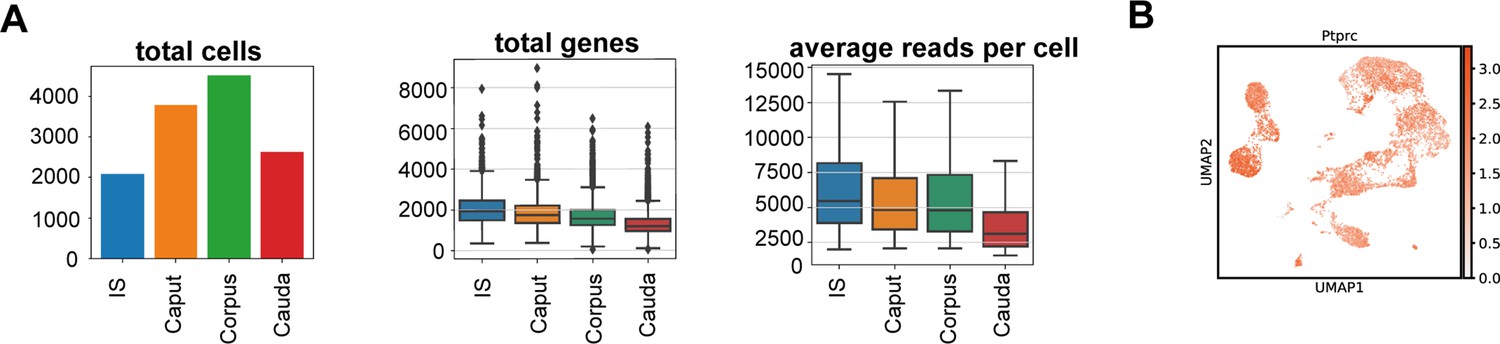
Quality controls for single-cell reads and re-confirmation of identified CD45+.
(A) Number of total cells, total genes and average reads per cells are indicated for different epididymal regions that were separately isolated. (B) Uniform manifold approximation and projection (UMAP) plot showing the expression of Ptprc (encoding CD45) in the identified cluster.
Figure 3—figure supplement 3
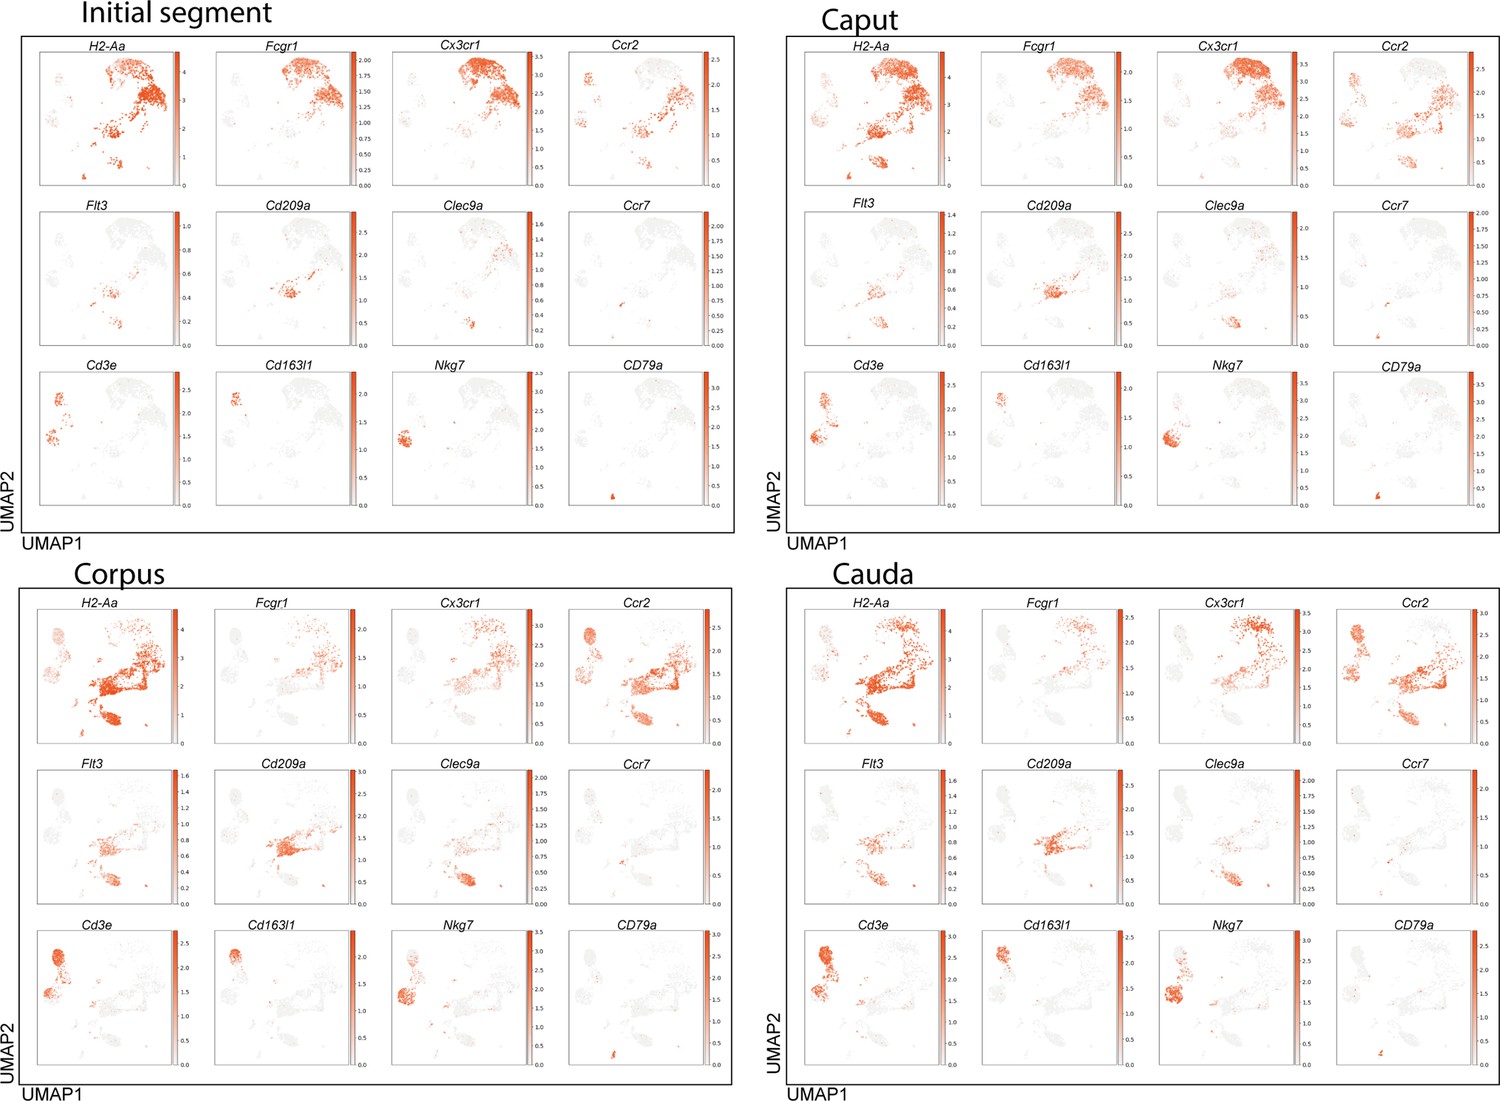
Expression of key marker genes for the identified immune cell populations within epididymal regions.
Uniform manifold approximation and projection (UMAP) plots showing the expression of selected key marker for the indicated immune cell population within the epididymal regions: initial segment, caput, corpus, cauda.
Figure 4 with 1 supplement
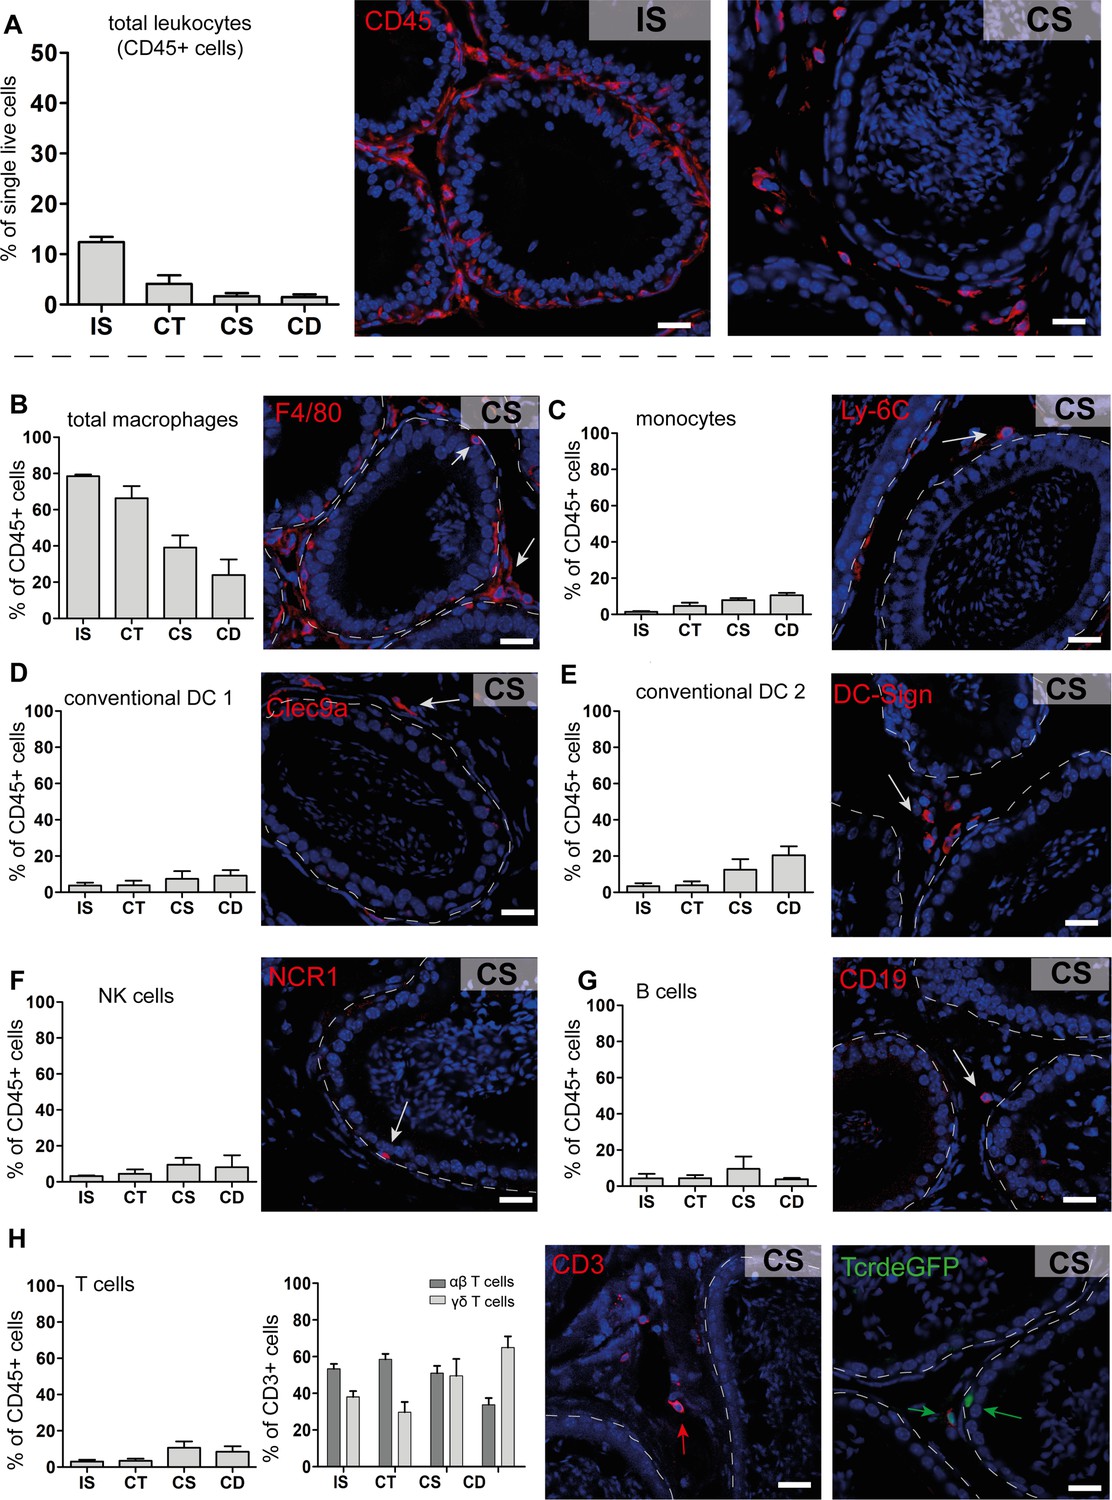
Quantification and localization of identified immune cell populations among epididymal regions (scale bar 20 µm).
(A) Distribution (assessed by flow cytometry n=4-8, bar diagram showing mean ± SD) of total leukocytes (CD45+ cells) and localization within the initial segment and corpus, as shown by immunostaining of CD45. (B–H) Quantification and localization of the following immune cell populations were assessed by flow cytometry and immunostaining using selected markers (n=4–8, mean ± SD). The following markers were used: CD45, F4/80, CD11B, Ly6C, MHC-II, CLEC9A, CD209A, CD163, CCR2, CX3CR1 for identifying myeloid cell populations, and CD45, B220/CD45R, CD3, TCRβ, TCRγδ, NK1.1 for lymphoid cell populations (further panel information and gating strategies are displayed in the Methods section and supplemental material, respectively). Representative immunofluorescence images are displayed from the corpus (CS) regions: (B) total macrophages (F4/80+, red), located in the interstitial, intraepithelial, and peritubular compartments, (C) monocytes (Ly-6C+), located in the peritubular compartment, (D and E) conventional dendritic cells cDC 1 (Clec9a+) and 2 (DC-Sign/CD209a+), (F) NK cells (NK1.1+ for flow cytometry and NCR1 for immunostaining), located in the intraepithelial compartment, (G) B cells (B220/CD45R+ for flow cytometry and CD19+ for immunostaining), (H) T cells that were further segregated into αβ T cells (TCRβ+, red) and γδ T cells (TCRγδ+, green), scale bar 20 µm.
Figure 4—figure supplement 1
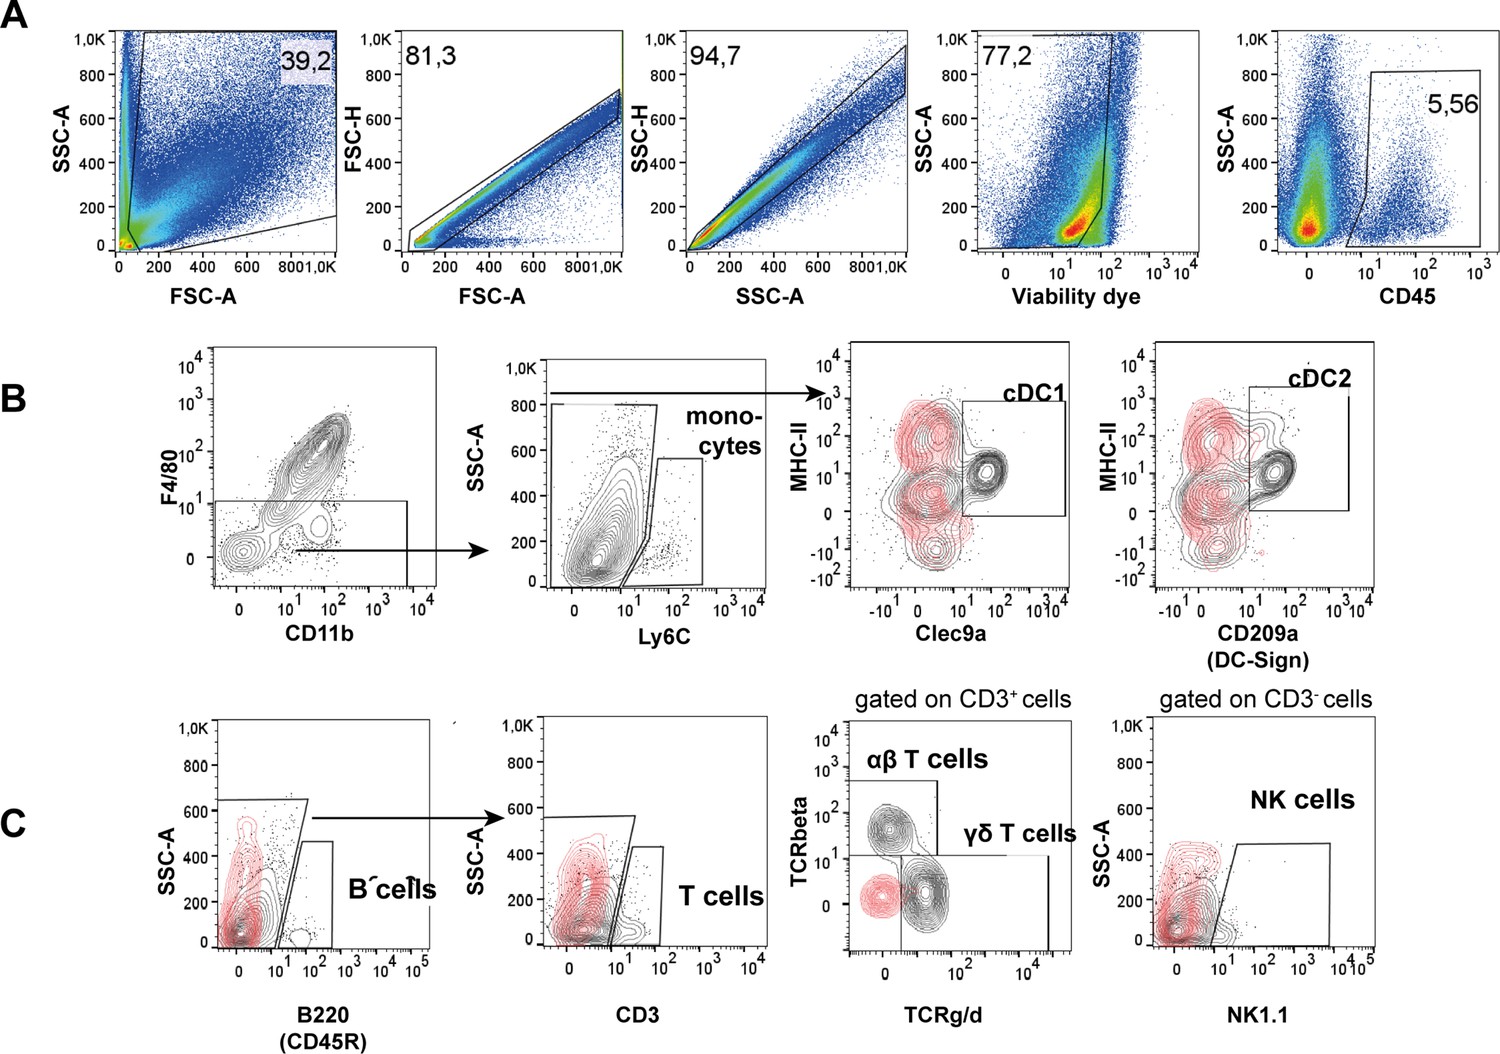
Gating strategy behind flow cytometry analyses of all immune cell populations under physiological conditions.
(A) General gating that has been applied to each sample included exclusion of debris und sperm based on SSC-A vs. FSC-A, followed by a two-step single-cell gating (based on FSC and SSC), live cells were discriminated using a viability dye (see Appendix 1-key resources table), according to the respective panel all leukocytes were identified by CD45 staining. (B) F4/80-CD11blo-hi cells were further distinguished by Ly6C to identify monocytes (Ly6C+), and Ly6C- cells were segregated using MHC-II in combination with Clec9a and CD209a to differentiate cDC1 (MHC-IIhiClec9a+) and cDC2 (MHC-IIhiCD209a+), respectively. (C) Lymphocytes were segregated into B cells (B220+) and T cells (CD3+) that were further differentiated into αβ and γδT cells, as well as NK cells (NK1.1+ cells). Representative plots are from the cauda due to the most diverse immune cell distribution in this region. Red overlays represent the respective isotype controls.
Figure 5 with 2 supplements
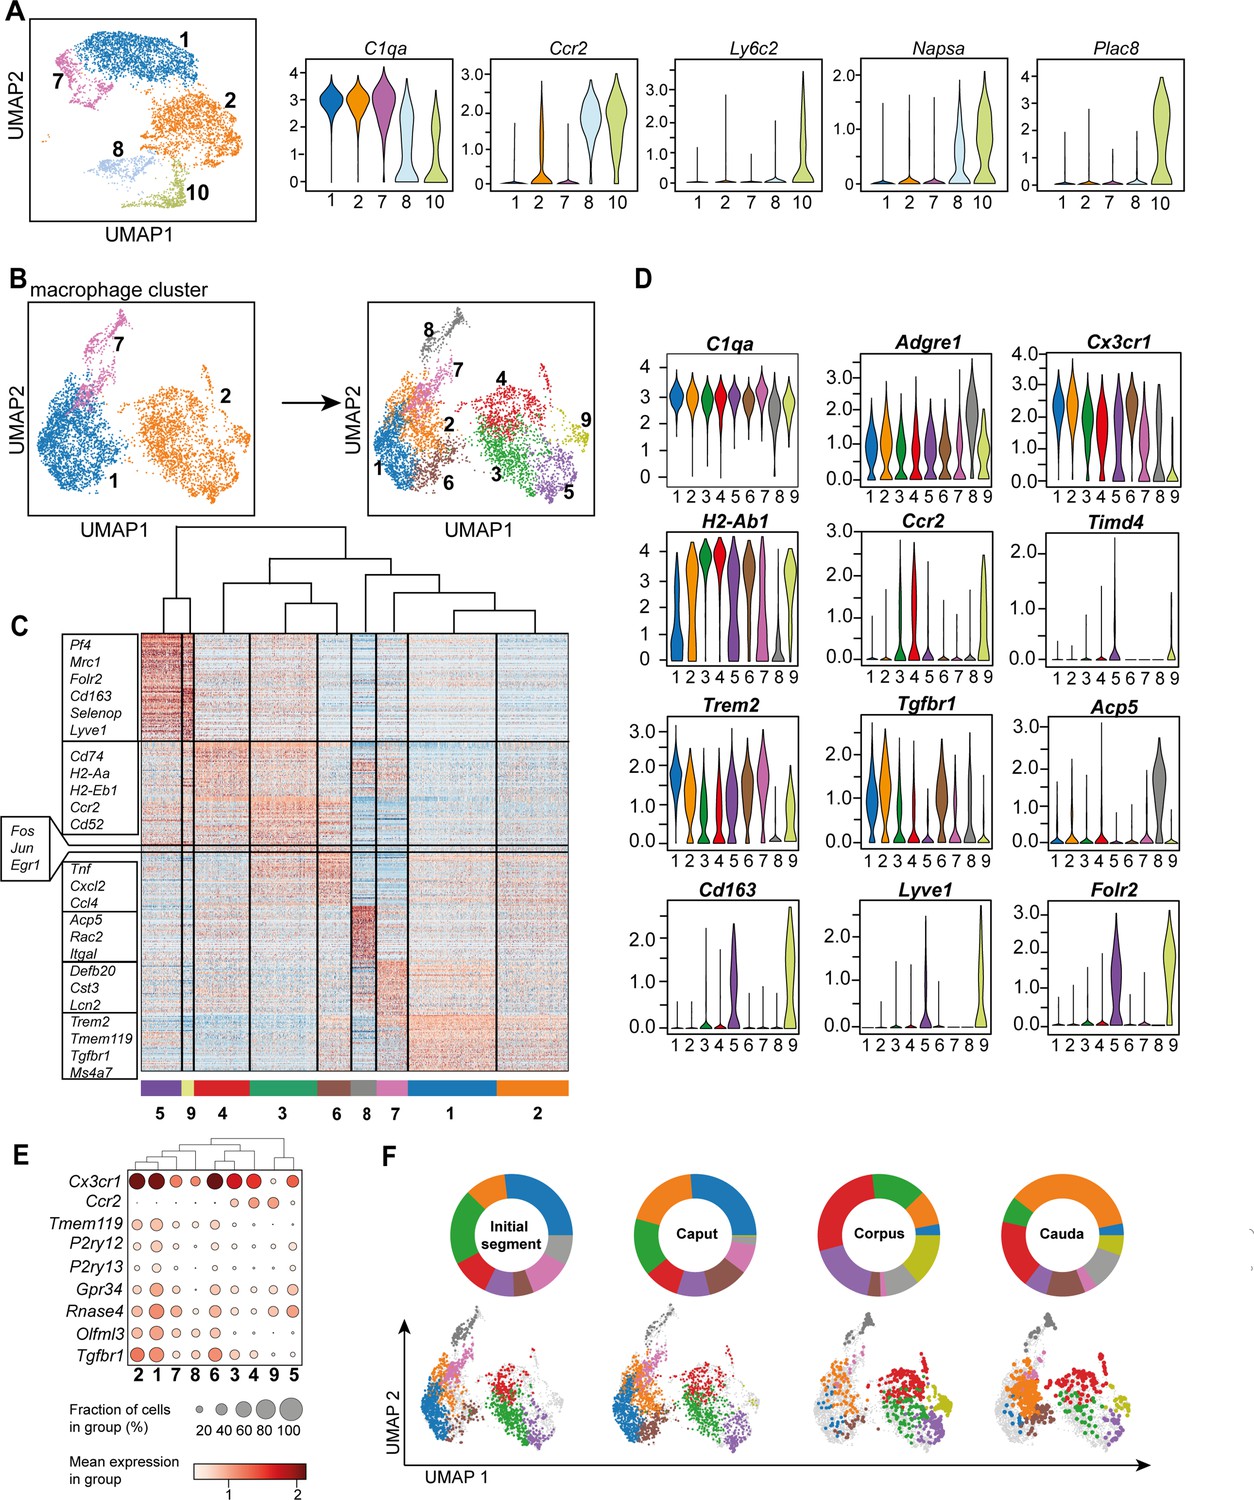
Distinct macrophage subgroups exist within the murine epididymis.
(A) Uniform manifold approximation and projection (UMAP) plot and violin plots showing segregation of macrophages (clusters 1, 2, 7) and monocytes (clusters 8, 10) based on clustering and expression of the selected key genes C1qa, Ccr2, Ly6c2, Napsa, Plac8. (B) UMAP plot showing re-clustering of macrophage population (clusters 1, 2, 7) under exclusion of all other previously identified CD45+ cluster resulting in the formation of nine Adgre1+ subclusters. (C) Heatmap of the 50 most differentially expressed marker genes in each cluster from Figure 4B. (D) Violin plots showing the expression level of selected genes. (E) Dot plot corresponding to the UMAP plot showing the expression of selected subset-specific genes – dot size resembles the percentage of cells within the cluster expressing the respective gene and dot color reflects the average expression within the cluster. (F) UMAP plots and pie charts showing the distribution of identified macrophage populations among epididymal regions.
Figure 5—figure supplement 1
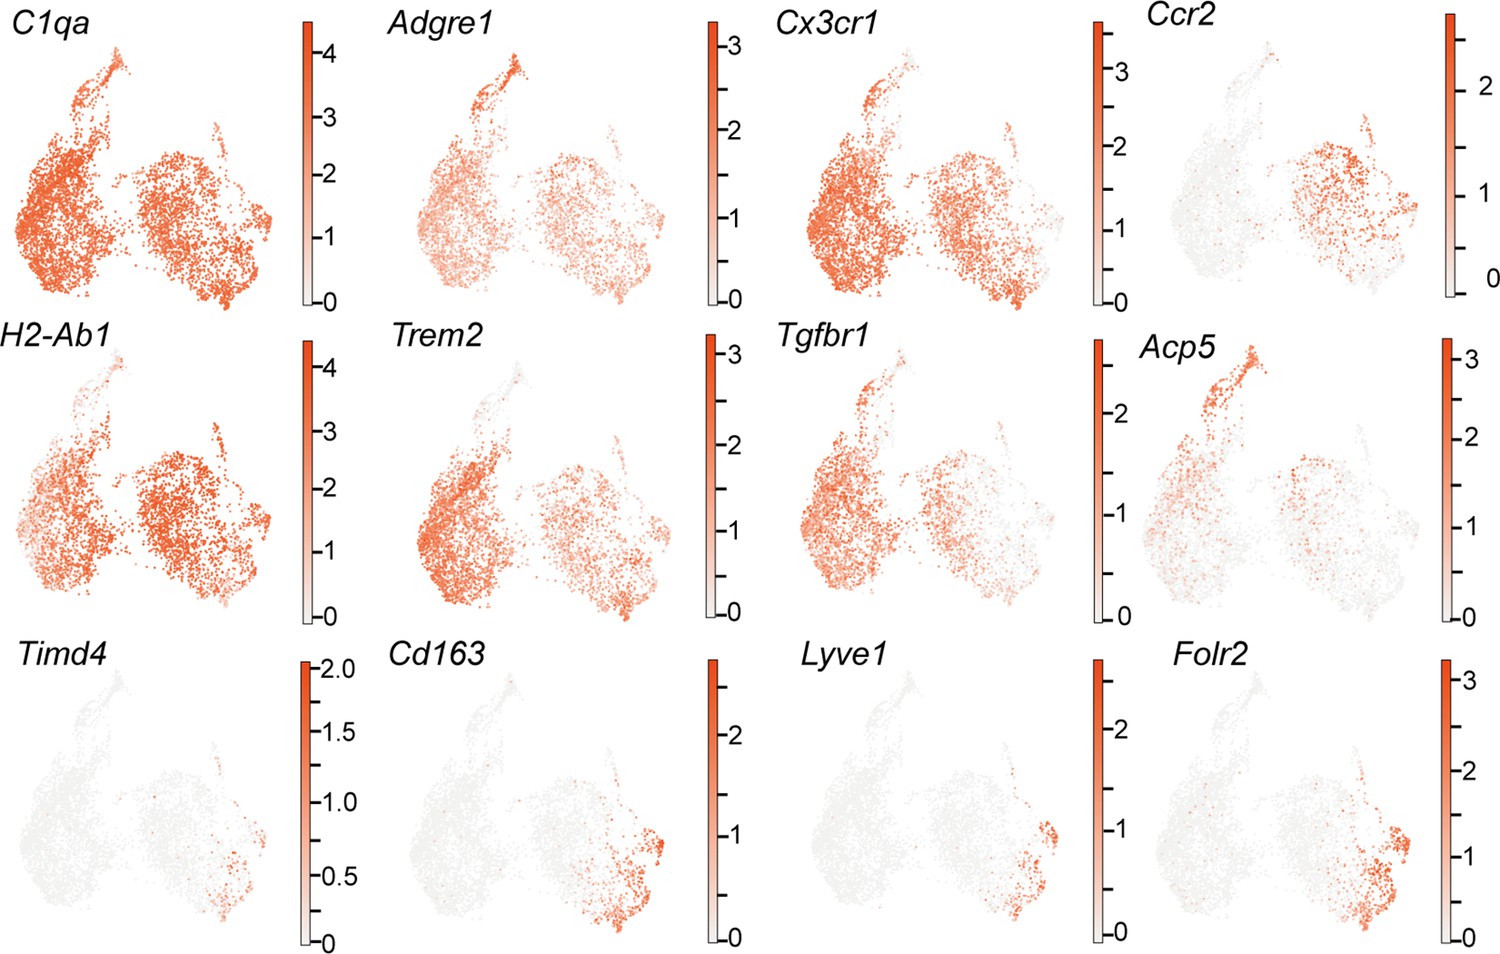
Uniform manifold approximation and projection (UMAP) plots showing the expression of selected key markers for identified macrophage subgroups, related to violin plots in Figure 4D.
Figure 5—figure supplement 2
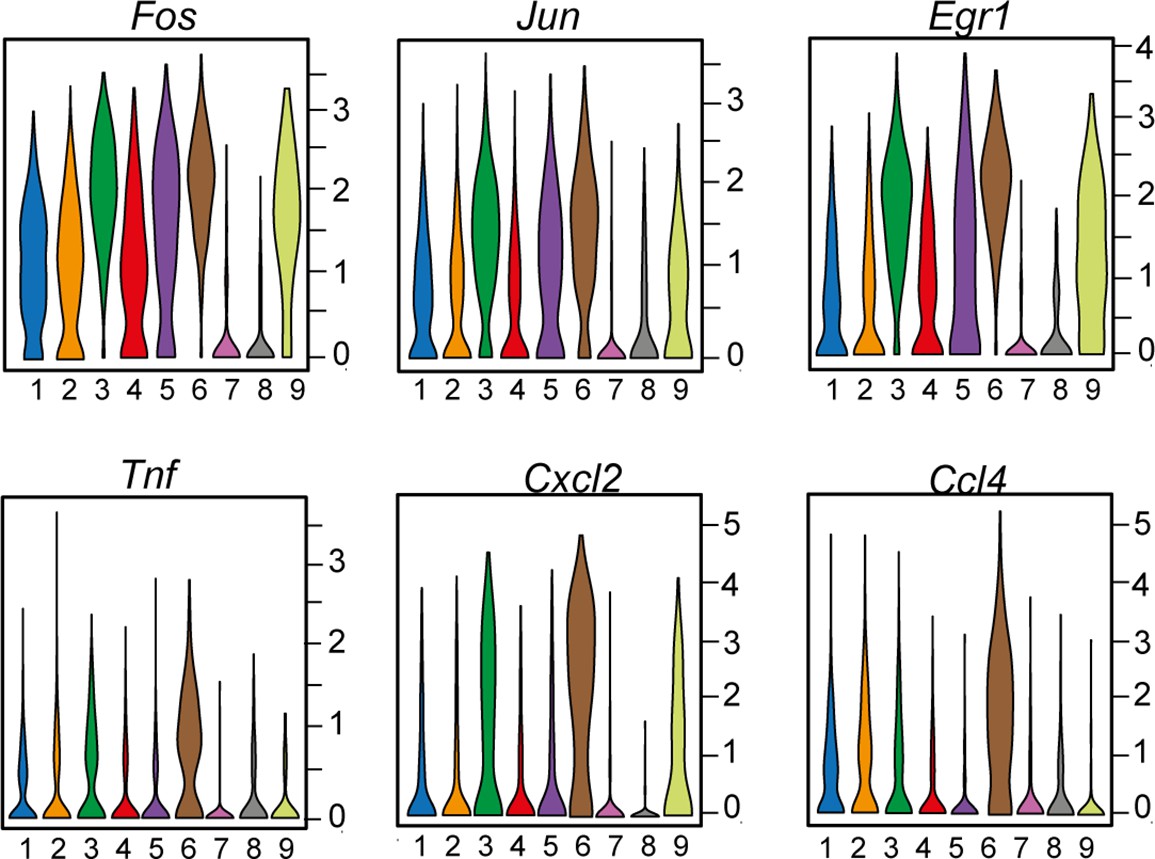
Violin plots showing the expression of immediate-early activation genes (Fos, Jun, Egr1) as well as upregulated cytokines Tnf, Cxcl2, Ccl4 among identified macrophage subgroups.
Figure 6 with 4 supplements
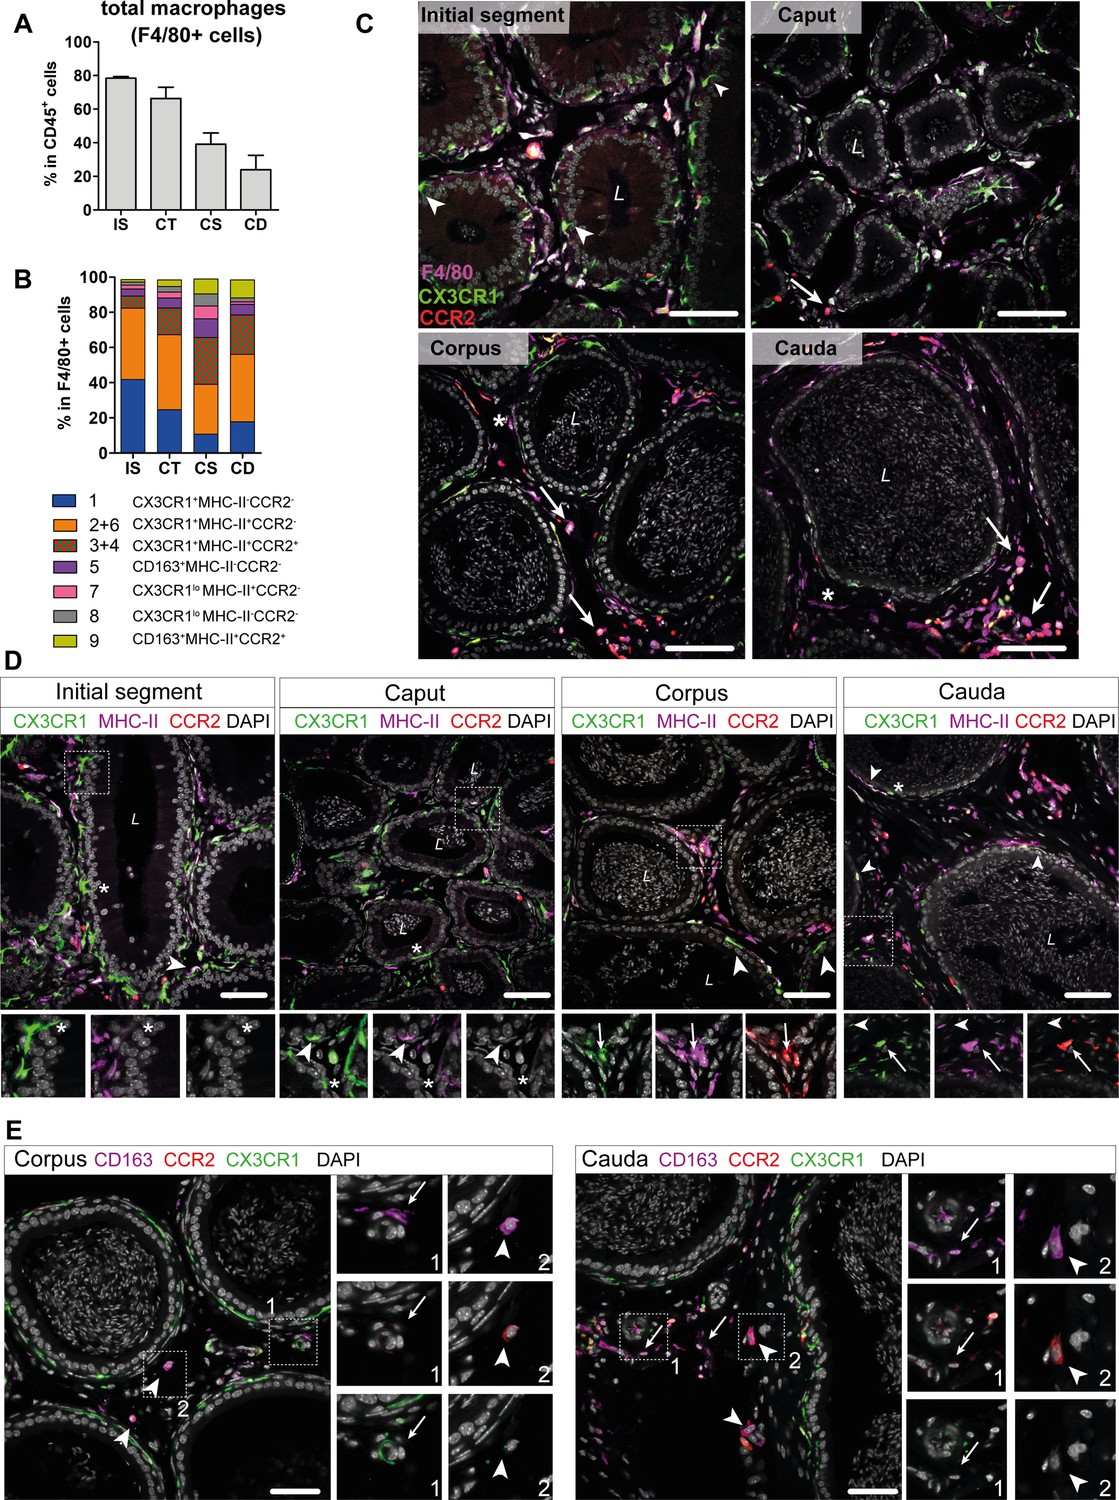
Distribution and localization of identified macrophage subgroups by flow cytometry and immunofluorescence.
(A) Bar diagram showing the percentage of F4/80+ cells within the CD45+ population throughout the epididymal regions, assessed by flow cytometry (n=8, mean ± SD). (B) Stacked bar diagram displaying the percentages of identified macrophage subtypes within the F4/80+ population throughout epididymal regions assessed by flow cytometry. Markers were selected based on single-cell RNA sequencing (scRNASeq) results (n=4). (C) Confocal microscopy images of F4/80 staining (purple) on Cx3cr1GFPCcr2RFP adult reporter mice. The majority of interstitial and intraepithelial CX3CR1+ cells were F4/80+. Arrowheads indicate a small fraction of intraepithelial CX3CR1+ F4/80 cells found within the initial segment (IS). Arrows indicate interstitial F4/80+ cells that were CX3CR1- and CCR2+ within caput, corpus, and cauda epididymides. Asterisks (*) label a small fraction of F4/80 single positive cells (CX3CR1-CCR2-) found in the corpus and cauda. Scale bar 50 µm (L=lumen). (D) Confocal microscopy images of MHC-II staining (purple) on Cx3cr1GFPCcr2RFP adult reporter mice. Asterisks (*) indicate intraepithelial CX3CR1+MHC-II- cells within the IS and caput epididymides. Arrowheads indicate CX3CR1+MHC-II+ cells, lining the epididymal duct within the IS and situated within the epithelium within caput, corpus, and cauda epididymides. Arrows indicate interstitial CX3CR1+MHC-II+CCR2+ cells additionally found within corpus and cauda epididymides. Scale bar 50 µm (L=lumen). (E) Confocal microscopy images of CD163 staining (purple) on Cx3cr1GFPCcr2RFP adult reporter mice in corpus and cauda epididymides. Arrows indicate CD163 single positive cells that were found in close proximity to vessels within the corpus and cauda. Arrowheads indicate CD163+CCR2+ cells found solitarily distributed within the interstitium in the corpus and cauda. Scale bar 50 µm.
Figure 6—figure supplement 1
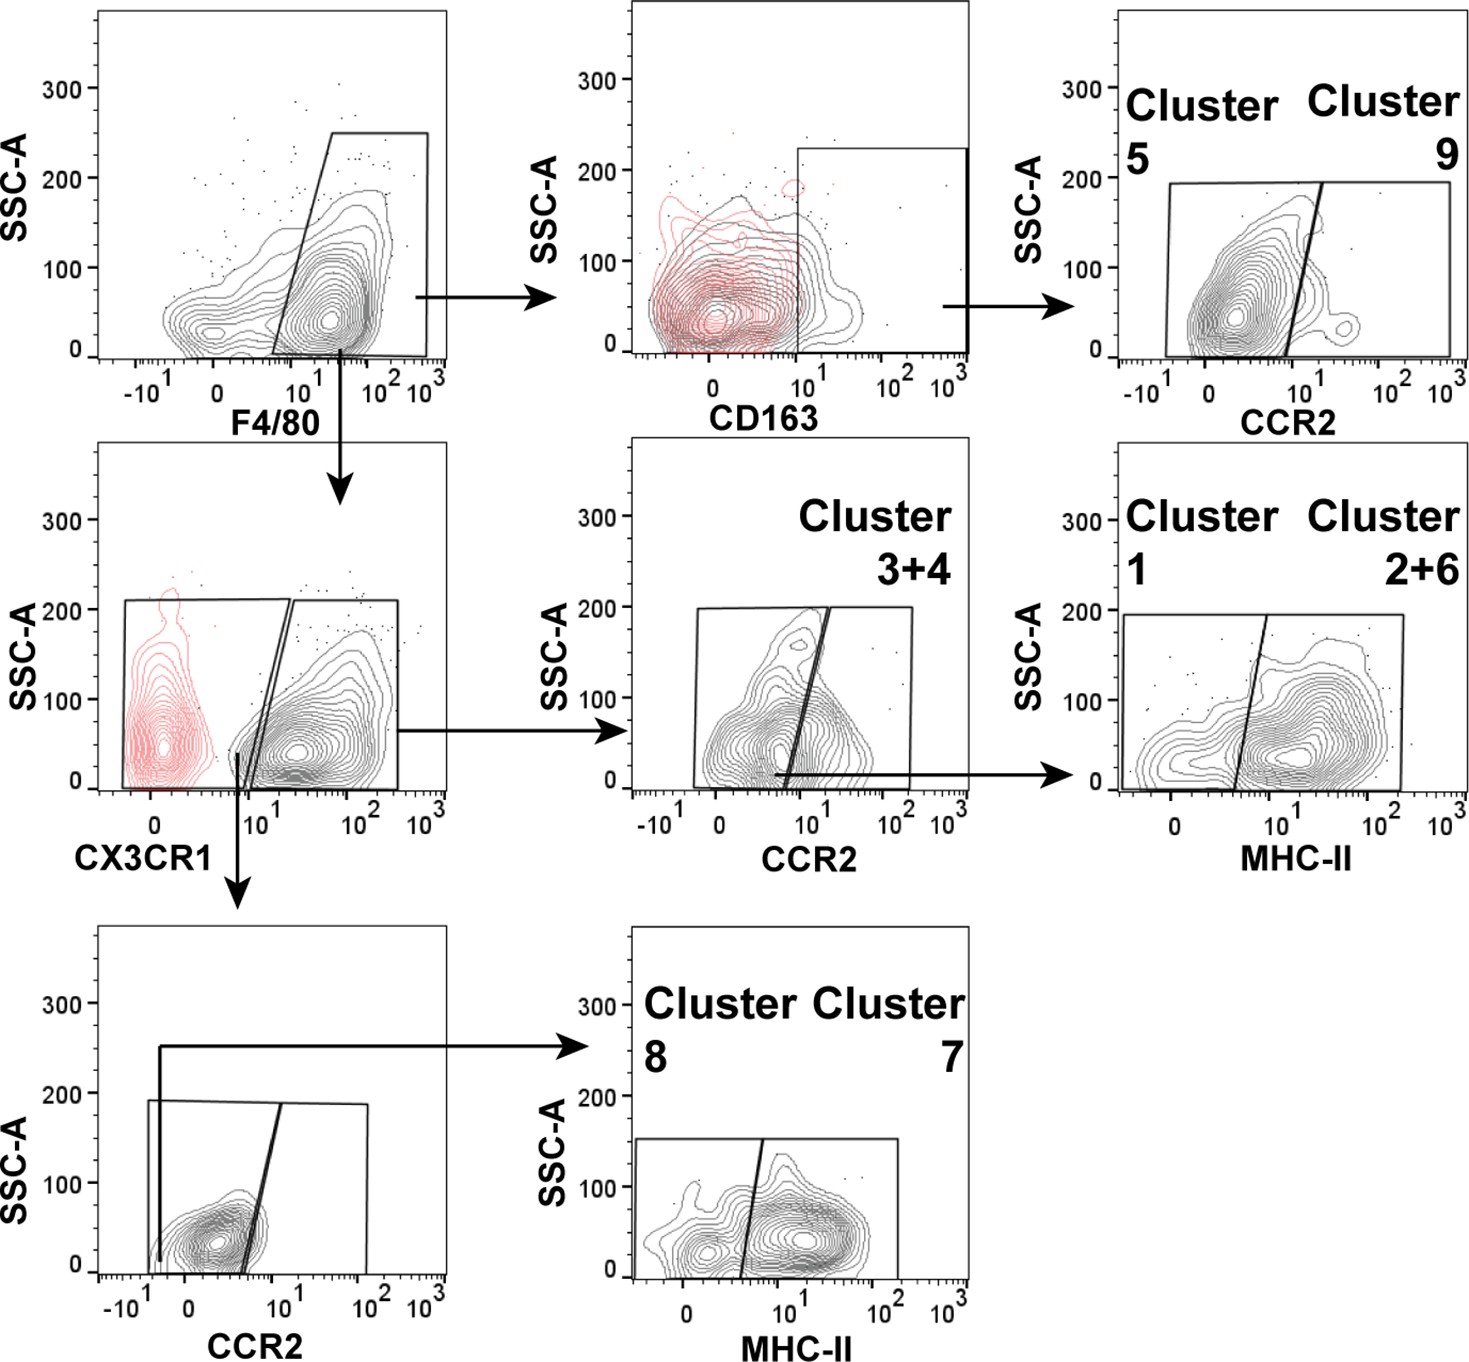
Gating strategy of macrophage subsets according to obtained single-cell RNA sequencing (scRNASeq) data.
Arrows indicate the gating strategy and identified subsets.
Figure 6—figure supplement 2
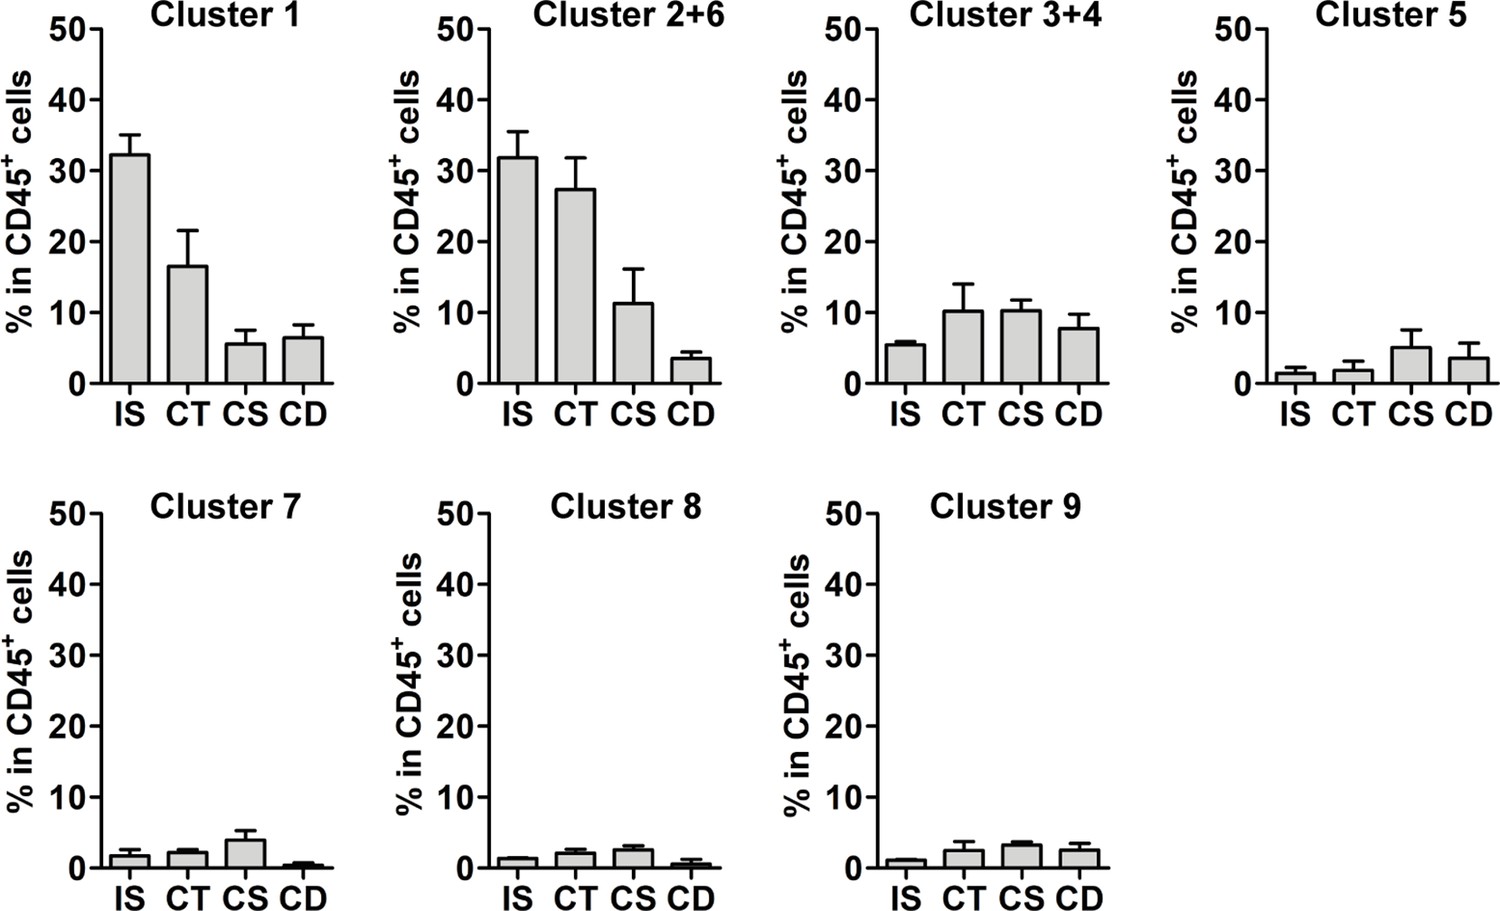
Macrophage subpopulations within CD45+ population.
Bar diagrams showing the percentage of identified macrophage subgroups within the CD45+ population throughout the epididymal regions, assessed by flow cytometry and mirroring the distribution obtained by single-cell RNA sequencing (scRNASeq) (n=4, mean ± SD).
Figure 6—figure supplement 3
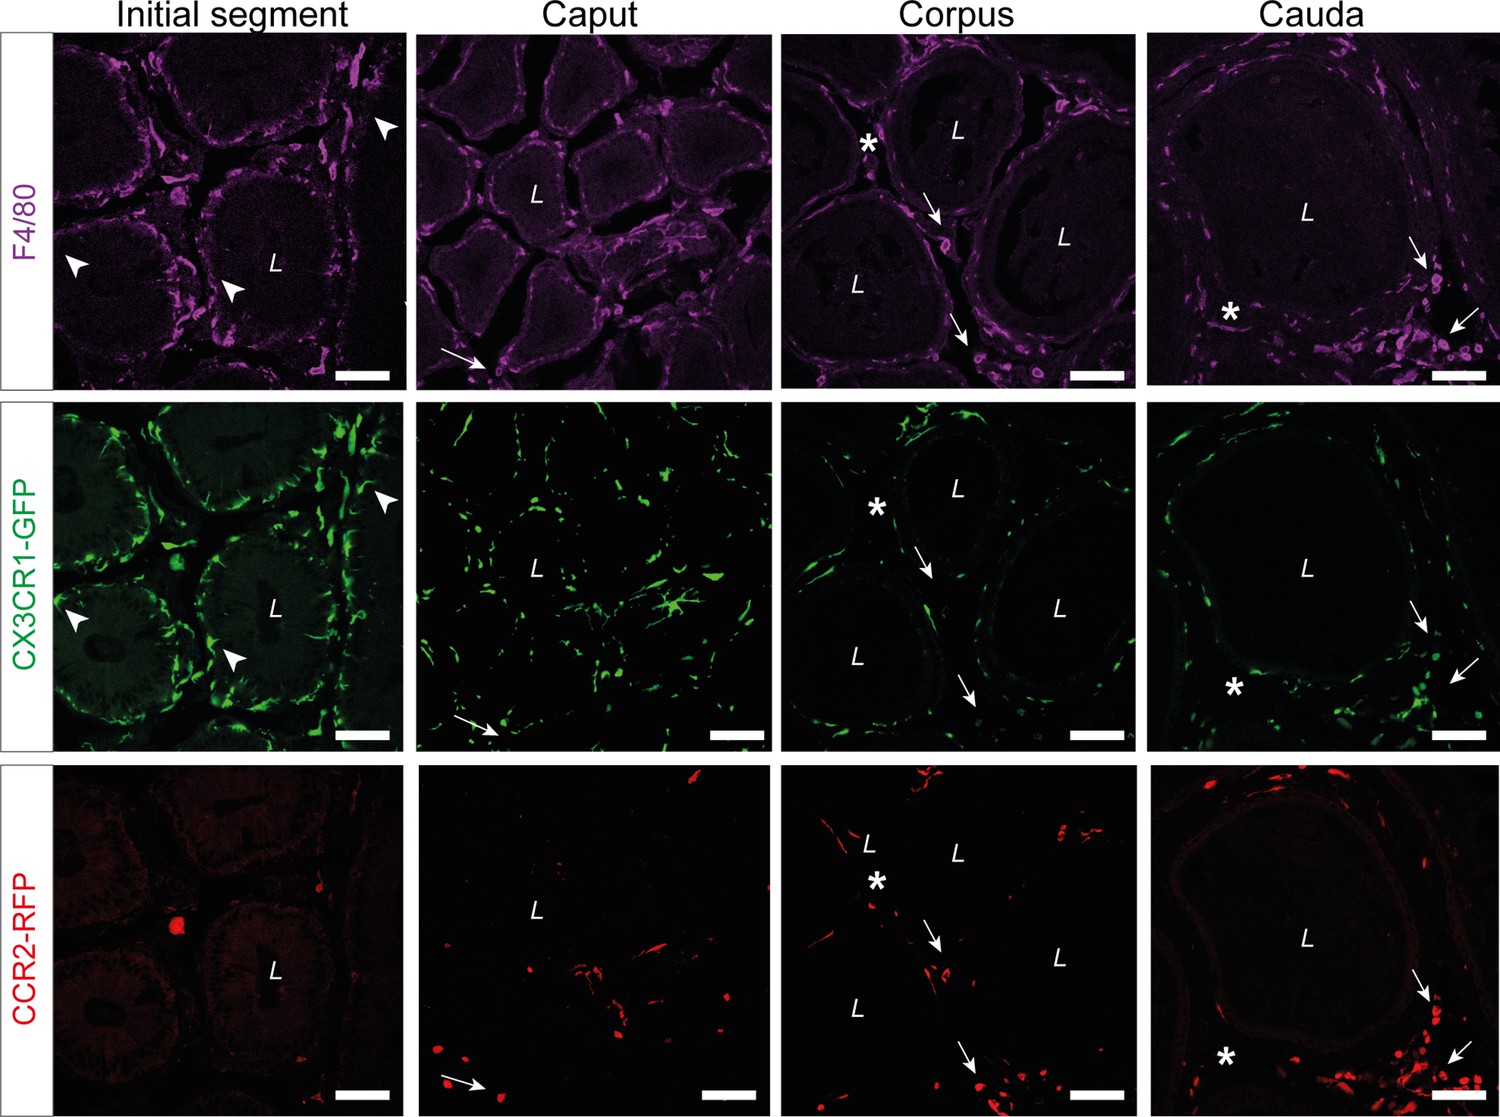
Single channel reads of anti-F4/80 (purple) staining on epididymal cryo-sections from adult Cx3cr1GFPCcr2RFP reporter mice.
The majority of CX3CR1+ cells were F4/80+. Arrowheads indicate the small fraction of intraepithelial F4/80- CX3CR1+ cells within the initial segment (IS). Arrows indicate interstitial F4/80+ CX3CR1- cells that were CCR2+ within caput, corpus, and cauda epididymides. Asterisks (*) label a small fraction of F4/80 single positive cells (CX3CR1-CCR2-) found in the corpus and cauda. Scale bar 50 µm (L=lumen).
Figure 6—figure supplement 4
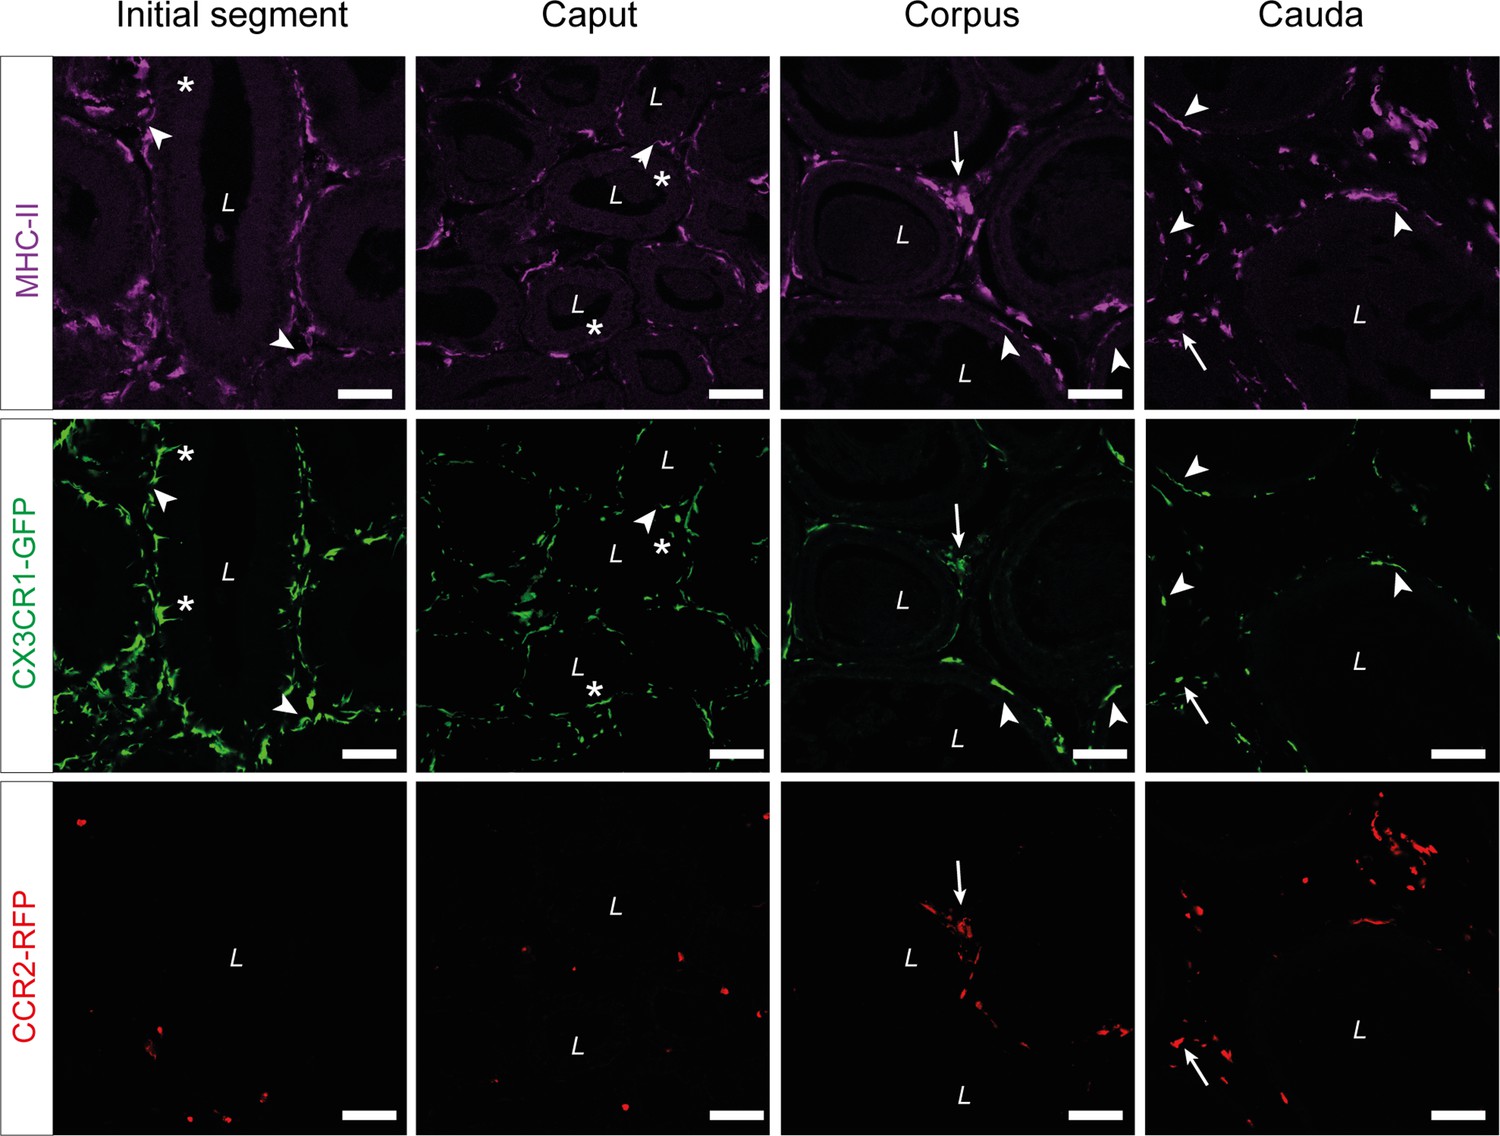
Single channel reads of anti-MHC-II (purple) staining on epididymal cryo-sections from adult Cx3cr1GFPCcr2RFP reporter mice.
Asterisks (*) indicate intraepithelial CX3CR1+MHC-II- cells within the initial segment (IS) and caput epididymides. Arrowheads indicate CX3CR1+MHC-II+ cells, lining the epididymal duct within the IS and situated within the epithelium within caput, corpus, and cauda epididymides. Arrows indicate interstitial CX3CR1+MHC-II+CCR2+ cells within corpus and cauda epididymides. Scale bar 50 µm (L=lumen).
Figure 7 with 2 supplements
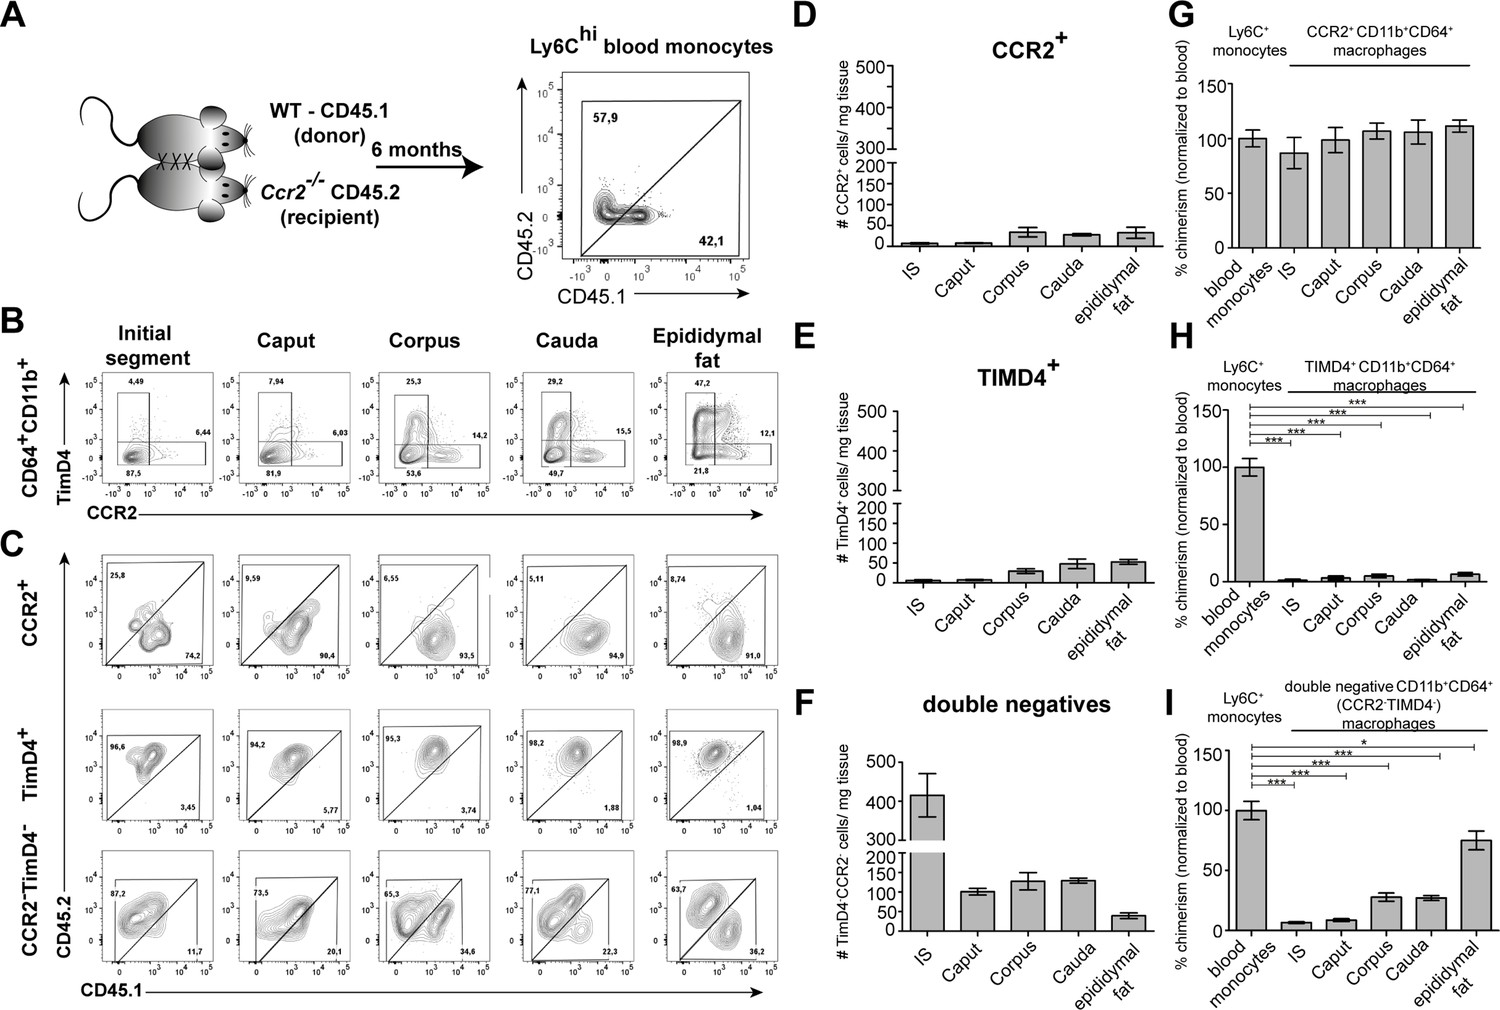
Resident macrophages differentially depend on monocytes within epididymal regions.
(A) Parabiosis was conducted by surgically conjoining wild type CD45.1+ donor mice with CD45.2 recipient Ccr2-/- mice for 6 months. Donor chimerism was confirmed on CD115+CD11b+Ly6Chi monocytes. (B) Flow cytometry contour plots showing the segregation of resident macrophages (CD11b+CD64+) isolated from different epididymal regions using the ontogeny marker TIMD4 and CCR2. Epididymal fat served as control tissue. Plots are representative for six parabionts. (C) Flow cytometry contour plots showing the chimerism in CCR2+, TIMD4+, and CCR2-TimD4- macrophages within different epididymal regions based on the CD45.1 and CD45.2 labeling. Plots are representative for six parabionts. (D–F) Bar diagrams showing the number of CCR2+ (D), TIMD4+ (E), and CCR2-TimD4-(F) macrophages (CD64+CD11b+) within different epididymal regions of the analyzed recipient Ccr2-/- mice (mean ± SEM, n=6). (G–I) Bar diagrams showing the percentage of chimerism normalized to blood chimerism in CCR2+ (G), TimD4+ (H), and CCR2-TIMD4- (I) epididymal macrophages (CD64+CD11b+) in the recipient Ccr2-/- mice after 6 months (n=6, n.s.=not significant, *p<0.05, **p<.0.005, ***p<0.001, n=6, mean ± SEM, one-way ANOVA with Bonferroni multiple comparison test).
Figure 7—figure supplement 1
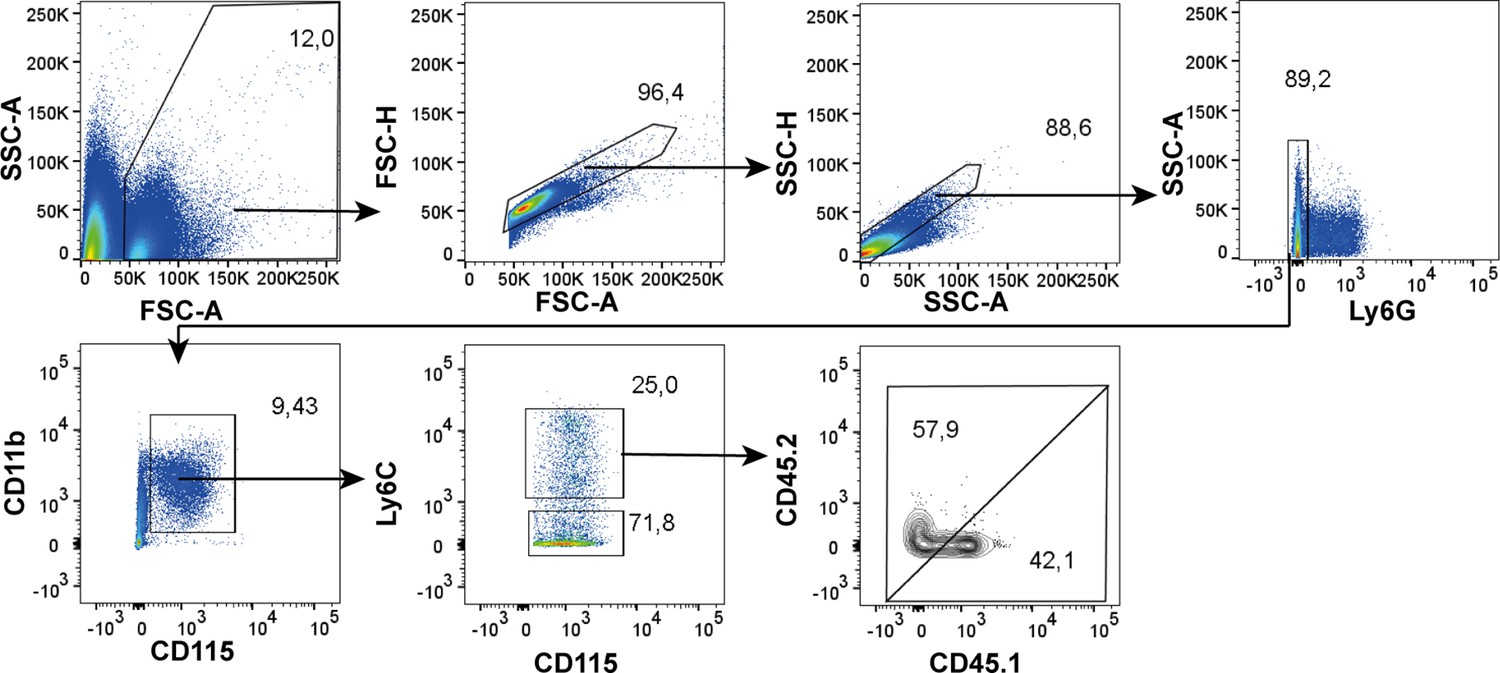
Gating strategy that was applied on blood samples from recipient Ccr2-/- mice.
General gating was initially performed based on FSC and SSC in order to exclude debris and doublets, before neutrophils were excluded by selecting Ly6G- cells. Monocytes were further gated using CD115 and CD11b. Ratios of CD45.1+ and CD45.2+ events were assessed on Ly6C+ monocytes.
Figure 7—figure supplement 2
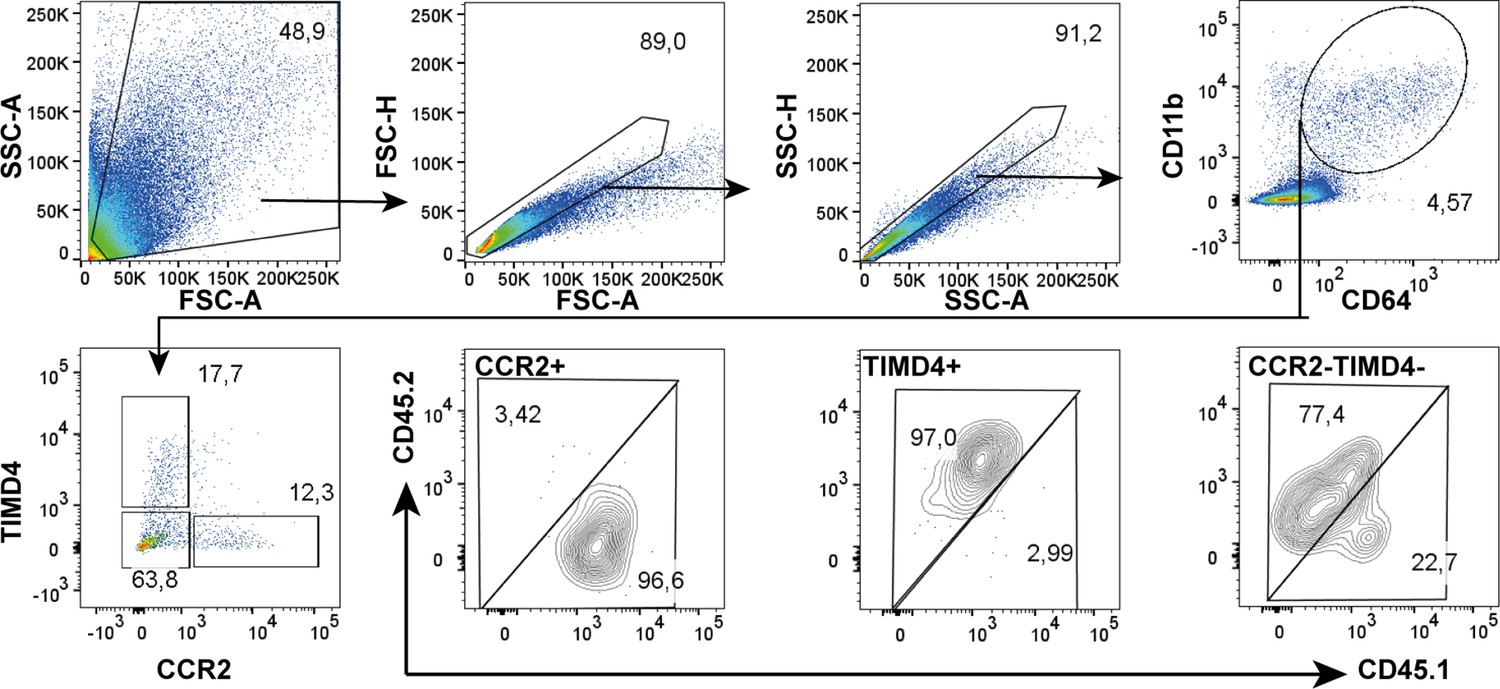
Representative plots (cauda) that were applied for the epididymal regions starting with general gating based on FSC and SSC in order to exclude debris and doublets.
Total CD64+CD11b+ cells were gated and further segregated using TIMD4 and CCR2. The ratio of CD45.1 and CD45.2+ events was assessed in CCR2+, TIMD4+, and CCR2-TIMD4- cells.
Tables
Appendix 1—key resources table
| Reagent type (species) or resource | Designation | Source or reference | Identifiers | Additional information |
|---|---|---|---|---|
| Strain, strain background (Escherichia coli) | CFT073 | Welch et al., 2002 | NCBI: txid19.9310 | Provided by T.Chakraborty, Justus-Liebig-University, Giessen, Germany |
| Strain, strain background (Mus musculus, male) | C57BL/6 J wild type | Charles River | JAX ID: 000664 | 10–12 weeks old |
| Strain, strain background (Mus musculus, male) | B6.129(Cg)-Cx3cr1tm1Litt Ccr2tm2.1Ifc/JernJ (Cx3cr1GFPCcr2RFP) | Jackson Laboratory Jung et al., 2000; Saederup et al., 2010 | JAX ID: 032127 | |
| Strain, strain background (Mus musculus, male) | B6.SJL-Ptprca Pepcb/ BoyJ (B6 CD45.1) | Jackson Laboratory (Janowska-Wieczorek et al., 2001; Schluns et al., 2002; Yang et al., 2002) | JAX ID: 002014 | |
| Strain, strain background (Mus musculus, male) | B6.129S4-Ccr2tm1Ifc/J (Ccr2-/-) | Jackson Laboratory (Boring et al., 1997) | JAX ID: 004999 | |
| Strain, strain background (Mus musculus, male) | C57/BL/6-Trdctm1Mal/J (Trcd-H2BeGFP) | Jackson Laboratory (Prinz et al., 2006) | JAX ID: 016941 | |
| Antibody | PerCP/C5.5 anti-mouse CD45 (rat monoclonal) | BioLegend | Cat.No.: 103131; RRID: AB_893344 | FC (1:200) for infection study |
| Antibody | AF700 anti-mouse CD3 (rat monoclonal) | BioLegend | Cat.No.: 100216; RRID: AB_493697 | FC (1:50) for infection study |
| Antibody | Brilliant Violet 511 anti-mouse/ human CD45R/B220 (rat monoclonal) | BioLegend | Cat.No.: 103247; RRID: AB_2561394 | FC (1:200) for infection study |
| Antibody | Brilliant Violet 605 anti- mouse NK1.1 (mouse monoclonal) | BioLegend | Cat. No.: 108753; RRID: AB_2686977 | FC (1:200) for infection study |
| Antibody | Brilliant Violet 650 CD11c (Armenian Hamster monoclonal) | BioLegend | Cat.No.: 117339; RRID: AB_2562414 | FC (1:100) for infection study |
| Antibody | Brilliant Violet 711 anti-mouse Ly-6G/Ly-6C (GR-1) (rat monoclonal) | BioLegend | Cat.No.: 108443; RRID: AB_2562549 | FC (1:200) for infection study |
| Antibody | Brilliant Violet 785 anti-mouse I-A/I-E (MHC-II) (rat monoclonal) | BioLegend | Cat.No.: 107645; RRID: AB_2565977 | FC (1:200) for infection study |
| Antibody | PE/Dazzle594 anti-mouse F4/80 (rat monoclonal) | BioLegend | Cat.No.:123145; RRID: AB_2564132 | FC (1:100) for infection study |
| Antibody | PE/Cyanine7 anti-mouse CX3CR1 (mouse monoclonal) | BioLegend | Cat.No.:149015; RRID: AB_2565699 | FC (1:1000) for infection study |
| Antibody | FITC anti-mouse CCR2 (rat monoclonal) | BioLegend | Cat. No.: 150608; RRID: AB_2616980 | FC (1:200) for infection and steady-state study |
| Antibody | Brilliant Violet 421 anti-mouse CX3CR1 (mouse monoclonal) | BioLegend | Cat.No.: 149023; RRID: AB_2565706 | FC 1:1000 for steady-state study |
| Antibody | PerCP/Cyanine5.5 anti-mouse CD45 (rat monoclonal) | BioLegend | Cat.No.:157207; RRID: AB_2860727 | FC 1:100 for steady-state study |
| Antibody | PE/Cyanine7 anti-mouse F4/80 (rat monoclonal) | BioLegend | Cat.No.: 123113; RRID: AB_893490 | FC 1:100 for steady-state study |
| Antibody | APC anti-mouse CD163 (rat monoclonal) | BioLegend | Cat.No.:155305; RRID: AB_2814059 | FC 1:200 for steady-state study |
| Antibody | APC/Cy7 anti-mouse I-A/I-E (rat monoclonal) | BioLegend | Cat.No.: 107627; RRID: AB_1659252 | FC 1:200 for steady-state study |
| Antibody | Brilliant Violet 421 anti-mouse NK1.1 (mouse monoclonal) | BioLegend | Cat.No.: 108731; RRID: AB_10895916 | FC 1:200 for steady-state study |
| Antibody | FITC anti-mouse CD3 (rat monoclonal) | BioLegend | Cat.No.: 100203; RRID: AB_312660 | FC 1:50 for steady-state study |
| Antibody | PE anti-mouse B220 (CD45R) (rat monoclonal) | Miltenyi | Cat.No.: 130-120-077; RRID: AB_2751992 | 1:50 for steady-state study |
| Antibody | PE/Cyanine7 anti-mouse TCRbeta chain (Armenian Hamster monoclonal) | BioLegend | Cat.No. 109221; RRID: AB_893627 | 1:100 for steady-state study |
| Antibody | APC anti-mouse TCR g/d (Armenian Hamster monoclonal) | BioLegend | Cat.No.: 118115; RRID: AB_1731824 | 1:100 for steady-state study |
| Antibody | APC/Fire750 anti-mouse CD45 (mouse monoclonal) | BioLegend | Cat.No.: 103153; RRID: AB_2572115 | 1:100 for steady-state study |
| Antibody | Brilliant Violet 421 anti- mouse F4/80 (mouse monoclonal) | BioLegend | Cat.No.: 123131; RRID: AB_10901171 | 1:100 for steady-state study |
| Antibody | PE anti-mouse CD209a (DC-Sign) antibody (mouse monoclonal) | BioLegend | Cat.No.: 833003; RRID: AB_2721636 | FC 1:50 for steady-state study |
| Antibody | PerCP/Cy5.5 anti-mouse/ human CD11b (rat monoclonal) | BioLegend | Cat.No.: 101228; RRID: AB_893232 | FC 1:200 for steady-state study |
| Antibody | APC anti-mouse I-Ab (mouse monoclonal) | BioLegend | Cat.No:116418; RRID: AB_10574160 | FC 1:200 for steady-state study and parabiosis |
| Antibody | PerCP/Cyanine5.5 anti- mouse CD45.1 (mouse monoclonal) | BioLegend | Cat.No.: 110728; RRID: AB_893346 | FC 1:100 for steady-state study and parabiosis |
| Antibody | APC/Cyanine7 anti-mouse CD45.2 (mouse monoclonal) | BioLegend | Cat.No.: 109824; RRID: AB_830789 | i.v. injection 1:100 |
| Antibody | PE anti-mouse CD64 (FcγRI) (mouse monoclonal) | BioLegend | Cat.No:. 139303; RRID: AB_10612740 | FC 1:100 for steady-state study and parabiosis |
| Antibody | PE/Cyanine7 anti-mouse Tim-4 (rat monoclonal) | BioLegend | Cat.No.: 130010; RRID: AB_2565719 | FC 1:100 for parabiosis |
| Antibody | Brilliant Violet 785 anti- mouse/human CD11b (rat monoclonal) | BioLegend | Cat.No.: 101224; RRID: AB_755986 | FC 1:100 for parabiosis |
| Antibody | Alexa Fluor 700 anti-mouse Ly-6G (rat monoclonal) | BioLegend | Cat.No.: 127622; RRID: AB_10643269 | FC 1:100 for parabiosis |
| Antibody | PE anti-mouse CD115 (CSF-1R) (rat monoclonal) | BioLegend | Cat.No.: 135506; RRID: AB_1937253 | FC 1:100 for parabiosis |
| Antibody | FITC anti-mouse Ly-6C (rat monoclonal) | BioLegend | Cat.No.: 128006; RRID: AB_1186135 | FC 1:100 for parabiosis |
| Antibody | anti-mouse F4/80 (rat monoclonal) | BioLegend | Cat.No. MCA497G; RRID: AB_872005 | IF 1:200 |
| Antibody | anti-mouse Ly-6G+Ly-6C (rat monoclonal) | abcam | Cat.No. ab25377; RRID: AB_470492 | IF 1:500 |
| Antibody | Purified anti-mouse I-A/I-E (mouse monoclonal) | BioLegend | Cat.No.: 107601; RRID: AB_313316 | IF 1:200 |
| Antibody | Purified anti-mouse Ly-6C (rat monoclonal) | BioLegend | Cat.No. 128002 RRID: AB_1134214 | IF 1:100 |
| Antibody | Purified anti-mouse CD3 (mouse monoclonal) | BioLegend | Cat.No. 100202 RRID: AB_312659 | IF 1:50 |
| Antibody | Anti-mouse Clec9a (sheep polyclonal) | R&D Systems | Cat.No. AF6776 RRID: AB_10890771 | IF 1:50 |
| Antibody | anti-mouse CD163 [TNKUPJ] (rat monoclonal) | Invitrogen/ eBioscience | Cat.No. 14-1631-82 RRID: AB_2716934 | IF 1:200 |
| Antibody | anti-NCR1 antibody [EPR23097-35] (rabbit monoclonal) | abcam | Cat.No. ab233558 RRID: AB_2904203 | IF 1:50 |
| Antibody | Ani-mouse DC-Sign (DC28) (mouse monoclonal) | Santa Cruz | Cat.No. sc-65740 RRID: AB_1121347 | IF 1:50 |
| Antibody | Goat anti-rabbit IgG (H+L) Cross-Adsorbed Secondary Antibody, Alexa Fluor 488 | Invitrogen | Cat-No. 11008 RRID: AB_143165 | IF 1:2000 |
| Antibody | Goat anti-rabbit IgG (H+L) Cross-Adsorbed Secondary Antibody, Alexa Fluor 546 | Invitrogen | Cat.No. A-11010 RRID: AB_2534077 | IF 1:2000 |
| Antibody | Goat anti-rat IgG (H+L) Cross-Adsorbed secondary Antibody, Alexa Fluor 546 | Invitrogen | Cat.No. A-11081 RRID: AB_141738 | IF 1:2000 |
| Antibody | Goat Anti-Rat IgG H+L Alexa Fluor 647 | abcam | Cat.No. ab150159; RRID: AB_2566823 | IF 1:2000 |
| Antibody | Donkey Anti-Sheep IgG (H+L) Alexa fluor 546 | Invitrogen | Cat.No.:A-21098 RRID: AB_2535752 | IF: 1:2000 |
| Antibody | Brilliant Violet 421 Mouse IgG2a, κ Isotype Ctrl antibody | BioLegend | Cat.No.: 400259; RRID: AB_10895919 | FC 1:200 Isotype control |
| Antibody | Brilliant Violet 421 Rat IgG2a, κ Isotype Ctrl antibody | BioLegend | Cat.No.: 400535; RRID: AB_10933427 | FC 1:200 Isotype control |
| Antibody | Brilliant Violet 510 Rat IgG2a, κ, Isotype Ctrl antibody | BD Bioscience | Cat.No. 562952; RRID: AB_2869438 | FC 1:200 Isotype control |
| Antibody | FITC Rat IgG2b, κ Isotype Ctrl antibody | BioLegend | Cat.No.: 400605; RRID: AB_326549 | FC 1:200 Isotype control |
| Antibody | Alexa Fluor 488 Rat IgG2a, κ Isotype Ctrl antibody | BioLegend | Cat.No.: 400525; RRID: AB_2864283 | FC 1:200 Isotype control |
| Antibody | Alexa Fluor 488 Rat IgG2b, κ Isotype Ctrl antibody | BioLegend | Cat.No.: 400625; RRID: AB_389321 | FC 1:200 Isotype control |
| Antibody | PE Isotype Control Antibody, Rat IgG2a | Miltenyi | Cat.No.: 130-123-747; RRID: AB_2857628 | FC 1:200 Isotype control |
| Antibody | PE Rat IgG2a, κ Isotype Ctrl antibody | BioLegend | Cat.No.: 400507; RRID: AB_326530 | FC 1:200 Isotype control |
| Antibody | PE Mouse IgG2a, κ Isotype Ctrl antibody | BioLegend | Cat.No.: 400213; RRID: AB_2800438 | FC 1:200 Isotype control |
| Antibody | PE Rat IgG2b kappa Isotype Control | eBioscience | Cat.No.: 12-4031-82; RRID: AB_470042 | FC 1:200 Isotype control |
| Antibody | PerCP/Cyanine5.5, Rat IgG2b, κ Isotype Ctrl antibody | BioLegend | Cat.No. 400631; RRID: AB_893693 | FC 1:200 Isotype control |
| Antibody | PE/Cyanine 7 Mouse IgG1, κ Isotype Ctrl antibody | BioLegend | Cat.No.: 400125; RRID: AB_2861533 | FC 1:200 Isotype control |
| Antibody | PE/Cyanine 7 Rat IgG2a, κ Isotype Ctrl antibody | BioLegend | Cat.No.: 400521; RRID: AB_326542 | FC 1:200 Isotype control |
| Antibody | PE/Cyanine 7 Armenian Hamster IgG Isotype Ctrl antibody | BioLegend | Cat.No.:400921; RRID: AB_2905473 | FC 1:200 Isotype control |
| Antibody | APC Rat IgG2a, κ Isotype Ctrl antibody | BioLegend | Cat.No.: 400511; RRID: AB_2814702 | FC 1:200 Isotype control |
| Antibody | APC Armenian Hamster IgG Isotype Ctrl antibody | BioLegend | Cat.No.: 400911; RRID: AB_2905474 | FC 1:200 Isotype control |
| Antibody | APC Mouse IgG2a, κ Isotype Ctrl (FC) antibody | BioLegend | Cat.No.: 400221; RRID: AB_2891178 | FC 1:200 Isotype control |
| Antibody | APC/Cyanine7 Rat IgG2b, κ Isotype Ctrl antibody | BioLegend | Cat.No.: 400628; RRID: AB_326565 | FC 1:200 Isotype control |
| Antibody | APC/Fire750 Rat IgG2b, κ Isotype Ctrl antibody | BioLegend | Cat.No.: 400669; RRID: AB_2905475 | FC 1:200 Isotype control |
| Commercial assay or kit | M.O.M. (Mouse on Mouse) Immunodetection Kit | Vector Laboratories | Cat.No. BMK-2202 | |
| Commercial assay or kit | RNeasy Mini Kit | Qiagen | Cat.No.: 74004 | |
| Commercial assay or kit | LEGENDPlex with Mouse Inflammation Panel | BioLegend | Cat.No.: 740446 | |
| Commercial assay or kit | SMARTer Stranded Total RNA-Seq Kit – Pico Input Mammalian | Takara | Cat.No.: 634488 | |
| Chemical compound, drug | Collagenase D from Clostridium histolyticum | Roche | Cat.No. 11088858001 | |
| Chemical compound, drug | DNase I | Sigma | Cat.No. D4513 | |
| Chemical compound, drug | Hyaluronidase type I-S | Sigma | Cat.No. H3506 | |
| Chemical compound, drug | RBC Lysis Solution | Qiagen | Cat.No.: 158904 | |
| Chemical compound, drug | UltraPure Lipopolysaccharide from Escherichia coli O55:B5 | Sigma | Cat.No.: L2880 | |
| Chemical compound, drug | Gibco RPMI1640 media | Fisher Scientific | Cat-No.: 11530586 | |
| Chemical compound, drug | QIAzol Lysis Reagent | Qiagen | Cat.No.: 79306 | |
| Chemical compound, drug | Fc blocking reagent | Miltenyi | Cat.No. 130-092-575 | |
| Chemical compound, drug | Gentamicin solution | Sigma/ Merck | Cat.No. G1397 | |
| Other (dyes) | ZombieAqua | BioLegend | Cat.No.: 423101 | |
| Other (dyes) | ZombieNIR | BioLegend | Cat. No.: 423105 | |
| Other (dyes) | Viobility 405/452 Fixable Dye | Miltenyi | Cat.No.: 130-092-575 | |
| Other (dyes) | DAPI | Invitrogen | D1306 | 1 µg/ml |
| Other | ProLong Antifade Gold with DAPI | Invitrogen | P36931 | |
| Other | ProLong Antifade Gold w/o DAPI | Invitrogen | P36930 | |
| Software, algorithm | FlowJo v10.8.2 | BD Life Sciences | RRID: SCR_008520 | https://www.flowjo.com/ |
| Software, algorithm | Adobe Illustrator 2020 (v24.0.1) | Adobe | RRID: SCR_010279 | https://www.adobe.com/de/products/illustrator.html |
| Software, algorithm | GraphPad Prism v5 | GraphPad Software | RRID: SCR_002798 | https://www.graphpad.com/scientific-software/prism/ |
| Software, algorithm | InkScape v0.92.4 | The Inkscape Project | RRID: SCR_014479 | https://inkscape.org/de/release/inkscape-0.92.4/ |
| Software, algorithm | ImageJ 1.53 a | Wayne Rasband National Institute of Health, USA | RRID: SCR_003070 | https://imagej.nih.gov/ij/index.html |
| Software, algorithm | Zen 2.3 Version 14.0.26.201 | Carl Zeiss Microscopy | https://www.zeiss.de/mikroskopie/produkte/mikroskopsoftware/zen-lite/zen-lite-download.html | |
| Software, algorithm | LEGENDPlex Software v8.0 | BioLegend | software provied by BioLegend as part of the LegendPlex kit for protein analysis | https://www.biolegend.com/en-us/legendplex |
| Software, algorithm | FastQC | Andrews, 2010 | RRID: SCR_014583 | http://www.bioinformatics.babraham.ac.uk/projects/fastqc/ |
| Software, algorithm | STAR 2.6.1d | Dobin et al., 2013 | RRID: SCR_004463 | https://github.com/alexdobin/STAR/releases?page=2 |
| Software, algorithm | Subread package | Liao et al., 2013 | RRID: SCR_009803 | http://subread.sourceforge.net/ |
| Software, algorithm | DESeq2 V1.18.1 | Love et al., 2014 | RRID: SCR_015687 | https://bioconductor.org/packages/release/bioc/html/DESeq2.html |
| Other | BD Aria Fusion | BD BioScience | N/A | Instrument |
| Other | Homogenizer MM400 | Retsch | N/A | Instrument |
| Other | LabChip Gx Touch 24 | Perkin Elmer | N/A | Instrument |
| Other | Leica Cryotome CM1850 | Leica | N/A | Instrument |
| Other | Leica Microtome RM2255 | Leica | N/A | Instrument |
| Other | MACS Quant Analyzer 10 | Miltenyi | N/A | Instrument |
| Other | BD LSRFortessa Cell Analyzer | BD Biosciences | N/A | Instrument |
| Other | NextSeq500 | Illumina | N/A | Instrument |
| Other | Zeiss LSM710 Confocal Microscope | Carl Zeiss Microscopy | N/A | Instrument |
| Other | Olympus BX51 | Olympus | N/A | instrument |
Additional files
Download links
A two-part list of links to download the article, or parts of the article, in various formats.
Downloads (link to download the article as PDF)
Open citations (links to open the citations from this article in various online reference manager services)
Cite this article (links to download the citations from this article in formats compatible with various reference manager tools)
The regional distribution of resident immune cells shapes distinct immunological environments along the murine epididymis
eLife 11:e82193.
https://doi.org/10.7554/eLife.82193


