Physical basis of the cell size scaling laws
- Institut Curie, PSL Research University, CNRS UMR168, France
- Collège de France, France
Figures
Figure 1
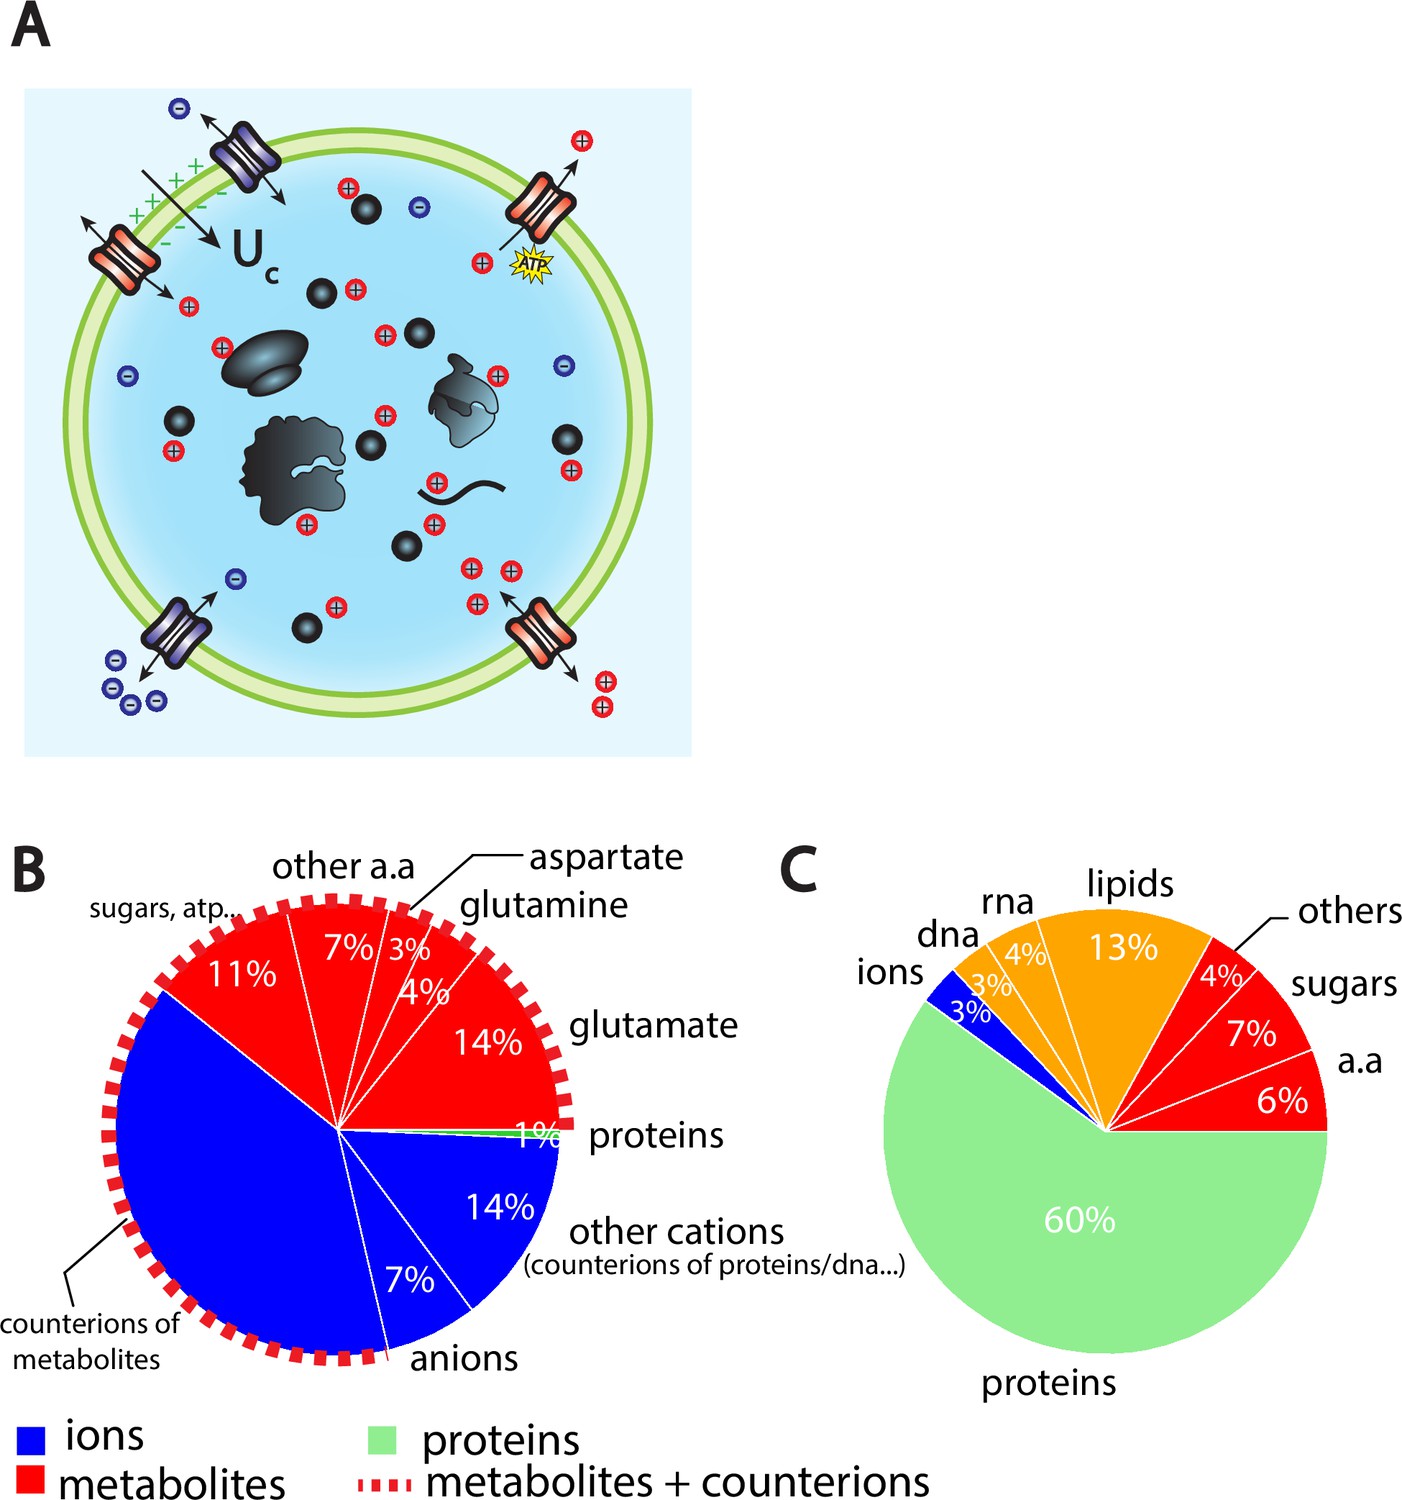
The Pump-Leak model coupled to order of magnitude estimates predicts that the cellular wet volume is mainly accounted for by metabolites (mainly amino acids, mostly glutamate) and their counterions in mammalian cells.
(A) Schematic of the Pump-Leak model. Species in black are impermeant molecules such as proteins, mRNAs, and metabolites (black circles). In average, those molecules are negatively charged and thus carry positive counterions (red species) to ensure electroneutrality. Ions can freely cross the plasma membrane through channels. Their concentrations in the cell result from the balance of three fluxes: the electrical conduction, the entropic diffusion, and pumping. In the model, only cations are pumped out of the cell to model the Na/K pump but this assumption is not critical (see ‘Discussion’, section ‘Physical grounds of the model’ and Appendix 1, section 2.1.3). (B) Fraction of volume and (C) of the dry mass occupied by the constituents of a mammalian cell (see Appendix 1, section 3.1 and Alberts et al., 2002).
Figure 2
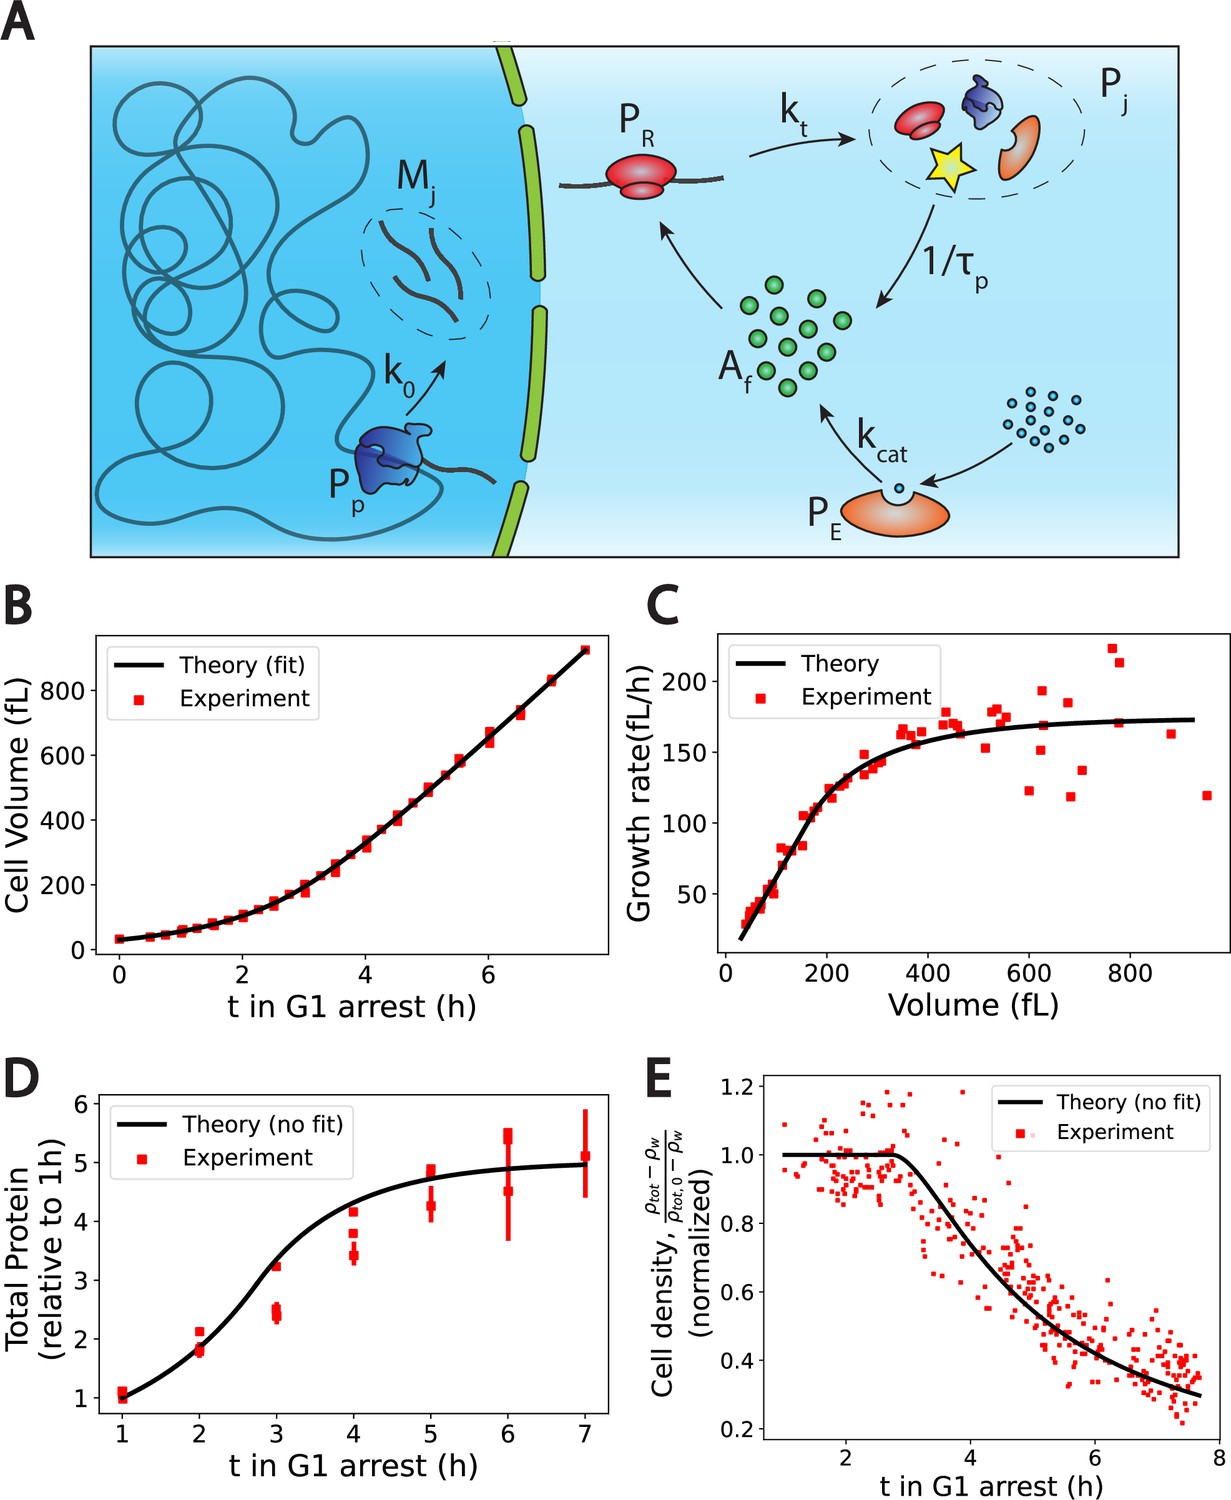
The Pump-Leak model coupled to a growth model predicts quantitatively dry mass homeostasis and its subsequent dilution at senescence.
(A) Schematic of the growth model. RNAPs () transcribe DNA and form mRNAs () at an average rate k0. mRNAs are then read by ribosomes () to produce proteins () at an average rate . Proteins are degraded at an average rate into free amino-acids (). Free amino acids are also synthetized from nutrients (blue circles) at a rate . This reaction is catalyzed by enzymes (). (B–E) Comparison between theory (black) and experiment (red). (B, C, and E) have respectively been adapted from Figure 3.A, B and H of Neurohr et al., 2019. (D) has been adapted from Figure 3C,D and S5C of Neurohr et al., 2019. (D, E) Model predictions without any fitting parameters. The total mass density is defined as the total mass of the cell (water and dry mass) over the total volume of the cell. The online version of this article includes the following source data for Figure 2: Figure 2—source data 1–4. Data tables extracted from Neurohr et al., 2019.
-
Figure 2—source data 1
Data tables extracted from Figure 3.A of Neurohr et al., 2019.
- https://cdn.elifesciences.org/articles/82490/elife-82490-fig2-data1-v2.xlsx
-
Figure 2—source data 2
Data tables extracted from Figure 3.B of Neurohr et al., 2019.
- https://cdn.elifesciences.org/articles/82490/elife-82490-fig2-data2-v2.xlsx
-
Figure 2—source data 3
Data tables extracted from Figure 3.C,D and S5C of Neurohr et al., 2019.
- https://cdn.elifesciences.org/articles/82490/elife-82490-fig2-data3-v2.xlsx
-
Figure 2—source data 4
Data tables adapted from Figure 3.H of Neurohr et al., 2019.
- https://cdn.elifesciences.org/articles/82490/elife-82490-fig2-data4-v2.xlsx
Figure 3
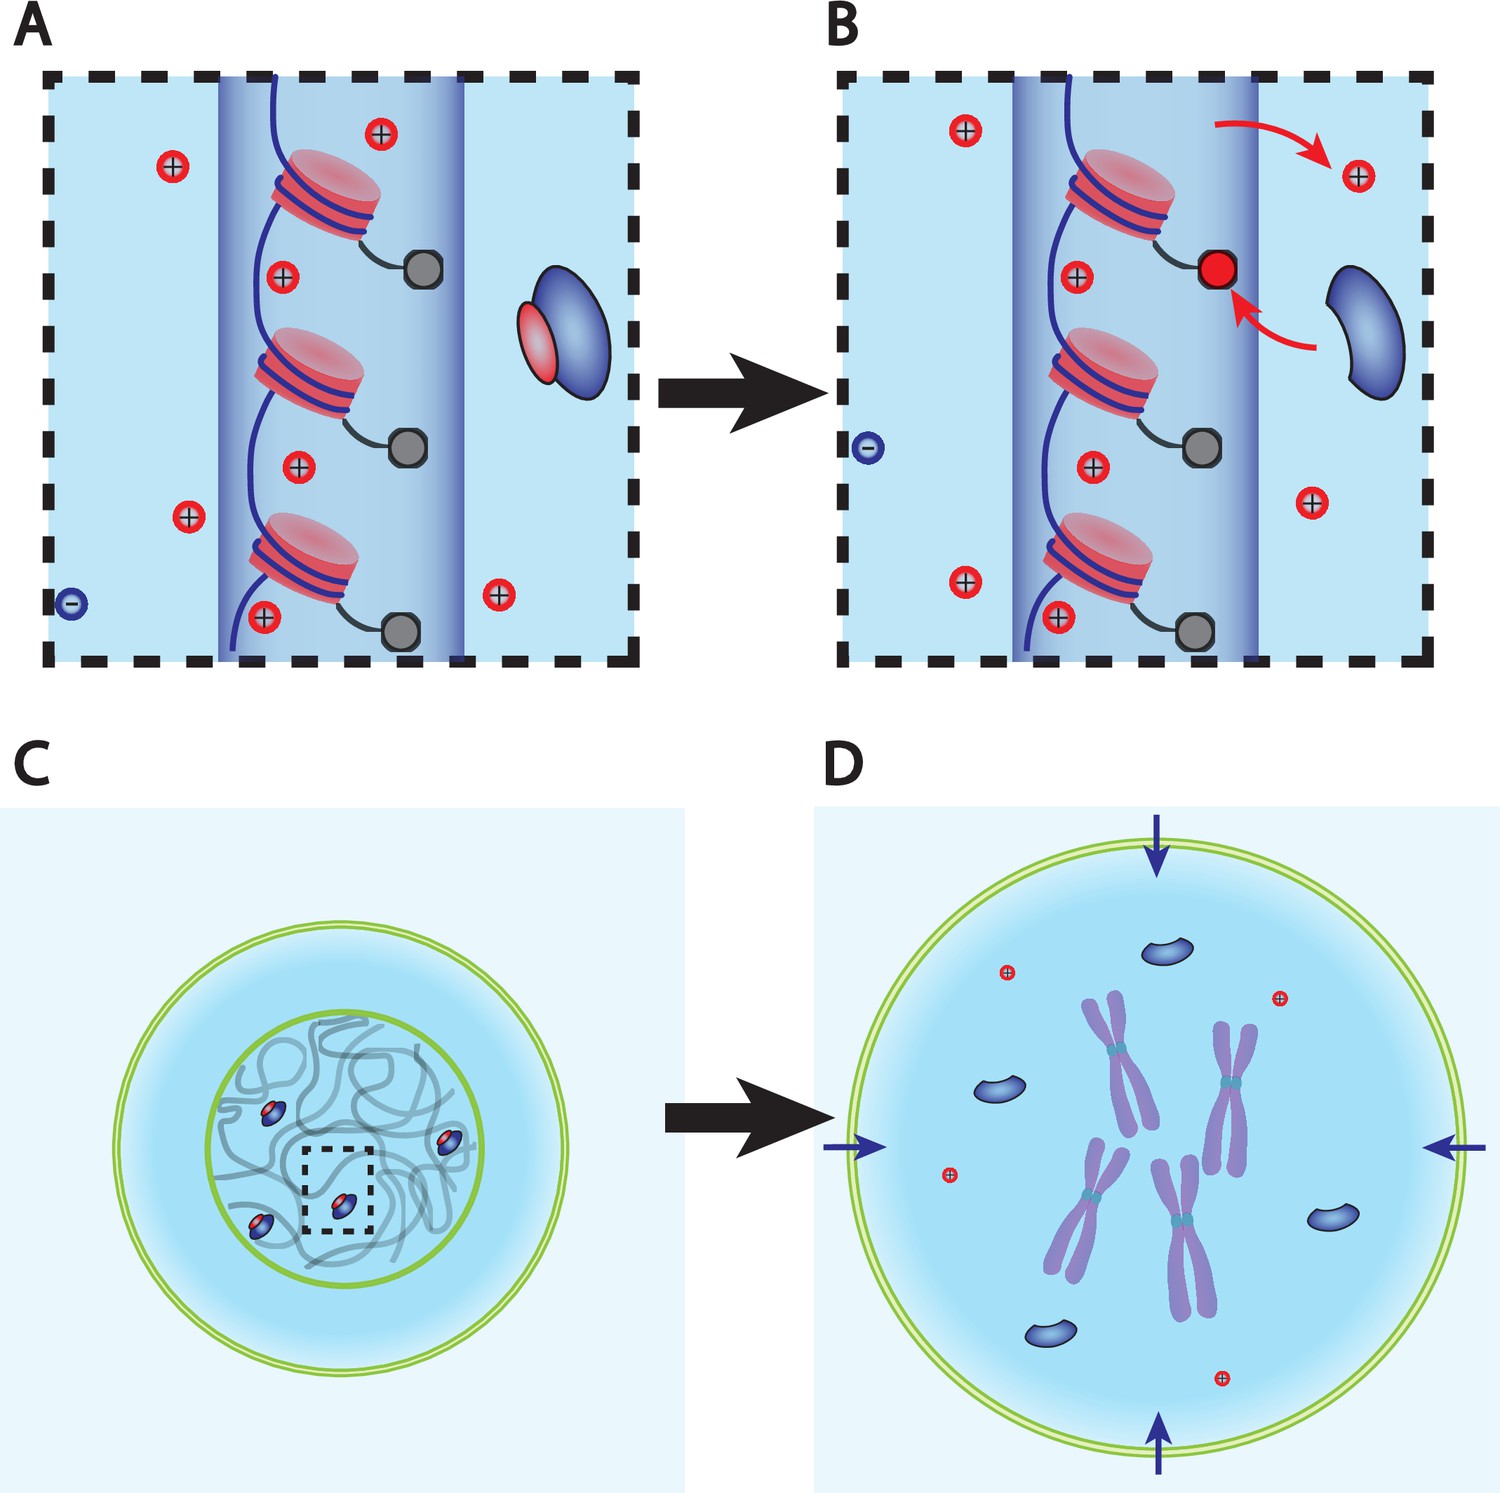
Dry mass dilution at mitosis is explained with the Pump-Leak model by the decondensation of chromatin counterions following histone tail modifications.
(A, B) Microscopic working model. An enzyme gives its positive charge to a histone, resulting in the release of a condensed counterions. Ions depicted within the chromatin (dark blue cylinder) are condensed and those outside are freely diffusing and participate in the nuclear osmotic pressure. (C, D) The subsequent increase in the number of osmolytes lead to a water influx in order to sustain osmotic balance at the plasma membrane of mammalian cells. For readability, other osmolytes are not displayed.
Figure 4
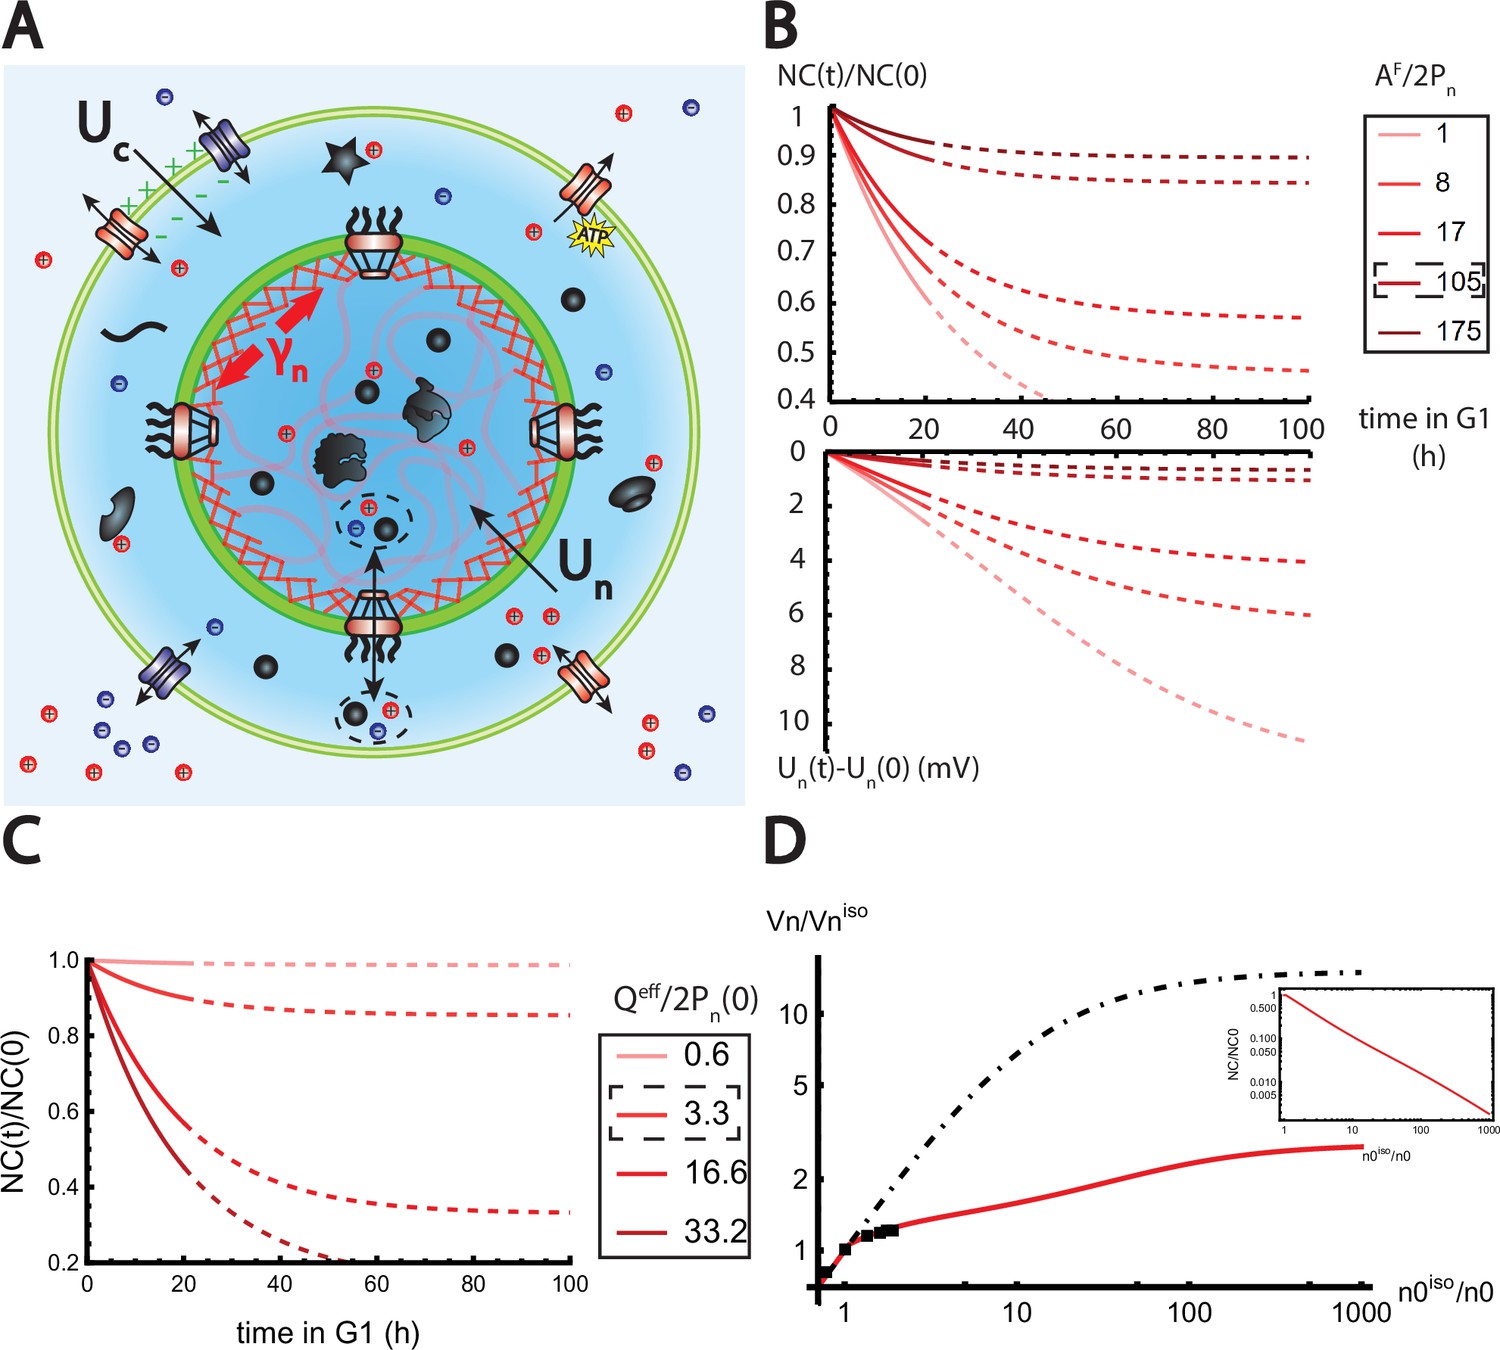
The nested Pump-Leak model explains nuclear scaling.
(A) Schematic of the nested Pump-Leak model. Species in black are impermeant molecules (X) and are now partitioned between the cytoplasm and the nucleus. Among those, only metabolites (black circles) can cross the nuclear envelope. The nuclear envelope is composed of the membrane (green) and the lamina (red) can be stretched when the nuclear folds are flattened. (B, C) Simulations of the nested Pump-Leak model (Equation A.55) during growth when the osmotic pressure is balanced at the nuclear envelope. The growth rate was adjusted to data in Zlotek-Zlotkiewicz et al., 2015 (B) Though permeable to the nuclear envelope, metabolites play a role in the homeostasis of the nuclear-to-cytoplasmic (NC) ratio by diluting chromatin (free) counterions which do not scale during growth (top plot). Higher variations of the NC ratio correlate with higher variations of the nuclear envelope potential (bottom plot). (C) Variations of the NC ratio during growth for different chromatin charges. (D) Normalized nuclear volume after a hypo-osmotic shock. Nuclear volume saturates because of the tension at the nuclear envelope, leading to the decrease in the NC ratio (inset: log–log plot). The dash-dotted line represents the nuclear volume if the number of osmolytes in the nucleus were assumed constant throughout the shock. Thus, showing that metabolites leave the nucleus during the shock which strongly decreases nucleus swelling. The value at the saturations are given by Equation 19. The square black dots are data extracted from Figure 3 from Finan et al., 2009. We used and folds to fit the data. The envelope stretching modulus used is twice the measured value in Dahl et al., 2004. The rationale is threefold. (1) Nuclei used in Finan et al., 2009 are chondrocyte nuclei originating from articular cartilage. They possess a high lamina A to lamina B ratio and are thus likely to be stiffer (Swift et al., 2013). (2) We could lower the value of the fitted by increasing the pumping efficiency . A more detailed characterization of the Pump-Leak model parameters for chondrocytes would be required to precisely infer the elastic properties of the nuclear envelope. (3) Considering the chromatin mechanical contribution would increase by a factor ; with the elastic modulus of the chromatin and the radius of the nucleus. Additional results of the nested Pump-Leak model are plotted in Appendix 1—figure 1. The online version of this article includes the following source data for Figure 1: Figure 4—source data 1. Data table extracted from Finan et al., 2009.
-
Figure 4—source data 1
Data table exctracted from Figure 3 of Finan et al., 2009.
- https://cdn.elifesciences.org/articles/82490/elife-82490-fig4-data1-v2.xlsx
Appendix 1—figure 1
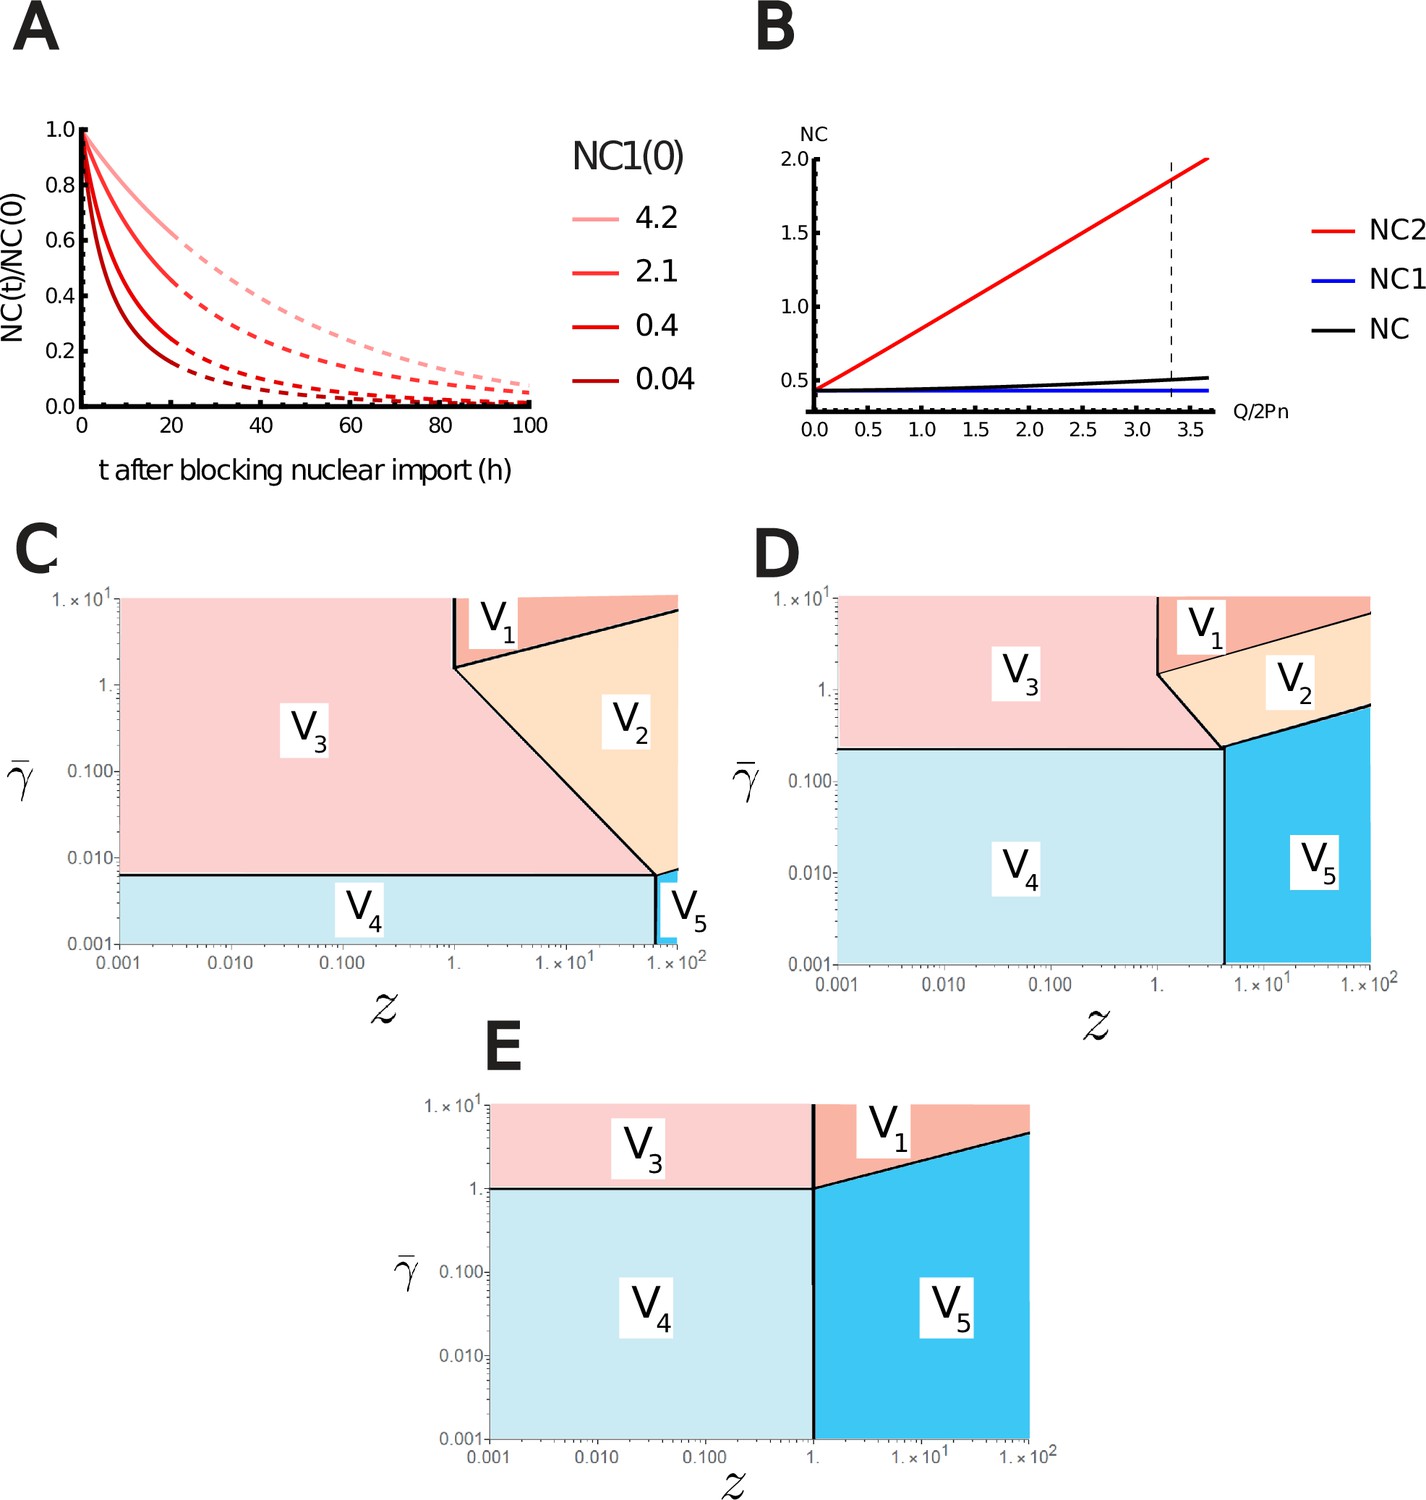
Additional results of the nested Pump-Leak model.
(A) Variation of the nuclear-to-cytoplasmic (NC) ratio during growth after blocking nuclear import. (B) Variations of the NC ratio according to the effective charge of the chromatin normalized by the number of trapped proteins in the nucleus . The NC ratio is bounded by two limit regimes. NC1, if the number of metabolites is assumed infinite. NC2, if there are no metabolites. The vertical black dashed line depicts the value of estimated in Appendix 1, section 3.1 for diploid mammalian cells. (C–E) log–log plot of the different regimes of V Equation A.72 in the plan (, ) for fixed (C) , (D) , and (E) . The crossover lines plotted are given in Equation A.73.
Tables
Table 1
Estimation of the coarse-grained Pump-Leak model parameters for a typical Mammalian cell.
| Symbol | Typical value | Meaning |
|---|---|---|
| 160 mmol | Cation concentration (Milo and Phillips, 2015) | |
| 20 mmol | Anion concentration (Milo and Phillips, 2015) | |
| 150 mmol | External cationic/anionic concentrations (Milo and Phillips, 2015) | |
| 10–100 Pa | Difference of hydrostatic pressure through the plasma membrane (Smeets et al., 2019; Pegoraro et al., 2017) | |
| 30% | Volume fraction occupied by the dry mass (Venkova et al., 2022; Alberts et al., 2002) | |
| 0.14 | Dimensionless parameter comparing pumping and passive leaking of cations (Equation 3) | |
| –52 mV | Cytoplasmic membrane potential (Equation A.8) | |
| 7.2 · 105Pa | External osmotic pressure | |
| 7.2 · 105Pa | Cellular Van’t Hoff osmotic pressure (Equation 2) | |
| 120 mmol | Cellular concentrations of species other than ions (Equation 2) | |
| –1.2 | Average charge of species other than ions (Equation 1) |
Appendix 1—table 1
Description and values of the parameters used for the order of magnitudes.
| Symbol | Typical Value | Meaning |
|---|---|---|
| Typical dry mass density in a mammalian cell (Zlotek-Zlotkiewicz et al., 2015) | ||
| Average mass of an amino acid (Milo and Phillips, 2015) | ||
| Average length of a eukaryotic protein (Milo and Phillips, 2015) | ||
| Average length of an mRNA (Milo and Phillips, 2015) | ||
| Average length of one base pair | ||
| Average number of negative charges per base pair | ||
| Average length of DNA per nucleosome | ||
| Length of the DNA linking two histones | ||
| Length of the DNA wrapped around one histone | ||
| Manning parameter for pure DNA, i.e., 75% of the charges will be screened by manning condensation | ||
| Total length of the DNA within a diploid human cell | ||
| Average number of positive charges per histone at less than 1 nm from the wrapped DNA backbone (Materese et al., 2009) | ||
| Average number of condensed counterions around the wrapped DNA (Materese et al., 2009) | ||
| Bjerrum length in water at 300k | ||
| Stretching modulus of lamina (Dahl et al., 2004) |
Additional files
Download links
A two-part list of links to download the article, or parts of the article, in various formats.
Downloads (link to download the article as PDF)
Open citations (links to open the citations from this article in various online reference manager services)
Cite this article (links to download the citations from this article in formats compatible with various reference manager tools)
Physical basis of the cell size scaling laws
eLife 12:e82490.
https://doi.org/10.7554/eLife.82490


