Coordinated evolution at amino acid sites of SARS-CoV-2 spike
- HSE University, Russian Federation
- Central Research Institute for Epidemiology, Russian Federation
- Moscow Institute of Physics and Technology (National Research University), Russian Federation
- Institute for Information Transmission Problems (Kharkevich Institute) of the Russian Academy of Sciences, Russian Federation
- Lomonosov Moscow State University, Russian Federation
- Skolkovo Institute of Science and Technology, Russian Federation
Figures
Figure 1
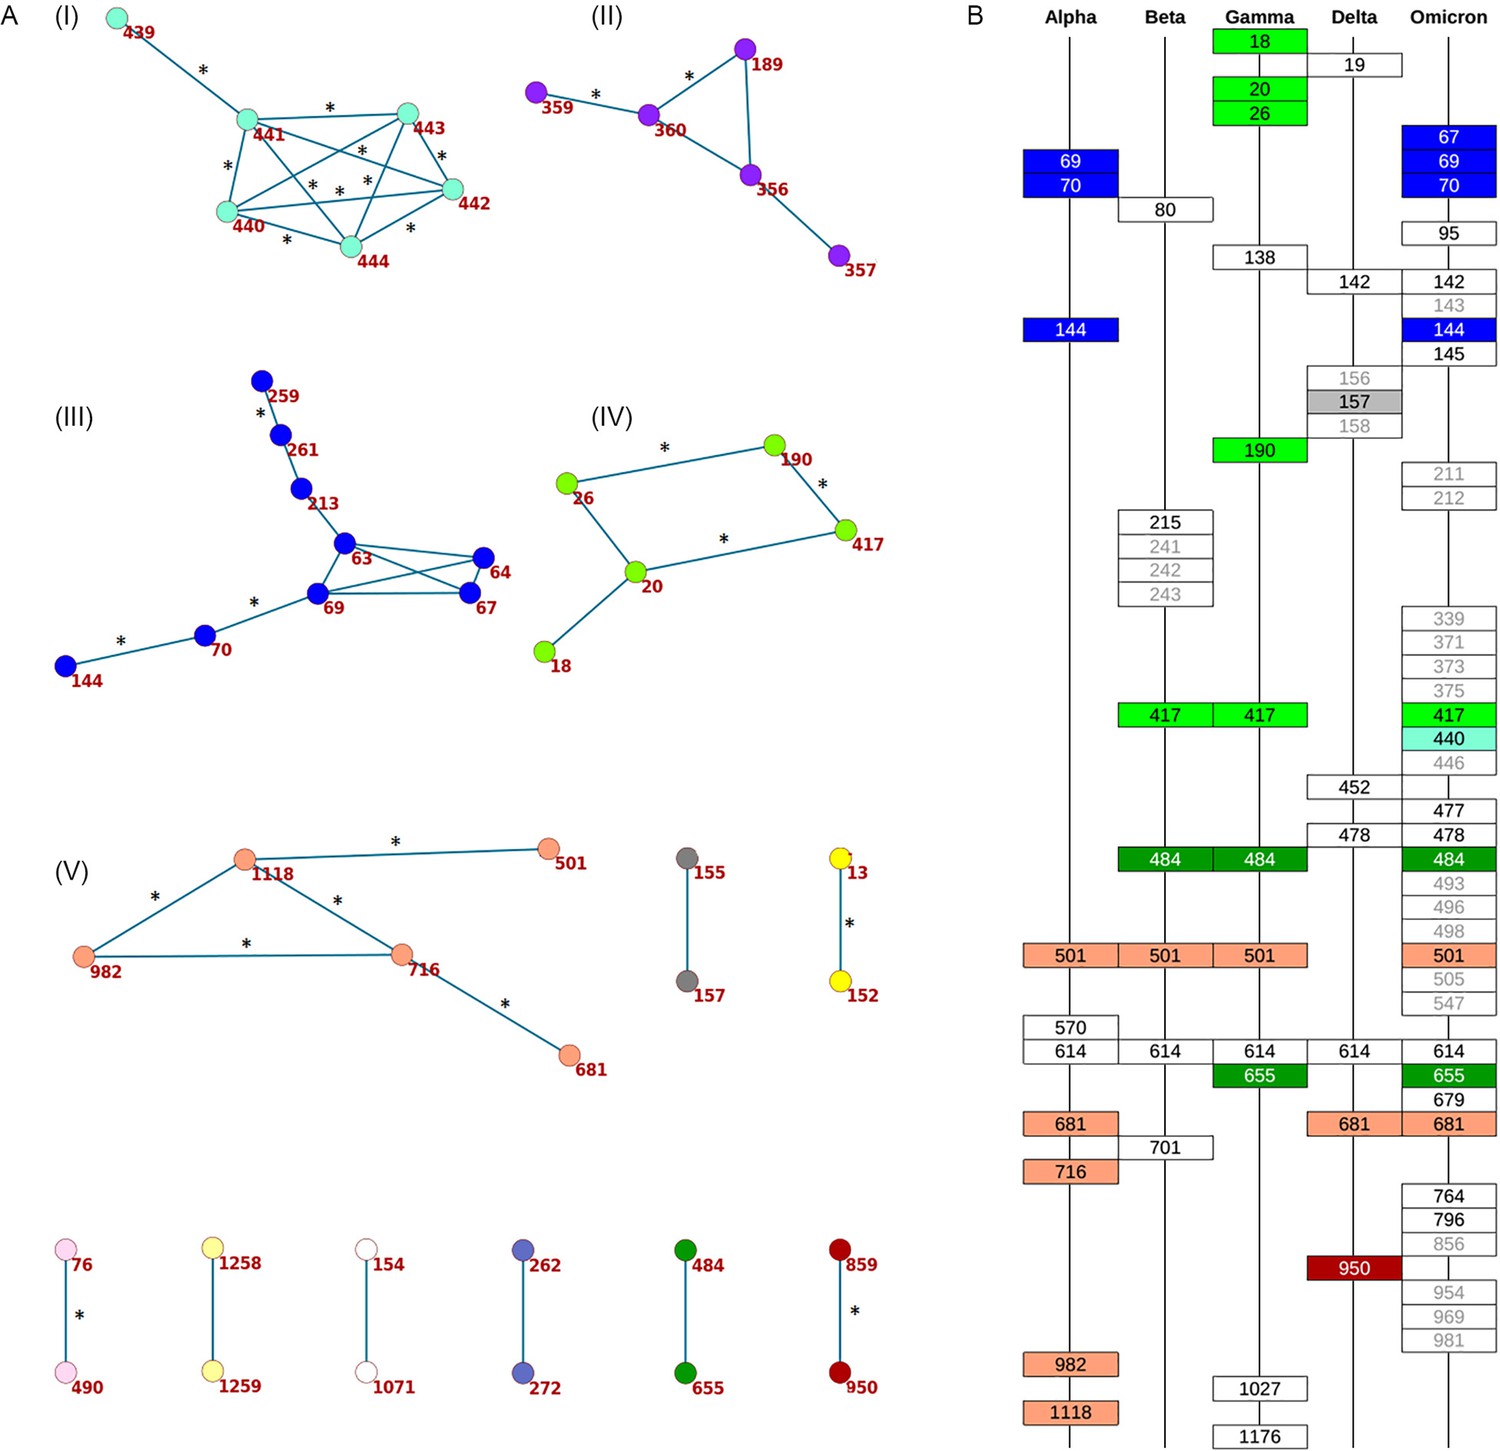
Concordantly evolving sites in SARS-CoV-2 Spike protein.
(A) Clusters of concordantly evolving sites. Graph vertices represent sites, and edges represent concordantly evolving pairs (Appendix 1—table 7). The graph consists of 13 connected components, 8 of which contain just a single edge. Site pairs that were among the set of the best scoring pairs predicted for the alternative UShER (Turakhia et al., 2021) topology (FDR <10%, Table 1) are marked by asterisks. (B) Concordantly evolving sites among the lineage-defining sites of Alpha, Beta, Gamma, Delta (B.1.617.2+AY.*) and Omicron (BA.1) VOCs (Hodcroft, 2021). Concordantly evolving sites are colored in accordance with the clusters in panel A. Sites with fewer than 2 mutations which were not included in the analysis are in gray.
Figure 2
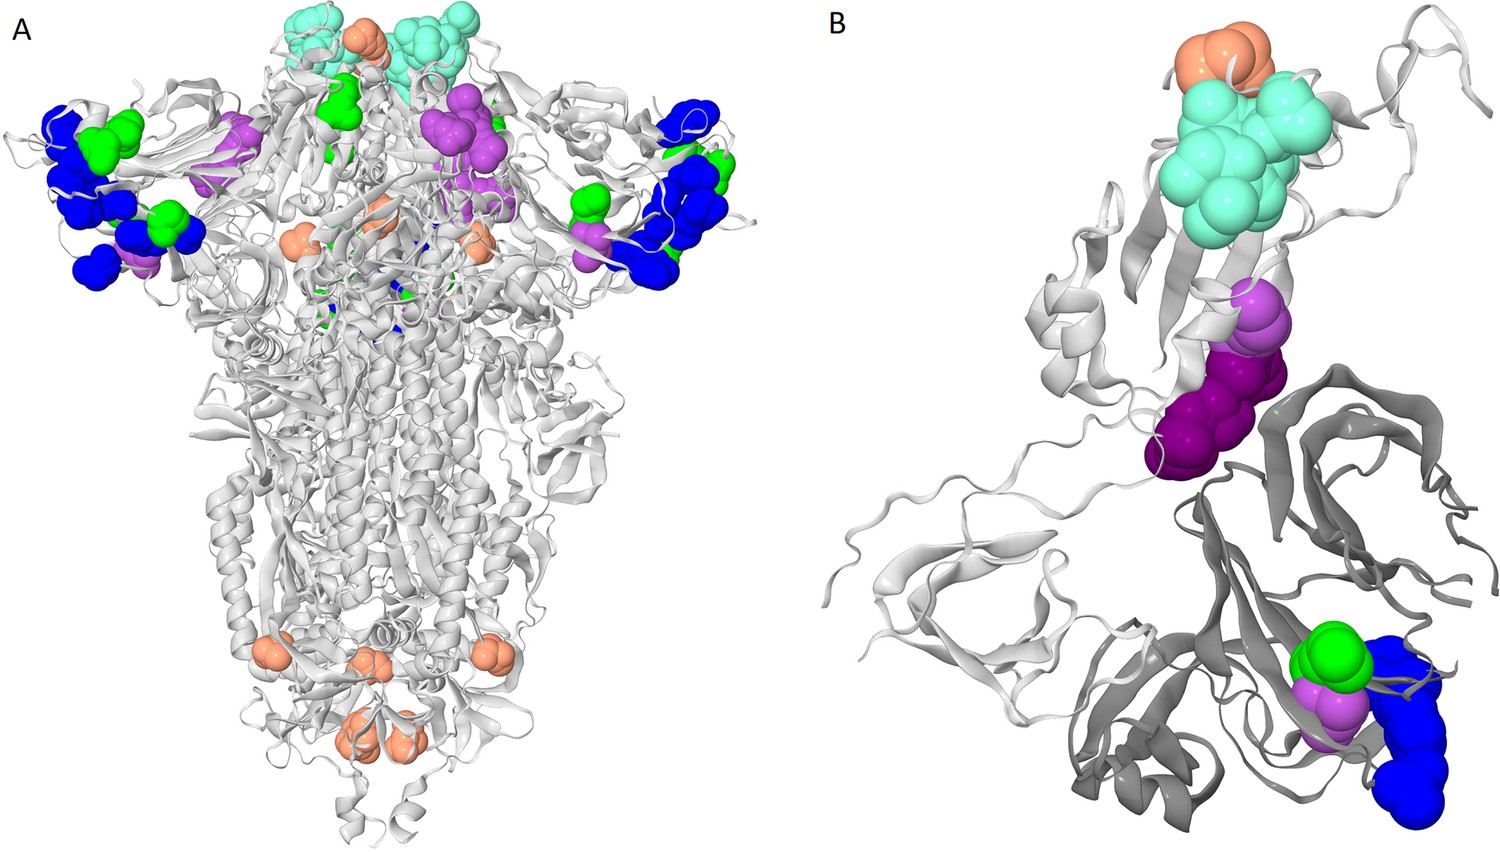
Clusters of coevolving sites on the protein structure.
Sites of the five clusters that comprise multiple coevolving pairs of sites are shown as spheres, with color coding matching Figure 1A. (A) Closed conformation of the S-protein trimer (pdb: 7JJJ). (B) Open conformation of the S-protein trimer (pdb: 7KL9): for clarity, only residues 320–590 of one subunit and NTD 14–303 of the adjacent subunit are shown. NTD is shown in dark gray; residues 357, 359 and 360 are shown in dark purple.
Figure 3 with 1 supplement
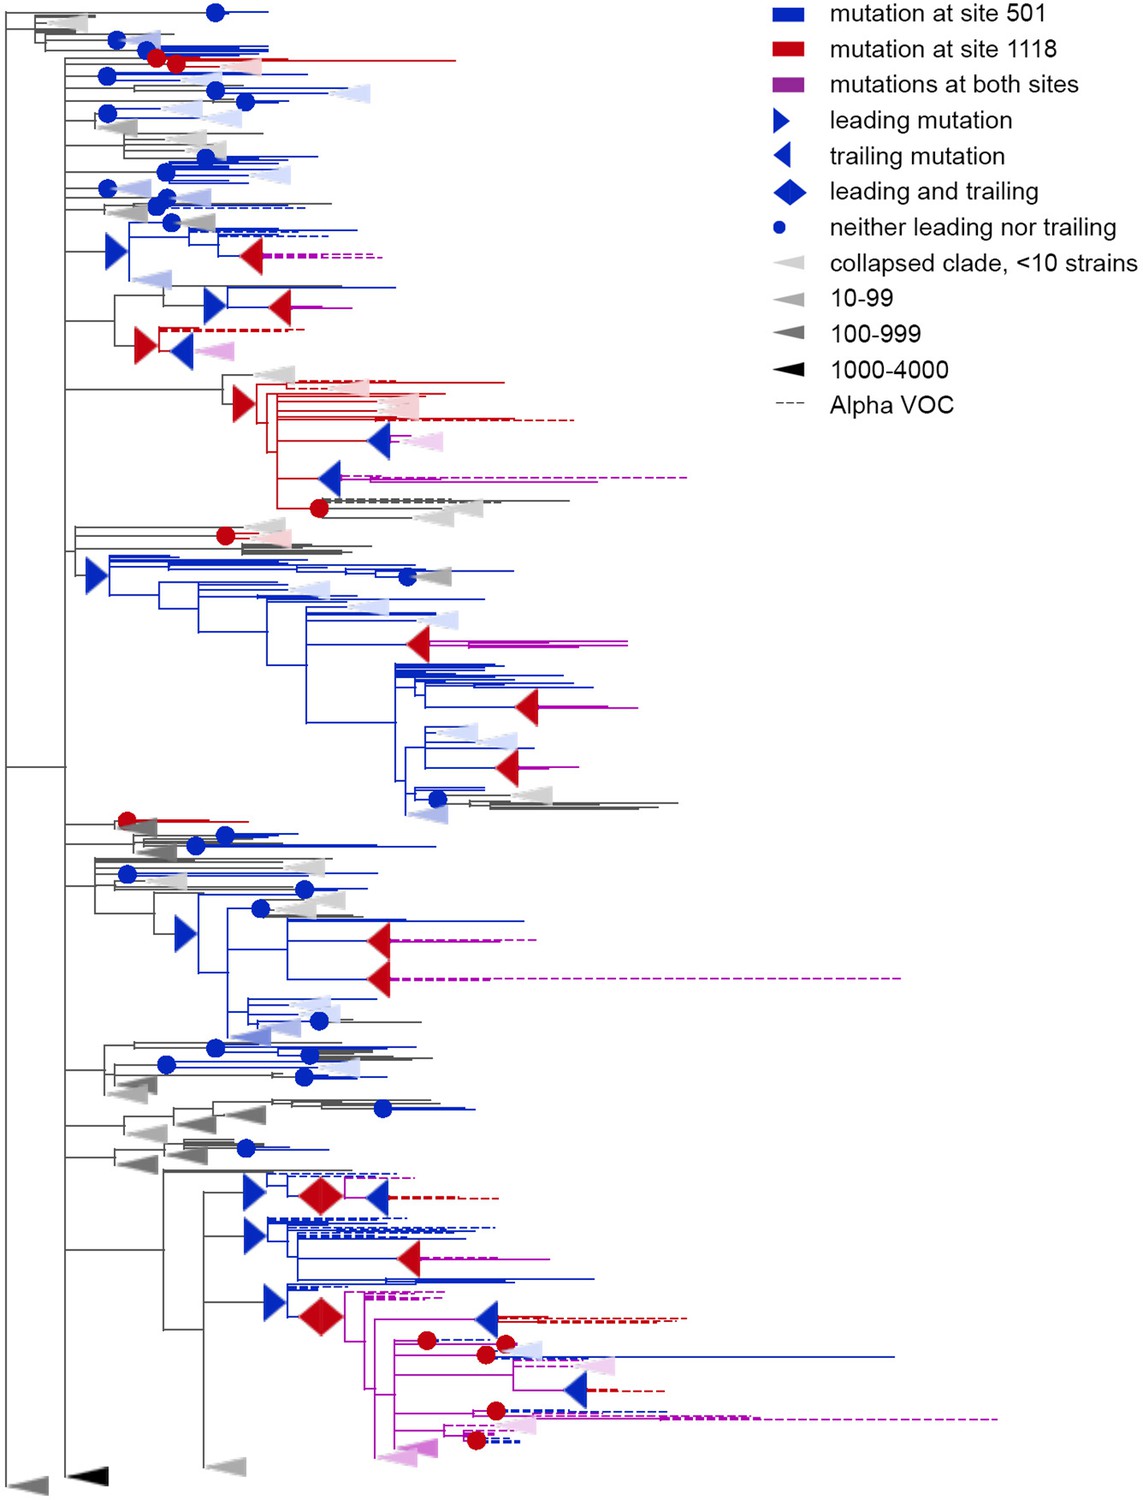
Concordantly evolving pair of sites 501 and 1118.
Leading and trailing mutations are represented by blue (site 501) or red (site 1118) right-pointing and left-pointing triangles respectively; diamond-shaped signs indicate mutations that are both leading and trailing. All other mutations on internal branches, which are neither preceded nor followed by mutations at the other site on internal branches, are represented by circles. Mutations on terminal branches are excluded from the analysis and not shown (all mutations at these sites are shown on Figure 3—figure supplement 1). Branches carrying wild-type alleles (501 N and 1118D) are shown in black; those carrying substitutions at site 501, in blue; at site 1118, in red; at both sites, in violet. Here, leading and trailing mutations at site 501 are either N>Y or its reversion Y>N; and leading and trailing mutations at site 1118 are D>H or H>D. The dashed branches correspond to the Alpha VOC according to GISAID annotation as of 07.09.2021. For clarity of presentation, some of the clades without mutations at these two sites are collapsed and represented by elongate triangles, with intensity of color indicating the number of strains in the clade.
Figure 3—figure supplement 1
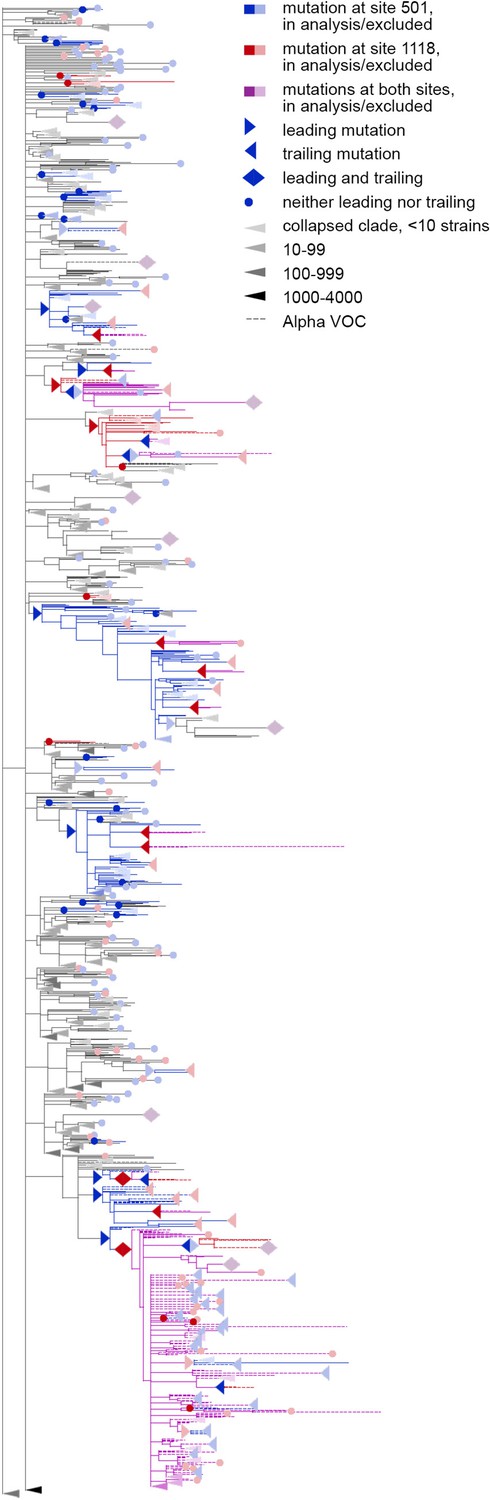
Concordantly evolving pair of sites 501 and 1118.
Here, mutations on terminal branches, which are excluded from the analysis, are shown in light blue, red or violet; mutations on internal branches that are followed by mutations on terminal branches, are represented by light blue, red or violet right-pointing triangles.
Figure 4
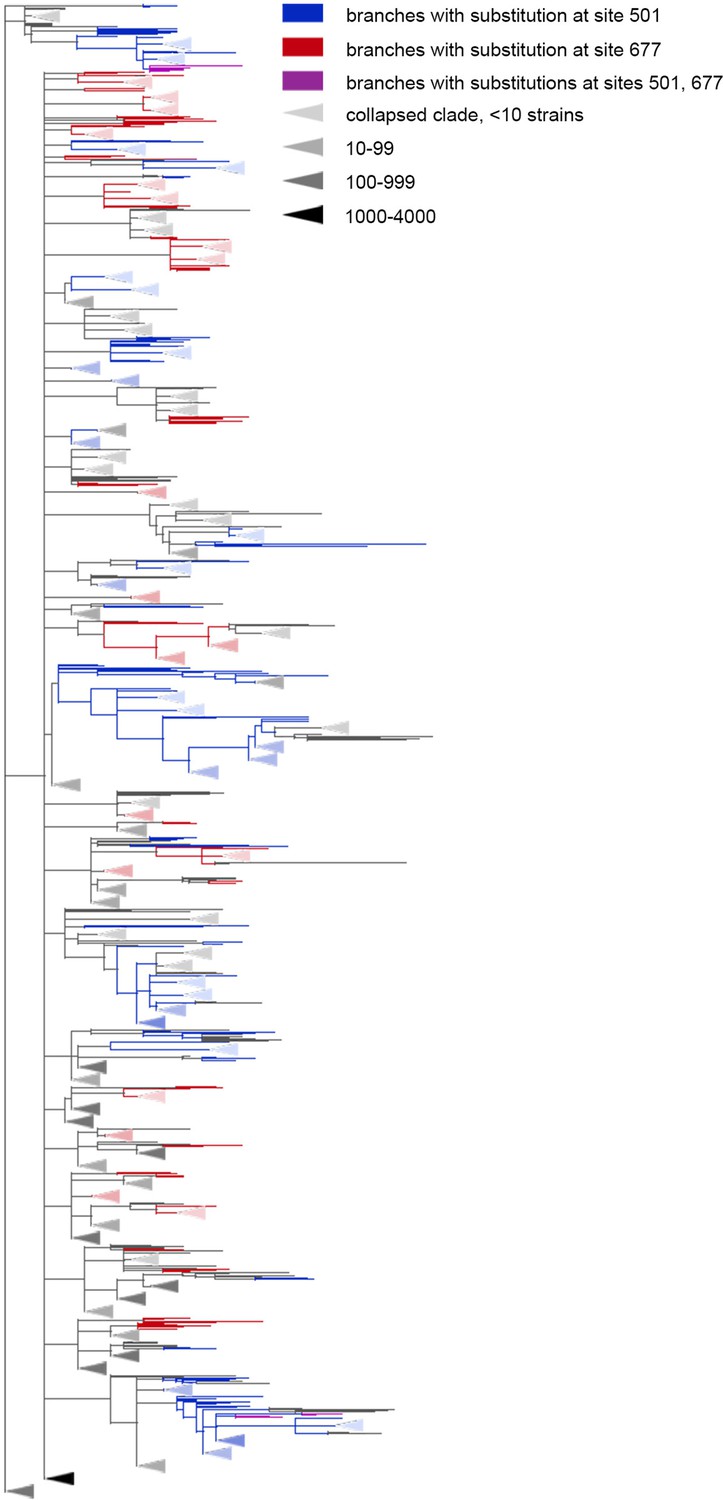
The Q677H is depleted on the background of N501Y.
Branches carrying substitutions at site 501 are shown in blue; at site 677, in red; at both sites, in violet. There is less violet color than expected. Some clades without mutations at either site were truncated and are represented by elongate triangles, with color intensity indicating the number of strains in the clade.
Figure 5 with 1 supplement
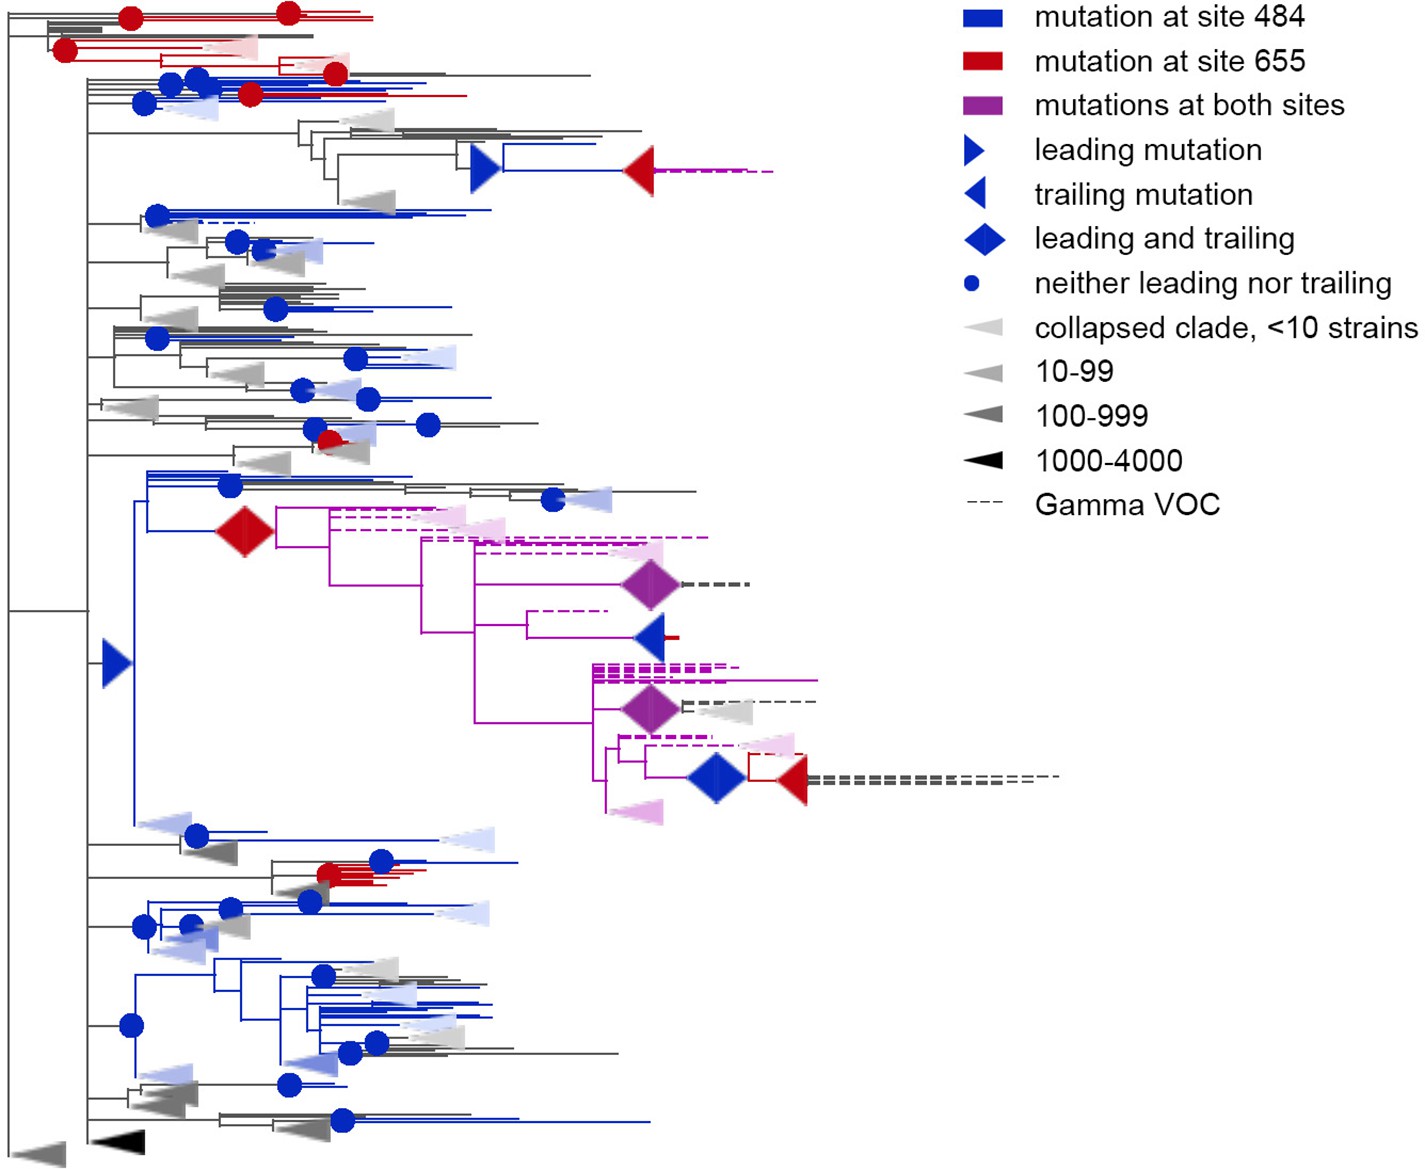
Coevolution of S-protein sites 484 and 655.
Leading and trailing mutations are represented by blue (site 484), red (site 655) or violet (mutations at both sites on the same branch) right-pointing and left-pointing triangles respectively; diamond-shaped signs indicate mutations that are both leading and trailing, and violet signs indicate that both sites mutated on a single branch. All other mutations on internal branches, which are neither preceded nor followed by mutations at the other site on internal branches, are represented by circles. Mutations on terminal branches are excluded from the analysis and not shown (all mutations at these sites are shown on Figure 5—figure supplement 1). Branches carrying wild-type alleles (484E and 655 H) are shown in black; carrying substitutions at site 484, in blue; at site 655, in red; at both sites, in violet. Here, leading and trailing mutations at site 484 are either E>K or its reversions K>E; leading and trailing mutations at site 655 are H>Y or Y>H. The dashed branches correspond to the sequences of Gamma VOC according to GISAID annotation as of 07.09.2021. For clarity of presentation, some of the clades without mutations in these two sites are represented by elongate triangles, with color intensity indicating the number of strains in the clade.
Figure 5—figure supplement 1
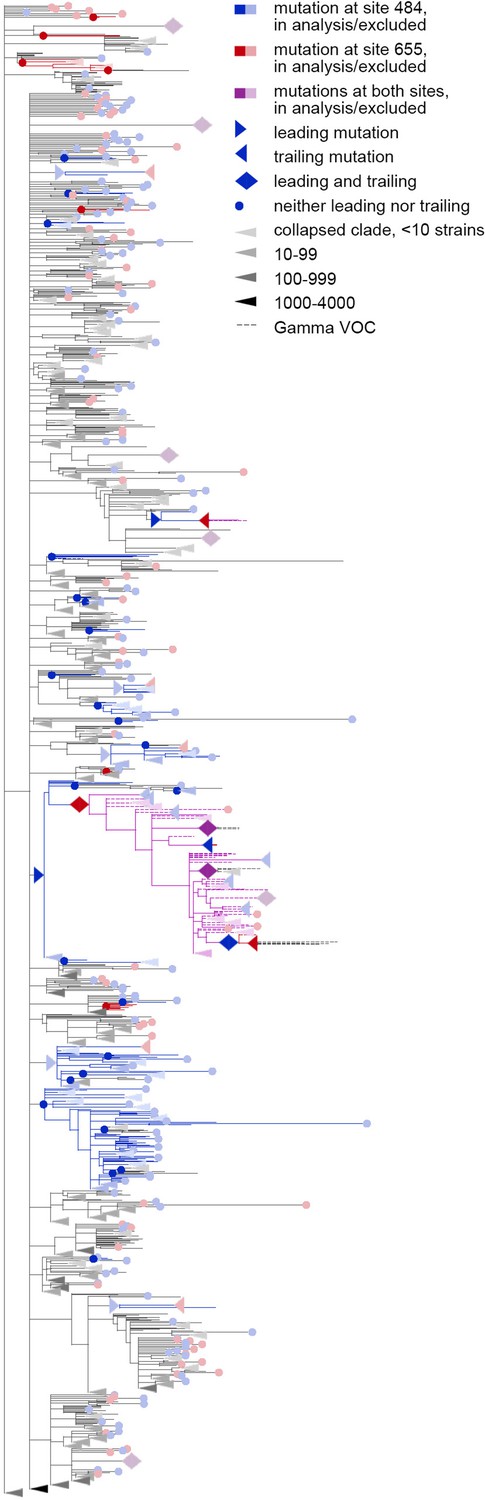
Concordantly evolving pair of sites 484 and 655.
Here, mutations on terminal branches, which are excluded from the analysis, are shown in light blue, red or violet; mutations on internal branches that are followed by mutations on terminal branches, are represented by light blue, red or violet right-pointing triangles.
Appendix 1—figure 1
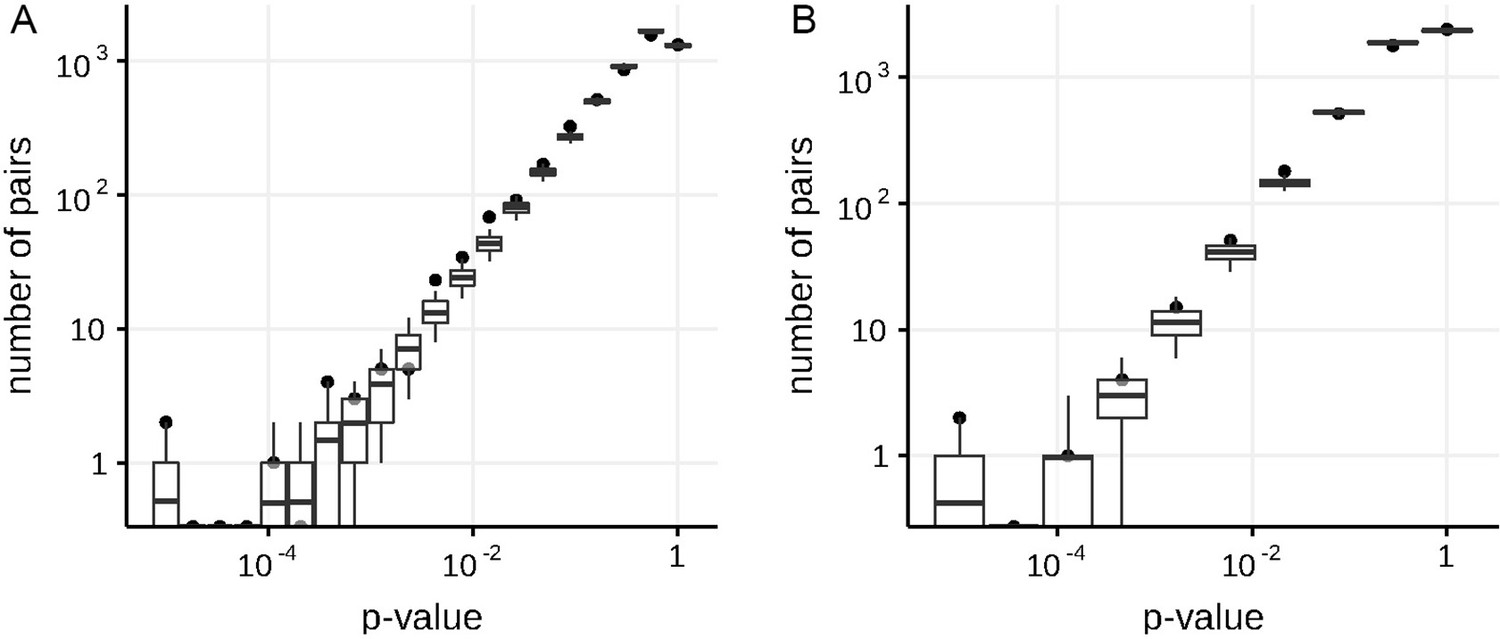
Numbers of predicted concordantly (A) and discordantly (B) evolving pairs for different nominal p-values in the simulated data in non-epistatic mode of evolution, compared to the null distribution for the ML phylogeny reconstructed by IQ-TREE.
Black dots indicate numbers of site pairs having corresponded p-values in the simulated data, boxes with whiskers indicate distributions of numbers of site pairs having corresponded p-values among 400 samples from the null model (see Methods). Top and bottom of each box correspond to the 75th and 25th percentile, whiskers correspond to the 95th and 5th percentile. Vertical line corresponds to the 10% FDR threshold.
Appendix 1—figure 2
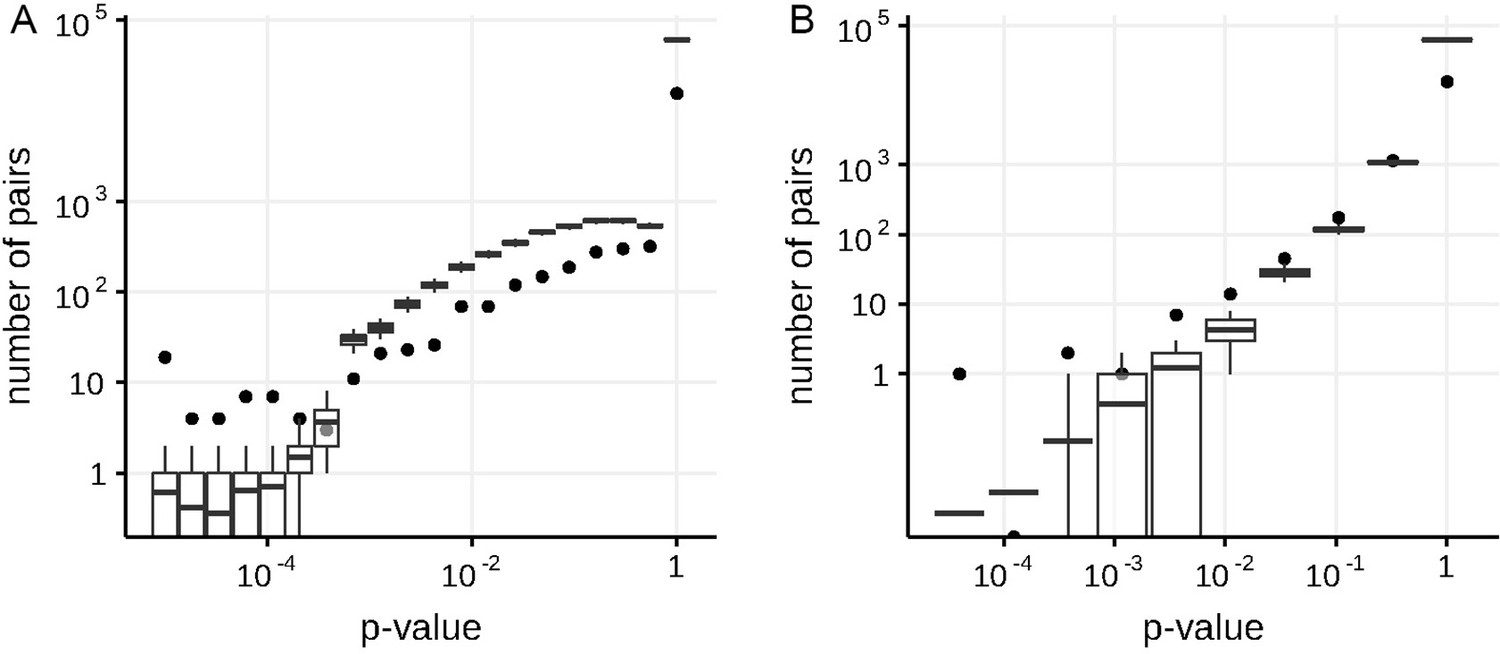
Numbers of predicted concordantly (A) and discordantly (B) evolving pairs for different nominal p-values in the S-gene of SARS-Cov-2, compared to the null distribution for the ML phylogeny reconstructed by IQ-TREE.
See legend for the Appendix 1—figure 1.
Author response image 1

Site pairs detected as concordantly (I) or discordantly (II) evolving for FDR 30%, blue – site from a true concordantly evolving pair, red – site from a true discordantly evolving site pair, yellow – neutral; thick lines indicate true epistatic pairs.
Author response image 2
Phylogenetic clades annotated as VOCs according to the GISAID metadata as of 07.
09.2021 (I), and to the newer PANGOLIN 4.1.3, used in the default mode (II). Α is shown in red color, Β in blue, Γ in green, and Δ in orange. There are more red (α) branches outside the main α clade in (I) than in (II).
Tables
Table 1
Concordantly evolving sites of the SARS-CoV-2 S-protein with FDR less than 10% for both reconstructed phylogenies (see Text).
The following characteristics are shown: coordinates on the S-protein sequence, nominal p-values, the value of the epistatic statistics, the total number of consecutive mutation pairs for the two corresponding ordered site pairs, numbers of mutations in consecutive pairs at sites 1 and 2, total numbers of mutations at sites 1 and 2, and the distance in the protein structure (PDB ID: 7JJJ). Pairs of sites where non-consecutive mutations are further from each other than expected (suggesting both epistatic and episodic selection; p-value <0.05 after adjustment) are indicated in bold; pairs of sites where they are closer to each other than expected (suggesting episodic rather than epistatic selection) are indicated in italic (see Appendix 1—tables 10 and 12). Physical distance could not be calculated for site pairs (13,152) and (681,716) because sites 13 and 681 were absent in 7JJJ.
| site 1 | site 2 | cluster | p-value | epistatic statistics | #consec.pairs of mutations | #mutations in consec. pairs at site 1 | #mutations in consec. pairs at site 2 | #mutations at site 1 | #mutations at site2 | physical distance, Å |
|---|---|---|---|---|---|---|---|---|---|---|
| 13 | 152 | <2e-5 | 2.864 | 5 | 5 | 4 | 5 | 16 | - | |
| 20 | 417 | 4 | 2.2e-4 | 1.348 | 4 | 3 | 2 | 8 | 7 | 47.83 |
| 26 | 190 | 4 | 1.8e-4 | 1.029 | 4 | 4 | 3 | 12 | 3 | 18.4 |
| 63 | 213 | 3 | 4e-5 | 0.681 | 1 | 1 | 1 | 2 | 3 | 13.51 |
| 69 | 70 | 3 | <2e-5 | 1.125 | 2 | 2 | 2 | 5 | 4 | 1.3 |
| 70 | 144 | 3 | <2e-5 | 1.301 | 3 | 3 | 3 | 4 | 5 | 14.03 |
| 76 | 490 | 2.6e-4 | 0.22 | 1 | 1 | 1 | 3 | 3 | 45.18 | |
| 189 | 360 | 2 | 1.6e-4 | 0.544 | 2 | 1 | 2 | 3 | 3 | 29.89 |
| 190 | 417 | 4 | 0.0001 | 1.272 | 3 | 2 | 2 | 3 | 7 | 39.93 |
| 259 | 261 | 3 | <2e-5 | 1.35 | 1.5 | 2 | 1 | 4 | 2 | 3.81 |
| 356 | 360 | 2 | <2e-5 | 1.283 | 2.5 | 2 | 3 | 2 | 3 | 10.12 |
| 359 | 360 | 2 | <2e-5 | 0.976 | 1.5 | 1 | 2 | 2 | 3 | 1.34 |
| 439 | 441 | 1 | <2e-5 | 2.097 | 4 | 3 | 4 | 9 | 8 | 3.5 |
| 440 | 441 | 1 | 1.4e-4 | 1.505 | 3 | 3 | 3 | 12 | 8 | 1.33 |
| 440 | 442 | 1 | <2e-5 | 2.476 | 3 | 2 | 3 | 12 | 6 | 3.92 |
| 440 | 444 | 1 | <2e-5 | 2.515 | 3.5 | 2 | 5 | 12 | 7 | 5.6 |
| 441 | 442 | 1 | <2e-5 | 2.244 | 4 | 4 | 4 | 8 | 6 | 1.33 |
| 441 | 443 | 1 | 2e-5 | 1.281 | 5 | 4 | 2 | 8 | 2 | 3.23 |
| 441 | 444 | 1 | <2e-5 | 3.492 | 5.5 | 4 | 4 | 8 | 7 | 2.6 |
| 442 | 443 | 1 | 6e-5 | 1.301 | 4 | 4 | 2 | 6 | 2 | 1.32 |
| 442 | 444 | 1 | <2e-5 | 3.013 | 6 | 4 | 4 | 6 | 7 | 4.05 |
| 443 | 444 | 1 | 8e-5 | 1.043 | 2 | 2 | 2 | 2 | 7 | 1.32 |
| 501 | 1118 | 5 | 1.4e-4 | 2.737 | 16 | 13 | 12 | 40 | 22 | 131.71 |
| 681 | 716 | 5 | <2e-5 | 3.905 | 16.5 | 12 | 16 | 59 | 21 | - |
| 716 | 982 | 5 | 2e-5 | 2.001 | 15 | 9 | 11 | 21 | 15 | 81.66 |
| 716 | 1118 | 5 | 4e-5 | 2.382 | 13 | 8 | 12 | 21 | 22 | 22.29 |
| 859 | 950 | <2e-5 | 2.219 | 5.5 | 4 | 5 | 11 | 9 | 15.17 | |
| 982 | 1118 | 5 | 1.4e-4 | 1.637 | 15 | 11 | 8 | 15 | 22 | 94.63 |
Table 2
Discordantly evolving sites of the SARS-CoV-2 S-protein.
The following characteristics are shown: coordinates on the S-protein sequence, nominal p-values, the value of the epistatic statistic, the total number of consecutive mutation pairs for the two corresponding ordered site pairs, numbers of mutations in consecutive pairs at site 1 and site 2, total numbers of mutations at site 1 and site 2, FDR value corresponding to the p-value of the site pair obtained for the alternative phylogeny reconstructed by UShER (Turakhia et al., 2021), and the distance in the protein structure (PDB ID: 7JJJ). Pairs of sites where non-consecutive mutations are closer to each other than expected (suggesting both epistatic and episodic selection; p-value <0.05 after adjustment) are in bold; those where they are further from each other than expected (suggesting episodic rather than epistatic selection) are in italic (see Appendix 1—tables 11 and 13).
| site 1 | site 2 | p-value | epistat. | #consec. pairs of mutations | #mut. in consec. pairs in site1 | #mut. in consec. pairs in site2 | #mut. in site1 | #mut. in site2 | FDRUShER tree | physical distance,Å |
|---|---|---|---|---|---|---|---|---|---|---|
| 69 | 614 | 3e-3 | 0.07 | 5 | 1 | 5 | 5 | 14 | 0.231 | 46.75 |
| 222 | 501 | 3.1e-3 | 0.01 | 1 | 1 | 1 | 11 | 40 | 0.058 | 55.44 |
| 440 | 681 | 3.1e-3 | 0.01 | 1 | 1 | 1 | 12 | 59 | 0.055 | - |
| 501 | 675 | 1.2e-3 | 0.02 | 1 | 1 | 1 | 40 | 24 | 0.06 | 84.98 |
| 501 | 677 | 4.8e-4 | 0.05 | 3 | 2 | 3 | 40 | 39 | 0 | 88.20 |
| 570 | 614 | 2.4e-3 | 0.16 | 7 | 1 | 7 | 16 | 14 | 0.895 | 19.30 |
| 614 | 653 | 4e-5 | 0.03 | 4 | 1 | 4 | 14 | 5 | 0.025 | 15.47 |
| 614 | 982 | 3.2e-4 | 0.12 | 7 | 1 | 7 | 14 | 15 | 0.891 | 27.87 |
| 681 | 1176 | 3.9e-3 | 0.01 | 1 | 1 | 1 | 59 | 11 | 0.385 | - |
Appendix 1—table 1
Levels of spurious signal of concordant evolution, inferred in the simulated dataset with no epistasis by four variants of the method.
Number of pairs, detected under p-value threshold 10-4, and estimated FDR for this threshold are shown.
| Model | #FP | min p-value | Maximal FDR threshold for#FP = 0 | |
|---|---|---|---|---|
| consider alleles | shuffle mutations in fgr. only | 2 | <1e-4 | 0,25 |
| shuffle mutations both in bgr. and fgr. | 3 | <1e-4 | 0,15 | |
| ignore alleles | shuffle mutations in fgr. only | 4 | <1e-4 | 0,11 |
| shuffle mutations both in bgr. and fgr. | 24 | <1e-4 | 0,02 | |
Appendix 1—table 2
Levels of spurious signal of discordant evolution, inferred in the simulated dataset with no epistasis by four variants of the method.
Number of pairs, detected under p-value threshold 10-4, and maximal threshold on estimated FDR that allows to avoid false discoveries are shown.
| Model | #FP | min p-value | Maximal FDR threshold for #FP = 0 | |
|---|---|---|---|---|
| consider alleles | shuffle mutations in fgr. only | 2 | <1e-4 | 0,2 |
| shuffle mutations both in bgr. and fgr. | 19 | <1e-4 | 0,026 | |
| ignore alleles | shuffle mutations in fgr. only | 4 | <1e-4 | 0,125 |
| shuffle mutations both in bgr. and fgr. | 16 | <1e-4 | 0,031 | |
Appendix 1—table 3
Numbers of truly and falsely predicted concordantly evolving pairs of sites for the simulated data with positively and negatively epistatically interacting sites.
The evolution of the population of genotypes with twenty independently evolving pairs of epistatically interacting sites was simulated by MimicrEE2. Ten pairs of sites were evolving under recurrent positive epistasis and other ten pairs were evolving under magnitude negative epistasis. The four different detection models were applied and for each model the number of true (#TP) and false (#FP) predictions are shown for estimated FDR≤10%.
| Model | #FP | #TP | |
|---|---|---|---|
| consider alleles | shuffle mutations in fgr. only | 5 | 10 |
| shuffle mutations both in bgr. and fgr. | 55 | 6 | |
| ignore alleles | shuffle mutations in fgr. only | 22 | 8 |
| shuffle mutations both in bgr. and fgr. | 250 | 7 | |
Appendix 1—table 4
Predicted concordantly evolving pairs of sites for the simulated data with positively and negatively epistatically interacting sites.
The characteristics of predicted site pairs for the estimated FDR≤10% are shown: positions of sites on the primary sequence of S-protein (site1 and site2), the upper p-values (p-value), values of the epistatic statistic (epistat), numbers of consecutive pairs of mutations (#consec. pairs of mutations), numbers of mutations in consecutive pairs of sites (#mut. in consec. pairs in site1 and site2), total numbers of mutations on the internal tree branches in sites (#mut. in site1 and site2), the expected value of epistatic statistics (exp. epistat) and the corresponding standard error (SE). The true predictions are highlighted in bold.
| site1 | site2 | p-value | epistat | #consec. pairs of mut. | #mut. in consec. pairs in site1 | #mut. in consec. pairs in site2 | #mut. in site1 | #mut. in site2 | exp. epistat | SE |
|---|---|---|---|---|---|---|---|---|---|---|
| 1 | 2 | <1e-4 | 12,36 | 66,5 | 52 | 65 | 2 | 96 | 3,97 | 0,87 |
| 3 | 4 | <1e-4 | 17,79 | 94 | 61 | 104 | 4 | 118 | 6,55 | 1,23 |
| 5 | 6 | <1e-4 | 13,87 | 54 | 48 | 54 | 6 | 105 | 3,27 | 0,83 |
| 5 | 43 | <1e-4 | 21,43 | 108,5 | 82 | 100 | 43 | 105 | 12,6 | 1,89 |
| 7 | 8 | <1e-4 | 11,36 | 50 | 42 | 50 | 8 | 109 | 3,22 | 0,78 |
| 9 | 10 | <1e-4 | 17,09 | 90 | 64 | 88 | 10 | 117 | 6,62 | 1,19 |
| 11 | 12 | <1e-4 | 13,46 | 53,5 | 48 | 51 | 12 | 108 | 2,54 | 0,69 |
| 13 | 14 | <1e-4 | 11,63 | 52,5 | 43 | 56 | 14 | 106 | 2,85 | 0,72 |
| 15 | 16 | <1e-4 | 11,84 | 69 | 47 | 70 | 16 | 116 | 5,88 | 1,08 |
| 19 | 20 | <1e-4 | 9,06 | 47 | 39 | 47 | 18 | 109 | 4,29 | 0,88 |
| 48 | 68 | <1e-4 | 29,11 | 171,5 | 110 | 169 | 20 | 95 | 2,6 | 0,69 |
| 17 | 18 | 2e-4 | 8,23 | 66 | 38 | 65 | 31 | 95 | 6,61 | 1,23 |
| 19 | 31 | 2e-4 | 11,58 | 78,5 | 56 | 78 | 67 | 176 | 20,72 | 2,09 |
| 50 | 94 | 2e-4 | 24,34 | 162,5 | 100 | 151 | 68 | 183 | 17,55 | 1,9 |
| 78 | 94 | 2e-4 | 28,50 | 172 | 110 | 169 | 94 | 178 | 20,5 | 2,07 |
Appendix 1—table 5
Numbers of truly and falsely predicted discordantly evolving pairs of sites for the simulated data with positively and negatively epistatically interacting sites.
See legend for Appendix 1—table 3.
| Model | #FP | #TP | |
|---|---|---|---|
| consider alleles | shuffle mutations in fgr. only | 4 | 7 |
| shuffle mutations both in bgr. and fgr. | 62 | 5 | |
| ignore alleles | shuffle mutations in fgr. only | 4 | 9 |
| shuffle mutations both in bgr. and fgr. | 7 | 5 | |
Appendix 1—table 6
Predicted discordantly evolving pairs for the simulated data with positively and negatively epistatically interacting sites.
See legend for Appendix 1—table 4. The ‘p-value’ column contains the lower p-values.
| site1 | site2 | p-value | epistat | #consec. pairs of mut. | #mut. in consec. pairs in site1 | #mut. in consec. pairs in site2 | #mut. in site1 | #mut. in site2 | exp. epistat | SE |
|---|---|---|---|---|---|---|---|---|---|---|
| 16 | 50 | <1e-4 | 5,72 | 85,5 | 47 | 83 | 108 | 178 | 10,51 | 1,48 |
| 17 | 96 | 1e-4 | 7,44 | 93,5 | 54 | 90 | 109 | 192 | 12,92 | 1,70 |
| 23 | 24 | <1e-4 | 8,27 | 70,5 | 51 | 68 | 137 | 129 | 13,70 | 1,65 |
| 25 | 26 | <1e-4 | 6,13 | 73,5 | 37 | 74 | 139 | 121 | 10,84 | 1,46 |
| 26 | 95 | 1e-4 | 6,94 | 91,5 | 52 | 94 | 121 | 179 | 12,18 | 1,60 |
| 27 | 28 | <1e-4 | 5,90 | 76 | 42 | 73 | 168 | 149 | 13,90 | 1,82 |
| 33 | 34 | 1e-4 | 4,70 | 48,5 | 37 | 45 | 117 | 136 | 8,55 | 1,30 |
| 35 | 36 | <1e-4 | 5,47 | 59,5 | 39 | 55 | 150 | 127 | 10,81 | 1,51 |
| 37 | 38 | <1e-4 | 4,10 | 44,5 | 32 | 41 | 113 | 146 | 8,93 | 1,39 |
| 39 | 40 | <1e-4 | 4,97 | 61,5 | 37 | 59 | 115 | 142 | 11,11 | 1,47 |
| 39 | 47 | <1e-4 | 7,27 | 86,5 | 54 | 84 | 115 | 166 | 13,09 | 1,66 |
Appendix 1—table 7
Predicted concordantly evolving pairs for the ML phylogeny of S-gene reconstructed by IQ-TREE.
The characteristics of predicted site pairs for the estimated FDR≤10% are shown: the positions of sites on the primary sequence of S-protein (site1 and site2), the upper p-values (p-value), values of the epistatic statistic (epistat), numbers of consecutive pairs of mutations (#consec. pairs of mutations), numbers of mutations in consecutive pairs of sites (#mut. in consec. pairs in site1 and site2) and total numbers of mutations on the internal tree branches in sites (#mut. in site1 and site2), FDR value corresponding to the p-value of the site pair obtained for the alternative phylogeny reconstructed by USHER and distances between sites on the protein structure 7JJJ (pdb distance).
| site1 | site2 | p-value | epistat | #consec. pairs of mut. | #mut. in consec. pairs in site1 | #mut. in consec. pairs in site2 | #mut. in site1 | #mut. in site2 | FDRfor the USHER tree | pdb distance |
|---|---|---|---|---|---|---|---|---|---|---|
| 13 | 152 | <2e-5 | 2,864 | 5 | 5 | 4 | 5 | 16 | 0,03 | |
| 18 | 20 | 0,00008 | 1,661 | 3,5 | 3 | 3 | 28 | 8 | 1,19 | 3,62 |
| 20 | 26 | <2e-5 | 1,985 | 4 | 3 | 3 | 8 | 12 | 0,36 | 15,19 |
| 20 | 417 | 0,00022 | 1,348 | 4 | 3 | 2 | 8 | 7 | 0,05 | 47,83 |
| 26 | 190 | 0,00018 | 1,029 | 4 | 4 | 3 | 12 | 3 | 0,06 | 18,40 |
| 63 | 64 | 0,00002 | 0,726 | 1 | 1 | 1 | 2 | 4 | 1,00 | 1,31 |
| 63 | 67 | 0,00008 | 0,726 | 1 | 1 | 1 | 2 | 5 | 1,00 | 9,38 |
| 63 | 69 | 0,00012 | 0,726 | 1 | 1 | 1 | 2 | 5 | 1,00 | 11,07 |
| 63 | 213 | 0,00004 | 0,681 | 1 | 1 | 1 | 2 | 3 | 0,01 | 13,51 |
| 64 | 67 | 0,00012 | 0,726 | 1 | 1 | 1 | 4 | 5 | 1,00 | 5,51 |
| 64 | 69 | 0,00014 | 0,726 | 1 | 1 | 1 | 4 | 5 | 1,00 | 7,05 |
| 67 | 69 | <2e-5 | 1,101 | 2 | 2 | 2 | 5 | 5 | 0,55 | 3,59 |
| 69 | 70 | <2e-5 | 1,125 | 2 | 2 | 2 | 5 | 4 | 0,01 | 1,30 |
| 70 | 144 | <2e-5 | 1,301 | 3 | 3 | 3 | 4 | 5 | 0,01 | 14,03 |
| 76 | 490 | 0,00026 | 0,220 | 1 | 1 | 1 | 3 | 3 | 0,05 | 45,18 |
| 154 | 1071 | <2e-5 | 1,767 | 4 | 2 | 3 | 5 | 5 | 0,25 | 95,13 |
| 155 | 157 | <2e-5 | 1,113 | 2 | 2 | 2 | 3 | 11 | 0,53 | 3,74 |
| 189 | 356 | 0,00006 | 0,544 | 2 | 1 | 2 | 3 | 2 | 0,32 | 31,63 |
| 189 | 360 | 0,00016 | 0,544 | 2 | 1 | 2 | 3 | 3 | 0,07 | 29,89 |
| 190 | 417 | 0,0001 | 1,272 | 3 | 2 | 2 | 3 | 7 | 0,01 | 39,93 |
| 213 | 261 | 0,00008 | 0,562 | 1 | 1 | 1 | 3 | 2 | 0,37 | 11,10 |
| 259 | 261 | <2e-5 | 1,350 | 1,5 | 2 | 1 | 4 | 2 | 0,05 | 3,81 |
| 262 | 272 | <2e-5 | 1,183 | 4 | 4 | 1 | 9 | 2 | 0,94 | 31,42 |
| 356 | 357 | 0,00006 | 0,448 | 1 | 1 | 1 | 2 | 2 | 0,69 | 1,33 |
| 356 | 360 | <2e-5 | 1,283 | 2,5 | 2 | 3 | 2 | 3 | 0,05 | 10,12 |
| 359 | 360 | <2e-5 | 0,976 | 1,5 | 1 | 2 | 2 | 3 | 0,01 | 1,34 |
| 439 | 441 | <2e-5 | 2,097 | 4 | 3 | 4 | 9 | 8 | 0,01 | 3,50 |
| 440 | 441 | 0,00014 | 1,505 | 3 | 3 | 3 | 12 | 8 | 0,01 | 1,33 |
| 440 | 442 | <2e-5 | 2,476 | 3 | 2 | 3 | 12 | 6 | 0,01 | 3,92 |
| 440 | 443 | 0,00002 | 1,284 | 4 | 3 | 2 | 12 | 2 | 0,25 | 3,86 |
| 440 | 444 | <2e-5 | 2,515 | 3,5 | 2 | 5 | 12 | 7 | 0,01 | 5,60 |
| 441 | 442 | <2e-5 | 2,244 | 4 | 4 | 4 | 8 | 6 | 0,01 | 1,33 |
| 441 | 443 | 0,00002 | 1,281 | 5 | 4 | 2 | 8 | 2 | 0,02 | 3,23 |
| 441 | 444 | <2e-5 | 3,492 | 5,5 | 4 | 4 | 8 | 7 | 0,01 | 2,60 |
| 442 | 443 | 0,00006 | 1,301 | 4 | 4 | 2 | 6 | 2 | 0,05 | 1,32 |
| 442 | 444 | <2e-5 | 3,013 | 6 | 4 | 4 | 6 | 7 | 0,01 | 4,05 |
| 443 | 444 | 0,00008 | 1,043 | 2 | 2 | 2 | 2 | 7 | 0,03 | 1,32 |
| 484 | 655 | 0,00004 | 1,716 | 8 | 6 | 5 | 34 | 12 | 0,89 | 73,58 |
| 501 | 1118 | 0,00014 | 2,737 | 16 | 13 | 12 | 40 | 22 | 0,09 | 131,71 |
| 681 | 716 | <2e-5 | 3,905 | 16,5 | 12 | 16 | 59 | 21 | 0,02 | |
| 716 | 982 | 0,00002 | 2,001 | 15 | 9 | 11 | 21 | 15 | 0,01 | 81,66 |
| 716 | 1118 | 0,00004 | 2,382 | 13 | 8 | 12 | 21 | 22 | 0,01 | 22,29 |
| 859 | 950 | <2e-5 | 2,219 | 5,5 | 4 | 5 | 11 | 9 | 0,01 | 15,17 |
| 982 | 1118 | 0,00014 | 1,637 | 15 | 11 | 8 | 15 | 22 | 0,01 | 94,63 |
| 1258 | 1259 | 0,00004 | 0,775 | 3 | 1 | 3 | 5 | 3 | NA |
Appendix 1—table 8
Predicted concordantly evolving pairs for the MP phylogeny of S-gene reconstructed by USHER.
See legend for Appendix 1—table 7. The ‘p-value’ column contains the lower p-values.
| site1 | site2 | p-value | epistat | #consec. pairs of mut. | #mut. in consec. pairs in site1 | #mut. in consec. pairs in site2 | #mut. in site1 | #mut. in site2 | IQ-TREE | pdb distance |
|---|---|---|---|---|---|---|---|---|---|---|
| 12 | 346 | 0,00006 | 0,934 | 2 | 2 | 1 | 9 | 4 | 0 | - |
| 12 | 899 | 0,00004 | 0,724 | 2 | 2 | 1 | 9 | 3 | 0 | - |
| 13 | 152 | 0,00004 | 1,407 | 5 | 4 | 3 | 4 | 13 | 1 | - |
| 20 | 190 | 0,00022 | 0,885 | 3 | 2 | 3 | 8 | 4 | 0 | 22,59 |
| 20 | 417 | 0,00018 | 1,107 | 2 | 2 | 1 | 8 | 8 | 1 | 47,83 |
| 26 | 190 | 0,00026 | 0,913 | 4 | 3 | 4 | 12 | 4 | 1 | 18,40 |
| 26 | 655 | 0,00042 | 0,968 | 6,5 | 3 | 6 | 12 | 14 | 0 | 37,53 |
| 54 | 690 | 0,00044 | 0,714 | 1 | 1 | 1 | 11 | 3 | 0 | 33,65 |
| 62 | 251 | <2e-5 | 0,748 | 1 | 1 | 1 | 2 | 3 | 0 | 32,01 |
| 67 | 96 | <2e-5 | 0,599 | 1 | 1 | 1 | 3 | 7 | 0 | 7,12 |
| 69 | 70 | <2e-5 | 1,496 | 3 | 3 | 3 | 5 | 5 | 1 | 1,30 |
| 69 | 144 | 0,00002 | 0,984 | 2 | 2 | 2 | 5 | 5 | 0 | 12,57 |
| 70 | 144 | <2e-5 | 1,088 | 3 | 3 | 3 | 5 | 5 | 1 | 14,03 |
| 76 | 490 | 0,0001 | 0,275 | 1 | 1 | 1 | 2 | 3 | 1 | 45,18 |
| 80 | 215 | <2e-5 | 1,687 | 6,5 | 3 | 6 | 21 | 14 | 0 | 12,51 |
| 80 | 950 | 0,00014 | 1,091 | 3 | 2 | 2 | 21 | 7 | 0 | 56,59 |
| 152 | 252 | 0,00016 | 0,623 | 2 | 2 | 1 | 13 | 4 | 0 | 15,26 |
| 189 | 360 | 0,0003 | 0,534 | 1 | 1 | 1 | 2 | 2 | 1 | 29,89 |
| 189 | 772 | 0,00024 | 0,440 | 1 | 1 | 1 | 2 | 2 | 0 | 44,17 |
| 190 | 417 | <2e-5 | 1,134 | 2,5 | 2 | 2 | 4 | 8 | 1 | 39,93 |
| 215 | 1167 | 0,00042 | 0,853 | 2 | 2 | 2 | 14 | 4 | 0 | |
| 255 | 256 | 0,00022 | 0,758 | 2 | 2 | 2 | 8 | 7 | 0 | 1,32 |
| 255 | 260 | 0,00036 | 0,811 | 3 | 3 | 2 | 8 | 3 | 0 | 9,61 |
| 256 | 258 | 0,00012 | 0,660 | 1 | 1 | 1 | 7 | 2 | 0 | 2,81 |
| 256 | 260 | 0,00014 | 1,056 | 2 | 2 | 2 | 7 | 3 | 0 | 8,18 |
| 259 | 260 | <2e-5 | 1,536 | 2 | 2 | 2 | 3 | 3 | 0 | 1,31 |
| 259 | 261 | 0,00014 | 0,909 | 1 | 1 | 1 | 3 | 2 | 1 | 3,81 |
| 357 | 360 | <2e-5 | 1,025 | 1,5 | 1 | 2 | 2 | 2 | 0 | 7,59 |
| 359 | 360 | <2e-5 | 1,268 | 2 | 1 | 2 | 2 | 2 | 1 | 1,34 |
| 360 | 772 | 0,00018 | 0,534 | 1 | 1 | 1 | 2 | 2 | 0 | 58,61 |
| 439 | 440 | <2e-5 | 2,038 | 3,5 | 2 | 4 | 10 | 12 | 0 | 1,31 |
| 439 | 441 | <2e-5 | 2,795 | 5 | 3 | 4 | 10 | 5 | 1 | 3,50 |
| 439 | 444 | 0,00006 | 1,606 | 4,5 | 3 | 4 | 10 | 7 | 0 | 6,21 |
| 440 | 441 | <2e-5 | 2,822 | 4,5 | 4 | 2 | 12 | 5 | 1 | 1,33 |
| 440 | 442 | <2e-5 | 2,092 | 3 | 3 | 2 | 12 | 3 | 1 | 3,92 |
| 440 | 444 | <2e-5 | 2,947 | 4,5 | 4 | 3 | 12 | 7 | 1 | 5,60 |
| 441 | 442 | <2e-5 | 2,292 | 3 | 2 | 2 | 5 | 3 | 1 | 1,33 |
| 441 | 443 | 0,00002 | 1,383 | 2 | 2 | 2 | 5 | 2 | 1 | 3,23 |
| 441 | 444 | <2e-5 | 3,829 | 6,5 | 4 | 4 | 5 | 7 | 1 | 2,60 |
| 441 | 445 | 0,00018 | 1,086 | 2 | 2 | 1 | 5 | 6 | 0 | 8,51 |
| 442 | 443 | 0,0001 | 1,132 | 2 | 2 | 1 | 3 | 2 | 1 | 1,32 |
| 442 | 444 | 0 | 2,387 | 4 | 3 | 3 | 3 | 7 | 1 | 4,05 |
| 443 | 444 | 0,00006 | 1,031 | 4 | 1 | 4 | 2 | 7 | 1 | 1,32 |
| 444 | 445 | 0,0002 | 1,270 | 4 | 5 | 3 | 7 | 6 | 0 | 1,31 |
| 501 | 570 | 0 | 2,734 | 16 | 13 | 10 | 46 | 19 | 0 | 53,69 |
| 501 | 1118 | 0,00048 | 2,028 | 18 | 14 | 13 | 46 | 19 | 1 | 131,71 |
| 570 | 681 | 0,00018 | 2,538 | 17,5 | 15 | 14 | 19 | 62 | 0 | |
| 570 | 1118 | 0,00002 | 1,881 | 13,5 | 9 | 10 | 19 | 19 | 0 | 79,04 |
| 572 | 1181 | 0 | 0,533 | 1 | 1 | 1 | 3 | 2 | 0 | |
| 583 | 1237 | 0,00014 | 0,242 | 1 | 1 | 1 | 3 | 3 | 1 | |
| 681 | 716 | 0,00002 | 3,017 | 20 | 20 | 16 | 62 | 21 | 1 | |
| 681 | 1118 | 0,00032 | 2,334 | 18 | 14 | 12 | 62 | 19 | 0 | |
| 716 | 982 | 0 | 4,623 | 19,5 | 13 | 16 | 21 | 18 | 1 | 81,66 |
| 716 | 1118 | 0 | 2,872 | 17,5 | 11 | 13 | 21 | 19 | 1 | 22,29 |
| 859 | 950 | 0 | 1,596 | 4 | 3 | 4 | 9 | 7 | 1 | 15,17 |
| 982 | 1118 | 0 | 1,831 | 17,5 | 10 | 10 | 18 | 19 | 1 | 94,63 |
| 1027 | 1176 | 0,00016 | 1,206 | 5,5 | 5 | 4 | 12 | 9 | 0 |
Appendix 1—table 9
Predicted discordantly evolving pairs for the MP phylogeny of S-gene reconstructed by USHER.
The characteristics of predicted site pairs for the estimated FDR≤10% are shown: the positions of sites on the primary sequence of S-protein (site1 and site2), the upper p-values (p-value), values of the epistatic statistic (epistat), numbers of consecutive pairs of mutations (#consec. pairs of mutations), numbers of mutations in consecutive pairs of sites (#mut. in consec. pairs in site1 and site2) and total numbers of mutations on the internal tree branches in sites (#mut. in site1 and site2), indicator variable that marks whether a site pairs is also within the set of predictions for the ML phylogeny reconstructed by IQ-TREE for the same FDR threshold (IQ-TREE tree) and distances between sites on the protein structure (pdb distance).
| site1 | site2 | p-value | epistat | #consec. pairs of mut. | #mut. in consec. pairs in site1 | #mut. in consec. pairs in site2 | #mut. in site1 | #mut. in site2 | IQ-TREE | pdb distance |
|---|---|---|---|---|---|---|---|---|---|---|
| 18 | 681 | 0,00344 | 0,102 | 5,5 | 5 | 4 | 22 | 62 | 0 | |
| 222 | 501 | 0,00314 | 0,019 | 1 | 1 | 1 | 12 | 46 | 1 | 55,44 |
| 439 | 501 | 0,00286 | 0 | 0 | 0 | 0 | 10 | 46 | 0 | 5,16 |
| 440 | 501 | 0,0019 | 0 | 0 | 0 | 0 | 12 | 46 | 0 | 9,47 |
| 440 | 681 | 0,00274 | 0,008 | 1 | 1 | 1 | 12 | 62 | 1 | |
| 484 | 982 | 0,0021 | 0,020 | 3 | 3 | 3 | 43 | 18 | 0 | 35,42 |
| 501 | 675 | 0,00136 | 0,025 | 1 | 1 | 1 | 46 | 22 | 1 | 84,98 |
| 501 | 677 | 0,0001 | 0,023 | 2 | 2 | 2 | 46 | 33 | 1 | 88,2 |
| 570 | 677 | 0,00226 | 0,011 | 1 | 1 | 1 | 19 | 33 | 0 | 44,77 |
| 614 | 653 | 0,00022 | 0,037 | 4 | 1 | 4 | 10 | 5 | 1 | 15,47 |
| 675 | 716 | 0,00568 | 0 | 0 | 0 | 0 | 22 | 21 | 0 | 38,15 |
| 675 | 1118 | 0,00524 | 0 | 0 | 0 | 0 | 22 | 19 | 0 | 58,84 |
| 677 | 681 | 0,00264 | 0,098 | 3 | 3 | 3 | 33 | 62 | 0 | |
| 677 | 716 | 0,00102 | 0,011 | 1 | 1 | 1 | 33 | 21 | 0 | 42,93 |
| 677 | 982 | 0,00152 | 0,004 | 1 | 1 | 1 | 33 | 18 | 0 | 54,37 |
| 677 | 1118 | 0,00066 | 0,002 | 1 | 1 | 1 | 33 | 19 | 0 | 64,36 |
Appendix 1—table 10
Coordinated episodic selection in concordantly evolving pairs predicted for the phylogeny reconstructed by IQ-TREE.
Z-scores < 0 and upper p-values after Benjamini-Hochberg adjustment < 0.05 indicate clustering of nonconsecutive mutations; z-scores > 0 and lower p-values after Benjamini-Hochberg adjustment < 0.05 indicate that nonconsecutive mutations tend to avoid each other. For site pairs with z-scores > 0, concordant evolution cannot be explained without positive epistatic interaction between the sites.
| site 1 | site 2 | #nonseq. pairs | zscore | lower pvalue | upper pvalue | lower pvalue adj. | upper pvalue adj. |
|---|---|---|---|---|---|---|---|
| 13 | 152 | 2569 | –0,724 | 0,7675 | 0,2325 | 1 | 0,5813 |
| 18 | 20 | 8610,5 | 1,148 | 0,1225 | 0,8775 | 0,3675 | 1 |
| 20 | 26 | 5719 | 2,444 | 0,0175 | 0,9825 | 0,1125 | 1 |
| 20 | 417 | 2533 | 1,738 | 0,04 | 0,96 | 0,2 | 1 |
| 26 | 190 | 3682 | 2,258 | 0,015 | 0,985 | 0,1125 | 1 |
| 63 | 64 | 124 | 1,736 | 0,06 | 0,94 | 0,2455 | 1 |
| 63 | 67 | 264 | 1,68 | 0,075 | 0,925 | 0,2596 | 1 |
| 63 | 69 | 239 | 2,224 | 0,025 | 0,975 | 0,1406 | 1 |
| 63 | 213 | 94 | 1,407 | 0,0825 | 0,9175 | 0,2652 | 1 |
| 64 | 67 | 1324 | 2,353 | 0,0125 | 0,9875 | 0,1125 | 1 |
| 64 | 69 | 1199 | 2,766 | 0,0025 | 0,9975 | 0,0281 | 1 |
| 67 | 69 | 2542 | 4,104 | 0 | 1 | 0,0281 | 1 |
| 69 | 70 | 2014 | 4,041 | 0 | 1 | 0,0281 | 1 |
| 70 | 144 | 627 | 2,952 | 0,0025 | 0,9975 | 0,0281 | 1 |
| 76 | 490 | 1748 | 0,632 | 0,25 | 0,75 | 0,5357 | 1 |
| 154 | 1071 | 502 | –1,357 | 0,925 | 0,075 | 1 | 0,225 |
| 155 | 157 | 482 | 0,671 | 0,2375 | 0,7625 | 0,5344 | 1 |
| 189 | 356 | 108 | –0,187 | 0,555 | 0,445 | 0,999 | 0,9536 |
| 189 | 360 | 58 | 0,927 | 0,17 | 0,83 | 0,4765 | 1 |
| 190 | 417 | 1631 | 0,099 | 0,445 | 0,555 | 0,8344 | 1 |
| 213 | 261 | 778 | –1,251 | 0,905 | 0,095 | 1 | 0,2672 |
| 259 | 261 | 736,5 | –2,384 | 0,9975 | 0,0025 | 1 | 0,0094 |
| 262 | 272 | 744 | 0,085 | 0,44 | 0,56 | 0,8344 | 1 |
| 356 | 357 | 65 | –0,797 | 0,7525 | 0,2475 | 1 | 0,5862 |
| 356 | 360 | 63,5 | –2,704 | 1 | 0,0025 | 1 | 0,0094 |
| 359 | 360 | 64,5 | –0,39 | 0,6275 | 0,3725 | 1 | 0,8381 |
| 439 | 441 | 1196 | –3,989 | 1 | 0,0025 | 1 | 0,0094 |
| 440 | 441 | 1647 | –3,55 | 1 | 0,0025 | 1 | 0,0094 |
| 440 | 442 | 822 | –3,23 | 1 | 0,0025 | 1 | 0,0094 |
| 440 | 443 | 931 | –2,124 | 0,995 | 0,005 | 1 | 0,0173 |
| 440 | 444 | 1591,5 | –3,511 | 1 | 0,0025 | 1 | 0,0094 |
| 441 | 442 | 446 | –5,063 | 1 | 0,0025 | 1 | 0,0094 |
| 441 | 443 | 505 | –4,26 | 1 | 0,0025 | 1 | 0,0094 |
| 441 | 444 | 864,5 | –5,337 | 1 | 0,0025 | 1 | 0,0094 |
| 442 | 443 | 251 | –3,988 | 1 | 0,0025 | 1 | 0,0094 |
| 442 | 444 | 429 | –4,727 | 1 | 0,0025 | 1 | 0,0094 |
| 443 | 444 | 491 | –3,972 | 1 | 0,0025 | 1 | 0,0094 |
| 484 | 655 | 18792 | 1,038 | 0,18 | 0,82 | 0,4765 | 1 |
| 501 | 1118 | 16121 | 1,443 | 0,07 | 0,93 | 0,2596 | 1 |
| 681 | 716 | 19375,5 | –0,962 | 0,8325 | 0,1675 | 1 | 0,4434 |
| 716 | 982 | 8267 | 0,58 | 0,3075 | 0,6925 | 0,629 | 1 |
| 716 | 1118 | 9986 | 1,65 | 0,05 | 0,95 | 0,225 | 1 |
| 859 | 950 | 3684,5 | 0,747 | 0,2075 | 0,7925 | 0,5188 | 1 |
| 982 | 1118 | 8103 | 0,757 | 0,2325 | 0,7675 | 0,5344 | 1 |
| 1258 | 1259 | 1053 | –1,435 | 0,9375 | 0,0625 | 1 | 0,2009 |
Appendix 1—table 11
Coordinated episodic selection in discordantly evolving pairs predicted for the phylogeny reconstructed by IQ-TREE.
Z-scores < 0 and upper p-values after Benjamini-Hochberg adjustment < 0.05 indicate clustering of nonconsecutive mutations; z-scores > 0 and lower p-values after Benjamini-Hochberg adjustment < 0.05 indicate that nonconsecutive mutations tend to avoid each other. For site pairs with z-scores < 0, discordant evolution cannot be explained without negative epistatic interaction between the sites.
| site 1 | site 2 | #nonseq. pairs | zscore | lower pvalue | upper pvalue | lower pvalue adj. | upper pvalue adj. |
|---|---|---|---|---|---|---|---|
| 69 | 614 | 2875 | 2,27 | 0,015 | 0,985 | 0,06 | 1 |
| 222 | 501 | 17114 | –0,861 | 0,795 | 0,205 | 0,995 | 0,369 |
| 440 | 681 | 10559 | –2,229 | 0,995 | 0,005 | 0,995 | 0,045 |
| 501 | 675 | 18907 | –2,39 | 0,9875 | 0,0125 | 0,995 | 0,0563 |
| 501 | 677 | 30478 | –1,463 | 0,925 | 0,075 | 0,995 | 0,1856 |
| 570 | 614 | 5813 | 1,738 | 0,0425 | 0,9575 | 0,0956 | 1 |
| 614 | 653 | 1856 | 2,944 | 0,0025 | 1 | 0,0225 | 1 |
| 614 | 982 | 4913 | 2,226 | 0,02 | 0,98 | 0,06 | 1 |
| 681 | 1176 | 9599 | –1,326 | 0,9175 | 0,0825 | 0,995 | 0,1856 |
Appendix 1—table 12
Coordinated episodic selection in concordantly evolving pairs predicted for the phylogeny reconstructed by USHER.
Z-scores < 0 and upper p-values after Benjamini-Hochberg adjustment < 0.05 indicate clustering of nonconsecutive mutations; z-scores > 0 and lower p-values after Benjamini-Hochberg adjustment < 0.05 indicate that nonconsecutive mutations tend to avoid each other. For site pairs with z-scores > 0, concordant evolution cannot be explained without positive epistatic interaction between the sites.
| site 1 | site 2 | #nonseq. pairs | zscore | lower pvalue | upper pvalue | lower pvalue adj. | upper pvalue adj. |
|---|---|---|---|---|---|---|---|
| 12 | 346 | 1296 | 0,461 | 0,29 | 0,71 | 1 | 0,9263 |
| 12 | 899 | 883 | 0,705 | 0,245 | 0,755 | 1 | 0,9551 |
| 13 | 152 | 3955 | –0,731 | 0,75 | 0,25 | 1 | 0,4597 |
| 20 | 190 | 2357 | –0,372 | 0,6525 | 0,3475 | 1 | 0,5826 |
| 20 | 417 | 3184 | 0,692 | 0,225 | 0,775 | 1 | 0,9551 |
| 26 | 190 | 3876 | 0,993 | 0,1425 | 0,8575 | 0,8835 | 0,9975 |
| 26 | 655 | 10663,5 | 2,486 | 0,01 | 0,99 | 0,1425 | 1 |
| 54 | 690 | 923 | –1,288 | 0,9175 | 0,0825 | 1 | 0,1959 |
| 62 | 251 | 95 | 0,51 | 0,2875 | 0,7125 | 1 | 0,9263 |
| 67 | 96 | 2027 | 0,462 | 0,285 | 0,715 | 1 | 0,9263 |
| 69 | 70 | 2241 | 2,982 | 0 | 1 | 0,0713 | 1 |
| 69 | 144 | 967 | 2,582 | 0,01 | 0,99 | 0,1425 | 1 |
| 70 | 144 | 833 | 2,303 | 0,02 | 0,98 | 0,1832 | 1 |
| 76 | 490 | 1801 | 0,766 | 0,2125 | 0,7875 | 1 | 0,9551 |
| 80 | 215 | 13261,5 | –2,369 | 0,995 | 0,005 | 1 | 0,0204 |
| 80 | 950 | 6321 | –1,417 | 0,9325 | 0,0675 | 1 | 0,1749 |
| 152 | 252 | 1142 | 0,042 | 0,4875 | 0,5125 | 1 | 0,8063 |
| 189 | 360 | 43 | 0,188 | 0,395 | 0,605 | 1 | 0,8621 |
| 189 | 772 | 109 | –0,85 | 0,785 | 0,215 | 1 | 0,4226 |
| 190 | 417 | 2157,5 | –0,741 | 0,7725 | 0,2275 | 1 | 0,4323 |
| 215 | 1167 | 2031 | –1,602 | 0,9525 | 0,0475 | 1 | 0,1425 |
| 255 | 256 | 2126 | –1,048 | 0,845 | 0,155 | 1 | 0,3398 |
| 255 | 260 | 1285 | –2,55 | 1 | 0,0025 | 1 | 0,0119 |
| 256 | 258 | 645 | –1,441 | 0,9375 | 0,0625 | 1 | 0,1696 |
| 256 | 260 | 872 | –1,368 | 0,9275 | 0,0725 | 1 | 0,1797 |
| 259 | 260 | 435 | –2,326 | 0,9925 | 0,0075 | 1 | 0,0267 |
| 259 | 261 | 778 | –1,861 | 0,99 | 0,01 | 1 | 0,0335 |
| 357 | 360 | 30,5 | –1,517 | 0,95 | 0,05 | 1 | 0,1425 |
| 359 | 360 | 38 | –0,549 | 0,6725 | 0,3275 | 1 | 0,5657 |
| 360 | 772 | 39 | –0,674 | 0,7225 | 0,2775 | 1 | 0,4943 |
| 439 | 440 | 2456,5 | –2,577 | 0,9925 | 0,0075 | 1 | 0,0267 |
| 439 | 441 | 1061 | –2,935 | 1 | 0,0025 | 1 | 0,0119 |
| 439 | 444 | 1143,5 | –3,434 | 1 | 0,0025 | 1 | 0,0119 |
| 440 | 441 | 1555,5 | –2,671 | 0,995 | 0,005 | 1 | 0,0204 |
| 440 | 442 | 897 | –2,686 | 1 | 0,0025 | 1 | 0,0119 |
| 440 | 444 | 1675,5 | –2,976 | 1 | 0,0025 | 1 | 0,0119 |
| 441 | 442 | 387 | –4,065 | 1 | 0,0025 | 1 | 0,0119 |
| 441 | 443 | 440 | –3,437 | 1 | 0,0025 | 1 | 0,0119 |
| 441 | 444 | 721,5 | –4,488 | 1 | 0,0025 | 1 | 0,0119 |
| 441 | 445 | 596 | –2,144 | 0,9825 | 0,0175 | 1 | 0,0554 |
| 442 | 443 | 253 | –3,58 | 1 | 0,0025 | 1 | 0,0119 |
| 442 | 444 | 416 | –4,346 | 1 | 0,0025 | 1 | 0,0119 |
| 443 | 444 | 472 | –4,301 | 1 | 0,0025 | 1 | 0,0119 |
| 444 | 445 | 640 | –2,502 | 0,9975 | 0,0025 | 1 | 0,0119 |
| 501 | 570 | 21489 | 3,943 | 0 | 1 | 0,0713 | 1 |
| 501 | 1118 | 21300 | 1,398 | 0,08 | 0,92 | 0,57 | 1 |
| 570 | 681 | 26547,5 | 2,15 | 0,015 | 0,985 | 0,171 | 1 |
| 570 | 1118 | 13096,5 | 1,926 | 0,0225 | 0,9775 | 0,1832 | 1 |
| 572 | 1181 | 511 | –0,81 | 0,785 | 0,215 | 1 | 0,4226 |
| 583 | 1237 | 3077 | –0,998 | 0,8325 | 0,1675 | 1 | 0,3536 |
| 681 | 716 | 27238 | –1,029 | 0,8575 | 0,1425 | 1 | 0,3249 |
| 681 | 1118 | 26316 | 0,042 | 0,475 | 0,525 | 1 | 0,8063 |
| 716 | 982 | 10836,5 | 0,057 | 0,4625 | 0,5375 | 1 | 0,8063 |
| 716 | 1118 | 13434,5 | –0,024 | 0,5175 | 0,4825 | 1 | 0,7858 |
| 859 | 950 | 4892 | 0,429 | 0,3125 | 0,6875 | 1 | 0,9263 |
| 982 | 1118 | 10470,5 | 0,258 | 0,3975 | 0,6025 | 1 | 0,8621 |
| 1027 | 1176 | 4023,5 | 0,98 | 0,155 | 0,845 | 0,8835 | 0,9975 |
Appendix 1—table 13
Coordinated episodic selection in discordantly evolving pairs predicted for the phylogeny reconstructed by USHER.
Z-scores < 0 and upper p-values after Benjamini-Hochberg adjustment < 0.05 indicate clustering of nonconsecutive mutations; z-scores > 0 and lower p-values after Benjamini-Hochberg adjustment < 0.05 indicate that nonconsecutive mutations tend to avoid each other. For site pairs with z-scores < 0, discordant evolution cannot be explained without negative epistatic interaction between the sites.
| site 1 | site 2 | #nonseq. pairs | zscore | lower pvalue | upper pvalue | lower pvalue adj. | upper pvalue adj. |
|---|---|---|---|---|---|---|---|
| 18 | 681 | 34644,5 | –1,979 | 0,9725 | 0,0275 | 0,98 | 0,2 |
| 222 | 501 | 20756 | 0,222 | 0,3825 | 0,6175 | 0,68 | 1 |
| 439 | 501 | 7667 | –1,207 | 0,8875 | 0,1125 | 0,98 | 0,45 |
| 440 | 501 | 11220 | 0,422 | 0,325 | 0,675 | 0,665 | 1 |
| 440 | 681 | 13859 | –0,599 | 0,7375 | 0,2625 | 0,98 | 0,6629 |
| 484 | 982 | 21249 | 4,304 | 0,0025 | 1 | 0,0133 | 1 |
| 501 | 675 | 22065 | –1,868 | 0,9625 | 0,0375 | 0,98 | 0,2 |
| 501 | 677 | 36276 | –0,526 | 0,71 | 0,29 | 0,98 | 0,6629 |
| 570 | 677 | 22309 | 4,782 | 0,0025 | 1 | 0,0133 | 1 |
| 614 | 653 | 2273 | 1,739 | 0,05 | 0,95 | 0,16 | 1 |
| 675 | 716 | 13924 | –0,731 | 0,7725 | 0,2275 | 0,98 | 0,6629 |
| 675 | 1118 | 13452 | 0,417 | 0,3325 | 0,6675 | 0,665 | 1 |
| 677 | 681 | 44811 | –2,043 | 0,98 | 0,02 | 0,98 | 0,2 |
| 677 | 716 | 22891 | 0,604 | 0,265 | 0,735 | 0,665 | 1 |
| 677 | 982 | 17847 | 3,543 | 0,0025 | 1 | 0,0133 | 1 |
| 677 | 1118 | 22115 | 1,869 | 0,0425 | 0,9575 | 0,16 | 1 |
Appendix 1—table 14
Pairs of lineage-defining sites of Alpha VOC (subset I) tend to have stronger signal of concordant evolution than the complementary subset of site pairs (subset II).
Site pairs were ordered by nominal p-values; for each of the two subsets, mean rank of site pairs included into that subset is provided. The difference between mean ranks (delta) obtained for the data is compared to the difference obtained for 400 samples from the null-model where substitutions in each site are independently and randomly distributed on the tree branches (simulations). The probability that the difference of mean ranks for the data is greater than the difference of ranks for samples from the null-model is P{delta(simulations) ≤ delta(data)} <0.0025.
| mean ranks for subset I(15 site pairs) | mean ranks for subset II(17005 site pairs) | delta | |
|---|---|---|---|
| data | 234,7 | 8517,8 | –8283,1 |
| simulations | 2182,4 | 8516,1 | –6333,7 |
-
Number of lineage-defining sites: 6.
-
P{delta(simulations)≤delta(data)}<0.0025.
Appendix 1—table 15
Pairs of lineage-defining sites of Beta VOC tend to have stronger signal of concordant evolution than the complementary subset of site pairs.
See legend for Appendix 1—table 14.
| mean ranks for subset I(15 site pairs) | mean ranks for subset II(17005 site pairs) | delta | |
|---|---|---|---|
| data | 530,5 | 8517,5 | –7987,1 |
| simulations | 3021,4 | 8515,3 | –5494,0 |
-
Number of lineage-defining sites: 6.
-
P{delta(simulations)≤delta(data)}<0.0025.
Appendix 1—table 16
Pairs of lineage-defining sites of Delta VOC tend to have stronger signal of concordant evolution than the complementary subset of site pairs.
See legend for Appendix 1—table 14.
| mean ranks for subset I(15 site pairs) | mean ranks for subset II(17005 site pairs) | delta | |
|---|---|---|---|
| data | 3137,2 | 8515,2 | –5378,0 |
| simulations | 5545,9 | 8513,1 | –2967,2 |
-
Number of lineage-defining sites: 6.
-
P{delta(simulations)≤delta(data)}=0.005.
Appendix 1—table 17
Pairs of lineage-defining sites of Gamma VOC tend to have stronger signal of concordant evolution than the complementary subset of site pairs.
See legend for Appendix 1—table 14.
| mean ranks for subset I(55 site pairs) | mean ranks for subset II(16965 site pairs) | delta | |
|---|---|---|---|
| data | 543,3 | 8536,3 | –7993,0 |
| simulations | 3532,3 | 8526,6 | –4994,3 |
-
Number of lineage-defining sites: 11.
-
P{delta(simulations)≤delta(data)}<0.0025.
Appendix 1—table 18
Pairs of lineage-defining sites of Omicron VOC.
See legend for Appendix 1—table 14.
| mean ranks for subset I(91 site pairs) | mean ranks for subset II(16929 site pairs) | delta | |
|---|---|---|---|
| data | 5686,0 | 8525,7 | –2839,7 |
| simulations | 5540,6 | 8526,5 | –2985,9 |
-
Number of lineage-defining sites: 14.
-
P{delta(simulations)≤delta(data)}=0.635.
Appendix 1—table 19
Pairs of lineage-defining sites of Alpha VOC tend to have stronger signal of concordant evolution than the complementary subset of site pairs even if all Alpha and related lineages are excluded from the analysis.
See legend for Appendix 1—table 14.
| mean ranks for subset I(15 site pairs) | mean ranks for subset II(15385 site pairs) | delta | |
|---|---|---|---|
| data | 316,8 | 7707,7 | –7390,9 |
| simulations | 4281,3 | 7703,8 | –3422,5 |
-
Number of lineage-defining sites: 6.
-
P{delta(simulations)≤delta(data)}<0.0025.
Appendix 1—table 20
No difference in the strength of concordant evolution is detected for pairs of lineage-defining sites of Beta VOC and the complementary subset of site pairs if all Beta and related lineages are excluded from the analysis.
See legend for Appendix 1—table 14.
| mean ranks for subset I(15 site pairs) | mean ranks for subset II(16275 site pairs) | delta | |
|---|---|---|---|
| data | 4586,7 | 8148,8 | –3562,1 |
| simulations | 4522,3 | 8148,8 | –3626,6 |
-
Number of lineage-defining sites: 6.
-
P{delta(simulations)≤delta(data)}=0.5628.
Appendix 1—table 21
No difference in the strength of concordant evolution is detected for pairs of lineage-defining sites of Delta VOC and the complementary subset of site pairs if all Delta and related lineages are excluded from the analysis.
See legend for Appendix 1—table 14.
| mean ranks for subset I(15 site pairs) | mean ranks for subset II(16638 site pairs) | delta | |
|---|---|---|---|
| data | 5934,7 | 8329,2 | –2394,5 |
| simulations | 5975,1 | 8329,1 | –2354,0 |
-
Number of lineage-defining sites: 6.
-
P{delta(simulations)≤delta(data)}=0.4462.
Appendix 1—table 22
Pairs of lineage defining sites of Gamma tend to have weaker signal of concordant evolution than the complementary subset of site pairs if all Gamma and related lineages are excluded from the analysis.
See legend for Appendix 1—table 14.
| mean ranks for subset I(45 site pairs) | mean ranks for subset II(16245 site pairs) | delta | |
|---|---|---|---|
| data | 6424,4 | 8150,3 | –1725,8 |
| simulations | 5393,5 | 8153,1 | –2759,7 |
-
Number of lineage-defining sites: 10.
-
P{delta(simulations)≤delta(data)}=0.9728.
-
P{delta(simulations)≥delta(data)}=0.0272.
-
GISAID Identifier: EPI_SET_20220729hq doi:10.55876/gis8.220729hq.
Author response table 1
Observed frequencies of spurious detection of concordant evolution for different types of site pairs, compared to the expected (multinomial test p-value = 0).
0032). The number of possible FP pairs is calculated as the number of unordered combinations of sites that produce false positive pairs. For example, 20 sites in the simulation are involved in positive epistatic interactions and form 10 true epistatic pairs. The number of possible FP pairs can then be calculated as follows: Number of FP pairs = (Number of combinations of 2 sites from a set of 20) – (Number of true epistatic pairs) = 20*19/2 – 10 = 180.
| site types | #FP | #total possible FP | expected FP frequency | observed FP frequency |
| (pos,pos) | 7 | 180 | 0,0364 | 0,0843 |
| (pos,neg) | 7 | 400 | 0,0810 | 0,0843 |
| (neg,neg) | 0 | 190 | 0,0385 | 0 |
| (pos,neu) | 33 | 1200 | 0,2429 | 0,3976 |
| (neg,neu) | 6 | 1200 | 0,2429 | 0,0723 |
| (neu,neu) | 30 | 1770 | 0,3583 | 0,3614 |
Author response table 2
Observed frequencies of spurious detection of discordant evolution for different types of site pairs, compared to the expected.
Multinomial test p-value = 0.0018.
| site types | #FP | #total possible FP | expected FP frequency | observed FP frequency |
| (pos,pos) | 0 | 190 | 0,0385 | 0 |
| (pos,neg) | 7 | 400 | 0,0810 | 0,1556 |
| (neg,neg) | 4 | 180 | 0,0364 | 0,0889 |
| (pos,neu) | 5 | 1200 | 0,2429 | 0,1111 |
| (neg,neu) | 19 | 1200 | 0,2429 | 0,4222 |
| (neu,neu) | 10 | 1770 | 0,3583 | 0,2222 |
Additional files
Download links
A two-part list of links to download the article, or parts of the article, in various formats.
Downloads (link to download the article as PDF)
Open citations (links to open the citations from this article in various online reference manager services)
Cite this article (links to download the citations from this article in formats compatible with various reference manager tools)
Coordinated evolution at amino acid sites of SARS-CoV-2 spike
eLife 12:e82516.
https://doi.org/10.7554/eLife.82516


