T-REX17 is a transiently expressed non-coding RNA essential for human endoderm formation
- Department of Genome Regulation, Max Planck Institute for Molecular Genetics, Germany
- Institute of Chemistry and Biochemistry, Freie Universität Berlin, Germany
- Department of Biochemistry, University of Colorado Boulder and BioFrontiers Institute, United States
- Max Planck Institute for Molecular Genetics, Microscopy Core Facility, Germany
- Helmholtz Institute for Metabolic, Obesity and Vascular Research, Germany
- Department of Data Science, Dana-Farber Cancer Institute, Department of Biostatistics, Harvard T. H. Chan School of Public Health, United States
- Center for Precision Medicine Multi-Omics Research, School of Basic Medical Sciences, Peking University Health Science Center and Peking University Cancer Hospital and Institute, China
- Program in Molecular Medicine, University of Massachusetts Medical School, United States
- Max Planck Institute for Molecular Genetics, Mass Spectrometry Core Facility, Germany
- Diabetes Center of Excellence, University of Massachusetts Medical School, United States
- Department of Stem Cell and Regenerative Biology, Harvard University, United States
- Broad Institute of MIT and Harvard, United States
- Department of Data Science, Dana-Farber Cancer Institute, and Department of Biostatistics, Harvard T. H. Chan School of Public Health, United States
- The Ludwig Center at Harvard, Boston, MA 02215, USA, and Center for Cancer Evolution, Dana-Farber Cancer Institute, United States
Figures
Figure 1 with 1 supplement
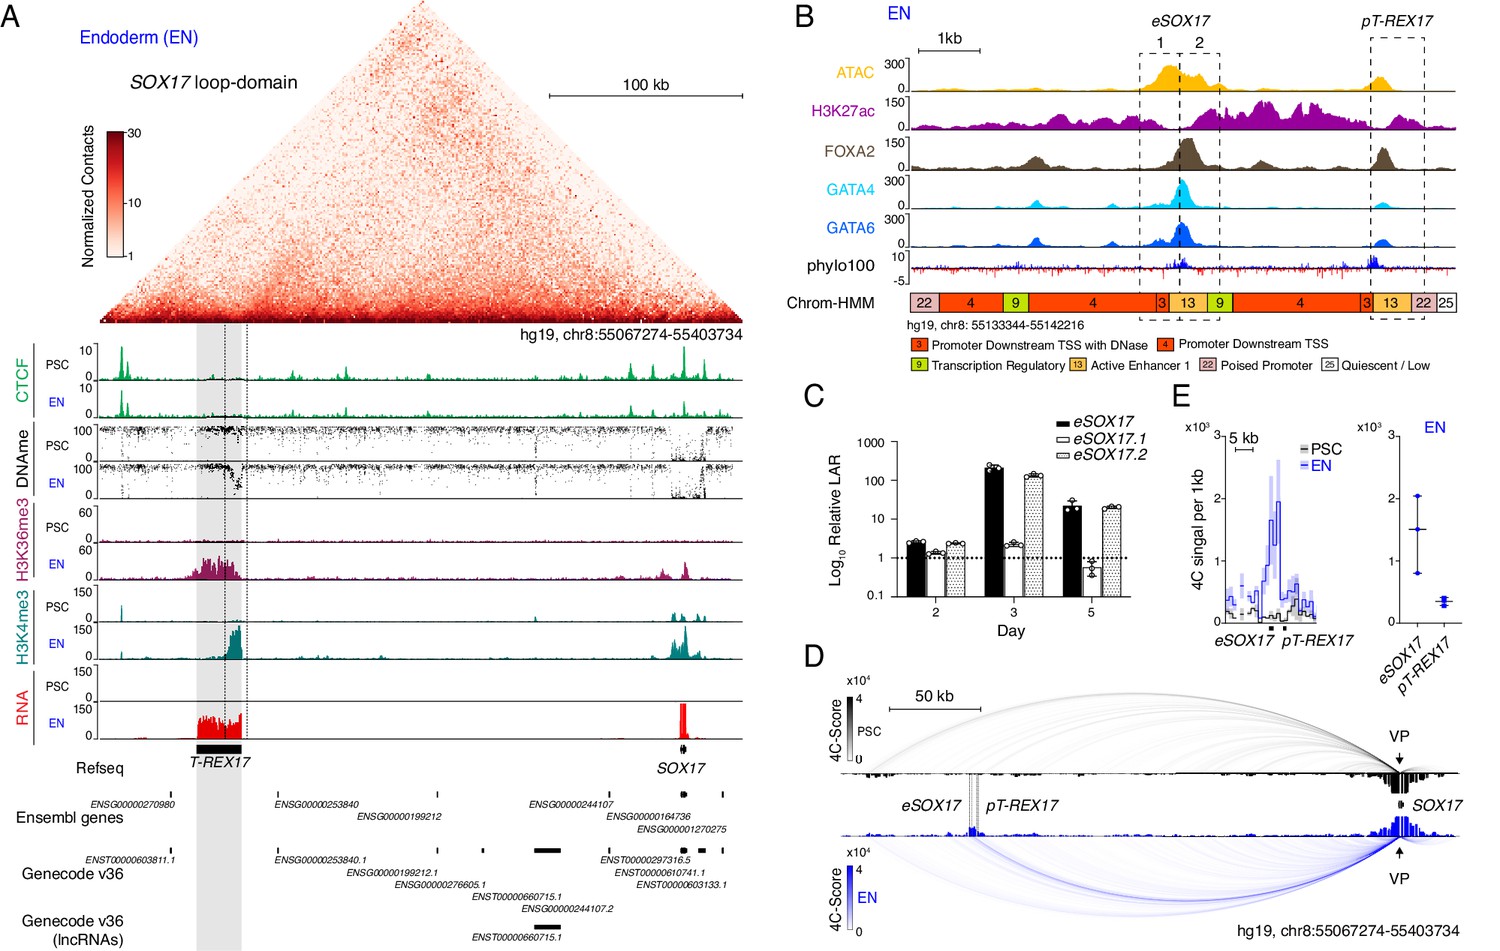
Identification of T-REX17 at the human SOX17 locus.
(A) Normalized capture Hi-C (cHi-C) contact map of the human SOX17 locus in endoderm cells (top panel) and chromatin immunoprecipitation sequencing (ChIP-seq) tracks of CTCF, H3K36me3 and H3K4me3 as well as whole genome bisulfite sequencing (WGBS) (Supplementary file 1) and RNA-seq profiles in PSCs and EN (bottom panel). T-REX17 locus (hg19, chr8:55117776–55140806) is highlighted in grey. (B) Zoomed in view of the SOX17 distal regulatory element in EN cells comprising Assay for Transposase-Accessible Chromatin with high-throughput sequencing (ATAC-seq) profile and H3K27ac, FOXA2, GATA4 and GATA6 ChIP-seq (Supplementary file 1) profiles. Chrom-HMM (Ernst and Kellis, 2015; The ENCODE Project Consortium, 2012) 25-state profile is shown below the phylo100 (Murphy et al., 2001; Pollard et al., 2010) UCSC conservation track. Dashed lines indicate the two distinct regulatory elements, characterized by enriched transcription factors occupancy (eSOX17 and pT-REX17). (C) Firefly luciferase assay from either eSOX17.1 (hg19, chr8:55136923–55137557), eSOX17.2 (hg19, chr8:55137558–55138192) or both together at days 2, 3, or 5 of EN differentiation. Values are calculated as luciferase activity ratio (LAR) between firefly and renilla signal, normalized on empty vector background and day 0 baseline signal. Bars indicate mean values, error bars show standard deviation (SD) across three independent experiments. Individual data points are displayed. Raw measurements are reported in Supplementary file 1. (D) 4Cseq of PSC (black) and EN (blue) at the SOX17-locus. Normalized interaction-scores displayed as arcs and histogram-profiles utilizing the SOX17 promoter as viewpoint (VP). (E) 4Cseq interactions as a zoomed in view at the SOX17 regulatory element and corresponding quantification. In the zoomed in tracks, the line represents the median and the shaded areas depict 95% CI; in the quantification, the central line represents the median and error bars show SD across three independent experiments.
Figure 1—figure supplement 1
Functional characterization of the SOX17 distal regulatory elements.
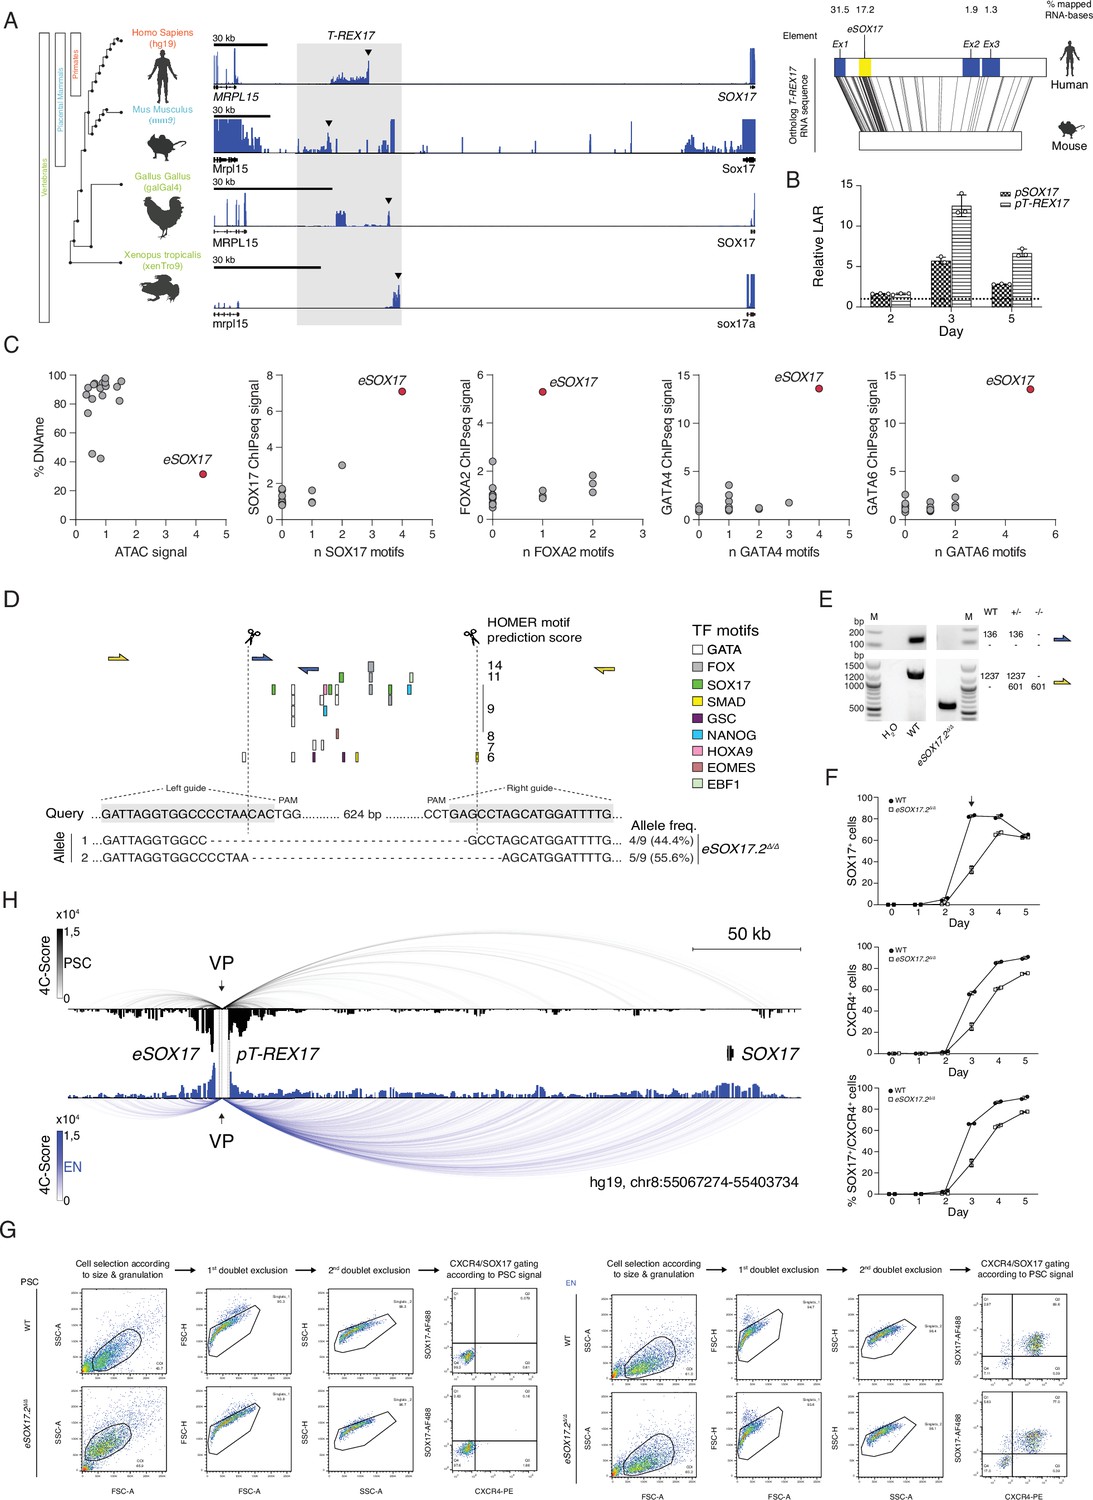
(A) Left panel shows the identification of an unannotated transcript at the SOX17 locus in embryonic stage RNAseq datasets across vertebrates [human (dEN), mouse (dEN), chicken (HH4), and frog (XT11)]. Note how the relative position of the non-coding element (between SOX17 and MRPL15 genes) is conserved in all analyzed species. See Supplementary file 1 for the references to the datasets used in this analysis. The right panel indicates the EMBOSS Water alignment for the human and mouse T-REX17 sequences. Values displayed represent the percentages of mapped bases per element (including substitutions but excluding indels from the human sequence) where mapping is greater than or equal to 20 bases in length (black lines). (B) Firefly luciferase assay from either pT-REX17 (hg19, chr8:55140804–55141678) or pSOX17 (SOX17 promoter) (hg19, chr8:55365464–55370513) at days 2, 3, or 5 of EN differentiation. Values are calculated as luciferase activity ratio (LAR) between firefly and renilla signal, and normalized on the empty vector background and day 0 baseline signal. Bars indicate mean values, error bars show standard deviation (SD) across three independent experiments. Individual data points are displayed. Raw measurements are reported in Supplementary file 1. (C) Scatter plots displaying DNA methylation levels, ATAC signal, endoderm TFs occupancy as measured by ChIP-seq and TFs binding motifs abundance at the T-REX17 locus in EN cells. The T-REX17 transcribed region was binned into 18 bins (dots) of the same size, including eSOX17 (red dot). Note how eSOX17 is depleted of DNA methylation and enriched in ATAC signal, endoderm TFs binding motifs and actual TFs occupancy as compared to the rest of the transcribed region, suggesting a specific regulatory activity. (D) Schematic of the Cas9 based eSOX17.2 gene ablation strategy. Genotyping PCR-products are depicted in (E). sgRNA sequences are highlighted in grey while Cas9 targeting sites are depicted by dashed lines. Sanger sequencing results are summarized below the query-sequence and detected allele-frequency are displayed on the side for each respective genotype. (E) Genotyping PCR-products, generated by two different primer-pairs to profile eSOX17.2 gene ablation (see schematic in D). Expected amplicon-sizes within a particular genetic background are shown on the side of the agarose gel-picture. (F) Line plots showing percentages of either SOX17+, CXCR4+ or SOX17+/CXCR4+ cell-populations at specified time-points during EN differentiation as measured by FACS in wild-type and eSOX17.2 knock-out cells. Symbols indicate the mean and error bars indicate SD across two independent experiments. Individual data points are displayed. (G) Gating strategy to quantify the percentages of SOX17 and CXCR4+ populations used in this study in wild-type and corresponding gating strategy in the eSOX17.2 knock-out. (H) 4C-seq of PSC (black) and EN (blue) at the SOX17 locus. Normalized interaction scores displayed as arcs and histogram profiles utilizing eSOX17 as viewpoint (VP). eSOX17 and pT-REX17 are indicated by dotted lines.
-
Figure 1—figure supplement 1—source data 1
Source data for the genotyping gel in Figure 1—figure supplement 1E.
- https://cdn.elifesciences.org/articles/83077/elife-83077-fig1-figsupp1-data1-v2.zip
Figure 2 with 1 supplement
T-REX17 cellular and molecular characterization.
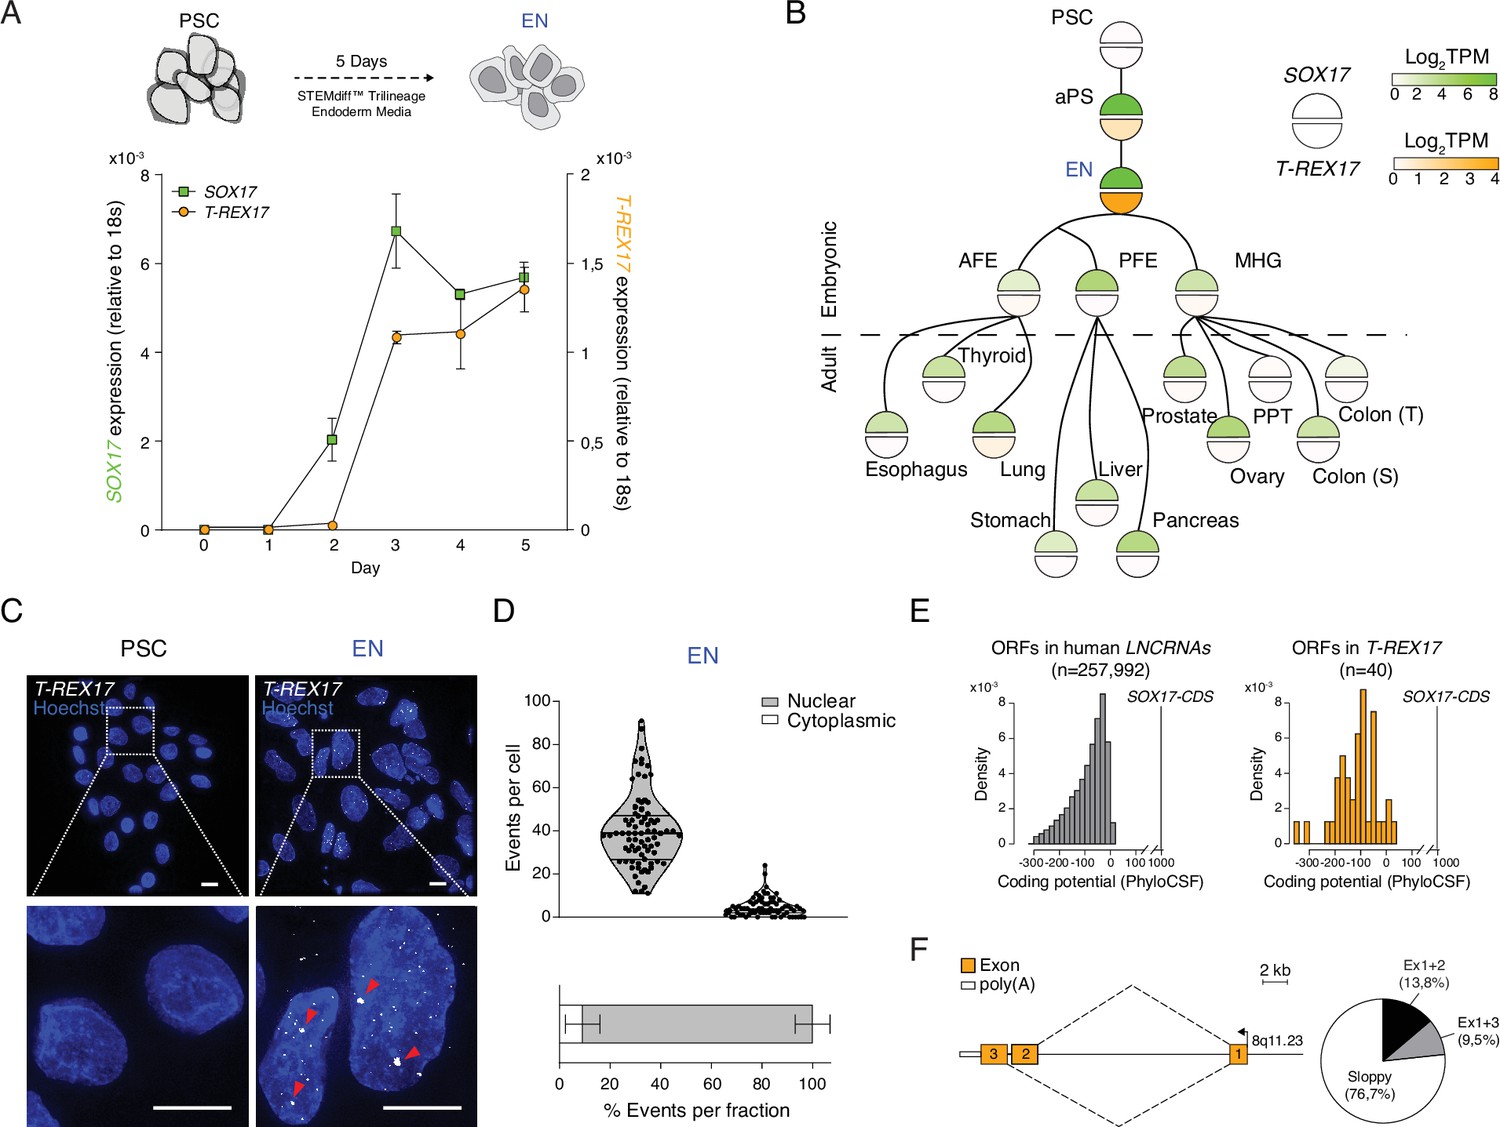
(A) Time resolved qRT-PCR profiling SOX17 (green) and T-REX17 (orange) transcript levels during endoderm differentiation (normalized to the housekeeping gene 18s). Symbols indicate the mean and error bars indicate SD across three independent experiments. (B) Lineage tree heatmap showing SOX17 (green) and T-REX17 (orange) expression across EN derived embryonic and adult tissues as measured by RNA-seq, extracted from a curated data set of the Roadmap Epigenome Project (Roadmap Epigenomics Consortium et al., 2015; Supplementary file 1). TPM, transcripts per million. aPS, anterior primitive streak; AFE, anterior foregut endoderm; PFE, posterior foregut endoderm; MHG; mid-hindgut; PPT, Peyer’s patch tissue; S, sigmoid; T, transverse. (C) smRNA-FISH of T-REX17 in PSCs (left) and EN cells (right) counter-stained with Hoechst. Red arrowheads indicate two brighter and bigger foci present in each cell, potentially representing sites of nascent transcription. Scale bars, 10 µm. (D) Frequencies of T-REX17 smRNA-FISH foci in the nuclear (grey) or the cytoplasmic (white) compartments. n=79, number of analyzed cells. Lines of the violin plot indicate interquartile range around the median value. In the stacked barplot, error bars indicate SD around the mean value. (E) Barplots showing coding potential scores of randomly sampled LNCRNA ORFs (n=257,992) (grey) versus T-REX17 ORFs (n=40) (orange). Scores are shown on the x-axis while ORF-density is plotted on the y-axis. Both conditions area is equal and compared to SOX17 ORFs as coding gene control. n, number of analyzed ORFs. (F) Schematic of T-REX17 isoform structure derived from MinION-seq reads of endoderm cDNA. Exons are shown in orange while the poly(A) is shown in white. The arrow indicates the transcriptional start site (TSS). Pie chart shows isoform reads (Ex1+2 black n=16, Ex1+3 grey n=11) and ‘sloppy spliced’ (white n=89) transcript distribution as measured by MinIONseq (Supplementary file 1).
Figure 2—figure supplement 1
T-REX17 tissue distribution and structural characterization.
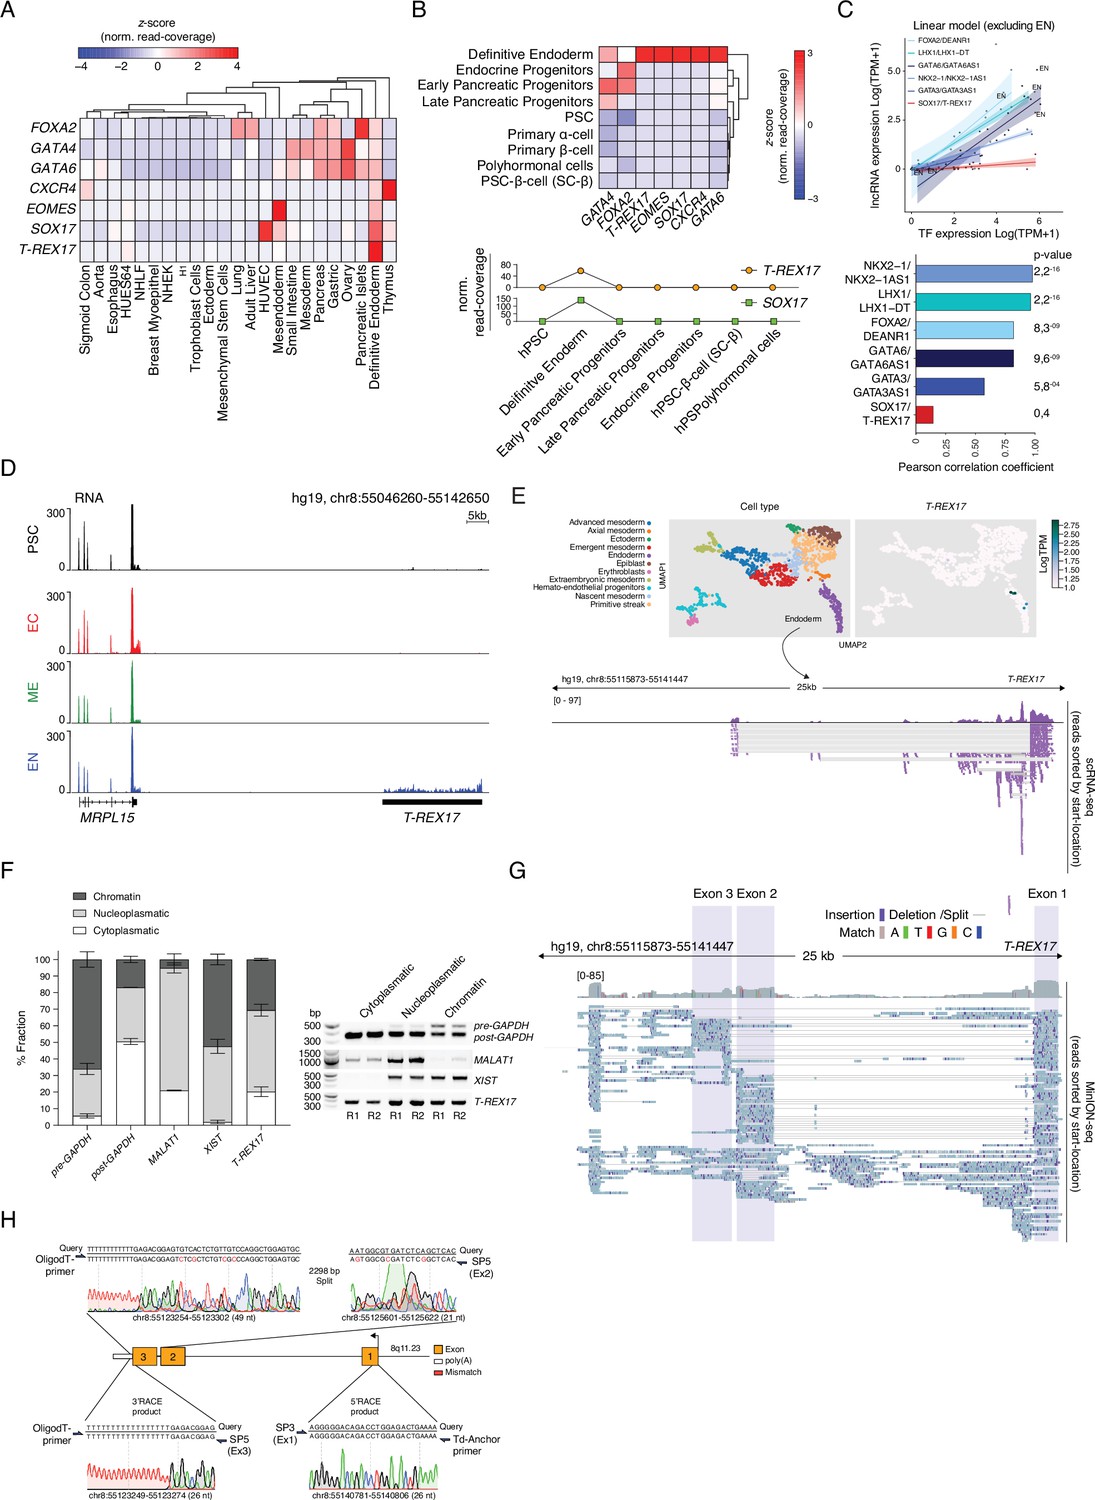
(A) Heatmap showing row-normalized z-scores of EN marker genes and T-REX17 expression across various embryonic and adult tissues as measured by RNA-seq. The tree represents hierarchical clustering (based on Euclidean distance). RNA-seq expression values are calculated as normalized row-read-coverage. Note the high specificity of T-REX17 expression as compared to a much broader expression of endodermal transcription factors, including SOX17. A list of the curated dataset from the Roadmap Epigenome project used in this heatmap is provided in Supplementary file 1. (B) Heatmap showing column-normalized z-scores of EN marker genes and T-REX17 expression during in vitro pancreatic lineage differentiated cell types including primary isolated α- and β-cells as measured by RNA-seq (Alvarez-Dominguez et al., 2020) (upper panel). The tree represents hierarchical clustering (based on Euclidean distance). RNA-seq expression values are calculated as normalized row-read-coverage. T-REX17 and SOX17 expression profiles plotted as row-read-coverage normalized z-scores of the indicated in vitro generated cell type during pancreatic differentiation (lower panel). Note the transient and restricted expression of T-REX17 specifically in definitive endoderm. (C) Scatter plot showing the expression of a set of endoderm lncRNAs (DEANR1, LHX1-DT, GATA6AS1, NKX2-1AS1, GATA3AS1, T-REX17) and the corresponding TFs (FOXA2, LHX1, GATA6, NKX2-1, GATA3, SOX17) in the same set of EN tissues of Figure 2B. A linear model excluding the expression in EN was fit for each lncRNA-TF couple. Pearson correlation coefficients as well as corresponding p-values are displayed in the bar-plot (bottom panel). Note that the T-REX17-SOX17 couple has the lowest degree of tissue co-expression. (D) Genome browser tracks displaying RNA levels at the T-REX17 locus in PSCs and the three germ layers. Note T-REX17 expression specificity as compared to MRPL15. (E) Uniform Manifold Approximation and Projection for Dimension Reduction (UMAPs) showing cell states (upper left panel) and T-REX17 expression (upper right panel) in cells derived from a human gastrulating embryo (Tyser et al., 2021). ScRNA-seq track from cells belonging to the endoderm cluster showing reads mapping to the T-REX17 locus (bottom panel). (F) Cell fractionation of endodermal cells followed by RT-PCR, agarose gel purification and band intensity quantification. Right panel indicates PCR products of respective target gene RNA of the respective cell fraction. Left panel indicates relative band intensity quantification (provided in Supplementary file 1) of respective cell fraction (dark grey=chromatin fraction, light grey=nucleoplasmatic fraction, white = cytoplasmatic fraction) from RT-PCR-products in the left panel. Bar heights of each fraction represent mean values, error bars indicate SD (n=2). (G) MinION-seq reads track showing T-REX17 coverage and structure in endodermal cells. Sequencing read distribution histogram (top) and individual reads sorted by their start location (bottom) are displayed. Exon 1, 2, and 3 are highlighted by shading boxes. Sequence mismatches and matches are color coded as described. Split reads and deletions are shown as thin horizontal lines. (H) Sanger sequencing of 3’/5’ RACE PCR products. Amplicon-specific sequencing results are shown below the query sequence (hg19). Sequencing mismatches are highlighted in red. Primer pairs relative positions used for the PCRs are shown for each product. Sanger sequencing chromatogram color code is used to show the raw reads data.
-
Figure 2—figure supplement 1—source data 1
Source data for the cell fractionation assay in Figure 2—figure supplement 1F.
- https://cdn.elifesciences.org/articles/83077/elife-83077-fig2-figsupp1-data1-v2.zip
-
Figure 2—figure supplement 1—source data 2
Sanger sequencing files for the 5’ and 3’ RACE experiment in Figure 2—figure supplement 1H.
- https://cdn.elifesciences.org/articles/83077/elife-83077-fig2-figsupp1-data2-v2.zip
Figure 3 with 2 supplements
T-REX17 regulation at the SOX17 topological domain.
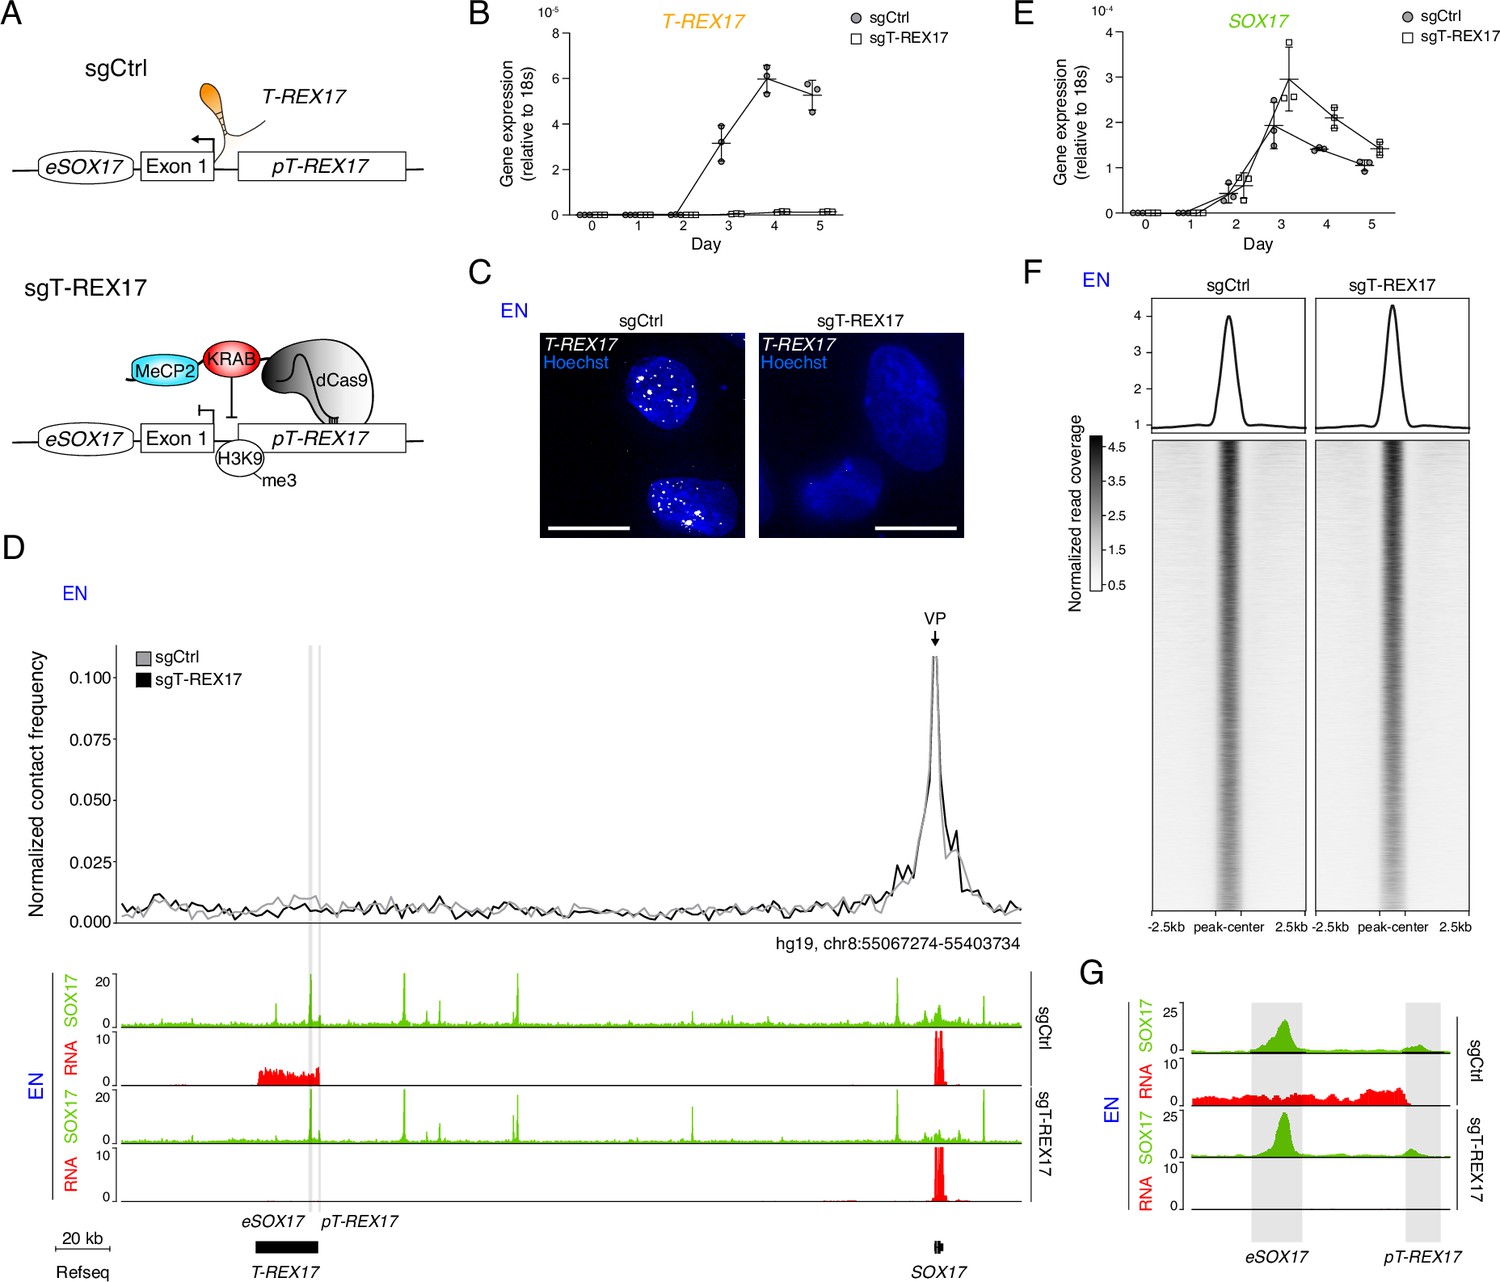
(A) Schematic of T-REX17 locus regulation in the absence (top) or presence (bottom) of a targeting dCas9-KRAB-MeCP2 complex, decorating T-REX17 promoter with an H3K9me3 mark 355 bp upstream of the TSS. (B) Time-resolved qRT-PCR showing the expression of T-REX17 during EN differentiation in the presence or absence of dCas9-KRAB-MeCP2 complex targeting T-REX17 promoter (normalized to the housekeeping gene 18s). Symbols indicate the mean and error bars indicate SD across three independent experiments. Individual data points are displayed. (C) smRNA-FISH of T-REX17 in sgCtrl (left) and sgT-REX17 (right) EN cells counter-stained with Hoechst. Scale bars, 10 µm. For an extended field of view see Figure 3—figure supplement 1B. (D) Virtual 4C analysis from capture Hi-C experiments in sgCtrl and sgT-REX17 EN cells using SOX17 promoter as viewpoint, with 2 kb resolution (upper panel). SOX17 EN ChIP-seq (RPKM) and RNA-seq (CPM) profiles in the two conditions are shown in the tracks (lower panel). eSOX17 and pT-REX17 are highlighted in grey. (E) Time-resolved qRT-PCR showing the expression of SOX17 during EN differentiation in the presence or absence of dCas9-KRAB-MeCP2 complex targeting T-REX17 promoter (normalized to the housekeeping gene 18s). Symbols indicate the mean and error bars indicate SD across three independent experiments. Individual data points are displayed. (F) Heatmap showing SOX17 binding distribution genome-wide in sgCtrl and sgT-REX17 EN. The displayed peaks represent the union of the identified peaks in the two conditions (n=61.153). (G) SOX17 ChIP-seq and RNA-seq tracks at the T-REX17 locus showing SOX17 binding at the SOX17 enhancer (eSOX17) and T-REX17 promoter (pT-REX17). SOX17 binding on pT-REX17 results in T-REX17 activation, if pT-REX17 is not targeted by dCas9-KRAB-MeCP2.
Figure 3—figure supplement 1
SOX17 and T-REX17 reciprocal gene expression regulation.
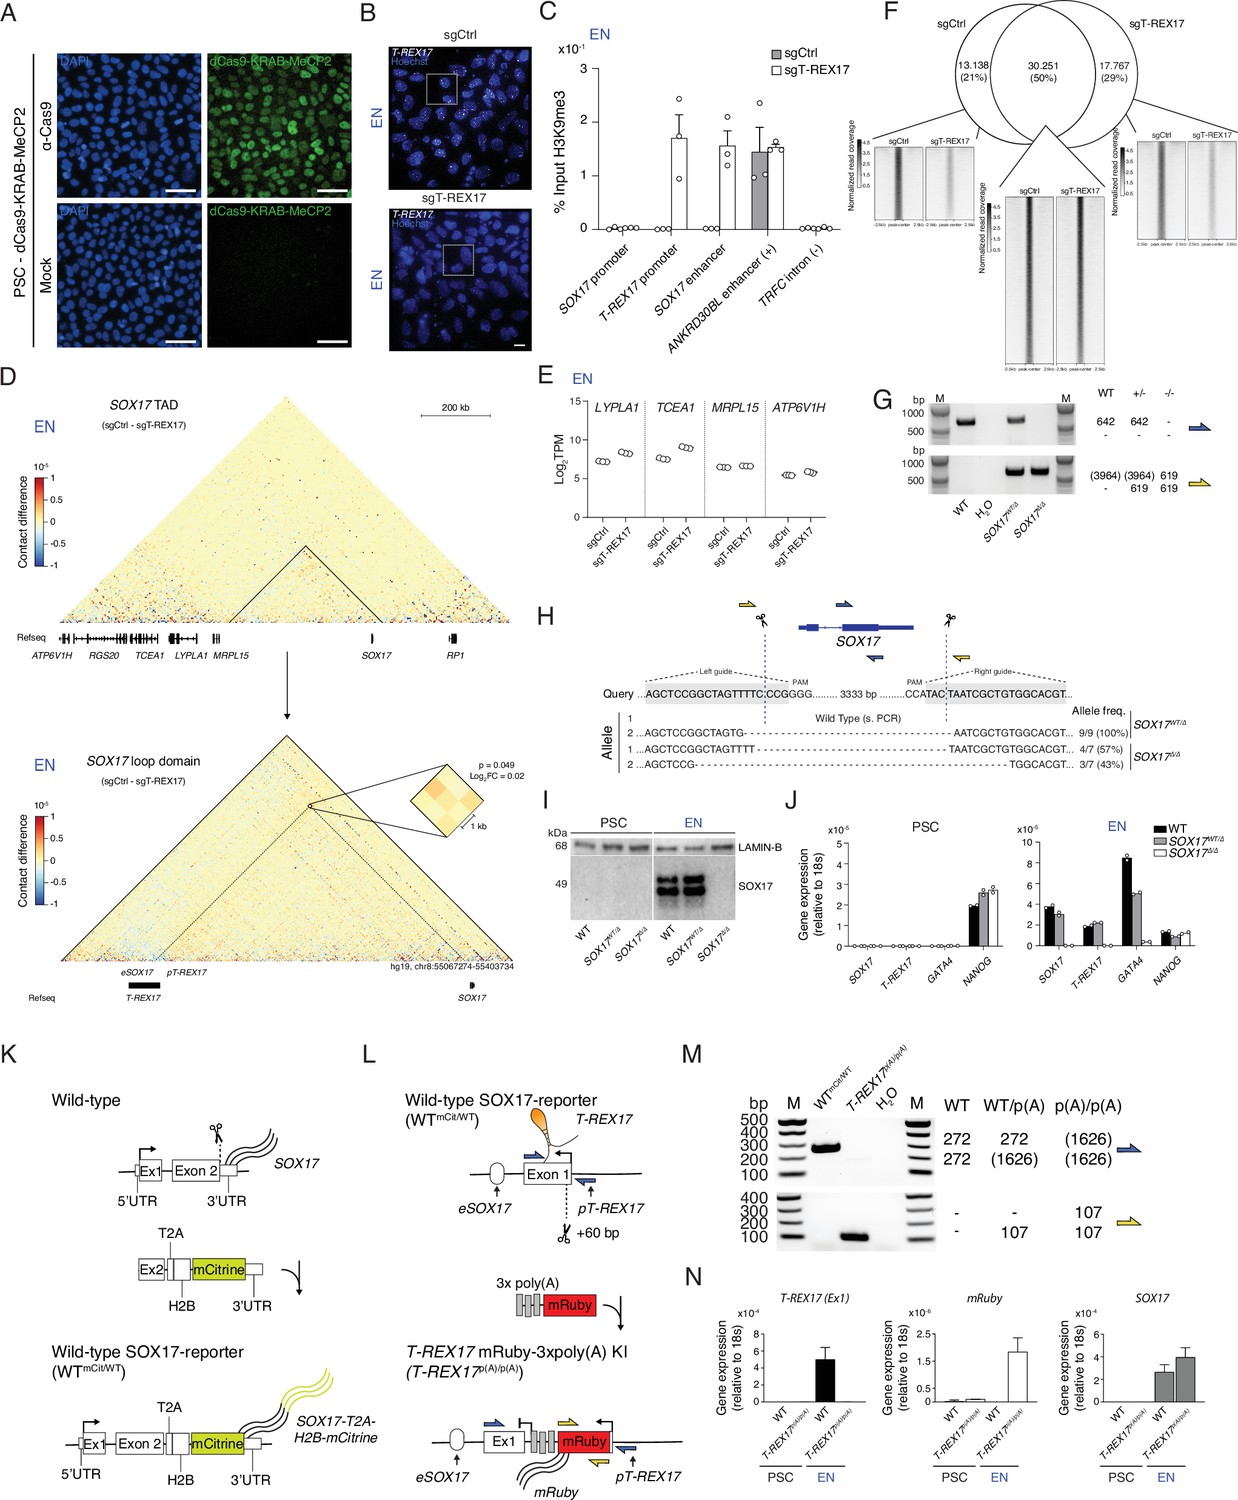
(A) IF staining for dCas9 in PSCs expressing dCas9-KRAB-MeCP2 and counter-stained with DAPI. Mock samples represent secondary antibody only controls. Scale bars, 50 µm. (B) smRNA-FISH of T-REX17 in sgCtrl (left) and sgT-REX17 (right) EN cells counter-stained with Hoechst. Scale bars, 10 µm. Magnified regions are shown in Figure 3C. (C) H3K9me3 ChIP-qPCR enrichment percentages over input is represented at different regions of the genome in sgCtrl and sgT-REX17 endoderm cells. Bars indicate mean values, error bars indicate the SD across three independent experiments. See raw data in Supplementary file 4. (D) Capture Hi-C sequencing subtraction map of the EN sgCtrl-sgT-REX17 at the SOX17 locus and at the SOX17 loop domain. eSOX17 loop interaction with SOX17 promoter is shown in the magnification and highlighted by the dotted lines (significance threshold: log2FC ± 0.5, p<0.01). (E) Boxplots showing log2TPM values for genes in SOX17 neighboring TAD in sgCtrl and sgT-REX17 endoderm cells as measured by RNA-seq. Boxes indicate 25th and 75th percentiles, central lines indicate the median and whiskers show min and max values. (F) Euler diagram showing the overlap between SOX17 ChIP-seq peaks identified in sgCtrl and sgLNCOSOX17. The displayed peaks represent the union of the identified peaks in the two conditions (n=61.694), also displayed in Figure 3F. (G) Genotyping PCR-products, generated by two different primer pairs to profile SOX17 gene ablation (see schematic in G). Expected amplicon sizes within a particular genetic background are shown on the side of the agarose gel picture. (H) Schematic of the Cas9 based SOX17 gene ablation strategy. Genotyping PCR products are depicted in (E). sgRNA sequences are highlighted in grey while Cas9 targeting sites are depicted by dashed lines. Sanger sequencing results are summarized below the query sequence and detected allele frequency are displayed on the side for each respective genotype. (I) Western Blot showing SOX17 levels in PSCs and EN cells for the three indicated genotypes. LAMIN-B is used as loading control. (J) qRT-PCR showing SOX17, T-REX17, GATA4 and NANOG expression in PSCs and EN cells for the three indicated genotypes. Fold change is calculated relative to the 18s housekeeping gene. Bar indicate the means, error bars represent SD across three independent replicates. (K) Schematic of the strategy to generate the SOX17-mCitrine reporter cell line. (L) Schematic of the strategy to generate the T-REX17p(A)/p(A) cell line. (M) Genotyping PCR products, generated by two different primer pairs to profile the early poly(A) knock-in. Expected amplicon sizes within a particular genetic background are shown on the side of the agarose gel picture. (N) qRT-PCR showing T-REX17, mRuby, and SOX17 expression in PSCs and EN cells for the two indicated genotypes. Fold change is calculated relative to the 18s housekeeping gene. Bar indicate the means, error bars represent SD across three independent replicates.
-
Figure 3—figure supplement 1—source data 1
Source data for the genotyping gels and blot in Figure 3—figure supplement 1G, I, M.
- https://cdn.elifesciences.org/articles/83077/elife-83077-fig3-figsupp1-data1-v2.zip
Figure 3—figure supplement 2
T-REX17 interacts with HNRNPU.
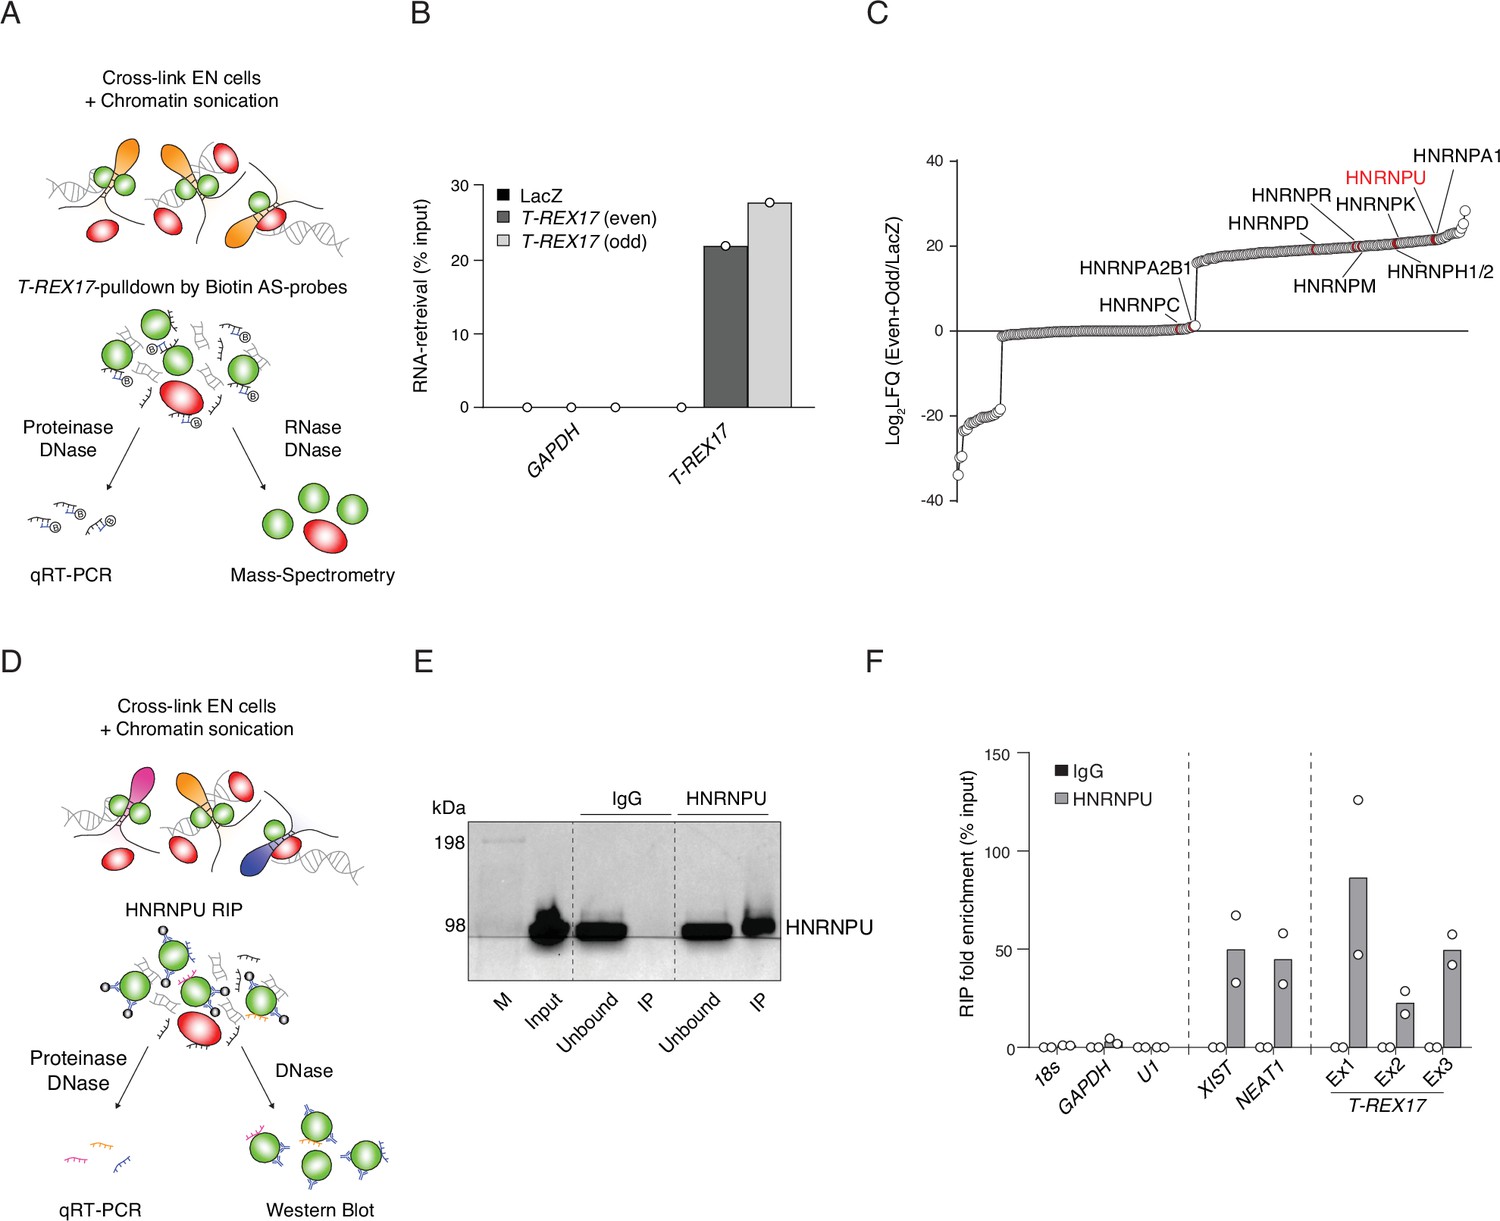
(A) Schematic representation of T-REX17 RNA-pulldown experimental workflow. (B) T-REX17-pulldown qPCR showing enrichment of T-REX17 in both Even and Odd probe sets samples as compared to LacZ in endoderm cells. GAPDH RNA has been used as a negative control. (C) Ranked T-REX17 protein interaction partners as measured by mass spectrometry. Log2LFQ (Even +Odd/LacZ) has been calculated for each measured peptide to highlight protein partners which are enriched in Even and Odd samples as compared to LacZ sample (positive values). LFQ, Label Free Quantification. (D) Schematic representation of HNRNPU RNA immunoprecipitation (RIP) experimental workflow. (E) Western Blot showing HNRNPU enrichment in the HNRNPU IP as compared to IgG control. Unbound sample represents post-IP supernatant. (F) RIP-qPCR showing enrichment of T-REX17 in HNRNPU IP as compared to IgG in endoderm cells. 18s, GAPDH, and U1 RNAs have been used as negative controls, while XIST and NEAT1 as positive controls. Exon-specific primer pairs have been used to probe T-REX17-HNRNPU interaction. Dots indicate two independent biological replicates.
-
Figure 3—figure supplement 2—source data 1
Source data for the blot in Figure 3—figure supplement 2E.
- https://cdn.elifesciences.org/articles/83077/elife-83077-fig3-figsupp2-data1-v2.zip
Figure 4 with 2 supplements
Endodermal defects in cells depleted of T-REX17.
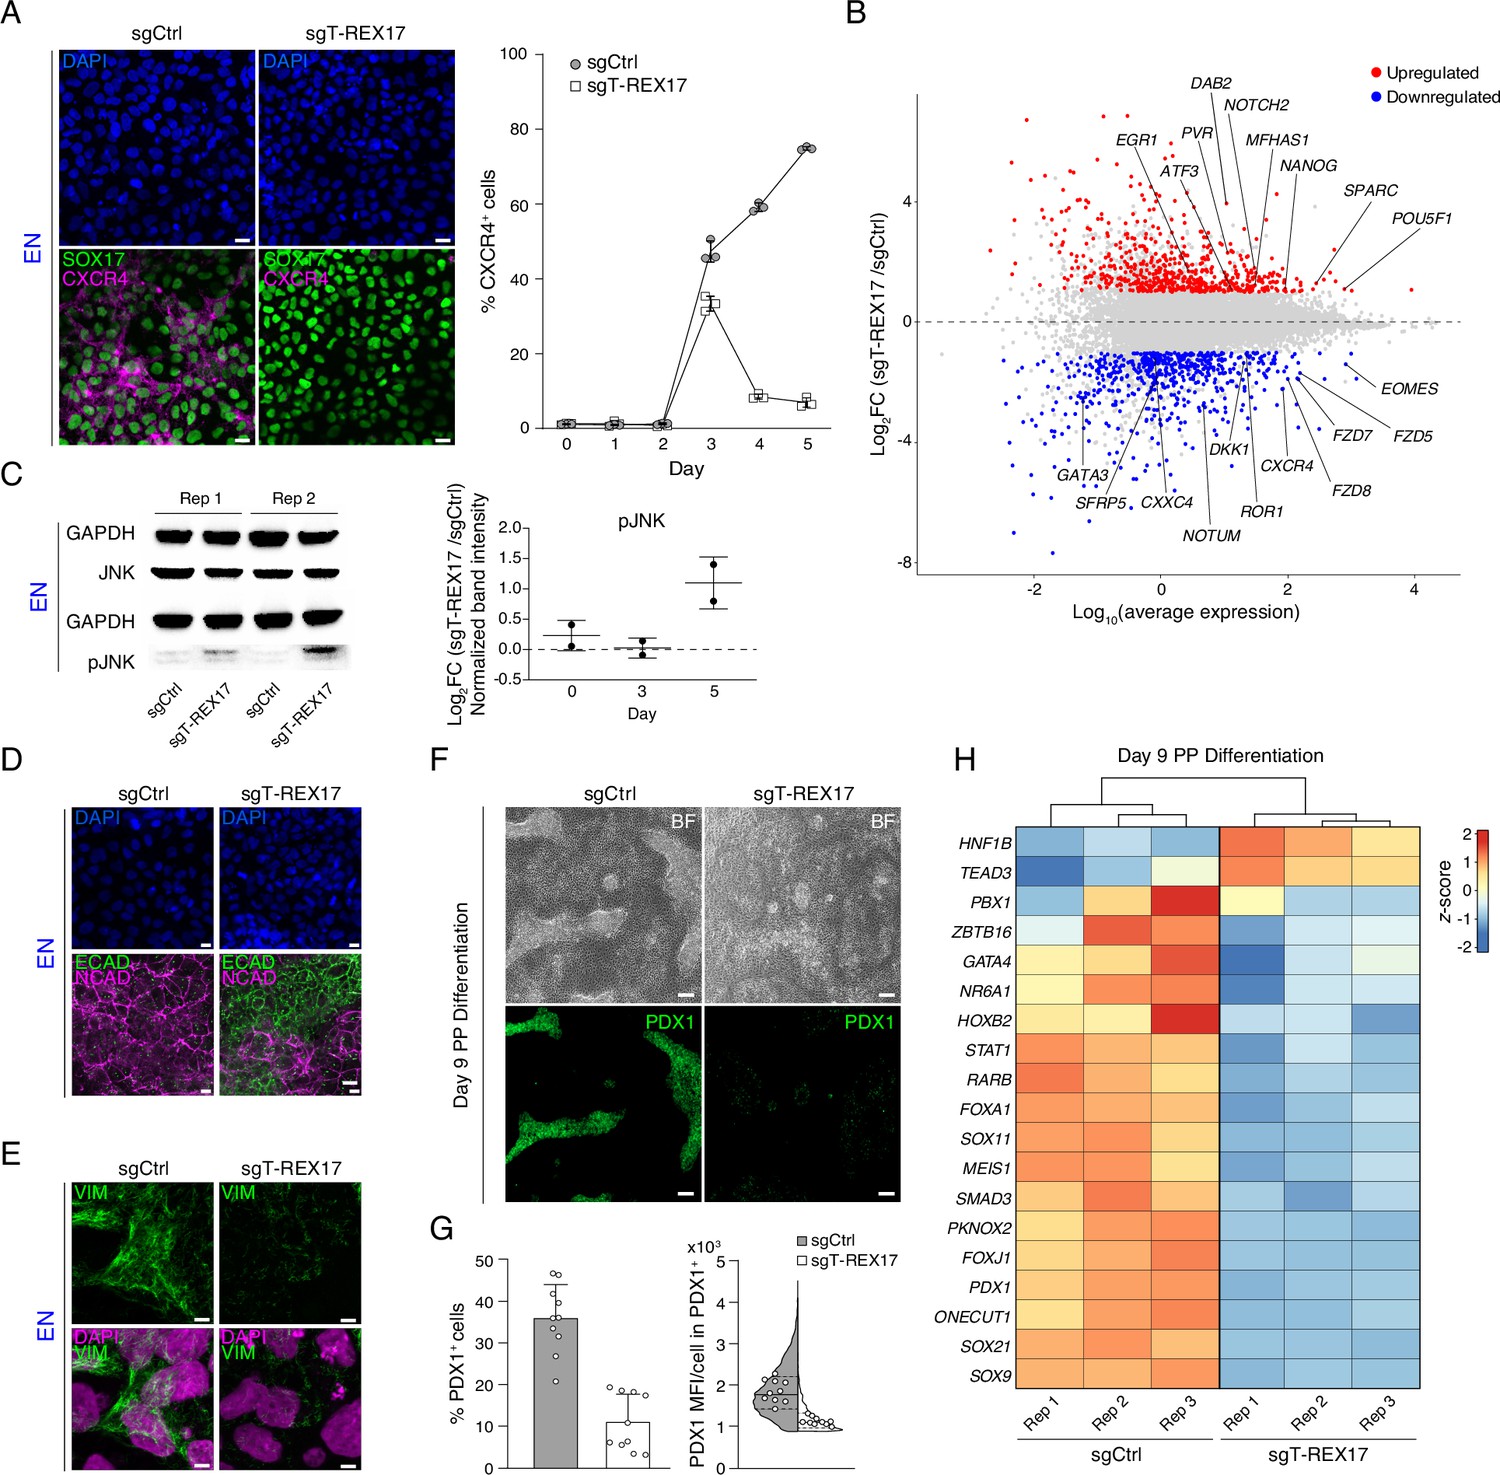
(A) Immunofluorescent (IF) staining of SOX17 and CXCR4 in EN cells expressing either sgCtrl or sgT-REX17 counter-stained with DAPI (left panel). Line plot showing percentage of FACS-derived CXCR4+ cell population at given time points during endoderm differentiation (right panel). Symbols indicate mean values, while error bars show SD across three independent experiments. Individual data points are displayed. Scale bars, 10 µm. (B) Scatter plot highlighting differentially expressed genes between sgT-REX17 and sgCtrl EN cells. Significantly (Log2FC ≥1, p-value <0.05) upregulated genes (n=590) upon T-REX17 repression are shown in red while significantly (Log2FC ≤ –1, p-value <0.05) down-regulated genes (n=584) are shown in blue. Three independent replicates have been performed. The complete lists of TPMs and differentially expressed genes are provided in Supplementary file 2. (C) JNK and pJNK western blots of sgCtrl and sgT-REX17 EN cells (left panel). GAPDH signals are used as loading controls above the corresponding JNK/pJNK signals. Boxplot showing relative pJNK levels during endoderm differentiation. Quantification is depicted as Log2FC of sgT-REX17 over sgCtrl (right panel) and provided in Supplementary file 1. Central line indicates the mean, error bars indicate the SD across two independent experiments. Differentiation time-course blots are shown in Figure 4—figure supplement 2A. (D) IF staining of ECAD and NCAD in EN cells expressing either sgCtrl or sgT-REX17 counter-stained with DAPI. Scale bars, 10 µm. (E) IF staining of VIM in EN cells expressing either sgCtrl or sgT-REX17 counter-stained with DAPI. Scale bars, 5 µm. (F) Bright field images of PP differentiation cultures (upper panel) followed by IF staining for PDX1 (lower panel) of either sgCtrl or sgT-REX17 cells. Scale bars, 10 µm. (G) IF staining quantification of overall (sgCtrl, n=17.657, sgT-REX17, n=5.279 analyzed cells) PDX1+ population percentages (left) or PDX1 mean fluorescence intensity distribution in PDX1+ cells (right). Bar plot error bars indicate SD around the mean value and white dots represent mean values for the individual replicates (N=10). Lines of the violin plot indicate interquartile range around the median value and white dots represent median values for the individual replicates (N=10). List of values for each cell and corresponding statistics are shown in Supplementary file 4. (H) Heatmap showing row-normalized z-scores of PP specific marker genes (Alvarez-Dominguez et al., 2020) in sgCtrl and sgT-REX17 EN cells as measured by RNA-seq at day 9 of differentiation. Columns were ordered by hierarchical clustering (represented as tree above the heatmap). Note the reduced expression of PP master transcription factor PDX1 in sgT-REX17 as compared to sgCtrl. The complete lists of TPMs and differentially expressed genes are provided in Supplementary file 2.
-
Figure 4—source data 1
Source data for the blot in Figure 4C.
- https://cdn.elifesciences.org/articles/83077/elife-83077-fig4-data1-v2.zip
Figure 4—figure supplement 1
Molecular phenotypes associated with the loss of T-REX17.
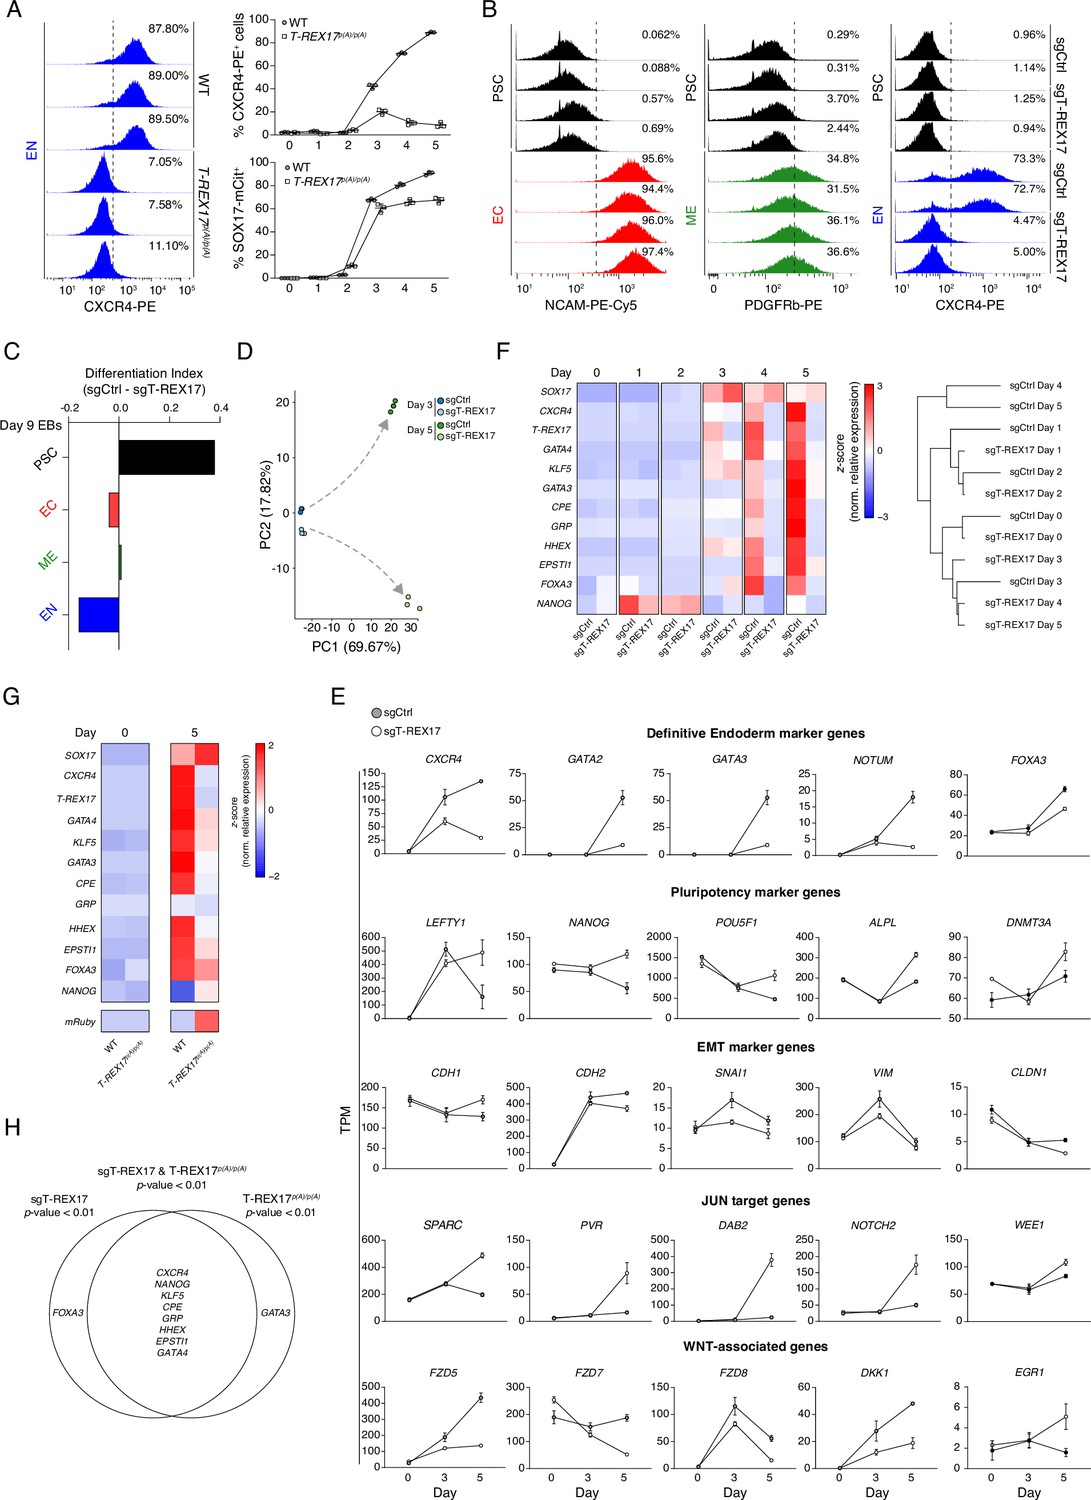
(A) FACS histograms showing percentages of CXCR4+ cells during EN differentiation of wild-type and T-REX17p(A)/p(A) cell lines (left), Sample sizes are normalized to 10,000 cells /sample. In the right panel, FACS time-course experiment showing percentages of CXCR4+ and SOX17-mCitrine+ cells during EN differentiation of wild-type and T-REX17p(A)/p(A) cell lines. Three independent replicates are displayed. (B) FACS histograms showing percentages of successfully differentiated cells during directed differentiation of sgCtrl and sgT-REX17 lines toward the three germ layers. Sample sizes are normalized to 8000 cells /sample. Two independent replicates are displayed. Note how no difference in percentages of differentiated cells is observed for the ectodermal and mesodermal trajectories, while a strong reduction is present in sgT-REX17 cells differentiating toward EN. (C) ScoreCard assay displaying differentiation index in sgCtrl or sgT-REX17 day 9 differentiated embryoid bodies (EBs) (n=48 EBs per line). (D) PCA of the 1000 most variable genes between day 3 and day 5 differentiation of sgCtrl and sgT-REX17 as measured by RNA-seq. Gray dashed arrows indicate the two divergent transcriptomic trajectories. (E) Line plots displaying time-resolved expression of selected marker genes in sgCtrl and sgT-REX17 cells as measured by RNA-seq (TPM). Marker genes categories are indicated. Symbols indicate mean values and error bars represent SD across three independent experiments. EMT, epithelial-to-mesenchymal transition. (F) Heatmap showing time-resolved qRT-PCR for endoderm specific marker genes during EN differentiation in sgCtrl and sgT-REX17 cell lines (left) and corresponding hierarchical clustering tree (Euclidean distance) (right). (G) Heatmap showing qRT-PCR for endoderm specific marker genes during EN differentiation in WT and T-REX17p(A)/p(A) cell lines. (H) Venn diagram displaying the intersection between genes differentially expressed in the sgT-REX17 and T-REX17p(A)/p(A) EN cells. Significantly downregulated (p<0.01) in both conditions are displayed in the intersection.
Figure 4—figure supplement 2
Cellular phenotypes associated with the loss of T-REX17.
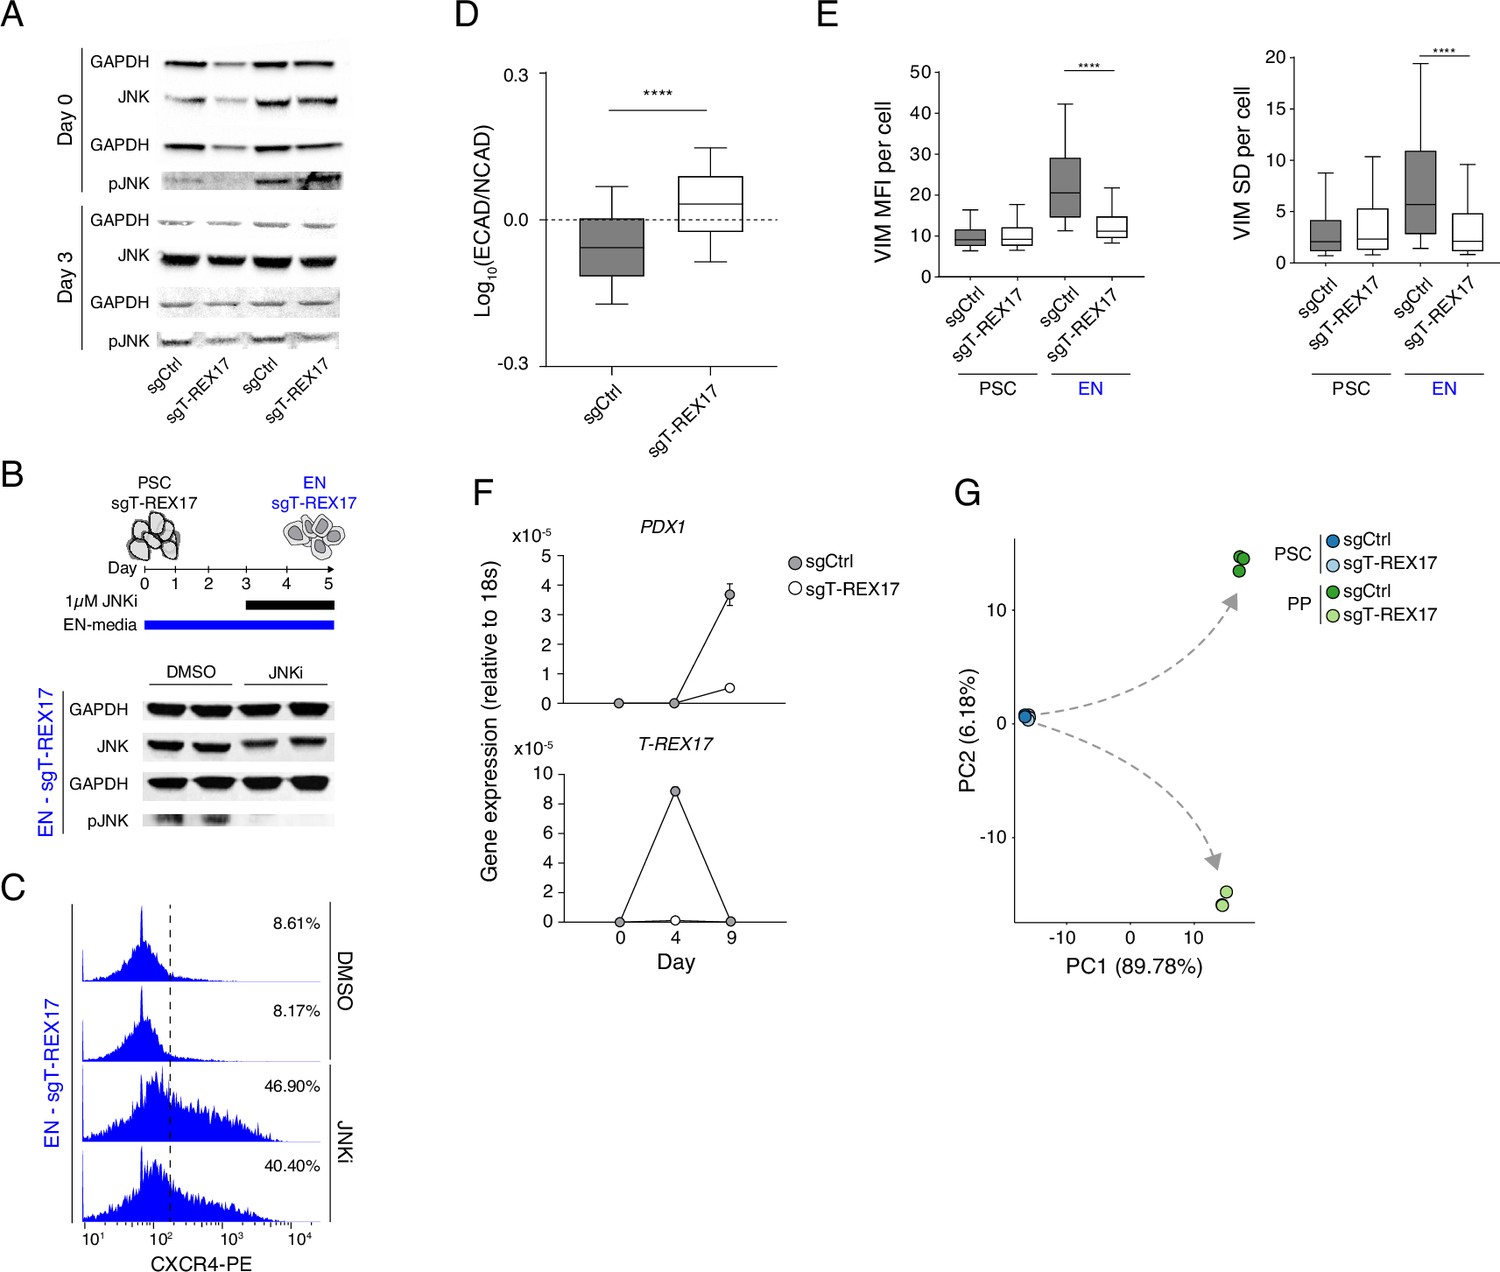
(A) Western blot showing the levels of JNK and pJNK during EN differentiation in sgCtrl and sgT-REX17 cell lines. Two independent replicates are displayed. GAPDH is used as loading control. (B) Western blot showing the levels of JNK and pJNK during EN differentiation in sgT-REX17 cell line in the presence or absence of JNK Inhibitor XVI from day 3 of EN differentiation (see schematic). Two independent replicates are displayed. GAPDH is used as loading control. (C) FACS histograms showing percentages of successfully differentiated cells during directed differentiation of sgT-REX17 line toward EN in the presence or absence of JNK Inhibitor XVI as measured by CXCR4+ cells, sample sizes are normalized to 8000 cells /sample. Two independent replicates are displayed. Note how the treatment with JNKi partially rescues the differentiation phenotype in cells lacking T-REX17. (D) IF stainings (Figure 4D) quantification showing Log10 (ECAD/NCAD) signal ratios from sgCtrl (n=28.002) and sgT-REX17 (n=24.284) EN cells. Boxes indicate 25th and 75th percentiles, central line indicate the median and whiskers show SD; p-value <0.0001. List of values for each cell are shown in (Supplementary file 4). (E) IF staining (Figure 4E) quantification of per cell VIM signal (left) or VIM SD (right) of PSCs or EN sgCtrl (n PSCs = 3.058, n EN = 11.425) and sgT-REX17 (n PSCs = 2.329, n EN = 14.155) cells. VIM signal SD in the cellular compartment is used here as a measure of cellular polarization (see Material and methods). Boxes indicate 25th and 75th percentiles, central line indicate the median and whiskers show 10th and 90th percentiles; p-value < 0.0001 for both plots. List of values for each cell are shown in (Supplementary file 4). (F) qRT-PCR showing the expression of PDX1 (upper panel) and T-REX17 (lower panel) during PP differentiation of sgCtrl and sgT-REX17 cells. Fold change is calculated relative to the 18s housekeeping gene. Symbols indicate mean values and error bars indicate SD across three independent experiments. (G) PCA of the 1000 most variable genes between sgCtrl and sgT-REX17 in PSCs and PP as measured by RNA-seq. Gray dashed arrows indicate the two divergent transcriptomic trajectories.
-
Figure 4—figure supplement 2—source data 1
Source data for the blots in Figure 4—figure supplement 2A, B.
- https://cdn.elifesciences.org/articles/83077/elife-83077-fig4-figsupp2-data1-v2.zip
Author response image 1
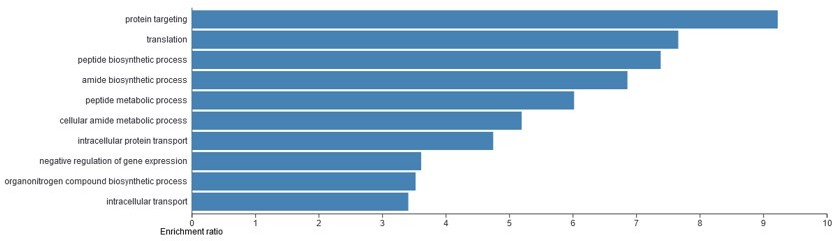
Gene ontology (GO) analysis of the candidate T-REX17 protein interactors as measured by RNA pulldown followed by mass spectrometry.
Blue bars represent significant (FDR<0.05) biological process identified. The analysis was performed using WEB-based GEne SeT AnaLysis Toolkit (WebGESTALT).
Author response image 2
Author response image 3
Author response image 4
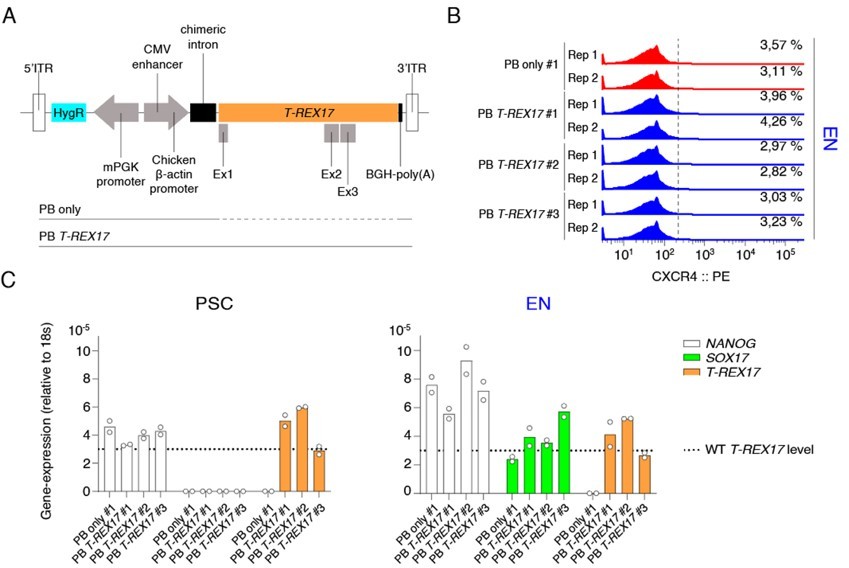
PiggyBAC (PB) integrated constitutive T-REX17 rescue.
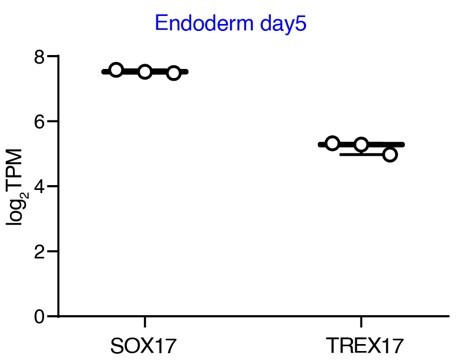
(A) Schematic of the ectopic PB T-REX17 construct. Lines indicate randomly integrated sequence context for empty backbone (PB only) or T-REX17 (PB T-REX17). (B) FACS histograms showing percentages of CXCR4+ cells during EN differentiation of sgT-REX17 dCas9-KRAB-MeCP2 cells of PB only or PB T-REX17 clones. Clone numbers are indicated. Sample sizes are normalized to 9000 cells /sample. Two independent experiments are displayed. (C) qRT-PCR showing NANOG, SOX17 and T-REX17 expression in PSCs and EN cells of sgT-REX17 dCas9-KRAB-MeCP2 cells integrated for either with PB only or PB T-REX17. Clone numbers are indicated. Fold change is calculated relative to the 18s housekeeping gene. Bar indicate the means, two independent experiments are represented. T-REX17 wild type levels are indicated by the dashed line. Note, ectopic T-REX17 is constantly expressed throughout differentiation.
Additional files
-
Supplementary file 1
List of external data sets used in this study.
Luciferase assay raw and normalized data for eSOX17, eSOX17.1, eSOX17.1, pSOX17 and pT-REX17 of respective day of endodermal differentiation. Cell fractionation RT-PCR relative band-intensity quantification. MinION split reads extracted from IGV junctions-track BAM files. T-REX17 isoform sequences. Wetsern Blot relative band-intensity quantification.
- https://cdn.elifesciences.org/articles/83077/elife-83077-supp1-v2.xlsx
-
Supplementary file 2
RNAseq data set with TPM values from undifferentiated (iPSC), day 3 and day 5 endoderm differentiated sgCtrl and sgT-REX17 CRISPRi cells. Differential gene expression analysis of RNAseq data between sgCtrl and sgT-REX17 from respective days of endoderm differentiated cells. RNAseq data sets with TPM values from day 9 pancreatic precursor (PP) differentiated sgCtrl and sgT-REX17 CRISPRi cells. Differential gene expression analysis of RNAseq data between sgCtrl and sgT-REX17 from respective days of pancreatic precursor differentiation.
- https://cdn.elifesciences.org/articles/83077/elife-83077-supp2-v2.xlsx
-
Supplementary file 3
Taqman qRT-PCR probes used in this study.
qRT-PCR primers, sgRNA oligonucleotides, cloning and genotyping primers used in this study. Antibodies and their respective application specific dilutions used in this study. T-REX17 exonic smFISH probes and their sequence used in this study. SOX17 locus capture HiC probes and their sequence used in this study. RNA-pulldown probes and their sequences used in this study.
- https://cdn.elifesciences.org/articles/83077/elife-83077-supp3-v2.xlsx
-
Supplementary file 4
H3K9me3 ChIP-qPCR raw and normalized data from sgCtrl and sgT-REX17 day 5 endoderm cells.
Raw data of Log10 (ECAD/NCAD) signal ratios and respective quantification from day 5 sgCtrl and sgT-REX17 endoderm cells. Raw data of VIMENTIN signal and respective quantification from sgCtrl and sgT-REX17 undifferentiated iPSCs and day 5 endoderm cells. Raw data of PDX1 signal and respective quantification from day 9 sgCtrl and sgT-REX17 pancreatic progenitor cells. List of putative T-REX17 interaction partners as measured in the RNA-pulldown followed by mass spectrometry.
- https://cdn.elifesciences.org/articles/83077/elife-83077-supp4-v2.xlsx
-
MDAR checklist
- https://cdn.elifesciences.org/articles/83077/elife-83077-mdarchecklist1-v2.pdf
-
Source code 1
Source code for the 4C analysis in Figure 1.
- https://cdn.elifesciences.org/articles/83077/elife-83077-code1-v2.zip
-
Source code 2
Source code for the conservation analysis in Figure 1—figure supplement 1.
- https://cdn.elifesciences.org/articles/83077/elife-83077-code2-v2.zip
Download links
A two-part list of links to download the article, or parts of the article, in various formats.
Downloads (link to download the article as PDF)
Open citations (links to open the citations from this article in various online reference manager services)
Cite this article (links to download the citations from this article in formats compatible with various reference manager tools)
T-REX17 is a transiently expressed non-coding RNA essential for human endoderm formation
eLife 12:e83077.
https://doi.org/10.7554/eLife.83077


