‘Skeletal Age’ for mapping the impact of fracture on mortality
- School of Biomedical Engineering, University of Technology Sydney, Australia
- Garvan Institute of Medical Research, Australia
- Faculty of Medicine, UNSW Sydney, Australia
- Department of Medicine, Holbæk Hospital, Denmark
- Department of Clinical Research, Odense Patient Data Explorative Network, University of Southern Denmark, Denmark
- Nuffield Department of Orthopaedics, Rheumatology and Musculoskeletal Sciences University of Oxford, United Kingdom
- Kontraktenheden, North Denmark Region, Denmark
- Department of Clinical Medicine, Aalborg University, Denmark
- Department of Endocrinology, Aalborg University Hospital, Denmark
- Steno Diabetes Center North Jutland, Denmark
- School of Medicine Sydney, University of Notre Dame Australia, Australia
- School of Population Health, UNSW Medicine, UNSW Sydney, Australia
Figures
Figure 1

Flowchart of recruitment and follow-up.
Figure 2
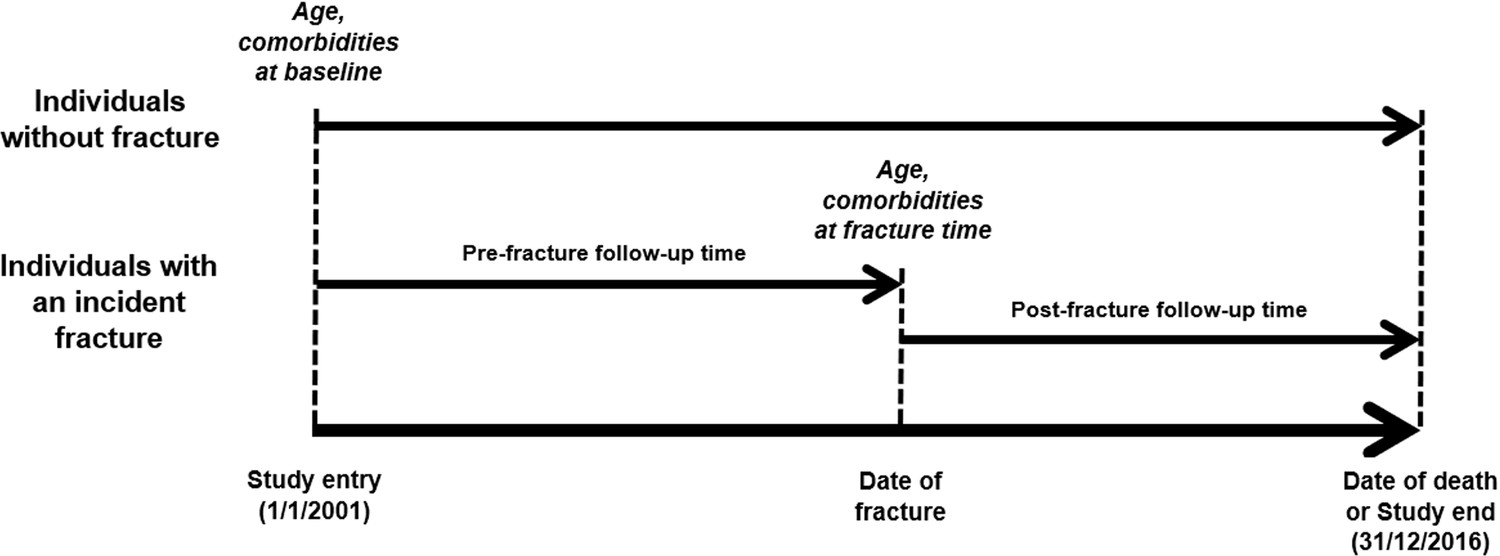
Schematic representation of time-dependent analysis.
Figure 3
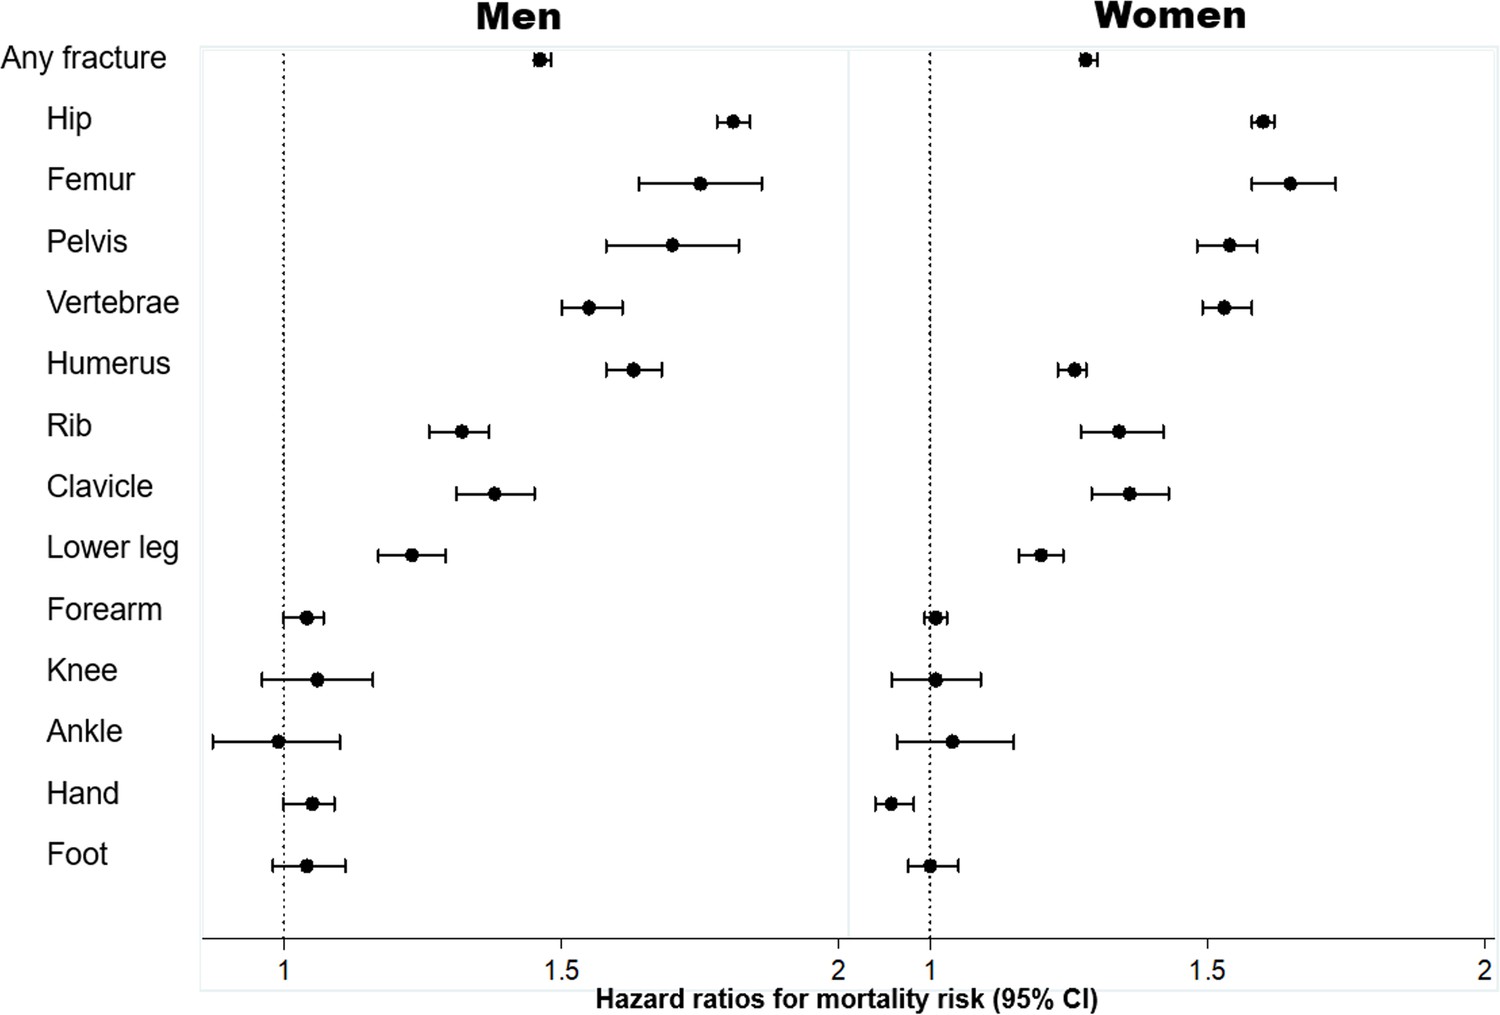
Association between specific fracture and mortality risk, adjusted for age and severity of comorbidities*: hazard ratio and 95% confidence interval (CI).
Legend * severity of comorbidities is assessed using the Charlson Comorbidity Index. Hazard ratio and the corresponding 95% confidence interval were estimated from a multivariable-adjusted Cox's proportional hazards regression.
Figure 4
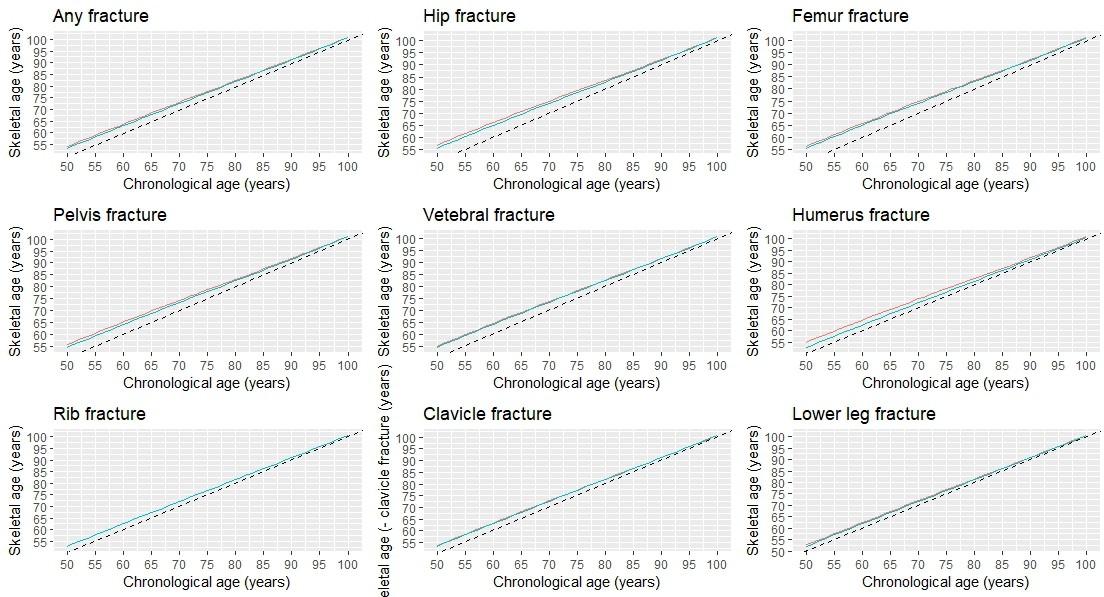
Skeletal age by specific fracture site and chronological age at fracture.
Tables
Key resources table
| Reagent type (species) or resource | Designation | Source or reference | Identifiers | Additional information |
|---|---|---|---|---|
| Software, algorithm | R Project for Statistical Computing | R Project for Statistical Computing | RRID:SCR_001905 | |
| Software, algorithm | Stata Statistical Software | A Software resource for statistical analysis and presentation of graphics | RRID:SCR_012763 |
Table 1
Characteristics of the study population at baseline stratified by gender, fracture, and mortality status.
| Characteristic | Non-fracture group | Fracture group | ||
|---|---|---|---|---|
| Alive | Dead | Alive | Dead | |
| Men | ||||
| Number of individuals | 466,936 | 231,507 | 54,355 | 41,017 |
| Age at baseline1 | 59.8 (7.7) | 71.1 (10.4) | 61.3 (8.9) | 72.4 (10.4) |
| Age at fracture1 | 68.2 (9.9) | 77.8 (10.5) | ||
| Comorbidities* | ||||
| Charlson comorbidity index2 | 0 (0, 0) | 0 (0, 1) | 0 (0, 1) | 1 (0, 2) |
| 0 | 404,415 (86.7%) | 140,293 (60.6%) | 32,287 (59.4%) | 12,592 (30.7%) |
| 1–2 | 56,701 (12.1%) | 70,841 (30.6%) | 17,557 (32.3%) | 19,073 (46.5%) |
| 3–4 | 3,328 (0.7%) | 9,260 (4.0%) | 2,881 (5.3%) | 5,209 (12.7%) |
| 5+ | 2,492 (0.5%) | 1,112 (4.8%) | 1,631 (3.0%) | 4,143 (10.1%) |
| Specific comorbidities3 | ||||
| Myocardial infarction | 18,734 (4.0%) | 22,225 (9.6%) | 5,055 (9.3%) | 6,071 (14.8%) |
| Congestive heart failure | 12,814 (2.7%) | 26,623 (11.5%) | 5,109 (9.4%) | 8,655 (21.1%) |
| Stroke | 21,792 (4.7%) | 31,253 (13.5%) | 9,458 (17.4%) | 11,567 (28.2%) |
| Peripheral vascular disease | 10,912 (2.3%) | 18,058 (7.8%) | 4,240 (7.8%) | 5,660 (13.8%) |
| Arrhythmias | 10,835 (2.3%) | 18,289 (7.9%) | 4,892 (9.0%) | 5,747 (18.4%) |
| Hypertension | 14,340 (3.1%) | 15,279 (6.6%) | 7,718 (14.2%) | 7,875 (19.2%) |
| Diabetes mellitus with no chronic complications | 19,805 (4.2%) | 21,067 (9.1%) | 6,305 (11.6%) | 6,317 (15.4%) |
| Diabetes mellitus with chronic complications | 6,120 (1.3%) | 8,103 (3.5%) | 2,446 (4.5%) | 2,748 (6.7%) |
| Renal disease | 4,290 (0.9%) | 8,797 (3.8%) | 2,120 (3.9%) | 3,609 (8.8%) |
| Cancer | 26,126 (5.6%) | 43,523 (18.8%) | 8,914 (16.4%) | 11,813 (28.8%) |
| Metastatic tumors | 1,894 (0.4%) | 9,492 (4.1%) | 1,033 (1.9%) | 3,035 (7.4%) |
| Dementia | 2,869 (0.6%) | 7,640 (3.3%) | 2,663 (4.9%) | 6,071 (14.8%) |
| Chronic lung disease | 16,600 (3.6%) | 25,697 (11.1%) | 6,740 (12.4%) | 8,696 (21.2%) |
| Rheumatologic | 4,881 (1.1%) | 4,630 (2.0%) | 1,685 (3.1%) | 1,600 (3.9%) |
| Mild liver disease | 2,647 (0.6%) | 3,704 (1.6%) | 1,468 (2.7%) | 1,805 (4.4%) |
| Moderate/severe liver disease | 589 (0.1%) | 1,389 (0.6%) | 435 (0.8%) | 779 (1.9%) |
| Hemiplegia | 661 (0.1%) | 927 (0.4%) | 461 (0.9%) | 480 (0.9%) |
| HIV/AIDS | 108 (0.02%) | 81 (0.03%) | 37 (0.07%) | 23 (0.06%) |
| Women | ||||
| Number of individuals | 465,559 | 195,467 | 130,771 | 81,727 |
| Age at baseline1 | 60.5 (8.3) | 74.0 (11.1) | 63.9 (9.7) | 76.3 (9.9) |
| Age at fracture1 | 70.9 (10.2) | 81.3 (9.6) | ||
| Comorbidities* | ||||
| Charlson comorbidity index2 | 0 (0, 0) | 0 (0, 1) | 0 (0, 1) | 1 (0, 2) |
| 0 | 400,005 (85.9%) | 121,776 (62.3%) | 81,574 (62.4%) | 32,093 (39.3%) |
| 1–2 | 59,923 (12.9%) | 57,663 (29.5%) | 41,114 (31.4%) | 35,866 (44.0%) |
| 3–4 | 2,975 (0.6%) | 6,255 (3.2%) | 5,196 (4.0%) | 7,960 (9.8%) |
| 5+ | 2,656 (0.6%) | 9,773 (5.0%) | 2,887 (2.2%) | 5,695 (7.0%) |
| Specific comorbidities3 | ||||
| Myocardial infarction | 7,164 (1.5%) | 10,946 (5.6%) | 6,109 (4.7%) | 7,562 (9.3%) |
| Congestive heart failure | 7,307 (1.6%) | 18,374 (9.4%) | 8,056 (6.2%) | 13,615 (16.7%) |
| Stroke | 16,329 (3.5%) | 22,870 (11.7%) | 17,143 (13.1%) | 19,247 (23.6%) |
| Peripheral vascular disease | 6,517 (1.4%) | 10,555 (5.4%) | 6,196 (4.7%) | 7,309 (9.0%) |
| Arrhythmias | 7,671 (1.7%) | 13,096 (6.7%) | 7,947 (6.1%) | 11,440 (14.0%) |
| Hypertension | 12,910 (2.8%) | 12,510 (6.4%) | 17,970 (13.7%) | 15,727 (19.3%) |
| Diabetes mellitus with no chronic complications | 14,151 (3.0%) | 14,074 (7.2%) | 9,960 (7.6%) | 9,214 (11.3%) |
| Diabetes mellitus with chronic complications | 3,367 (0.7%) | 4,496 (2.3%) | 2,969 (2.3%) | 3,126 (3.8%) |
| Renal disease | 2,386 (0.5%) | 4,300 (2.2%) | 2,697 (2.1%) | 3,561 (4.4%) |
| Cancer | 30,913 (6.6%) | 34,989 (17.9%) | 20,246 (15.5%) | 18,785 (23.0%) |
| Metastatic tumors | 2,302 (0.5%) | 8,796 (4.5%) | 2,221 (1.7%) | 4,632 (5.7%) |
| Dementia | 3,035 (0.7%) | 7,428 (3.8%) | 7,169 (5.5%) | 13,136 (16.1%) |
| Chronic lung disease | 18,759 (4.0%) | 20,915 (10.7%) | 15,065 (11.5%) | 14,018 (17.2%) |
| Rheumatologic | 10,392 (2.2%) | 7,037 (3.6%) | 7,482 (5.7%) | 5,256 (6.4%) |
| Mild liver disease | 2,599 (0.6%) | 2,346 (1.2%) | 2,165 (1.7%) | 1,802 (2.2%) |
| Moderate/severe liver disease | 296 (0.1%) | 782 (0.4%) | 422 (0.3%) | 643 (0.8%) |
| Hemiplegia | 524 (0.1%) | 573 (0.3%) | 577 (0.4%) | 475 (0.6%) |
| HIV/AIDS | 14 (0.0%) | 9 (0.0%) | 12 (0.01%) | 4 (0.0%) |
-
Notes: 1: mean (SD); 2: median (IQR); 3: number (%). *: at baseline for individuals without fracture or at fracture time for fracture patients. Comorbidities included not only chronic diseases that require hospitalization, but also those documented as either secondary diagnoses or at outpatient or emergency visits.
Table 2
Incidence of mortality following specific fracture sites stratified by gender.
| Fracture | Number | Age at fracture (years) | Number of deaths | Follow-up time (person-years) | Rate* of mortality (95% CI) |
|---|---|---|---|---|---|
| Men | |||||
| No fracture | 698,443 | 63.6** (10.2) | 231,507 | 9,049,194 | 2.6% (2.5, 2.6) |
| Any fracture | 95,372 | 72.3 (11.2) | 41,017 | 626,733 | 6.5% (6.5, 6.6) |
| Hip fracture | 25,706 | 79.5 (9.7) | 16,890 | 107,789 | 15.7% (15.4, 15.9) |
| Femur | 1,910 | 74.5 (10.8) | 997 | 10,468 | 9.5% (8.9, 10.1) |
| Pelvis | 1,305 | 77.0 (10.9) | 751 | 6,465 | 11.6% (10.8, 12.5) |
| Vertebrae | 6,924 | 72.7 (10.5) | 3,125 | 41,746 | 7.5% (7.2, 7.7) |
| Humerus | 10,126 | 72.6 (10.7) | 4,827 | 62,350 | 7.7% (7.5, 8.0) |
| Rib | 6,867 | 69.7 (10.4) | 2,350 | 50,186 | 4.7% (4.5, 4.9) |
| Clavicle | 5,201 | 68.2 (10.5) | 1,636 | 39,731 | 4.1% (3.9, 4.3) |
| Lower leg | 6,296 | 67.0 (9.5) | 1,796 | 52,915 | 3.4% (3.2, 3.6) |
| Forearm | 15,268 | 69.4 (10.2) | 4,675 | 120,719 | 3.9% (3.8, 4.0) |
| Knee | 1,382 | 70.2 (10.1) | 447 | 10,886 | 4.1% (3.7, 4.5) |
| Ankle | 1,084 | 67.6 (9.8) | 275 | 9,081 | 3.0% (2.7, 3.4) |
| Hand | 8,309 | 67.7 (10.1) | 2,178 | 70,263 | 3.1% (3.0, 3.2) |
| Foot | 4,994 | 65.3 (9.7) | 1,070 | 44,136 | 2.4% (2.3, 2.6) |
| Women | |||||
| No fracture | 661,026 | 64.5** (11.1) | 195,467 | 8,723,863 | 2.2% (2.2, 2.3) |
| Any fracture | 212,498 | 74.9 (11.2) | 81,727 | 1,506,940 | 5.4% (5.4, 5.5) |
| Hip fracture | 51,669 | 82.1 (9.2) | 31,816 | 259,087 | 12.3% (12.1, 12.4) |
| Femur | 3,529 | 78.9 (10.9) | 1,921 | 19,322 | 9.9% (9.5, 10.4) |
| Pelvis | 4,920 | 81.2 (10.0) | 2,893 | 26,761 | 10.8% (10.4, 11.2) |
| Vertebrae | 9,732 | 76.6 (10.6) | 4,658 | 60,295 | 7.7% (7.5, 7.9) |
| Humerus | 28,298 | 74.4 (10.5) | 10,330 | 202,662 | 5.1% (5.0, 5.2) |
| Rib | 3,153 | 74.1 (11.9) | 1,218 | 22,285 | 5.5% (5.2, 5.8) |
| Clavicle | 4,480 | 72.7 (11.5) | 1,577 | 31,755 | 5.0% (4.7, 5.2) |
| Lower leg | 11,460 | 70.1 (10.8) | 3,130 | 94,308 | 3.3% (3.2, 3.4) |
| Forearm | 68,333 | 72.0 (10.3) | 18,470 | 559,406 | 3.3% (3.2, 3.3) |
| Knee | 2,604 | 71.3 (9.7) | 629 | 21,085 | 3.0% (2.8, 3.2) |
| Ankle | 1,936 | 70.0 (10.6) | 499 | 15,726 | 3.2% (2.9, 3.5) |
| Hand | 12,489 | 69.6 (10.2) | 2681 | 108,112 | 2.5% (2.4, 2.6) |
| Foot | 9,916 | 67.8 (9.6) | 1904 | 86,136 | 2.2% (2.1, 2.3) |
-
Notes: *: rates were calculated as number of deaths/100 person-years; **: age at baseline (years).
Additional files
-
Supplementary file 1
List of ICD-10 codes used to define specific fractures and comorbidities.
- https://cdn.elifesciences.org/articles/83888/elife-83888-supp1-v1.docx
-
Supplementary file 2
Skeletal age by specific fracture site and chronological age at fracture.
- https://cdn.elifesciences.org/articles/83888/elife-83888-supp2-v1.docx
-
Supplementary file 3
Skeletal age for a 60-year-old individual who sustained a fracture at a specific bone.
- https://cdn.elifesciences.org/articles/83888/elife-83888-supp3-v1.docx
-
Supplementary file 4
R codes used to construct skeletal age for individual fracture sites associated with increased mortality risk.
- https://cdn.elifesciences.org/articles/83888/elife-83888-supp4-v1.docx
-
MDAR checklist
- https://cdn.elifesciences.org/articles/83888/elife-83888-mdarchecklist1-v1.docx
Download links
A two-part list of links to download the article, or parts of the article, in various formats.
Downloads (link to download the article as PDF)
Open citations (links to open the citations from this article in various online reference manager services)
Cite this article (links to download the citations from this article in formats compatible with various reference manager tools)
‘Skeletal Age’ for mapping the impact of fracture on mortality
eLife 12:e83888.
https://doi.org/10.7554/eLife.83888


