Optogenetic manipulation of neuronal and cardiomyocyte functions in zebrafish using microbial rhodopsins and adenylyl cyclases
- Graduate School of Science, Nagoya University, Japan, Japan
- Graduate School of Bioagricultural Sciences, Nagoya University, Japan
- Institute for Advanced Research, Nagoya University, Japan
- Department of Life Science and Applied Chemistry, Nagoya Institute of Technology, Japan
Figures
Figure 1 with 1 supplement
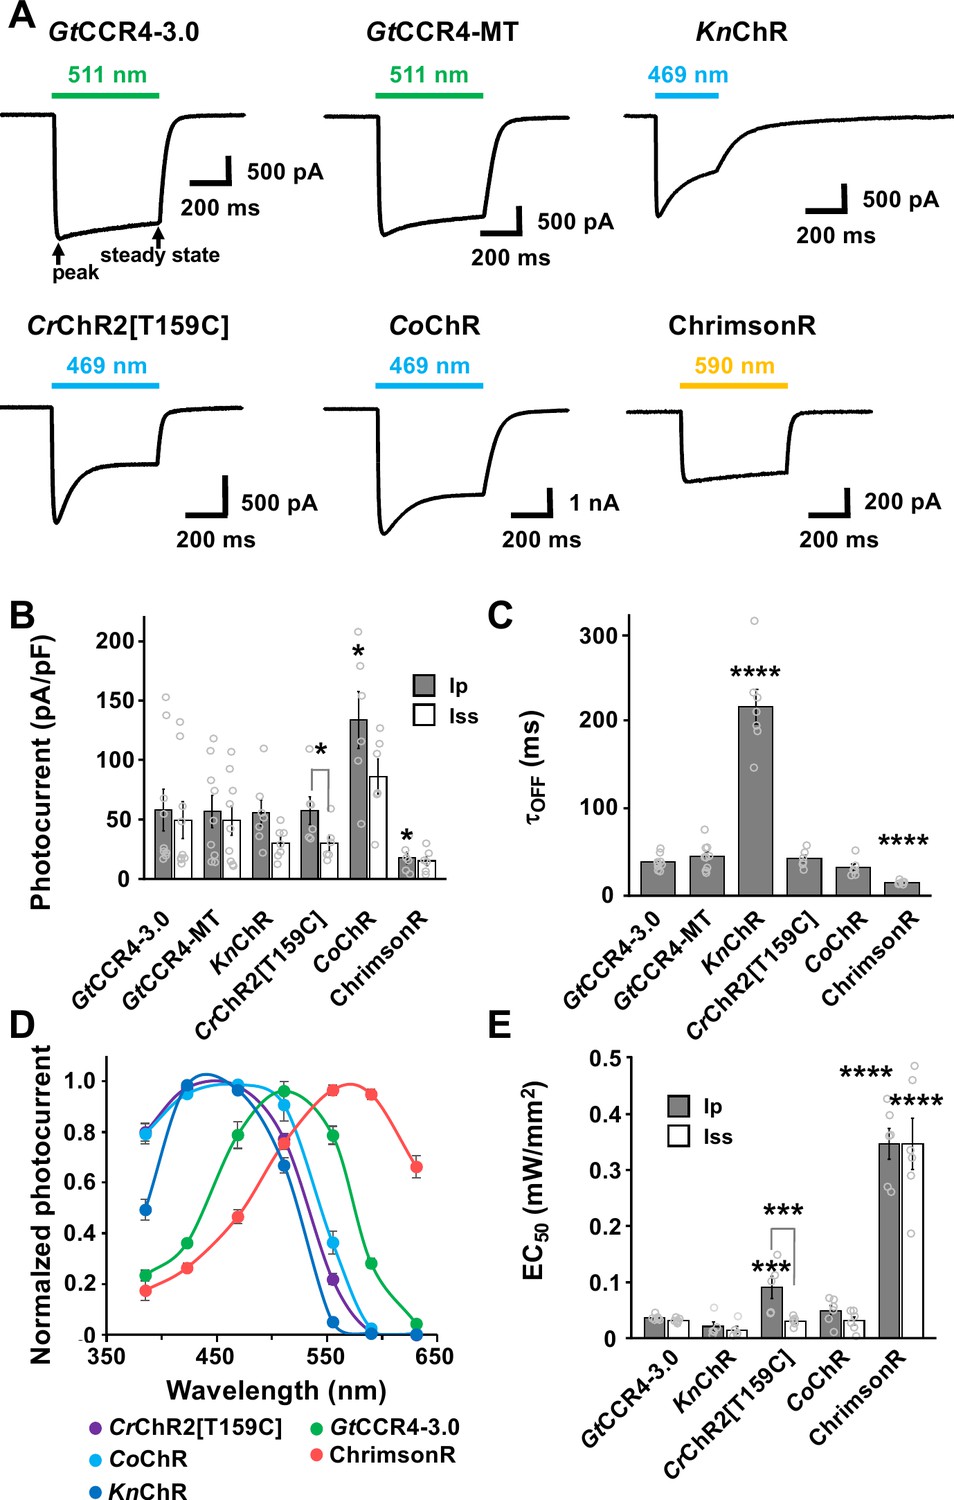
Photocurrent properties of channelrhodopsins.
(A) Representative photocurrent traces of GtCCR4-3.0-EYFP (GtCCR4-3.0), GtCCR4-MT-P2A-TagCFP (GtCCR4-MT), KnChR, CrChR2[T159C], CoChR, and ChrimsonR. Electrophysiological recordings were performed. Membrane voltage was clamped at –60 mV. Illumination sources were 511 nm light (GtCCR4-3.0, GtCCR4-MT), 469 nm light (KnChR, CrChR2[T159C], CoChR), and 590 nm light (ChrimsonR) at 1.4 mW/mm2. (B) Photocurrent amplitude. Gray bar: peak photocurrent (Ip); white bar: steady state photocurrent (Iss) (n = 6–9). Wilcoxon rank-sum test (CrChR2[T159C]-mCherry Ip vs. Iss, p=0.025; CoChR-tdTomato Ip vs. GtCCR4-3.0-EYFP Ip, p=0.025; ChrimsonR Ip vs. GtCCR4-3.0-EYFP Ip, p=0.049). (C) Comparison of the channel closing kinetics after shutting-off light (τoff) (n = 6–9), Wilcoxon rank-sum test (KnChR-EYFP vs. GtCCR4-3.0-EYFP, p=0.0002; ChrimsonR vs. GtCCR4-3.0-EYFP, p=0.0004). (D) The action spectrum of GtCCR4-3.0 (green circle), KnChR (blue circle), CrChR2[T159C] (purple circle), CoChR (light blue circle), and ChrimsonR (red circle). Illumination sources were 385, 423, 469, 511, 555, 590, or 631 nm light at 1.4 mW/mm2 (GtCCR4-3.0, CrChR2[T159C]) or 0.14 mW/mm2 (KnChR, CoChR, ChrimsonR) (n = 5–10). (E) Half saturation maximum (EC50) of the peak photocurrent (gray bar) and the steady-state photocurrent (white bar) are shown (n = 5, 6), Wilcoxon rank-sum test (CrChR2[T159C]-mcherry Ip vs. Iss, p=0.0079; CrChR2[T159C]-mCherry Ip vs. GtCCR4-3.0-EYFP Ip, p=0.0086; ChrimsonR Ip vs. GtCCR4-3.0-EYFP Ip, p=0.0021; ChrimsonR Iss vs. GtCCR4-3.0-EYFP Iss, p=0.0021). *p<0.05, **p<0.01, ***p<0.001, ****p<0.0005, Mean and SEM are indicated.
-
Figure 1—source data 1
Data for Figure 1, photocurrent properties of ChRs.
- https://cdn.elifesciences.org/articles/83975/elife-83975-fig1-data1-v1.xlsx
Figure 1—figure supplement 1

Light power dependency of photocurrent amplitude of GtCCR4-3.0 (A), KnChR (B), CrChR2[T159C] (C), CoChR (D), and ChrimsonR (E).
Photocurrent amplitude at − 60 mV was plotted as a function of light power. 511 nm light (A), 469 nm light (B, C), and 590 nm light (D) were illuminated. Filled circle: peak photocurrent; open circle: steady-state photocurrent (n = 5, 6). Error bars indicate standard errors of the mean (SEMs).
-
Figure 1—figure supplement 1—source data 1
Data for Figure 1—figure supplement 1, light power dependencies of photo current amplitude of ChRs.
- https://cdn.elifesciences.org/articles/83975/elife-83975-fig1-figsupp1-data1-v1.xlsx
Figure 2 with 6 supplements
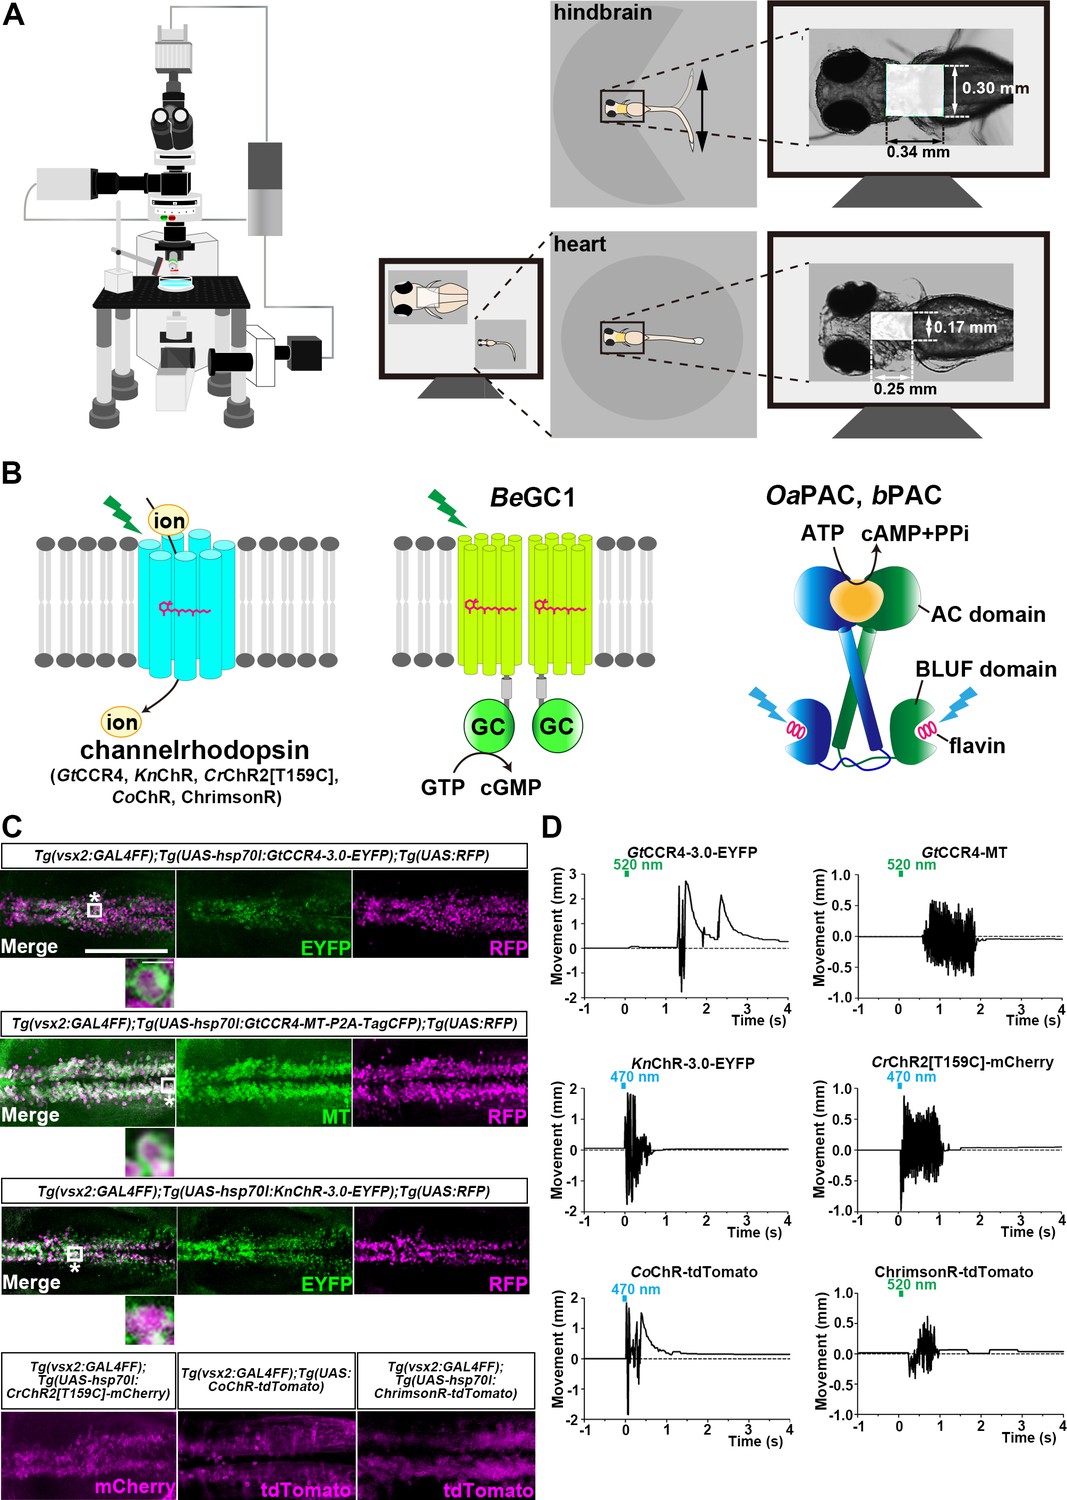
Optogenetic activation of hindbrain reticulospinal V2a neurons and cardiomyocytes by channelrhodopsins.
(A) Schematic of experimental devices. A larva was embedded in agarose. The hindbrain region or the heart were irradiated with light. Tail (caudal fin) movements and heartbeats were monitored by a high-speed camera with infrared light. (B) Schematic diagram of optogenetic tools used in this study. GC, guanylyl cyclase; AC, adenylyl cyclase; BLUF, sensors of blue-light using FAD. (C) Expression of GtCCR4-3.0-EYFP, GtCCR4-MT, KnChR-3.0-EYFP, CrChR2[T159C]-mCherry, CoChR-tdTomato, and ChrimsonR-tdTomato in the zebrafish hindbrain reticulospinal V2a neurons. 3 dpf (day post fertilization) Tg(vsx2:GAL4FF);Tg(UAS-hsp70l:GtCCR4-3.0-EYFP, GtCCR4-MT-P2A-TagCFP, KnChR-3.0-EYFP, or CrChR2[T159C]-mCherry, myl7:mCherry) larvae were fixed and stained with anti-GFP (EYFP, green), anti-Myc tag (green) or anti-DsRed (RFP, magenta) antibodies. For CoChR and ChrimsonR, fluorescent images of the hindbrain of Tg(vsx2:GAL4FF);Tg(UAS:CoChR-tdTomato, or UAS-hsp70l:ChrimsonR-tdTomato, myl7:mCherry) larvae are shown. Inset: higher magnification images for the boxed areas showing double-labeled neurons. (D) Tail movements of 3-dpf Tg larvae expressing GtCCR4-3.0-EYFP, GtCCR4-MT, KnChR-3.0-EYFP, and CrChR2[T159C]-mCherry, CoChR-tdTomato, and ChrimsonR-tdTomato in the reticulospinal V2a neurons after stimulation of the hindbrain area with LED (0.4 mW/mm2) light with a wavelength of 520 nm (GtCCR4-3.0-EYFP, GtCCR4-MT, ChrimsonR-tdTomato) and 470 nm (KnChR-3.0-EYFP, CrChR2[T159C]-mCherry, CoChR-tdTomato) for 100 ms. Light stimulations started at time 0 s. Typical examples are shown. Scale bars = 150 μm in (C), 5 μm in the insets of (C).
-
Figure 2—source data 1
Data for Figure 2D, tail movements of Tg larvae expressing ChRs.
- https://cdn.elifesciences.org/articles/83975/elife-83975-fig2-data1-v1.xlsx
Figure 2—video 1
Tail movements in a larva expressing CrChR2[T159C]-mCherry in reticulospinal V2a neurons.
The hindbrain in a 3-dpf Tg(vsx2:GAL4FF); Tg(UAS-hsp70l:CrChR2[T159C]-mCherry, myl7:mCherry) larva was stimulated with 470 nm light for 100 ms. The timing of light stimulation is indicated by a blue circle.
Figure 2—video 2
Tail movements in a larva expressing GtCCR4-3.0-EYFP in reticulospinal V2a neurons.
The hindbrain in a 3-dpf Tg(vsx2:GAL4FF); Tg(UAS-hsp70l:GtCCR4-3.0-EYFP, myl7:mCherry) larva was stimulated with 520 nm light for 100 ms. The timing of light stimulation is indicated by a green circle.
Figure 2—video 3
Tail movements in a larva expressing GtCCR4-MT-P2A-TagCFP in reticulospinal V2a neurons.
The hindbrain in a 3-dpf Tg(vsx2:GAL4FF);Tg(UAS-hsp70l:GtCCR4-MT-P2A-TagCFP, myl7:mCherry) larva was stimulated with 520 nm light for 100 ms. The timing of light stimulation is indicated by a green circle.
Figure 2—video 4
Tail movements in a larva expressing KnChR-3.0-EYFP in reticulospinal V2a neurons.
The hindbrain in a 3-dpf Tg(vsx2:GAL4FF);Tg(UAS-hsp70l:KnChR-3.0-EYFP, myl7:mCherry) larva was stimulated with 470 nm light for 100 ms. The timing of light stimulation is indicated by a blue circle.
Figure 2—video 5
Tail movements in a larva expressing CoChR-tdTomato in reticulospinal V2a neurons.
The hindbrain in a 3-dpf Tg(vsx2:GAL4FF);Tg(UAS:CoChR-tdTomato), larva was stimulated with 470 nm light for 100 ms. The timing of light stimulation is indicated by a blue circle.
Figure 2—video 6
Tail movements in a larva expressing ChrimsonR-tdTomato in reticulospinal V2a neurons.
The hindbrain in a 3-dpf Tg(vsx2:GAL4FF);Tg(UAS-hsp70l:ChrimsonR-tdTomato, myl7:mCherry) larva was stimulated with 520 nm light for 100 ms. The timing of light stimulation is indicated by a green circle.
Figure 3 with 3 supplements
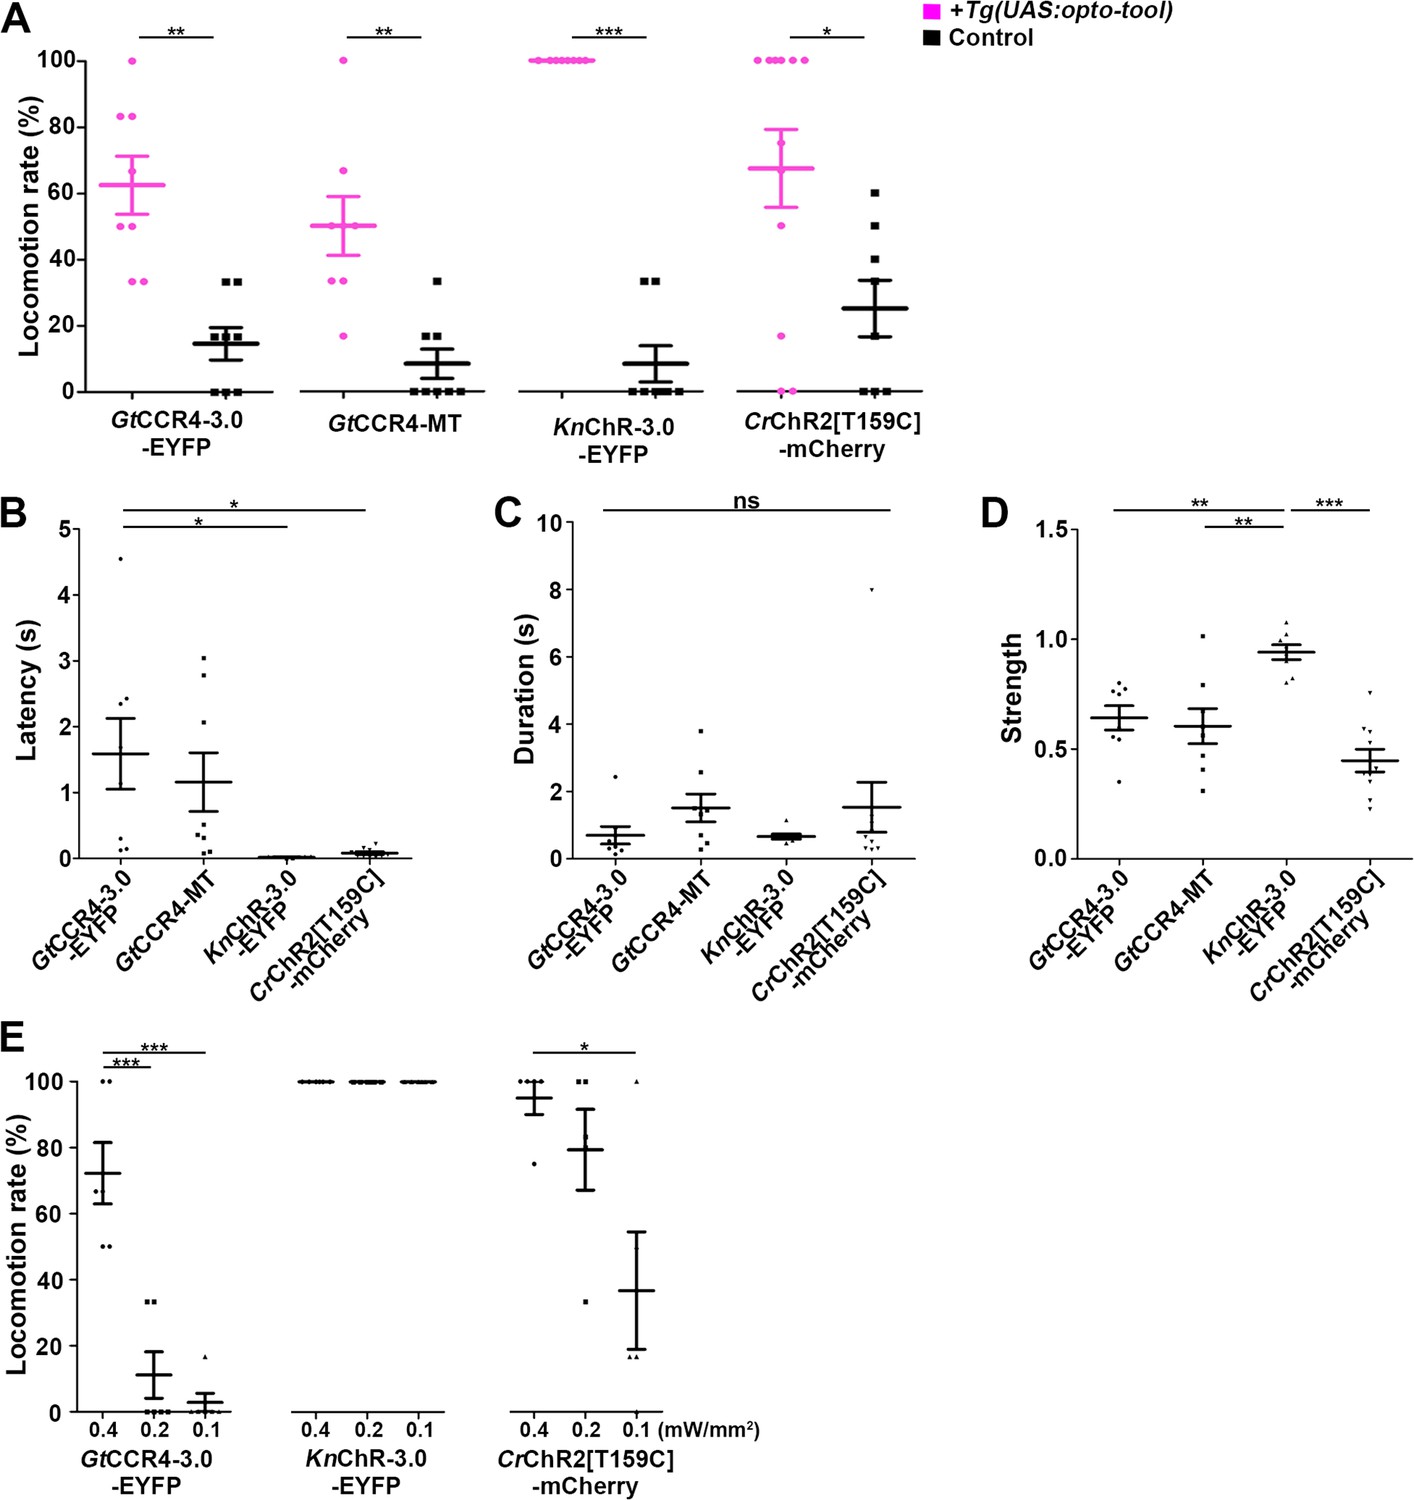
Optogenetic activation of hindbrain reticulospinal V2a neurons by GtCCR4, KnChR, and CrChR2[T159C].
(A) Light stimulation-dependent locomotion rates of 3-dpf Tg larvae expressing GtCCR4-3.0-EYFP, GtCCR4-MT, KnChR-3.0-EYFP, CrChR2[T159C]-mCherry. The hindbrain area was irradiated with light (0.4 mW/mm2) with a wavelength of 520 nm (GtCCR4-3.0-EYFP and GtCCR4-MT) or 470 nm (KnChR-3.0-EYFP and CrChR2[T159C]-mCherry) for 100 ms. Six consecutive stimulation trials were analyzed for eight rhodopsin-expressing and non-expressing (control) larvae of each Tg line. The average locomotion rates for each larva are shown, Wilcoxon rank-sum test (GtCCR4-3.0-EYFP vs. control, p=0.00166; GtCCR4-MT vs. control, p=0.00216; KnChR-EYFP vs. control, p=0.000266; CrChR2[T159C]-mCherry vs. control, p=0.0246). (B–D) Latency (B), duration (C), and strength (D) of tail movements. The time from the start of light stimulation to the first tail movement was defined as latency (s), and the time from the start of the first tail movement to the end of that movement was defined as duration (s). The maximum distance that the caudal fin moved from the midline divided by body length was measured as representative of its strength. One-way ANOVA with Tukey’s post hoc test (latency GtCCR4-3.0-EYFP vs. CrChR2[T159C]-mCherry, p=0.0115; GtCCR4-3.0-EYFP vs. KnChR-EYFP, p=0.0128; strength GtCCR4-3.0-EYFP vs. KnChR-EYFP, p=0.00601; GtCCR4-MT vs. KnChR-EYFP, p=0.00181; KnChR-EYFP vs. CrChR2[T159C]-mCherry, p=4.00e-06). (E) Locomotion evoked by light of various light intensities. The hindbrain area was irradiated with light at 0.4, 0.2, or 0.1 mW/mm2. Six consecutive trials were analyzed for 4–6 rhodopsin-expressing larvae for each Tg (n = 6 for GtCCR4-3.0-EYFP and KnChR-3.0-EFYP; n = 5 for CrChR2[T159C]-mCherry). Light stimulation experiments at 0.2 and 0.1 mW/mm2 were conducted only on larvae that exhibited evoked locomotion three or more times in response to the initial light stimulation at 0.4 mW/mm2. One-way ANOVA with Tukey’s post hoc test (GtCCR4-3.0-EYFP: 0.4 mW/mm2 vs. 0.1 mW/mm2, p=1.03e-05, 0.4 mW/mm2 vs. 0.2 mW/mm2, p=4.39e-05; CrChR2[T159C]-mCherry: 0.4 mW/mm2 vs. 0.1 mW/mm2, p=0.0185). *p<0.05, **p<0.01, ***p<0.001, ns: not significant. Means and SEMs are indicated.
-
Figure 3—source data 1
Data for Figure 3, optogenetic activation of hindbrain reticulospinal V2a neurons by ChRs.
- https://cdn.elifesciences.org/articles/83975/elife-83975-fig3-data1-v1.xlsx
Figure 3—figure supplement 1
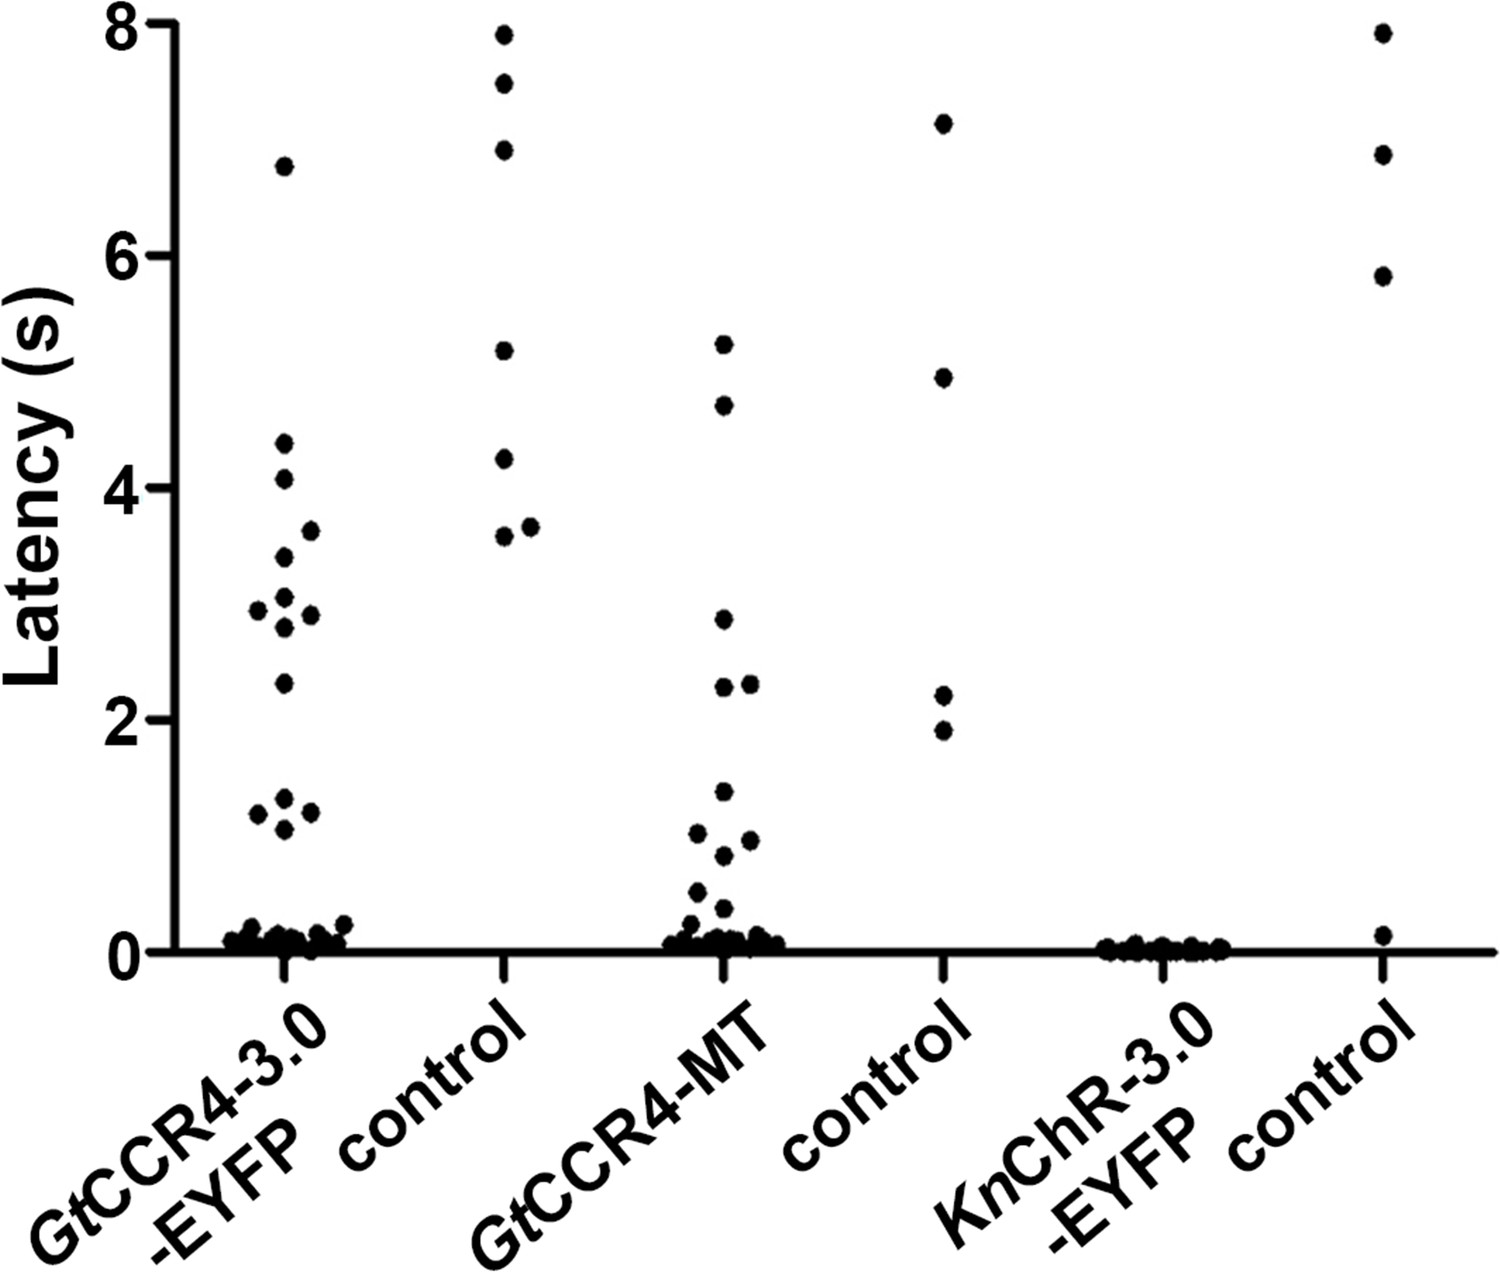
Latency of locomotion in ChR-expressing and non-expressing larvae.
The hindbrain of 3-dpf larvae expressing GtCCR4-3.0-EYFP, GtCCR4-MT, or KnChR-3.0-EYFP, and non-expressing sibling control larvae was irradiated with light (520 nm for GtCCR4-3.0-EYFP, GtCCR4-MT and 470 nm for KnChR-3.0-EYFP) for 100 ms. Six consecutive stimulation trials were analyzed for eight rhodopsin-expressing and non-expressing control larvae of each line (48 trials for each condition). Latency was measured as the tail movements observed within 8 s after the onset of light stimulation and plotted in a graph. The number of tail movements was 28 and 7 for GtCCR4-3.0-EYFP and the control, 24 and 4 for GtCCR4-MT and the control, and 25 and 4 for KnChR-3.0-EYFP and the control, respectively.
-
Figure 3—figure supplement 1—source data 1
Data for Figure 3—figure supplement 1, latency of locomotion in ChR-expressing and non-expressing larvae.
- https://cdn.elifesciences.org/articles/83975/elife-83975-fig3-figsupp1-data1-v1.xlsx
Figure 3—figure supplement 2
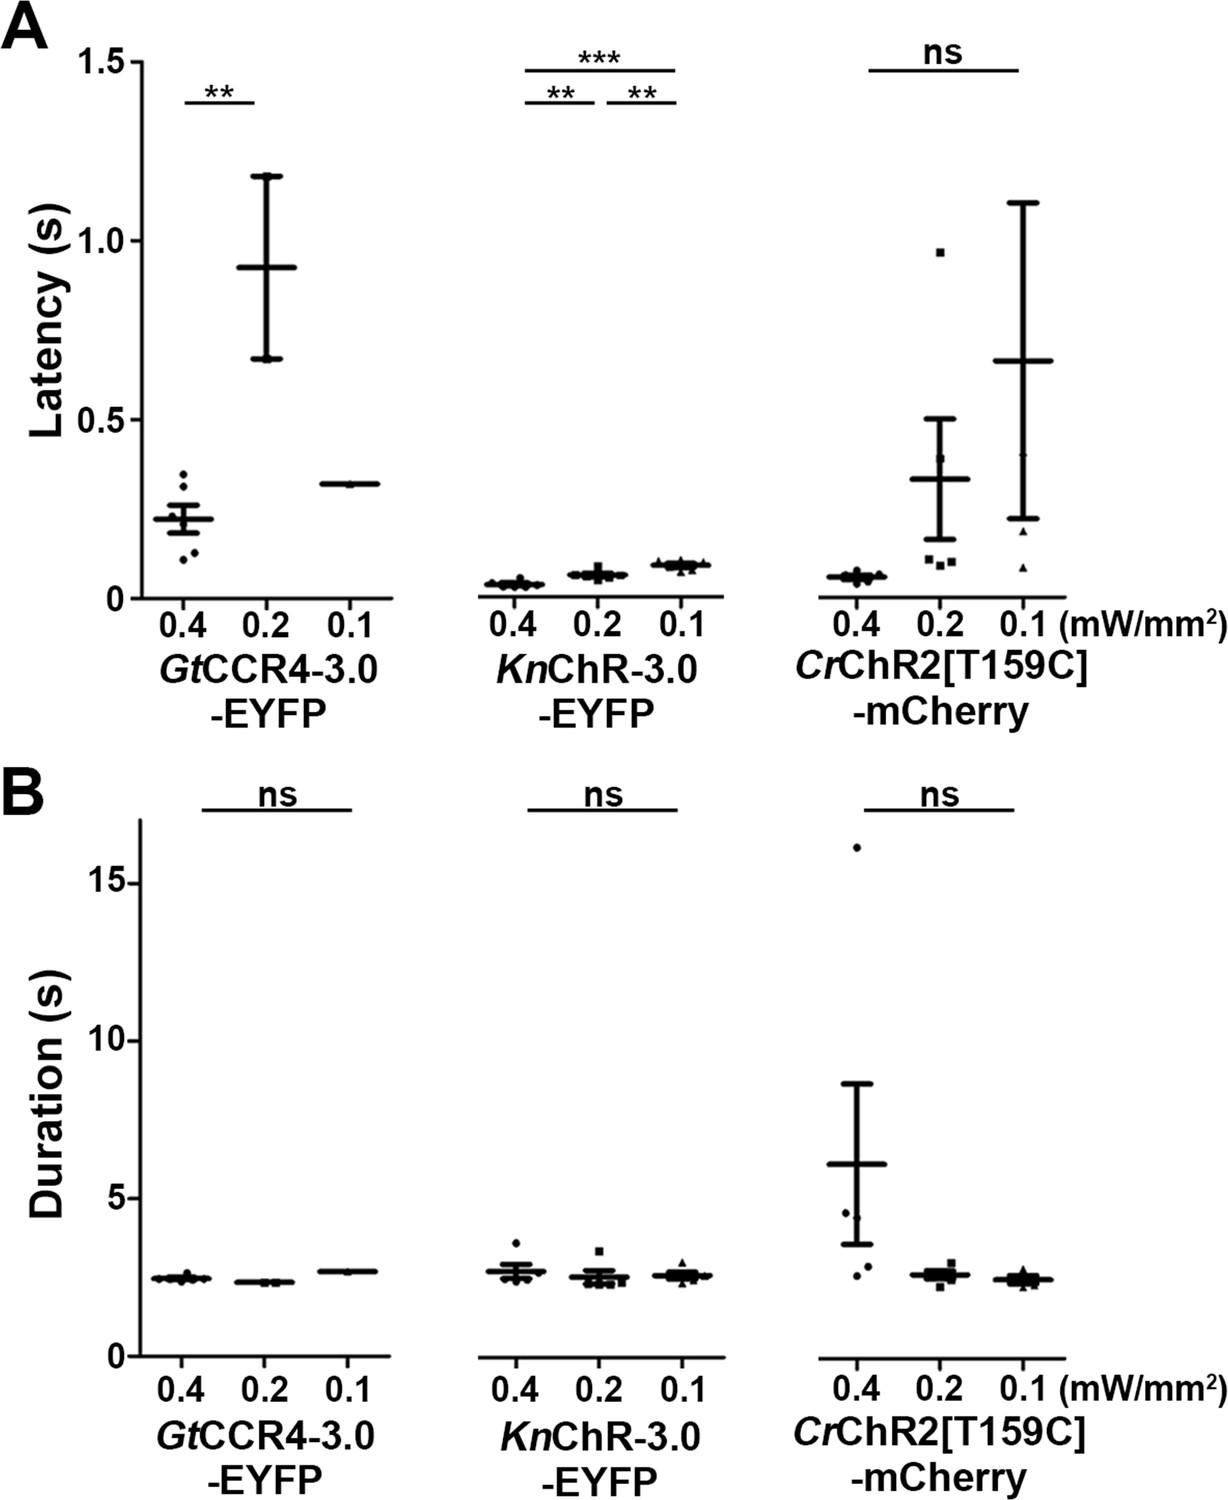
Latency and duration of locomotion induced with channelrhodopsins (ChRs) by light of various light intensities.
Latency (A) and duration (B) of evoked tail movements. The hindbrain area of 3-dpf Tg larvae expressing GtCCR4-3.0, KnChR-3.0, and CrChR2[T159C] and control larvae (non-expressing sibling larvae) were irradiated by light of different light intensities. Six consecutive stimulation trials were analyzed for eight rhodopsin-expressing and non-expressing (control) larvae of each Tg line. One-way ANOVA with Tukey’s post hoc test (latency GtCCR4-3.0-EYFP 0.4 mW/mm2 vs. 0.2 mW/mm2, p=0.00571; KnChR-3.0-EYFP 0.4 mW/mm2 vs. 0.2 mW/mm2, p=0.00553; 0.4 mW/mm2 vs. 0.1 mW/mm2, p=5.26e-06; 0.2 mW/mm2 vs. 0.1 mW/mm2, p=0.00469). **p<0.01, ***p<0.001, ns: not significant. Means and SEMs are indicated.
-
Figure 3—figure supplement 2—source data 1
Data for Figure 3—figure supplement 2, latency and duration of locomotion induced with ChRs by light of various intensities.
- https://cdn.elifesciences.org/articles/83975/elife-83975-fig3-figsupp2-data1-v1.xlsx
Figure 3—figure supplement 3
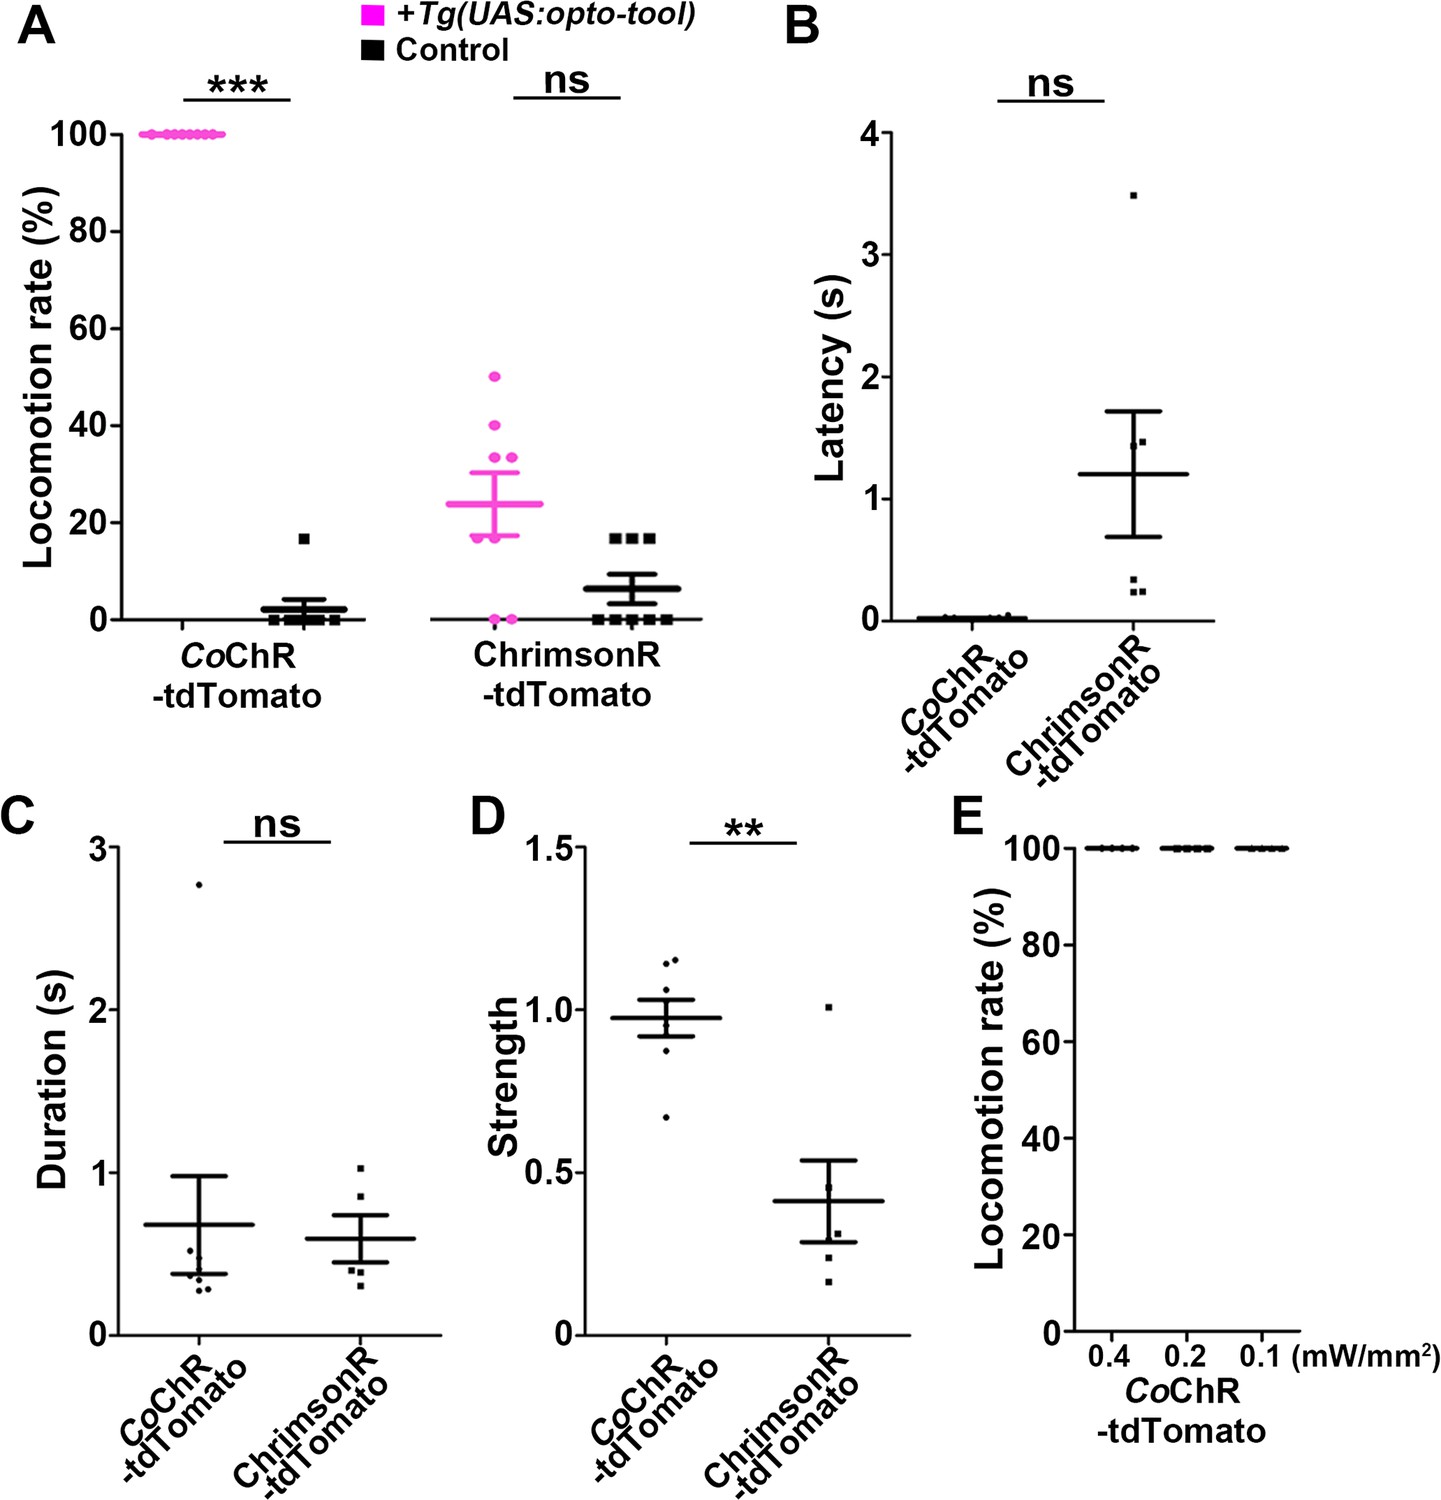
Optogenetic activation of hindbrain reticulospinal V2a neurons by CoChR and ChrimsonR.
(A) Light stimulation-dependent locomotion rates of 3-dpf Tg larvae expressing CoChR-tdTomato and ChrimsonR-tdTomato. The hindbrain area was irradiated with light (0.4 mW/mm2) with a wavelength of 470 nm (CoChR-tdTomato) or 520 nm (ChrimsonR-tdTomato) for 100 ms. Six consecutive stimulation trials were analyzed for eight rhodopsin-expressing and eight non-expressing (control) larvae of each Tg line. The average locomotion rates for each larva are shown. Wilcoxon rank-sum test (CoChR-tdTomato vs. control, p=0.000205; ChrimsonR vs. control, p=0.0509). (B–D) Latency (B), duration (C), and strength (D) of tail movements. Welch’s t-test (strength CoChR-tdTomato vs. ChrimsonR; p=0.00463). (E) Rate of locomotion induced with CoChR-tdTomato by light of various light intensities. **p<0.01, ***p<0.001, ns: not significant. Means and SEMs are indicated.
-
Figure 3—figure supplement 3—source data 1
Data for Figure 3—figure supplement 3, optogenetic activation of V2a neurons by CoChR and ChrimsonR.
- https://cdn.elifesciences.org/articles/83975/elife-83975-fig3-figsupp3-data1-v1.xlsx
Figure 4 with 6 supplements
Cardiac arrest induced with GtCCR4-3.0, KnChR, CrChR2[T159C], and GtACR1.
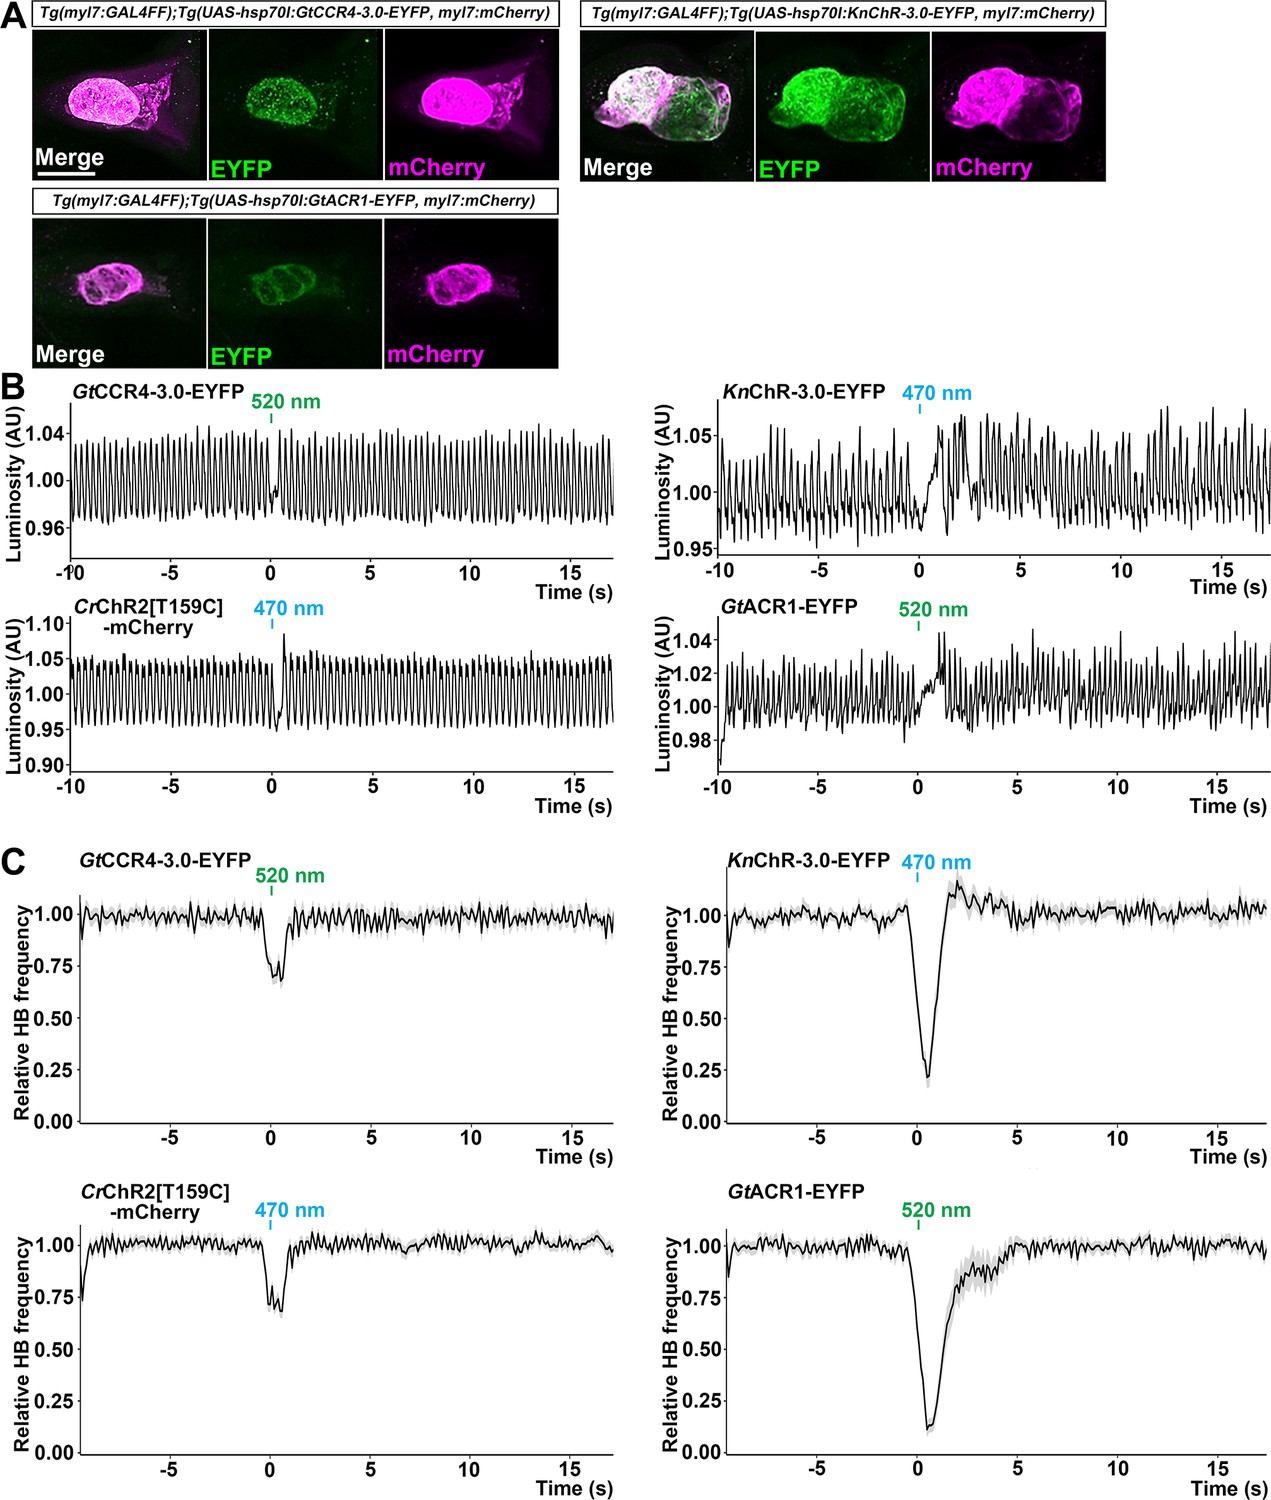
(A) Expression of GtCCR4-3.0-EYFP, KnChR-3.0-EYFP, and GtACR1-EYFP in cardiomyocytes of Tg(myl7:GAL4FF);Tg(UAS-hsp70l:GtCCR4-3.0-EYFP, KnChR-3.0-EYFP, or GtACR1-EYFP, myl7:mCherry) larvae. 4-dpf Tg larvae were fixed and stained with anti-GFP (for EYFP, green) or anti-DsRed (for mCherry, magenta) antibodies. Z stacks of confocal images. (B) Heartbeat (HB) monitoring by changes in luminosity (AU, arbitrary units). The entire heart area of 4-dpf Tg larvae was irradiated with light (520 nm for GtCCR4 and GtACR1; 470 nm for KnChR and CrChR2) for 100 ms at a strength of 0.5 mW/mm2. (C) Average of relative HB frequency. The heart area was irradiated at the indicated periods. Six consecutive stimulus trials were analyzed for four rhodopsin-expressing larvae of each Tg line. Relative HB frequency was calculated from HB data during 1 s and 500 ms before and after each time point, so the change in the HB frequency was observed before light stimulation, even though cardiac arrest occurred during light stimulation. Gray shading indicates SEMs. Scale bar = 100 µm in (A).
-
Figure 4—source data 1
Data for Figure 4, cardiac arrest induced with ChRs.
- https://cdn.elifesciences.org/articles/83975/elife-83975-fig4-data1-v1.xlsx
Figure 4—video 1
Heart movements in a larva expressing GtCCR4-3.0-EYFP in cardiomyocytes.
The heart area of Tg(myl7:GAL4FF);Tg(UAS-hsp70l:GtCCR4-3.0-EYFP, myl7:mCherry) was stimulated with 520 nm light for 100 ms. The timing of light stimulation is indicated by a green circle.
Figure 4—video 2
Heart movements in a larva expressing KnChR-3.0-EYFP in cardiomyocytes.
The heart area of Tg(myl7:GAL4FF);Tg(UAS-hsp70l:KnChR-3.0-EYFP, myl7:mCherry) was stimulated with 470 nm light for 100 ms. The timing of light stimulation is indicated by a blue circle.
Figure 4—video 3
Heart movements in a larva expressing CrChR2[T159C]-mCherry in cardiomyocytes.
The heart area of Tg(myl7:GAL4FF);Tg(UAS-hsp70l:CrChR2[T159C]-mCherry, myl7:mCherry) was stimulated with 470 nm light for 100 ms. The timing of light stimulation is indicated by a blue circle.
Figure 4—video 4
Heart movements in a larva expressing GtACR1-EYFP in cardiomyocytes.
The heart area of Tg(myl7:GAL4FF);Tg(UAS-hsp70l:GtACR1-EYFP, myl7:mCherry) was stimulated with 520 nm light for 100 ms. The timing of light stimulation is indicated by a green circle.
Figure 4—video 5
Heart movements in a larva expressing CoChR-tdTomato in cardiomyocytes.
The heart area of Tg(myl7:GAL4FF);Tg(UAS:CoChR-tdTomato) was stimulated with 470 nm light for 100 ms. The timing of light stimulation is indicated by a blue circle.
Figure 4—video 6
Heart movements in a larva expressing ChrimsonR-tdTomato in cardiomyocytes.
The heart area of Tg(myl7:GAL4FF);Tg(UAS-hsp70l:ChrimsonR-tdTomato, myl7:mCherry) was stimulated with 520 nm light for 100 ms. The timing of light stimulation is indicated by a green circle.
Figure 5 with 4 supplements
Cardiac arrest and resumption of heartbeats with GtCCR4-3.0, KnChR, CrChR2[T159C], and GtACR1.
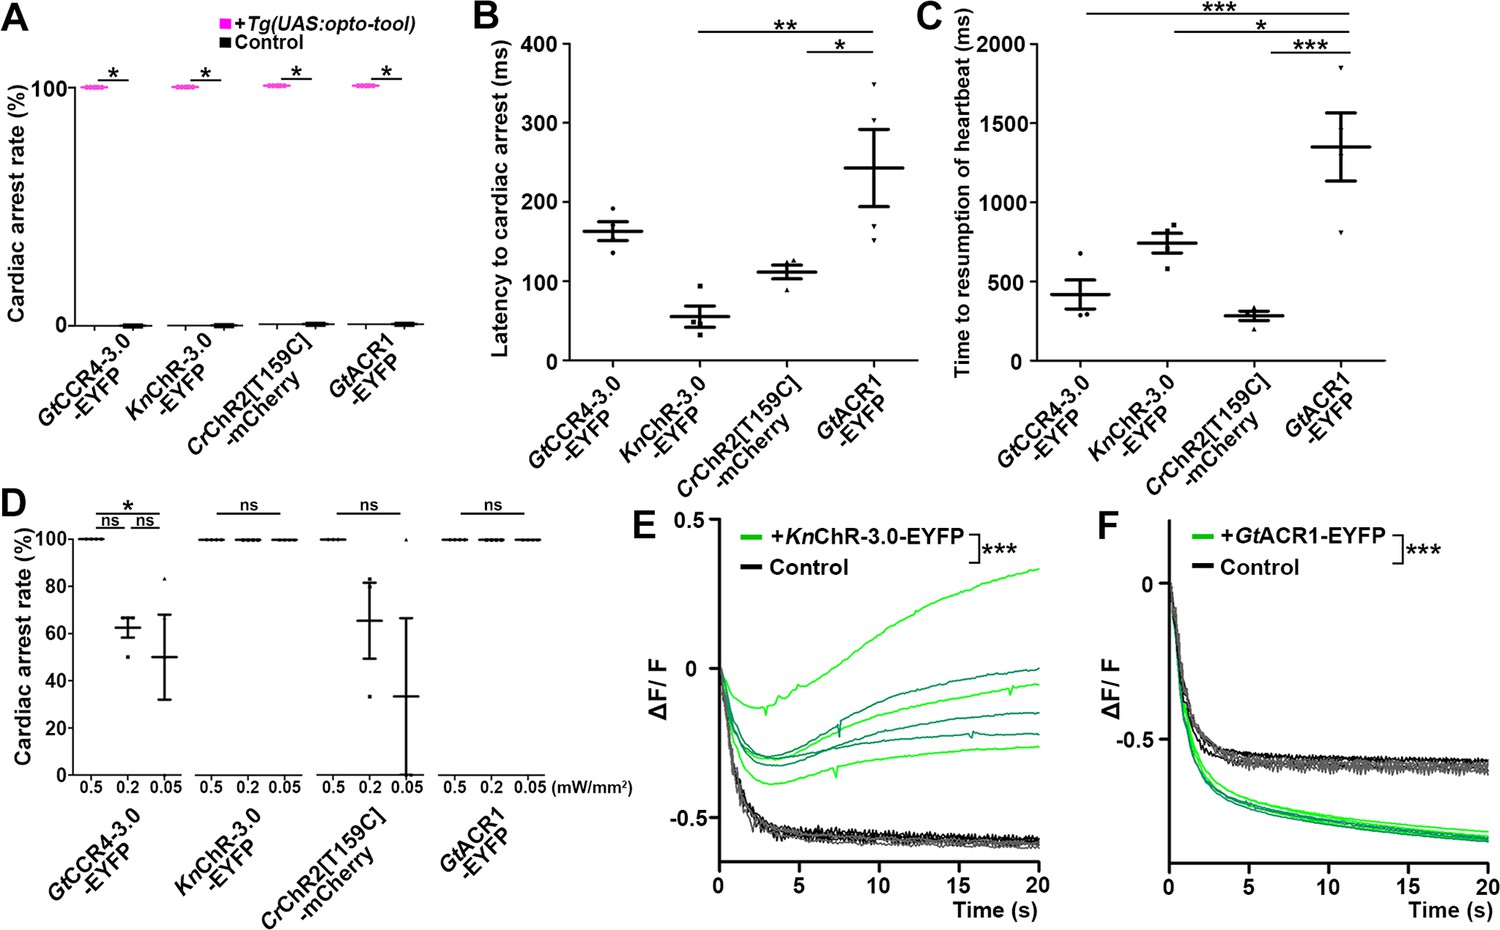
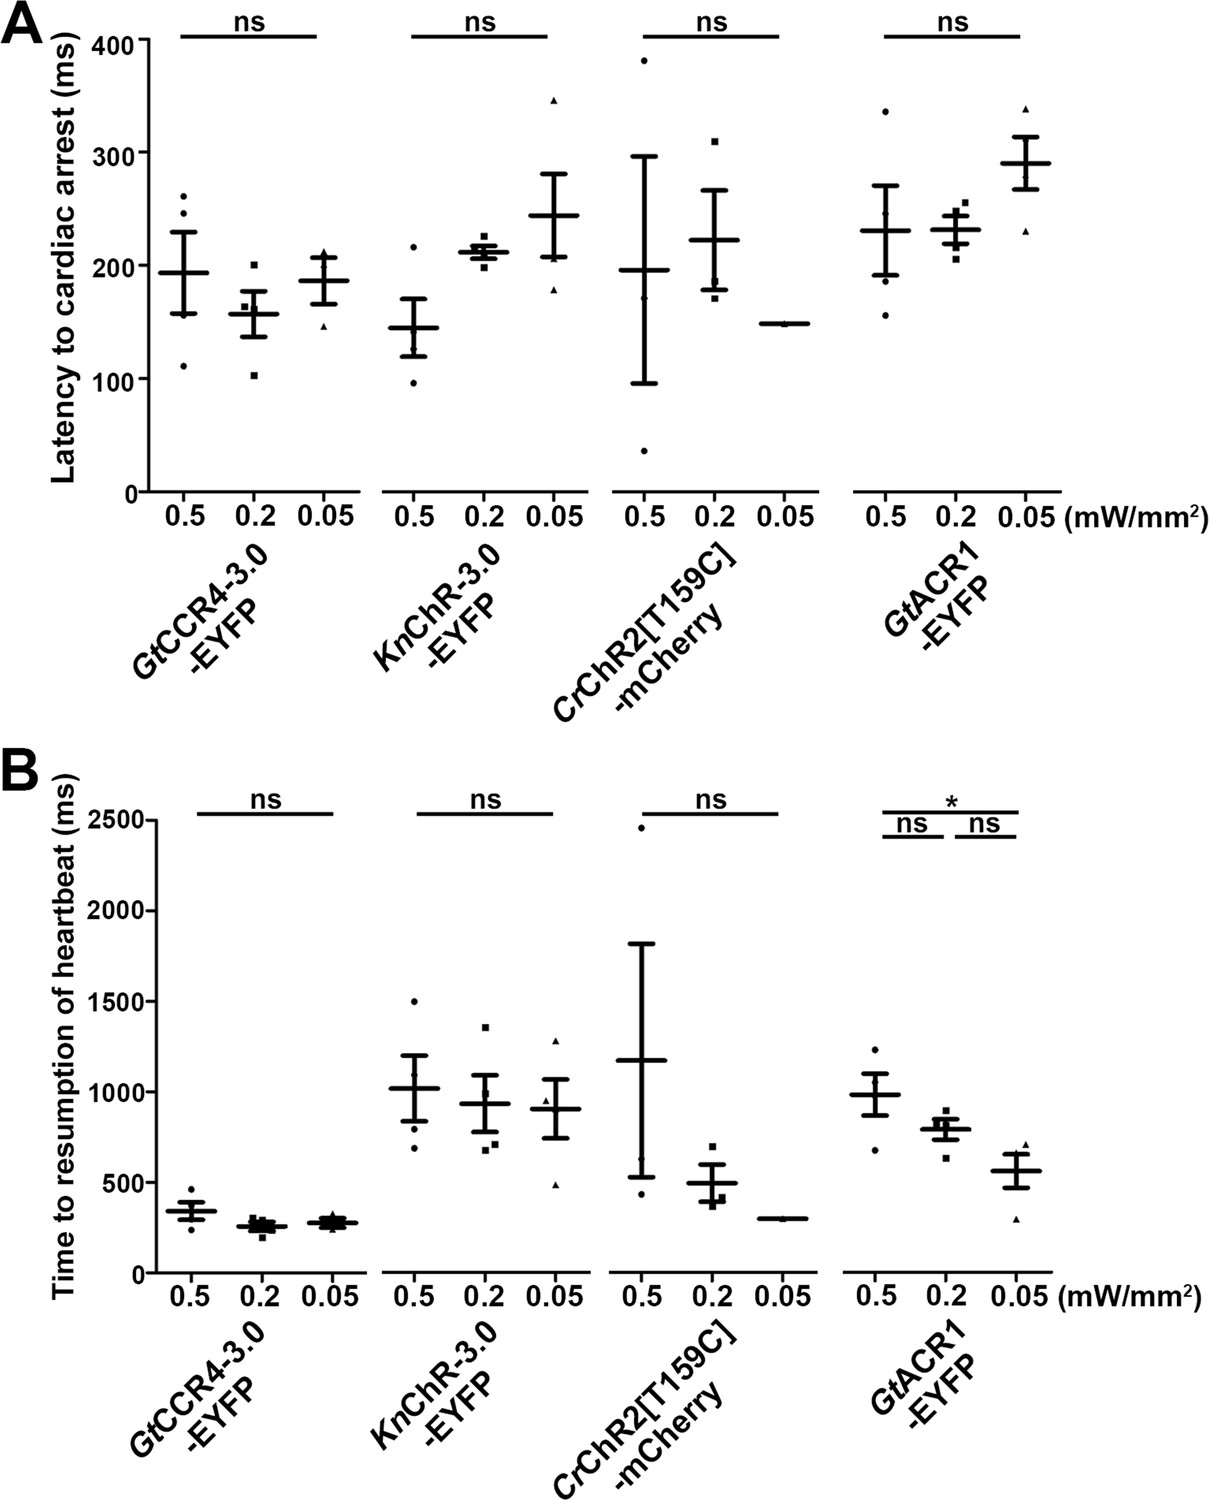
(A) Cardiac arrest rates of 4-dpf Tg larvae expressing GtCCR4-3.0-EYFP, KnChR-3.0-EYFP, CrChR2[T159C]-mCherry, or GtACR1-EYFP in cardiomyocytes. The heart area was irradiated with appropriate light (520 nm for GtCCR4 and GtACR1; 470 nm for KnChR and CrChR2) for 100 ms at a strength of 0.5 mW/mm2. Sibling larvae that did not express the rhodopsins were used as controls. Six consecutive stimulation trials were analyzed for four rhodopsin-expressing larvae and four control larvae of each Tg line, Wilcoxon rank-sum test (GtCCR4-3.0-EYFP, KnChR-3.0-EYFP, CrChR2[T159C]-mCherry, and GtACR1-EYFP, p=0.0131). (B, C) Latency to cardiac arrest (B) and time to resumption of HBs (C) after light stimulation with GtCCR4-3.0-EYFP, KnChR-3.0-EYFP, CrChR2[T159C]-mCherry, or GtACR1-EYFP. HB data were obtained from the experiments described above (A). One-way ANOVA with Tukey’s post hoc test (latency to cardiac arrest KnChR-3.0-EYFP vs. GtACR1-EYFP, p=0.00144; CrChR2[T159C]-mCherry vs. GtACR1-EYFP, p=0.0190; time to resumption of heartbeat GtCCR4-3.0-EYFP vs. GtACR1-EYFP, p=0.000786; KnChR-3.0-EYFP vs. GtACR1-EYFP, p=0.0189; CrChR2[T159C]-mCherry vs. GtACR1-EYFP, p=0.000236). (D) Light intensity dependence of cardiac arrest rates of 4-dpf Tg larvae expressing GtCCR4-3.0-EYFP, KnChR-3.0-EYFP, CrChR2[T159C]-mCherry, GtACR1-EYFP in cardiomyocytes. The heart area was irradiated with light (520 nm for GtCCR4 and GtACR1; 470 nm for KnChR and CrChR2) for 100 ms at a strength of 0.5, 0.2, or 0.05 mW/mm2. Six consecutive stimulation trials were analyzed for four rhodopsin-expressing larvae of each Tg line. One-way ANOVA with Tukey’s post hoc test (GtCCR4-3.0-EYFP: 0.5 mW/mm2 vs. 0.05 mW/mm2; p=0.0222). (E, F) Changes in fluorescence intensity of GCaMP6s (ΔF/F) in the heart of 4-dpf Tg larvae expressing KnChR-3.0-EYFP and GCaMP6s (E), or GtACR1-EYFP and GCaMP6s (F). Sibling larvae that did not express the rhodopsins were used as the control. The heart area of Tg larvae was stimulated with a fluorescence detection filter (excitation 470–495 nm, emission 510–550 nm). Two rhodopsin-expressing larvae (green) and two control larvae (black) were analyzed for each rhodopsin. Three trials were analyzed for each larva. The linear mixed-effects model was used for statistical analysis. *p<0.05, **p<0.01, ***p<0.001, ns: not significant. Means and SEMs are indicated.
-
Figure 5—source data 1
Data for Figure 5, cardiac arrest and resumption of heartbeats with ChRs.
- https://cdn.elifesciences.org/articles/83975/elife-83975-fig5-data1-v1.xlsx
Figure 5—figure supplement 1
Cardiac arrest induced with channelrhodopsins (ChRs) by light of various intensities.
Latency to cardiac arrest (A) and time to resumption of heartbeats (B) after light stimulation with ChRs. The heart area of 4-dpf Tg larvae expressing GtCCR4-3.0-EYFP, KnChR-3.0-EYFP, CrChR2[T159C]-mCherry, or GtACR1-EYFP was irradiated with light (520 nm for GtCCR4, GtACR1; 470 nm for KnChR, CrChR2) for 100 ms at a strength of 0.5, 0.2, or 0.05 mW/mm2. Six consecutive stimulation trials were analyzed for four rhodopsin-expressing larvae of each Tg line. One-way ANOVA with Tukey’s post hoc test (time to resumption of heartbeat GtACR1-EYFP 0.5 mW/mm2 vs. 0.05 mW/mm2, p=0.0240). *p<0.05, ns: not significant. Means and SEMs are indicated.
-
Figure 5—figure supplement 1—source data 1
Data for Figure 5—figure supplement 1, cardiac arrest induced with ChRs by light of various intensities.
- https://cdn.elifesciences.org/articles/83975/elife-83975-fig5-figsupp1-data1-v1.xlsx
Figure 5—figure supplement 2

Cardiac arrest induced with CoChR and ChrimsonR.
(A) Cardiac arrest rate. The heart area of 4-dpf Tg larvae expressing CoChR-tdTomato or ChrimsonR-tdTomato was irradiated with light (470 nm for CoChR; 520 nm for ChrimsonR) for 100 ms at a strength of 0.5, 0.2, or 0.05 mW/mm2. Six consecutive stimulation trials were analyzed for four rhodopsin-expressing larvae of each Tg line. (B, C) Latency to cardiac arrest (B) and time to resumption of heartbeats (C) after light stimulation with optogenetic tools. One-way ANOVA with Tukey’s post hoc test was used for statistical analysis. ns: not significant. Means and SEMs are indicated.
-
Figure 5—figure supplement 2—source data 1
Data for Figure 5—figure supplement 2, cardiac arrest induced with CoChR and ChrimsonR.
- https://cdn.elifesciences.org/articles/83975/elife-83975-fig5-figsupp2-data1-v1.xlsx
Figure 5—video 1
Ca2+ imaging in the heart of a larva expressing KnChR-3.0-EYFP and GCaMP6s in cardiomyocytes.
The heart area of Tg(myl7:GAL4FF);Tg(UAS-hsp70l:KnChR-3.0-EYFP, myl7:mCherry);Tg(UAS-hsp70l:GCaMP6s) was stimulated with a fluorescence detection filter (excitation 470–495 nm, emission 510–550 nm). GCaMP6s fluorescence was monitored with the same filter set. The fluorescence of GCaMP6s gradually increased.
Figure 5—video 2
Ca2+ imaging in the heart of a larva expressing GtACR1-EYFP and GCaMP6s in cardiomyocytes.
The heart area of Tg(myl7:GAL4FF);Tg(UAS-hsp70l:GtACR1-EYFP, myl7:mCherry);Tg(UAS-hsp70l:GCaMP6s) was stimulated with a fluorescence detection filter (excitation 470–495 nm, emission 510–550 nm). GCaMP6s fluorescence, which was monitored with the same filter set, gradually decreased.
Figure 6 with 1 supplement
Optogenetic activation of hindbrain reticulospinal V2a neurons with BeGC1-EGFP.
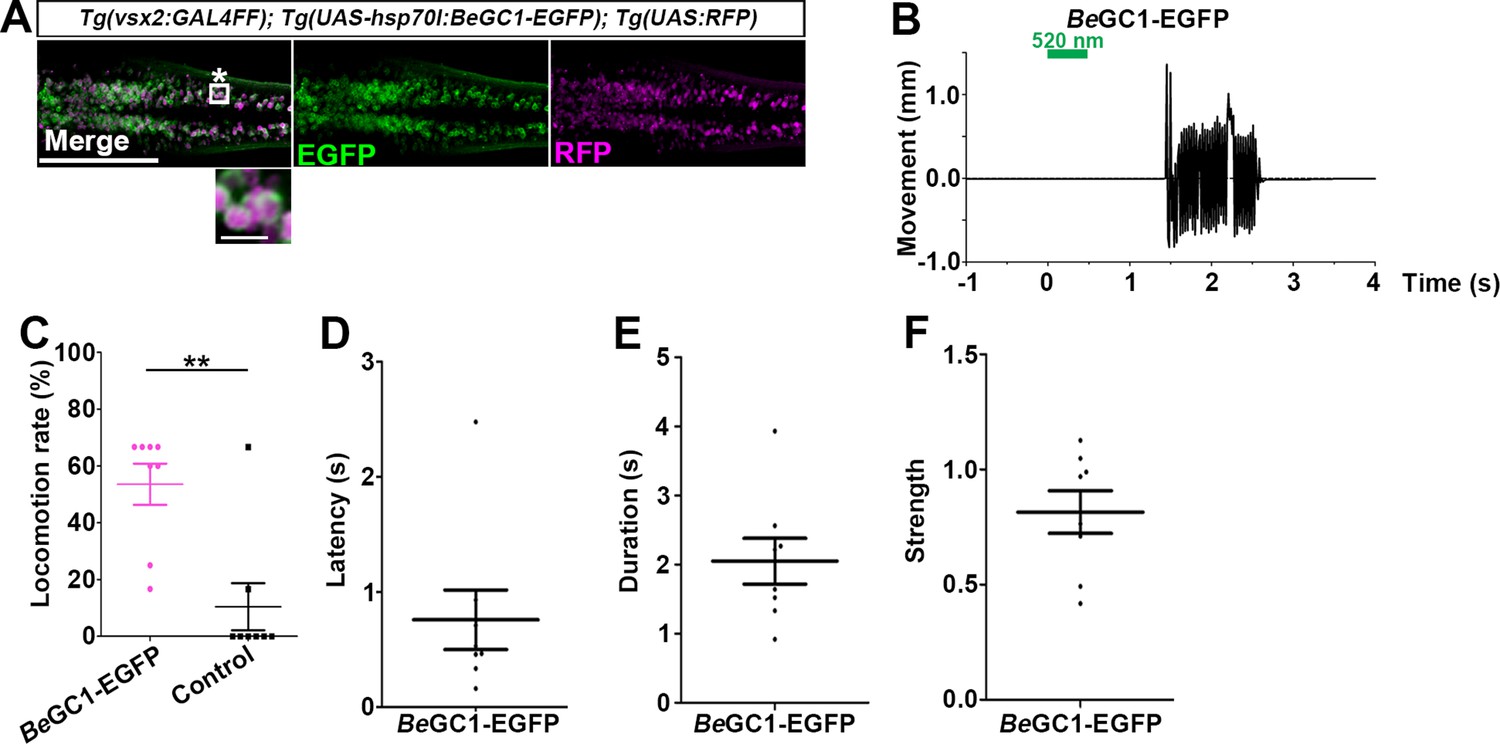
(A) Expression of BeGC1-EGFP in the hindbrain reticulospinal V2a neurons. 3-dpf Tg(vsx2:GAL4FF);Tg(UAS:BeGC1-EGFP, myl7:mCherry);Tg(UAS:RFP) larvae were fixed and stained with anti-GFP (EGFP, green) or anti-DsRed (RFP, magenta) antibodies. Inset: higher magnification images for the boxed area showing double-labeled neurons. In the inset, fluorescence signal intensities were modified to compare the subcellular localization of the tools. (B) Tail movements of 3-dpf Tg larvae expressing BeGC1 in the reticulospinal V2a neurons after stimulation with light (0.4 mW/mm2) at 520 nm for 500 ms. The stimulation started at time 0 s. A typical induced tail movement is shown. (C) Light stimulation-dependent locomotion rates of 3-dpf BeGC1-expressing larvae or non-expressing sibling control larvae. Six consecutive stimulation trials were analyzed for eight BeGC1-expressing and eight non-expressing larvae. The average locomotion rates for each larva are shown. Wilcoxon rank-sum test (BeGC1-EGFP vs. control, p=0.00608). (D–F) Latency (D), duration (E), and strength (F) of induced tail movements in the BeGC1-expressing larvae. The time from the start of light stimulation to the first tail movement was defined as latency (s), and the time from the start of the first tail movement to the end of that movement was defined as duration (s). The maximum distance that the caudal fin moved from the midline divided by body length reflected its strength. Scale bars = 150 μm in (A), 10 μm in the insets of (A). **p<0.01. Means and SEMs are indicated.
-
Figure 6—source data 1
Data for Figure 6, optogenetic activation of hindbrain reticulospinal V2a neurons with BeGC1-EGFP.
- https://cdn.elifesciences.org/articles/83975/elife-83975-fig6-data1-v1.xlsx
Figure 6—video 1
Tail movements in a larva expressing BeGC1-EGFP in reticulospinal V2a neurons.
The hindbrain in a 3-dpf Tg(vsx2:GAL4FF);Tg(UAS-hsp70l:BeGC1-EGFP, myl7:mCherry) larva was stimulated with 520 nm light for 500 ms. The timing of light stimulation is indicated by a green circle.
Figure 7 with 5 supplements
Optogenetic activation of reticulospinal V2a neurons with bPAC and OaPAC.
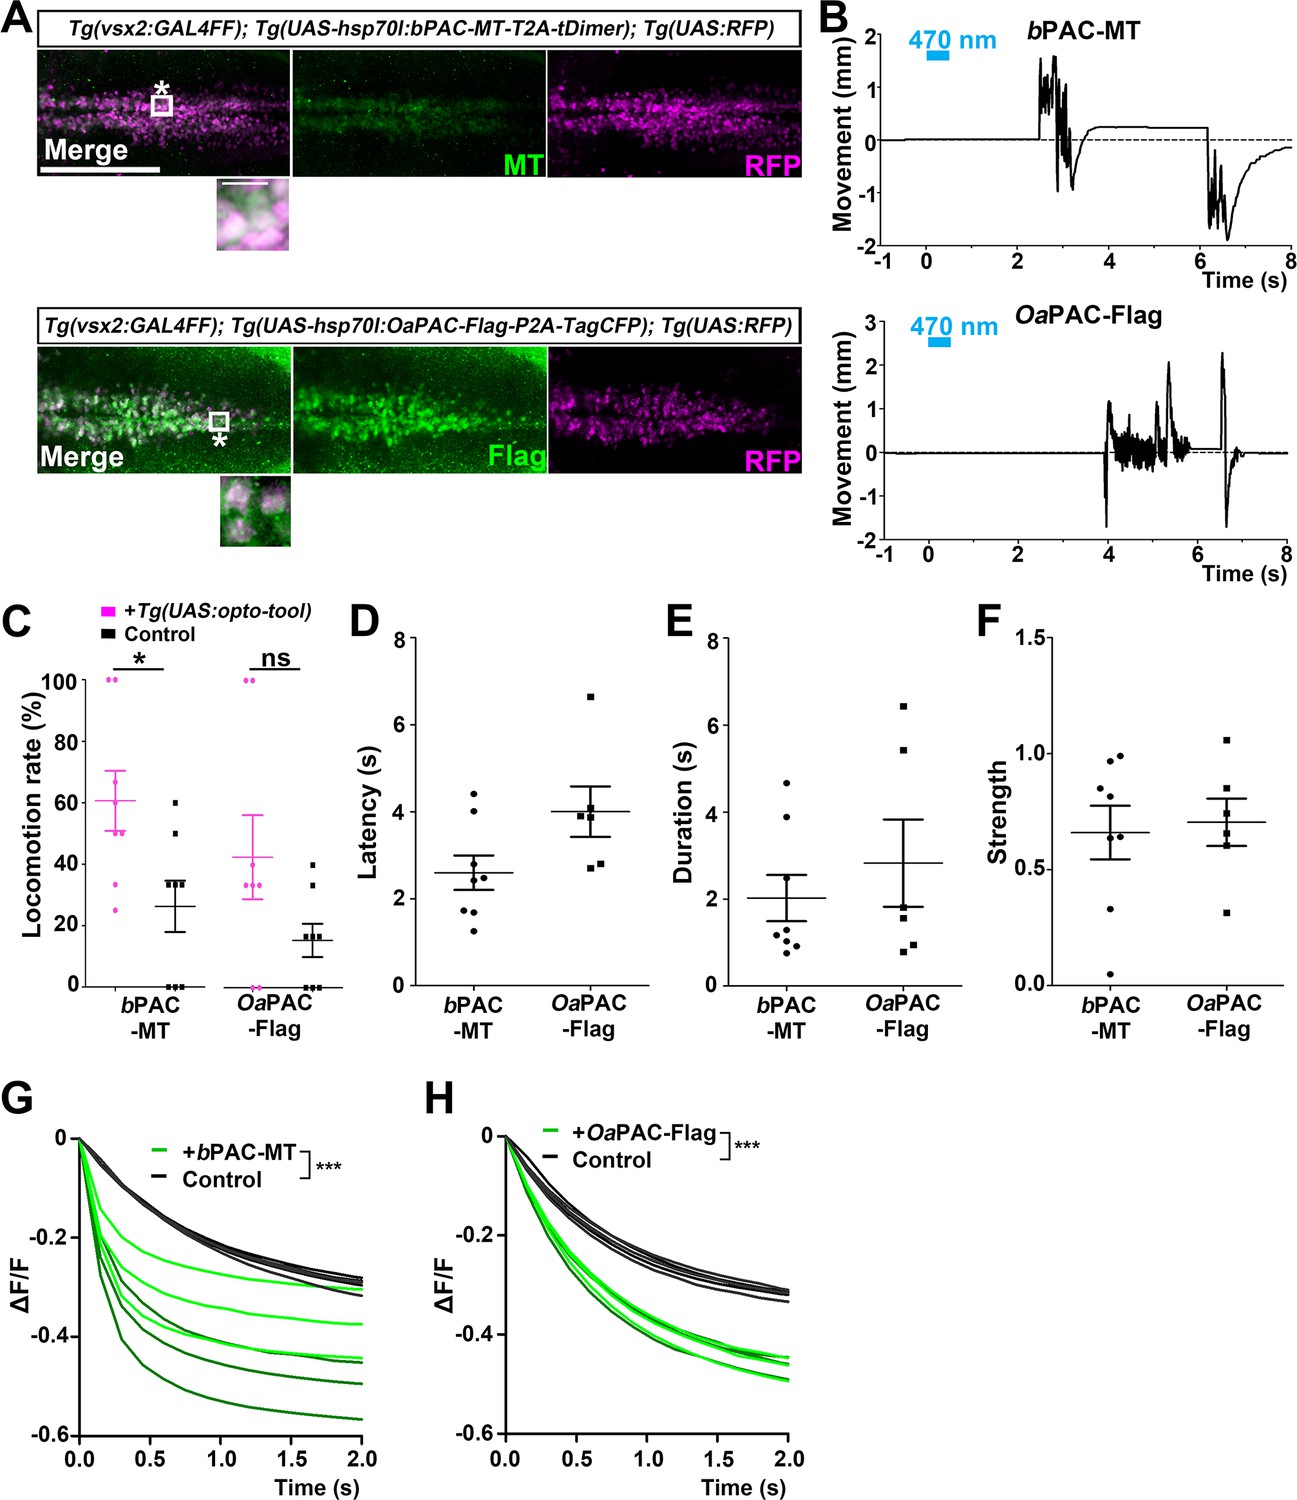
(A) Expression of bPAC and OaPAC in reticulospinal V2a neurons. 3-dpf Tg(vsx2:GAL4FF);Tg(UAS-hsp70l:bPAC-MT-T2A-tDimer, myl7:mCherry);Tg(UAS;RFP) and Tg(vsx2:GAL4FF);Tg(UAS-hsp70l:OaPAC-Flag-P2A-TagCFP, myl7:mCherry);Tg(UAS:RFP) larvae were fixed and stained with anti-Myc or anti-Flag (green), and anti-DsRed (RFP, magenta) antibodies. To detect relatively weak fluorescent signals of bPAC-MT and OaPAC-Flag, images were taken with increased laser power (2× for bPAC-MT and 4× for OaPAC-Flag compared to BeGC1-EGFP in Figure 6A). Inset: higher magnification images for the boxed areas showing double-labeled neurons. (B) Tail movements of 3-dpf Tg larvae expressing bPAC-MT or OaPAC-Flag in the reticulospinal V2a neurons after stimulation with light (0.4 mW/mm2) at 470 nm for 500 ms. The stimulation started at time 0 s. Typical examples are shown. (C) Light-induced locomotion rates. Larvae that did not express PACs were used as controls. Six consecutive stimulation trials for eight PAC-expressing and eight control larvae were analyzed. The average locomotion rates for each larva are shown. Wilcoxon rank-sum test (bPAC-MT vs. control, p=0.0376; OaPAC-Flag vs. control, p=0.145). (D–F) Latency (D), duration (E), and strength (F) for light stimulus-induced tail movements in larvae expressing bPAC-MT or OaPAC-Flag. The data for each larva are plotted in graphs. (G, H) Changes in fluorescence intensity (ΔF/F) of cAMP indicator Flamido2 in neurons of Tg larvae expressing bPAC-MT (G) or OaPAC-Flag (H) after light stimulation. The entire optic tectum area of 3-dpf Tg(elavl3:GAL4-VP16); Tg(elavl3:Flamindo2); Tg(UAS-hsp70l:bPAC-MT-T2A-tDimer) and Tg(elavl3:GAL4-VP16); Tg(elavl3:Flamindo2); Tg(UAS-hsp70l:OaPAC-Flag-P2A-TagCFP) larvae was stimulated with a fluorescence detection filter (excitation 470–495 nm, emission 510–550 nm). The fluorescence intensity of the optic tectum was measured, and ΔF/F was calculated. Sibling larvae that did not express PACs were used as controls. Three trials for two PAC-expressing (green) and two control (black) larvae were analyzed, and the data from a total of six trials are plotted on graphs. The linear mixed-effects model was used. Scale bars = 150 μm in (A), 10 μm in insets of (A). *p<0.05, ***p<0.001, ns: not significant. Means and SEMs are indicated.
-
Figure 7—source data 1
Data for Figure 7, optogenetic activation of reticulospinal neurons with PACs.
- https://cdn.elifesciences.org/articles/83975/elife-83975-fig7-data1-v1.xlsx
Figure 7—figure supplement 1

Latency of locomotion in PAC-expressing and non-expressing larvae.
The hindbrain of 3-dpf larvae expressing bPAC or OaPAC, and non-expressing sibling control larvae was irradiated with 470 nm light for 500 ms. Six consecutive stimulation trials were analyzed for eight PAC-expressing and eight non-expressing control larvae of each line (48 trials for each condition). Latency was measured as the tail movements observed within 30 s after the onset of light stimulation and plotted in a graph. The number of the tail movements were 32 and 13 for bPAC and the control, and 26 and 13 for OaPAC and the control.
-
Figure 7—figure supplement 1—source data 1
Data for Figure 7—figure supplement 1, latency of locomotion in PAC-expressing and non-expressing larvae.
- https://cdn.elifesciences.org/articles/83975/elife-83975-fig7-figsupp1-data1-v1.xlsx
Figure 7—figure supplement 2

Optogenetic control of the heart by bPAC or OaPAC.
(A) Expression of bPAC-MT or OaPAC-Flag in cardiomyocytes. 4-dpf larvae expressing bPAC-MT or OaPAC-Flag were fixed and stained with anti-Myc or Flag (green), and anti-DsRed (mCherry, magenta) antibodies. (B, C) Heartbeats (HBs) monitored by luminosity (AU), changes (B), and relative HB frequency (C) of bPAC-expressing larvae. The heart area of Tg larvae expressing bPAC was irradiated with light (0.5 mW/mm2) of 470 nm for 5 s at the indicated periods. Similar results were obtained from four Tg larvae. A typical example from one larva is shown in (B), and average HB frequency of the first or second trial showing a typical pattern for the four larvae is shown in (C). The larvae showed induced bradycardia in the third through sixth trials. Scale bar = 100 μm in (A).
-
Figure 7—figure supplement 2—source data 1
Data for Figure 7—figure supplement 2, optogenetic control of the heart by bPAC.
- https://cdn.elifesciences.org/articles/83975/elife-83975-fig7-figsupp2-data1-v1.xlsx
Figure 7—video 1
Tail movements in a larva expressing bPAC-MT in reticulospinal V2a neurons.
The hindbrain in a 3-dpf Tg(vsx2:GAL4FF);Tg(UAS-hsp70l:bPAC-MT-T2A-tDimer, myl7:mCherry) larva was stimulated with 470 nm light for 500 ms. The timing of light stimulation is indicated by a blue circle.
Figure 7—video 2
Tail movements in a larva expressing OaPAC-Flag in reticulospinal V2a neurons.
The hindbrain in a 3-dpf Tg(vsx2:GAL4FF);Tg(UAS-hsp70l:OaPAC-Flag-P2A-TagCFP, myl7:mCherry) larva was stimulated with 470 nm light for 500 ms. The timing of light stimulation is indicated by a blue circle.
Figure 7—video 3
Heart movements in a larva expressing bPAC-MT in cardiomyocytes.
The heart area of Tg(myl7:GAL4FF);Tg(UAS-hsp70l:bPAC-MT-T2A-tDimer, myl7:mCherry) was stimulated with 470 nm light for 5 s. The timing of light stimulation is indicated by a blue circle.
Tables
Table 1
Optogenetic tools.
Microbial optogenetic tools were expressed in the hindbrain reticulospinal V2a neurons or cardiomyocytes using the Gal4-UAS system.
The expression levels of the tools were determined by immunostaining with anti-tag (MT or Flag) antibodies or anti-fluorescent marker antibodies (anti-GFP and anti-DsRed for EYFP/EGFP and mCherry, respectively) (+, weak; ++, medium; +++, strong expression). The light stimulus-dependent responses (induced swimming or cardiac arrest) are indicated by the percentage of fish that responded to light stimuli. As controls, the responses of sibling larvae that did not express the tools were also examined. ND, not determined.
| Type | Tool name | Origin | Detection | Stimulation light (nm) | V2a neurons | Heart | ||
|---|---|---|---|---|---|---|---|---|
| Expression | Swimming response (control) | Expression | Cardiac response(control) | |||||
| Channelrhodopsin | ||||||||
| Cation | GtCCR4- 3.0-EYFP | Guillardia theta | EYFP fusion | 520 | ++ | 62.5%, n = 8 (14.6%, n = 8) | +++ | 100%, n = 4 (0%, n = 4) |
| Cation | GtCCR4-MT | Guillardia theta | MT-P2A-TagCFP | 520 | +++ | 50.0%, n = 8 (8.33%, n=8) | ND | ND |
| Cation | KnChR-3.0-EYFP | Klebsormidium nitens | EYFP fusion | 470 | ++* | 100%, n = 8 (8.33%, n = 8) | +++ | 100%, n = 4 (0%, n = 4) |
| Cation | CrChR2 [T159C]-mCherry | Chlamydomonas reinhardtii | mCherry fusion | 470 | ++ | 67.4%, n = 12 (25.0%, n = 8) | + ¶ | 100%, n = 4 (0%, n = 4) |
| Cation | CoChR-tdTomato | Chloromonas oogama | tdTomato fusion | 470 | +++† | 100%, n = 8 (2.08%, n = 8) | ND | 100%, n = 4 |
| Cation | ChrimsonR-tdTomato | Chlamydomonas noctigama | tdTomato fusion | 520 | ++† | 23.8%, n = 8 (6.25%, n = 8) | ND | 100%, n = 4 |
| Anion | GtACR1-EYFP | Guillardia theta | EYFP fusion | 520 | ++ ‡ | 80.5%, n = 6 § (13.2%, n = 6) | +++ | 100%, n = 4 (0%, n = 4) |
| Enzymorhodopsin | ||||||||
| Guanyly cyclase | BeGC1-EGFP | Blastocladiella emersonii | EGFP fusion | 520 | +++ | 53.5%, n = 8 (10.4%, n = 8) | +++** | 0%, n = 102†† (ND) |
| Photoactivated adenylyl cyclase | ||||||||
| Adenylyl cyclase | bPAC-MT | Beggiatoa | MT-T2A-tDimer | 470 | ++ | 60.6%, n = 8 (26.2%, n = 8) | +++ | 100%, n = 4 ‡ ‡ (ND) |
| Adenylyl cyclase | OaPAC-Flag | Oscillatoria acuminata | Flag-P2A-TagCFP | 470 | ++ | 42.5%, n = 8 (15.4%, n = 8) | +++ | 0%, n = 104 § § (ND) |
-
*
Expression of KnChR-3.0-EYFP was mosaic.
-
†
Expression of CoChR-tdTomato and ChrimsonR-tdTomato was detected by observation with an epifluorescent stereomicroscope.
-
‡
Expression was confirmed by detecting EYFP.
-
§
The percentages of spontaneous tail movements elicited by white light that was inhibited by rhodopsin activation (locomotion-inhibition trials) are indicated (no rhodopsin activation was used as the control).
-
¶
Expression of CrChR2 [T159C]-mCherry was detected by qPCR.
-
**
The expression of BeGC1-EGFP was determined by observation with an epifluorescent microscope MZ16 FA and a fluorescence detection filter (460–500 nm, Leica).
-
††
Cardiac arrest was not induced with 490–510 nm, 530–560 nm (epifluorescent stereomicroscope-equipped light source, n = 100), or 520 nm (LED) light stimuli (n = 2).
-
‡ ‡
Light stimulation with 470 nm LED light for 5 s induced bradycardia, which took a few minutes to return to normal heartbeats.
-
§ §
Stimulation with 460–500 nm (epifluorescent stereomicroscope-equipped light source, n = 100) or 470 nm LED light (n = 4) induced neither cardiac arrest nor bradycardia, while stimulation with 470 nm LED light occasionally induced transient tachycardia for a few seconds (n = 2).
Key resources table
| Reagent type (species) or resource | Designation | Source or reference | Identifiers | Additional information |
|---|---|---|---|---|
| Gene (Guillardia theta) | GtCCR4 | Yamauchi et al., 2017 | GenBank: MF039475.1 | |
| Gene (Klebsormidium nitens) | KnChR | Tashiro et al., 2021 | GenBank: DF236986.1, GAQ79757.1 | |
| Gene (Chlamydomonas reinhardtii) | CrChR2[T159C] | Berndt et al., 2011 | ||
| Gene (Chloromonas oogama) | CoChR | Klapoetke et al., 2014 | ||
| Gene (Chlamydomonas noctigama) | ChrimsonR | Klapoetke et al., 2014 | ||
| Gene (Blastocladiella emersonii) | BeGC1 | Scheib et al., 2015 | GenBank: KP731361.1 | |
| Gene (G. theta) | GtACR1 | Govorunova et al., 2015 | GenBank: KP171708.1 | |
| Gene (Beggiatoa sp.) | bPAC | Stierl et al., 2011 | GenBank: GU461306.2 | |
| Gene (Oscillatoria acuminata) | OaPAC | Ohki et al., 2016 | GenPept: WP_015149803.1 | |
| Genetic reagent (Danio rerio) | mitfaw2/w2 | Lister et al., 1999 | ||
| Genetic reagent (D. rerio) | TgBAC(vsx2:GAL4FF) | Kimura et al., 2013 | TgBAC(vsx2:GAL4FF) nns18Tg | |
| Genetic reagent (D. rerio) | Tg(myl7:GAL4FF) | Accompanying paper | Tg(myl7:GAL4FF)nub38Tg | Available from M. Hibi lab |
| Genetic reagent (D. rerio) | Tg(UAS-hsp70l:GtCCR4-3.0-EYFP) | This paper | Tg(5xUAS-hsp70l:GtCCR4- 3.0-EYFP, myl7:mCherry)nub49Tg | Available from M. Hibi lab |
| Genetic reagent (D. rerio) | Tg(UAS:CoChR-tdTomato) | This paper | Tg(14xUAS-E1b:CoChR-tdTomato)nub120Tg | Available from M. Hibi lab |
| Genetic reagent (D. rerio) | Tg(UAS-hsp70l:ChrimsonR-tdTomato) | This paper | Tg(5xUAS-hsp70l:ChrimsonR, myl7:mCherry)nub119Tg | Available from M. Hibi lab |
| Genetic reagent (D. rerio) | Tg(UAS-hsp70l:GtCCR4-MT-P2A-TagCFP) | This paper | Tg(5xUAS-hsp70l:GtCCR4- MT-P2A-TagCFP, myl7:mCherry)nub50Tg | Available from M. Hibi lab |
| Genetic reagent (D. rerio) | Tg(UAS-hsp70l:KnChR-3.0-EYFP) | This paper | Tg(5xUAS-hsp70l:KnChR-3.0-EYFP, myl7:mCherry)nub51Tg | Available from M. Hibi lab |
| Genetic reagent (D. rerio) | Tg(UAS-hsp70l:CrChR2[T159C]-mCherry) | This paper | Tg(5xUAS-hsp70l:CrChR2 [T159C]-mCherry, myl7:mCherry)nub52Tg | Available from M. Hibi lab |
| Genetic reagent (D. rerio) | Tg(UAS-hsp70l:GtACR1-EYFP) | This paper | Tg(5xUAS-hsp70l:GtACR1- EYFP, myl7:mCherry)nub53Tg | Available from M. Hibi lab |
| Genetic reagent (D. rerio) | Tg(UAS:CoChR-tdTomato) | This paper | Tg(14xUAS-E1b:CoChR-tdTomato)nub120Tg | Available from M. Hibi lab |
| Genetic reagent (D. rerio) | Tg(UAS-hsp70l:ChrimsonR-tdTomato) | This paper | Tg(5xUAS-hsp70l:ChrimsonR-tdTomato)nub119Tg | Available from M. Hibi Lab |
| Genetic reagent (D. rerio) | Tg(UAS-hsp70l:BeGC1-EGFP) | This paper | Tg(5xUAS-hsp70l:BeGC1-EGFP, myl7:mCherry)nub54Tg | Available from M. Hibi lab |
| Genetic reagent (D. rerio) | Tg(UAS-hsp70l:bPAC-MT-T2A-tDimer) | This paper | Tg(5xUAS-hsp70l:bPAC-MT-T2A-tDimer, myl7:mCherry)nub55Tg | Available from M. Hibi lab |
| Genetic reagent (D. rerio) | Tg(UAS-hsp70l:OaPAC-Flag-P2A-TagCFP) | This paper | Tg(5xUAS-hsp70l: OaPAC-Flag-P2A-TagCFP, myl7:mCherry)nub56Tg | Available from M. Hibi lab |
| Genetic reagent (D. rerio) | Tg(UAS-hsp70l:GCaMP6s) | Muto et al., 2017 | Tg(5xUAS-hsp70l:GCaMP6s) nkUAShspzGCaMP6s13aTg | |
| Genetic reagent (D. rerio) | Tg(elavl3:Flamindo2) | This paper | Tg(elavl3:Flamindo2)nub57TG | Available from M. Hibi lab |
| Cell line (hybrid of Rattus norvegicus and Mus musculus) | ND7/23 | Wood et al., 1990 | ECACC 92090903 | https://www.saibou.jp/en/reagents/ |
| Recombinant DNA reagent | pCS2+GtCCR4-3.0-EYFP | This paper | Available from M. Hibi lab | |
| Recombinant DNA reagent | pCS2+GtCCR4- MT-P2A-TagCFP | This paper | Available from M. Hibi lab | |
| Recombinant DNA reagent | pCS2+CrChR2 [T159C]-mCherry | This paper | Available from M. Hibi lab | |
| Recombinant DNA reagent | pBH-R1-R2 | Accompanying paper | Available from M. Hibi lab | |
| Recombinant DNA reagent | pENTR L1-5xUAS-hsp70l-R5 | Accompanying paper | Available from M. Hibi lab | |
| Recombinant DNA reagent | pENTR L5-GtCCR4-MT-P2A-TagCFP-SV40pAS-L2 | This paper | Available from M. Hibi lab | |
| Recombinant DNA reagent | pENTR L5-KnChR-3.0-EYFP-SV40pAS -L2 | This paper | Available from M. Hibi lab | |
| Recombinant DNA reagent | pENTR L5-GtACR1-EYFP-SV40pAS-L2 | This paper | Available from M. Hibi lab | |
| Recombinant DNA reagent | pENTR L5-CrChR2[T159C]-mCherry-SV40pAS-L2 | This paper | Available from M. Hibi lab | |
| Recombinant DNA reagent | pENTR L5-BeGC1-EGFP-SV40pAS-L2 | This paper | Available from M. Hibi lab | |
| Recombinant DNA reagent | pENTR L5-BeGC1-EGFP-SV40pAS-L2 | This paper | Available from M. Hibi lab | |
| Recombinant DNA reagent | pENTR L5-bPAC-MT-T2A-tDimer-SV40pAS-L2 | This paper | Available from M. Hibi lab | |
| Recombinant DNA reagent | pENTR L5-OaPAC-Flag-P2A-TagCFP-SV40pAS-L2 | This paper | Available from M. Hibi lab | |
| Antibody | Mouse monoclonal anti-Flag antibody | Sigma-Aldrich | Cat# F3165; RRID:AB_259529 | Dilution 1:500 |
| Antibody | Mouse monoclonal anti-Myc tag antibody | Santa Cruz Biotechnology | Cat# sc-40; RRID:AB_627268 | Dilution 1:500 |
| Antibody | Rat monoclonal anti-GFP antibody | Nacalai Tesque, Inc. | Cat# 04404-84; RRID:AB_10013361 | Dilution 1:500 |
| Antibody | Rabbit polyclonal anti-DsRed antibody | Takara Bio | Cat# 632496; RRID:AB_10013483 | Dilution 1:500 |
| Antibody | Goat CF488A anti-mouse IgG antibody | Biotium, Inc | Cat# 20018; RRID:AB_10557263 | Dilution 1:500 |
| Antibody | Goat CF488A anti-rat IgG antibody | Biotium, Inc | Cat# 20023; RRID: AB_10557403 | Dilution 1:500 |
| Antibody | Goat CF568 anti-rabbit IgG antibody | Biotium, Inc | Cat# 20103; RRID:AB_10558012 | Dilution 1:500 |
| Chemical compound, drug | tricaine methanesulfonate | Nacalai Tesque, Inc | Cat# 01916-32 | |
| Chemical compound, drug | low gelling temperature Type VII-A | Sigma-Aldrich | A0701 | |
| Chemical compound, drug | pentylenetetrazol | Sigma-Aldrich | Cat# P6500 | |
| Software, algorithm | SutterPatch 1.1.1 | Sutter Instrument Co. | https://www.sutter.com/AMPLIFIERS/SutterPatch.html | |
| Software, algorithm | pCLAMP10.6 | Molecular Devices | https://support.moleculardevices.com/s/article/Axon-pCLAMP-10-Electrophysiology-Data-Acquisition-Analysis-Software-Download-Page | |
| Software, algorithm | PolyScan2 | Mightex | ||
| Software, algorithm | StreamPix7 | NorPix Inc | ||
| Software, algorithm | LabVIEW | National Instruments | 2015 | https://www.ni.com/ja-jp.html |
| Software, algorithm | GraphPad Prism5 | GraphPad Software | https://www.mdf-soft.com/ | |
| Software, algorithm | VSDC Free Video Editor 6.4.7.155 | FLASH-INTEGRO LLC | https://www.videosoftdev.com/jp | |
| Software, algorithm | Microsoft Movies & TV | Microsoft Corp. | https://apps.microsoft.com/store/detail/movies-tv/9WZDNCRFJ3P2 | |
| Software, algorithm | QuickTime player 10.5 | Apple Inc. | https://quicktime.softonic.jp/ | |
| Software, algorithm | Fiji/ImageJ | National Institutes of Health (NIH) | http://fiji.sc/ | |
| Software, algorithm | R 3.6.1 and 4.2.1 | https://www.r-project.org/ | ||
| Software, algorithm | ggplot2 3.2.0 of R | https://ggplot2.tidyverse.org | ||
| Software, algorithm | nlme 3.1–162 of R | https://cran.r-project.org/web/packages/nlme/index.html | ||
| Software, algorithm | Bonsai | Lopes et al., 2015 | https://open-ephys.org/bonsai | |
| Software, algorithm | Python 3.5.6 | Python Software Foundation | https://www.python.org/ | |
| Software, algorithm | Tracker Video Analysis and Modeling Tool for Physics Education 5.1.5 | https://physlets.org/tracker/ | ||
| Software, algorithm | Microsoft Excel for Mac, ver. 16.74 | Microsoft | ||
| Software, algorithm | HB_frequency.py | This paper | Source code file |
Additional files
-
MDAR checklist
- https://cdn.elifesciences.org/articles/83975/elife-83975-mdarchecklist1-v1.pdf
-
Source code 1
Software that detects the timing of each heartbeat from the data of luminosity changes over time.
- https://cdn.elifesciences.org/articles/83975/elife-83975-code1-v1.zip
Download links
A two-part list of links to download the article, or parts of the article, in various formats.
Downloads (link to download the article as PDF)
Open citations (links to open the citations from this article in various online reference manager services)
Cite this article (links to download the citations from this article in formats compatible with various reference manager tools)
Optogenetic manipulation of neuronal and cardiomyocyte functions in zebrafish using microbial rhodopsins and adenylyl cyclases
eLife 12:e83975.
https://doi.org/10.7554/eLife.83975


