Early-life experience reorganizes neuromodulatory regulation of stage-specific behavioral responses and individuality dimensions during development
- Faculty of Biology, Technion - Israel Institute of Technology, Israel
Figures
Figure 1 with 1 supplement
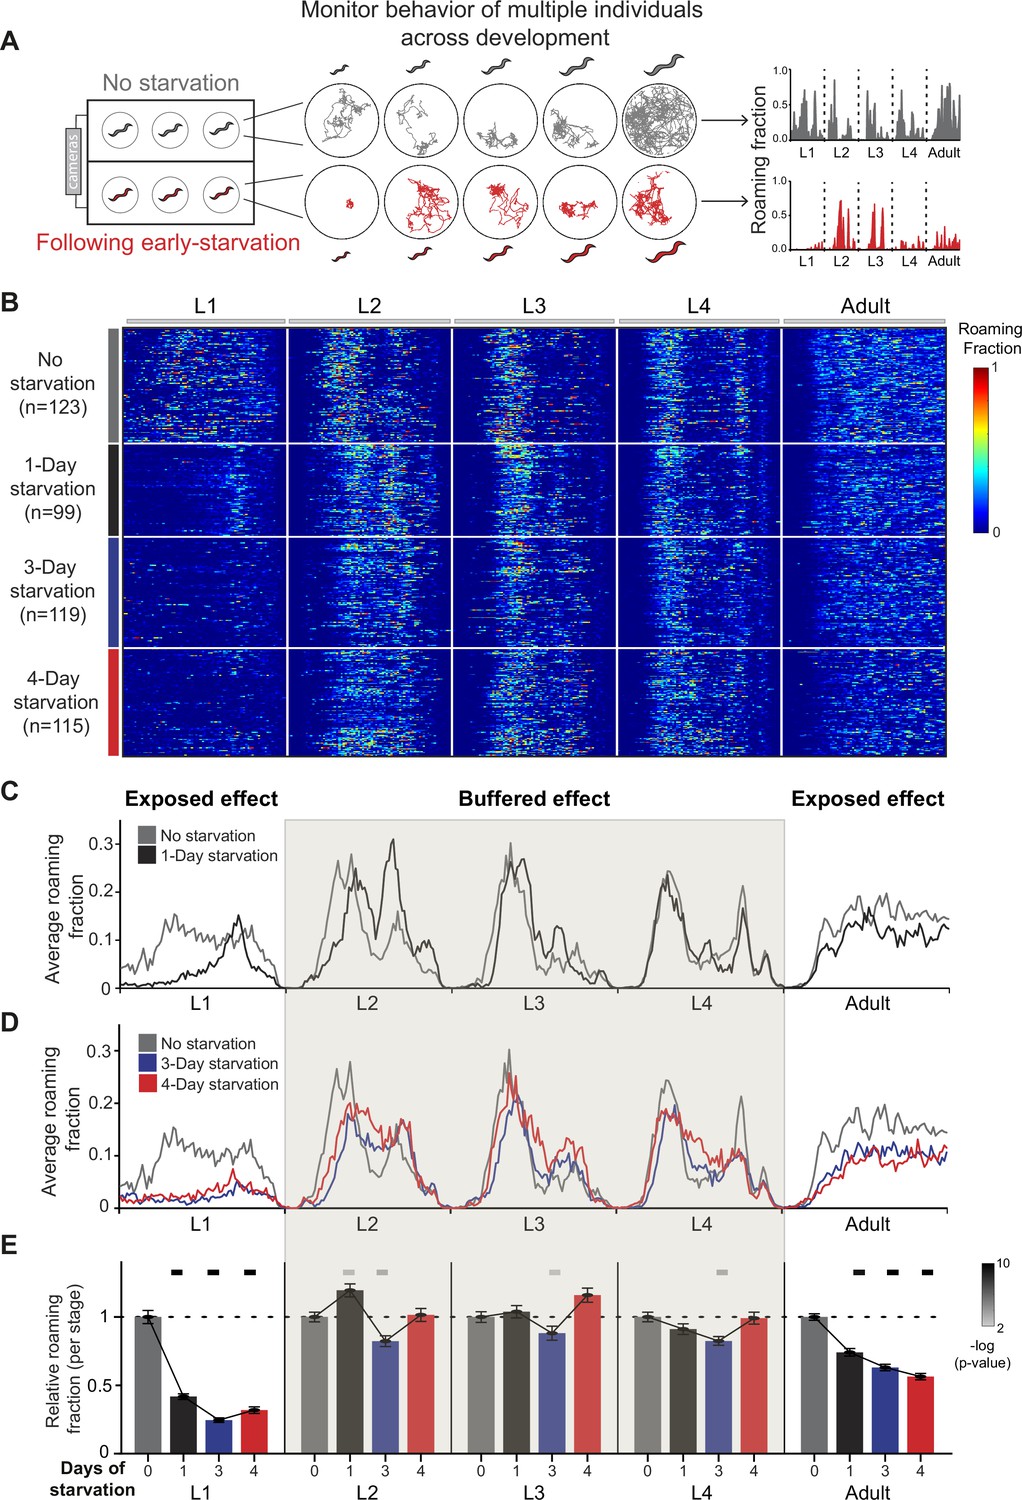
Long-term behavioral tracking of C. elegans following early starvation reveals discontinuous behavioral effects across developmental stages.
(A) Multi-camera imaging system allows longitudinal behavioral tracking of multiple individual worms across all stages of development following early L1 starvation and without starvation, under tightly controlled environmental conditions. Shown are representative locomotion trajectories (middle) and age-normalized roaming activity (right) of post-starved (red) and well-fed (gray) individual worms across all four larval stages and adulthood. Normalization equally divides each stage into 75 time bins. (B) Roaming and dwelling behavior of wild-type N2 animals without early starvation (n = 123) and following 1-day (n = 99), 3-day (n = 119), and 4-day starvation (n = 115). Each row indicates the age-normalized behavior of one individual across all developmental stages. The different stages are separated by vertical white lines indicating the middle of the lethargus state. Color bar represents the fraction of time spent roaming in each of the 375 time bins. (C) Average roaming fraction of 1-day starved wild-type animals compared to the unstarved population. (D) Average roaming fraction of 3- and 4-day starved wild-type animals compared to the unstarved population. (E) Average roaming fraction relative to the unstarved population in each developmental stage. Shading highlights intermediate stages of development in which average behavioral effects within a stage are buffered. Error bars indicate standard error of the mean. Upper bars indicate statistical significance (Wilcoxon rank-sum test, False Discovery Rate (FDR) corrected) of difference in average roaming fraction between starved and unstarved populations (−log(p-value), indicated are p-values <0.01).
Figure 1—figure supplement 1
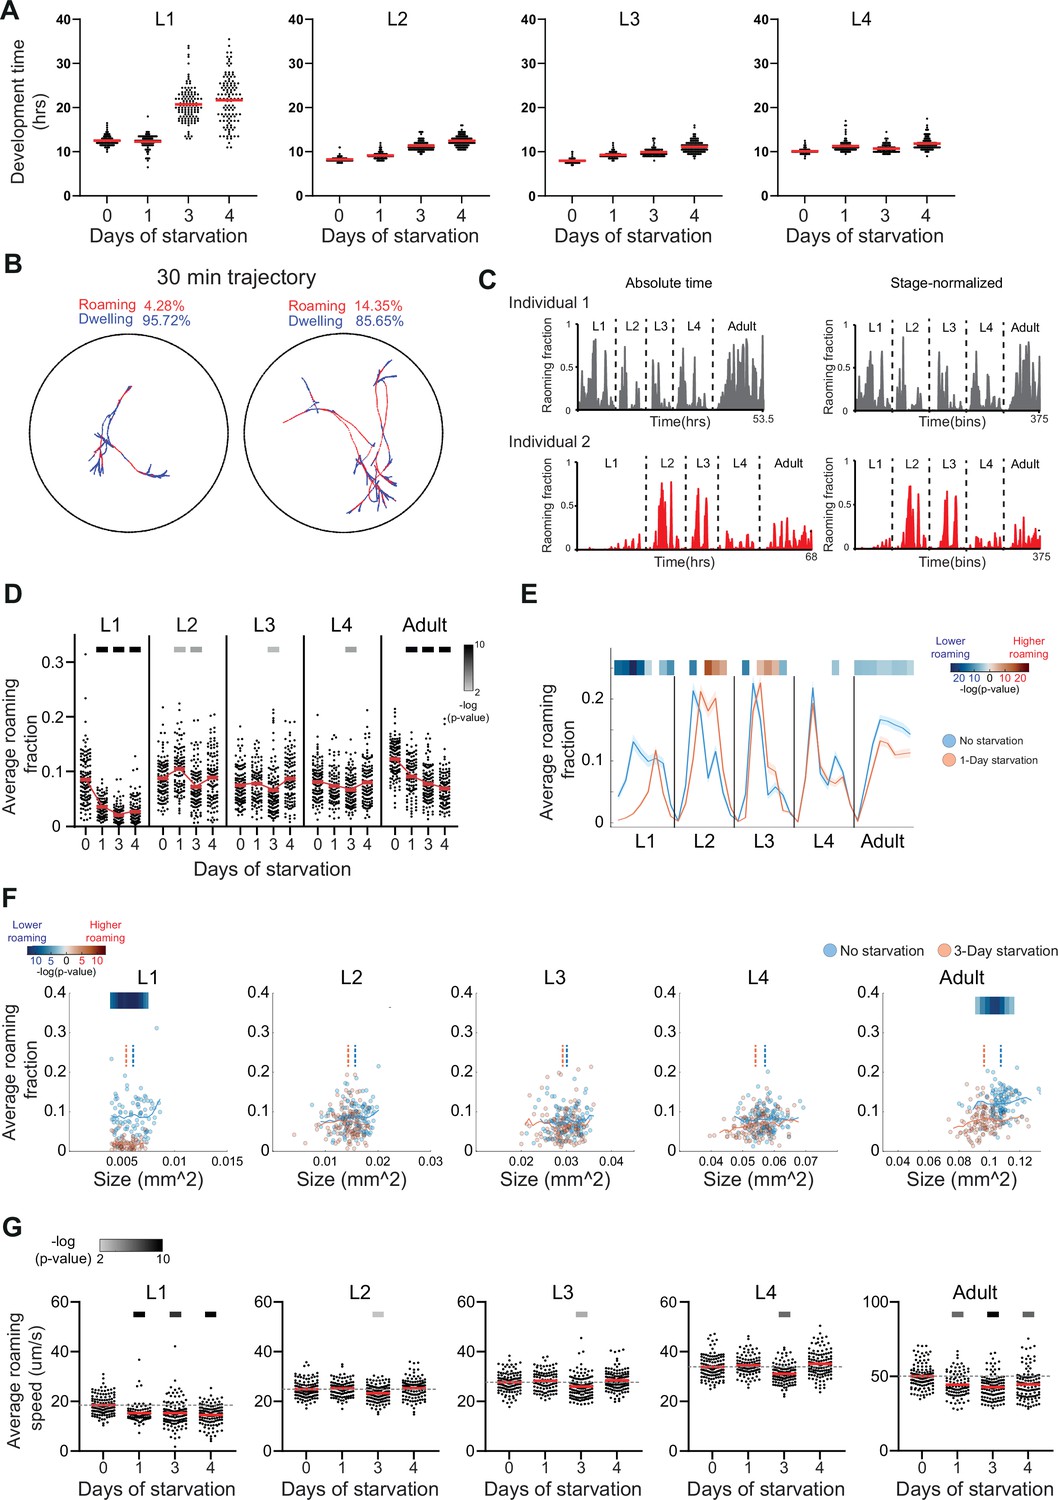
Development time, behavioral trajectory synchronization, and roaming quantification in starved and unstarved wild-type individuals.
(A) Development time across L1–L4 larval stages within starved and unstarved wild-type (N2) populations (no starvation n = 123, 1-day starvation n = 99, 3-day starvation n = 119, 4-day starvation n = 115). (B) Examples of 30-min behavioral trajectories of adult individuals. Roaming and dwelling episodes are indicated in red and blue, respectively. (C) Absolute time (left) and age-normalized (right) roaming activity of a starved (red) and unstarved (gray) single individuals across all developmental windows. Normalization synchronizes behavioral trajectories of different individuals by dividing each life stage of each individual into 75 equal time windows. (D) Average roaming fraction of starved and unstarved individuals in each developmental stage. Upper bars indicate statistical significance (Wilcoxon rank-sum test, FDR corrected) of the difference between unstarved and starved populations in each developmental stage (−log(p-value), indicated are p-values <0.01). (E) Average roaming fraction of starved and unstarved wild-type individuals across 40 developmental windows (8 per stage). Upper bars indicate statistical significance (Wilcoxon rank-sum test, FDR corrected) of the difference between 1-day starved and unstarved populations in each developmental window (−log(p-value)). Color code marks higher (red) or lower (blue) roaming activity, relative to the unstarved population. Indicated are p-values <0.01. Shaded area indicates standard error of the mean. (F) Comparison of roaming behavior between size-matched individuals of the starved and unstarved wild-type populations. Lines represent roaming running average of the population. Upper bars indicate statistical significance (Wilcoxon rank-sum test, FDR corrected) of the difference in roaming activity between starved and unstarved populations in 20 running size windows (−log(p-value)). Color code marks higher (red) or lower (blue) roaming activity, relative to the unstarved population (min of five animals for each condition in each tested size window). Indicated are p-values <0.01. Dashed lines indicate size median of the population. Each point represents average size of a single individual within a stage. (G) Average roaming speed of starved and unstarved individuals in each developmental stage. Upper bars indicate statistical significance (Wilcoxon rank-sum test, FDR corrected) of the difference between starved and unstarved populations in each developmental stage (−log(p-value)), indicated are p-values <0.01. Each point in (A, D, F, G) represents a single individual. Red bars in (A, D, G) represent population mean.
Figure 2 with 1 supplement
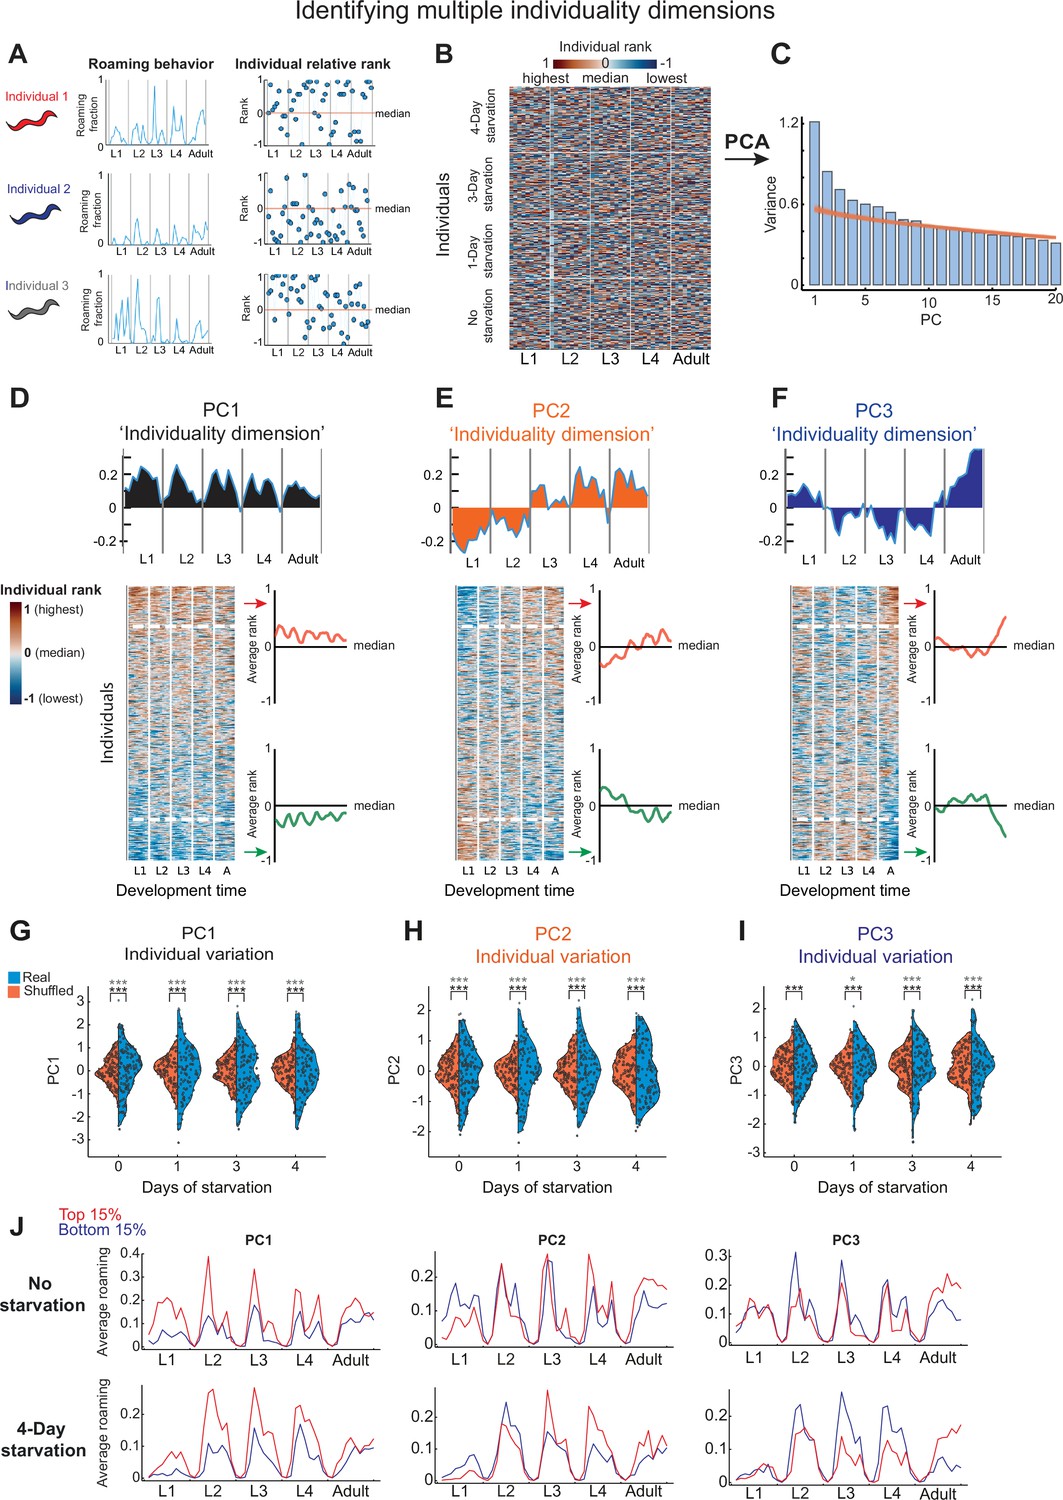
Unsupervised analysis of temporal individuality dimensions across development.
(A) Individual animals are ranked based on their roaming activity in each time window compared to other individuals within the same experiment. (B) Heat-map represents relative rank of all N2 wild-type individuals (n = 456) across 50 time windows (10 per developmental stage). (C) Variance explained by each of the first 20 PCs following principal component analysis (PCA; blue bars), compared to the variance explained by the first 20 PCs extracted from PCA of a shuffled dataset (500 repetitions, orange lines). (D–F) PC1–3 represent the first three temporal individuality dimensions. For each PC individuality dimension shown are its components in each time window (top) and individuals sorted based on their PC score (bottom). Heat map is smoothed (4-bins window) for visual clarity. Average relative rank is plotted for extreme individuals (top and bottom 15%) within each individuality dimension. Midline represents the population median. (G–I) Distributions of individual scores (blue) within starved and unstarved wild-type populations for PC1–3 individuality dimensions, compared to distributions of individual scores of a shuffled dataset in the same PCA space (orange). p-values above distributions were calculated using bootstrapping (see Methods) for significance of difference in PC1–3 variation to variation of a shuffled dataset in the same PCA space (bottom asterisks) or in a PCA space extracted from the shuffled dataset (upper asterisks). (J) Average roaming activity of top (red) and bottom (blue) 15% of extreme individuals within each of the PC1–3 individuality dimensions in 4-day starved and unstarved wild-type populations. *p < 0.05, ***p < 0.001 (FDR corrected).
Figure 2—figure supplement 1
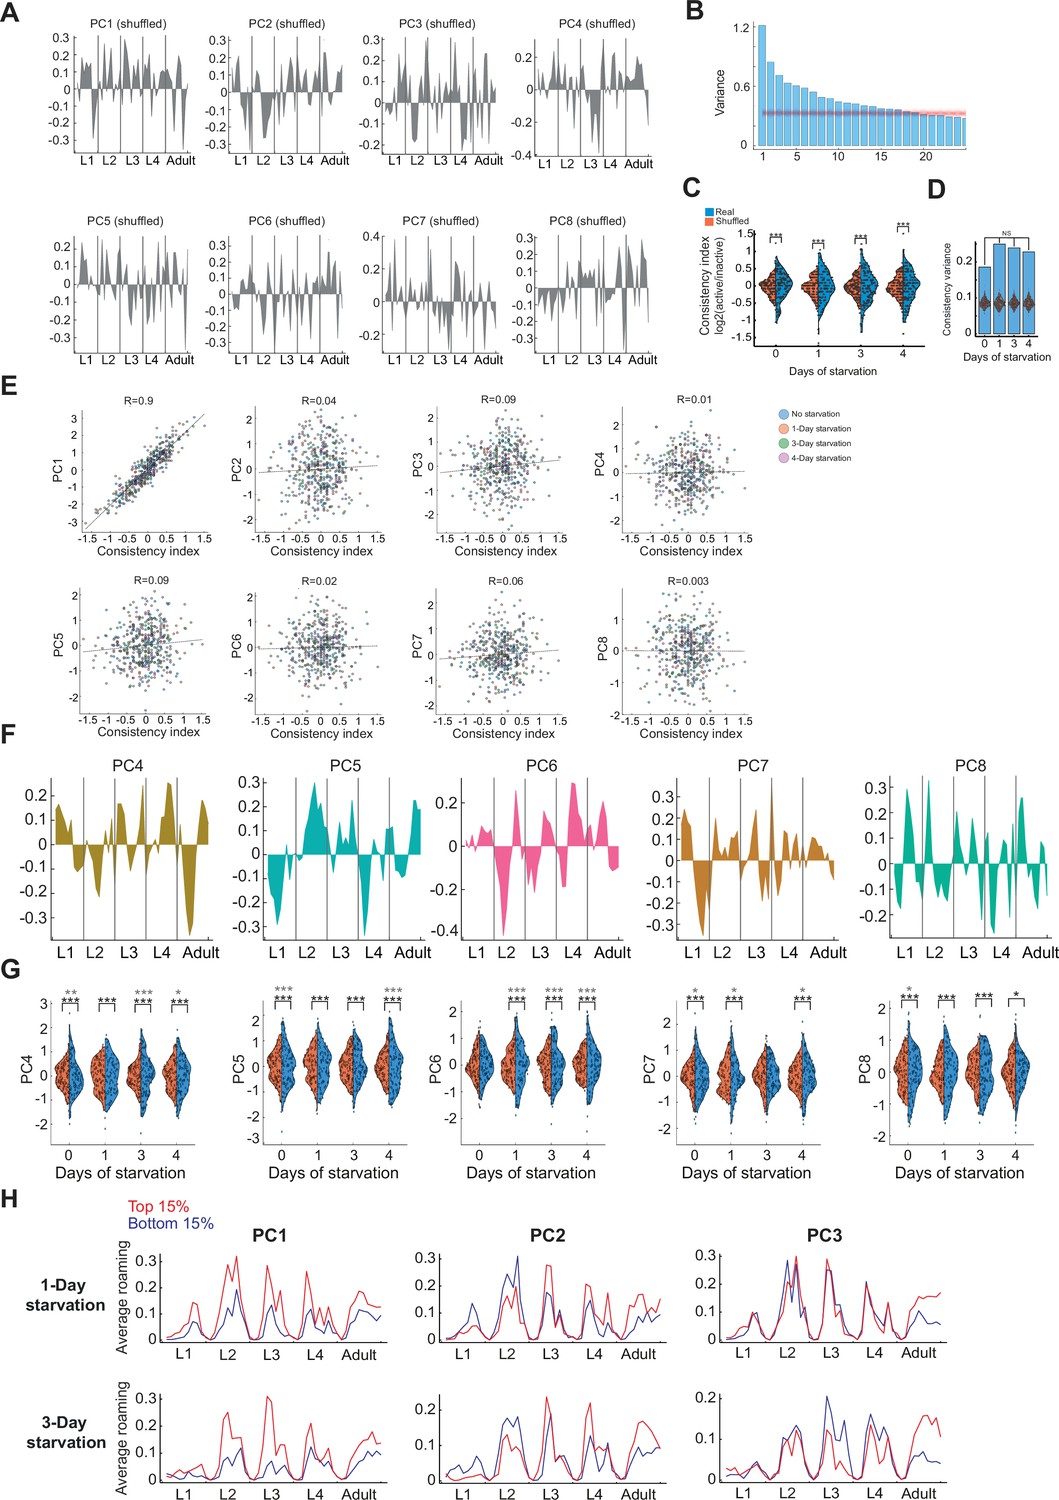
Principal component analysis (PCA) and behavioral consistency analyses.
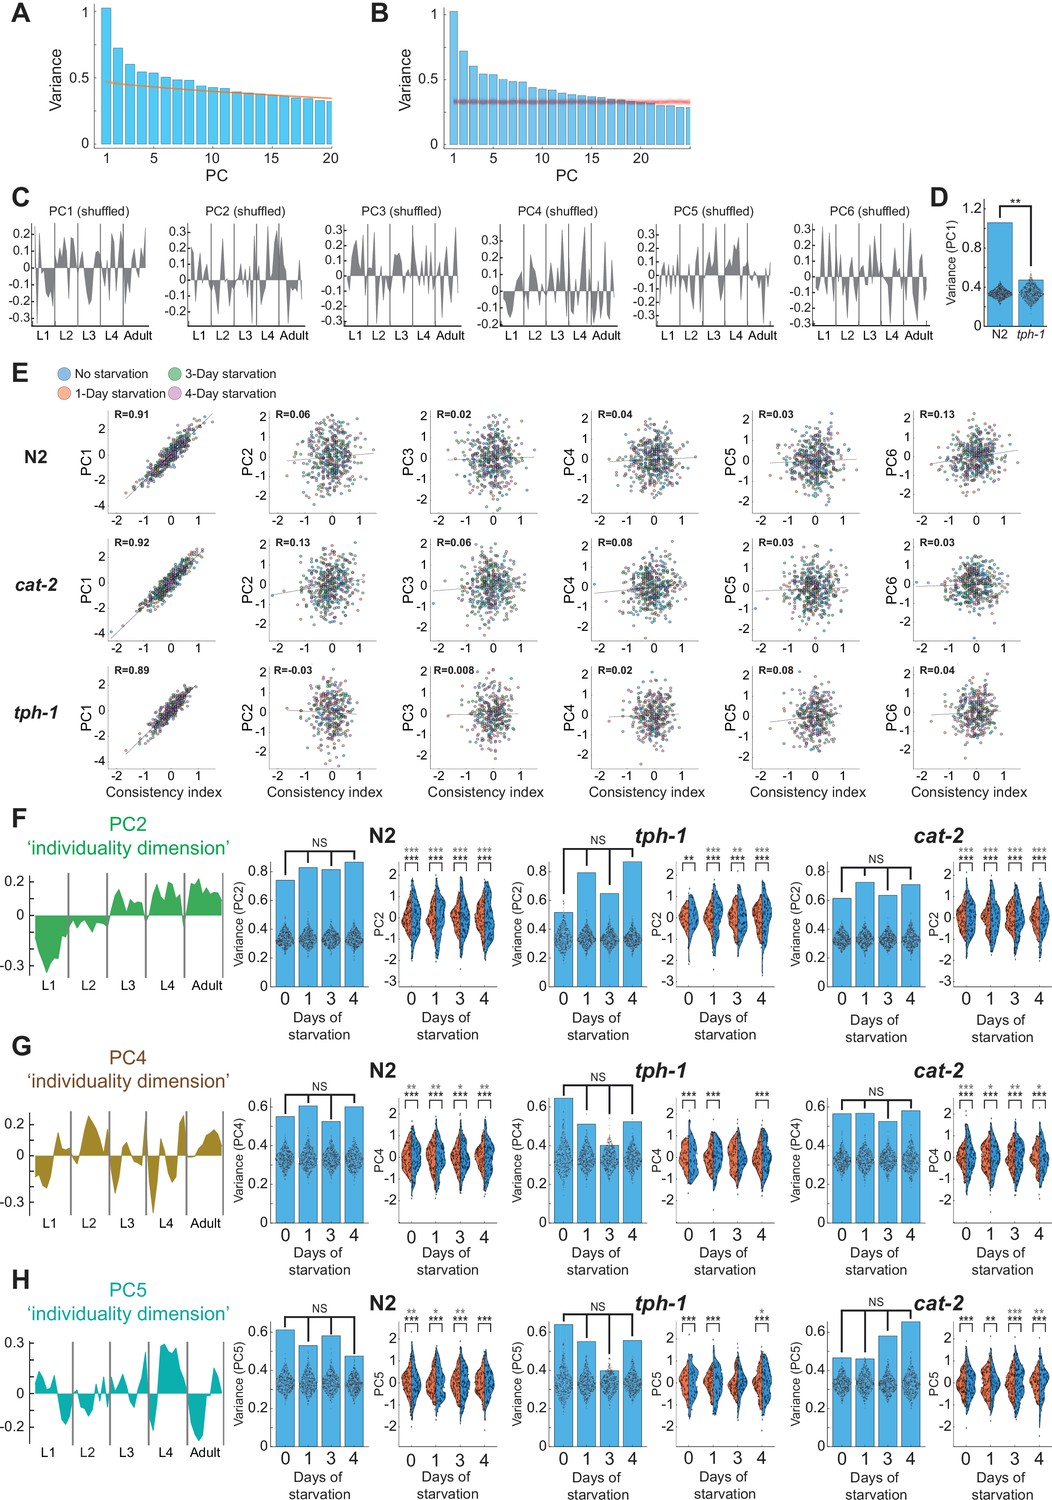
(A) PC1–8 vectors across developmental time bins extracted by PCA of a shuffled behavioral rank dataset. (B) Variance explained by each of the first 25 PCs following PCA (blue bars), compared to the variance of a shuffled dataset within the same PCA space (500 repetitions, orange lines). (C) Distributions of consistency indices representing homogeneous behavioral consistency of individuals across development in starved and unstarved wild-type individuals (blue) compared to shuffled dataset (orange). p-values were calculated using bootstrapping (see Methods). (D) Inter-individual variation in behavioral consistency indices in (C). p-values were calculated between variation values of starved and unstarved populations using bootstrapping (see Methods). Each dot within bars represents inter-individual variation within a shuffled dataset (500 repetitions). (E) Correlation between behavioral consistency indices and PC1–8 scores of individuals within starved and unstarved wild-type populations. Each dot is a single individual, colored by starvation condition. Dotted line is linear least-squares regression with intercept. Pearson correlation coefficient R is noted above each subplot. (F) PC4–8 vectors across developmental time bins following PCA of wild-type behavioral rank dataset. (G) Distributions show dispersion of PC4–8 individual scores (blue) within starved and unstarved wild-type populations, compared to a shuffled rank dataset in the same PCA space (orange). p-values above distributions were calculated using bootstrapping (see Methods) for difference in PC4–8 variation to variation of a shuffled dataset in the same PCA space (bottom asterisks) or in a PCA space extracted from the shuffled dataset (upper asterisks). (H) Average roaming activity of top (red) and bottom (blue) 15% of extreme individuals within each of the PC1–3 individuality dimensions in 1- and 3-day starved wild-type populations. *p < 0.05, **p < 0.01, ***p < 0.001 (FDR corrected).
Figure 3 with 1 supplement
Dopamine buffers long-term behavioral effects during intermediate stages of development.
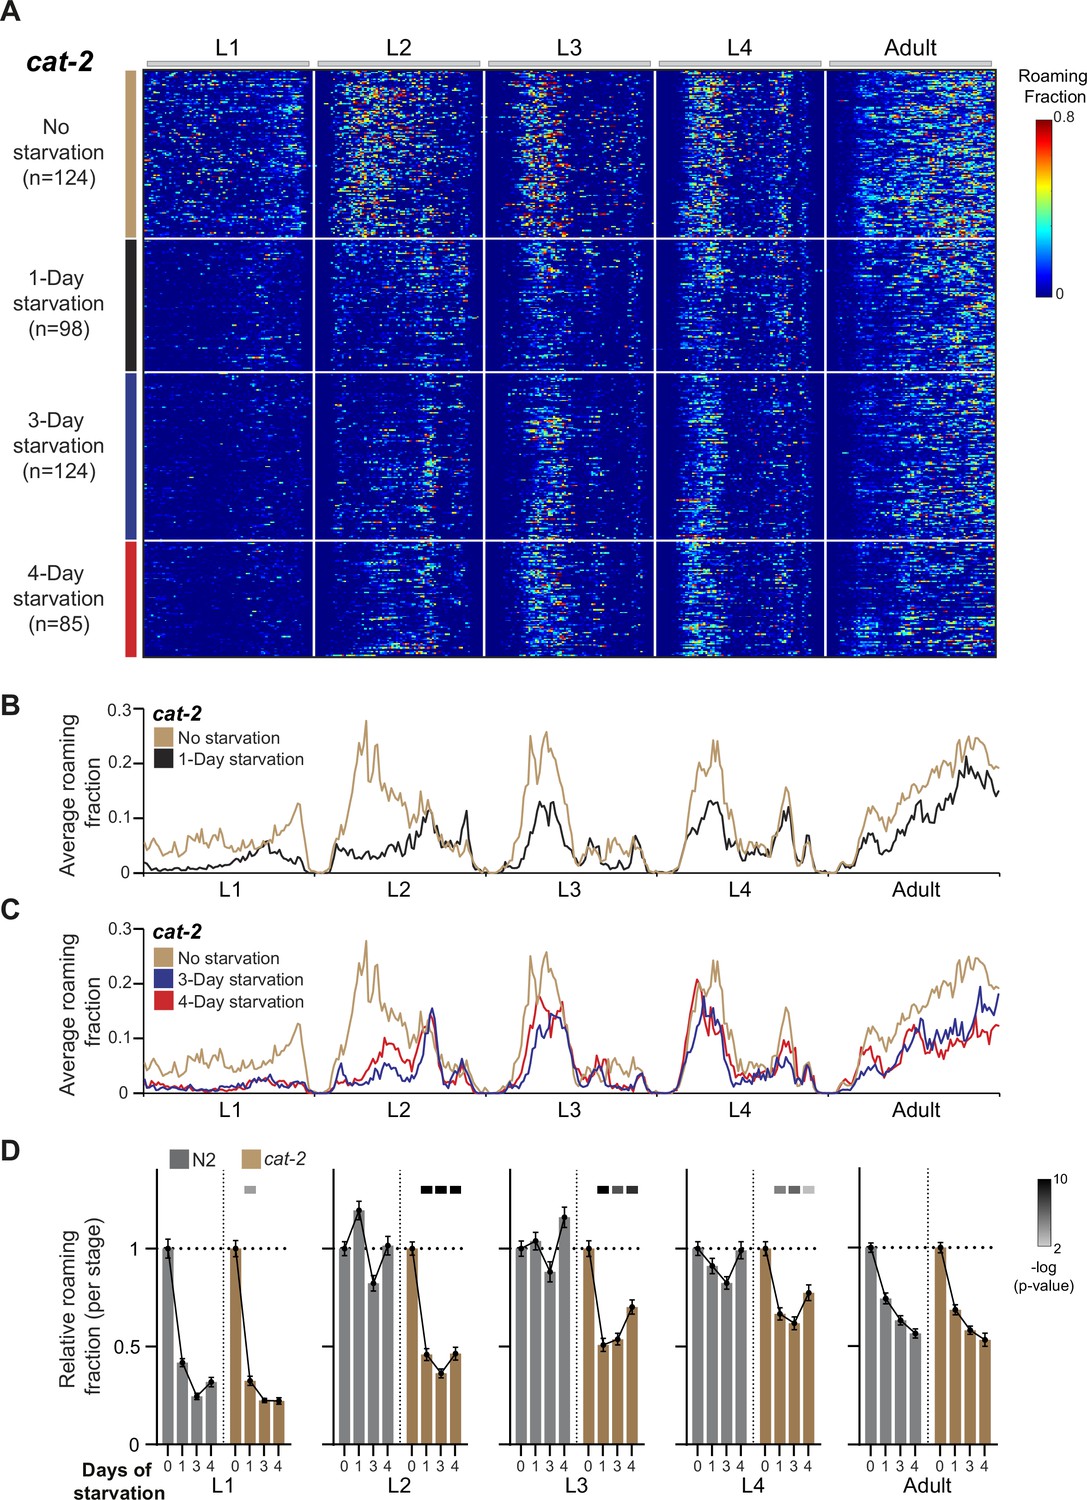
(A) Roaming and dwelling behavior of cat-2 animals without early starvation (n = 124) and following 1-day (n = 98), 3-day (n = 124), and 4-day starvation (n = 85). Each row indicates the age-normalized behavior of one individual across all developmental stages. The different stages are separated by white lines indicating the middle of the lethargus state. Color bar represents the fraction of time spent roaming in each of the 375 time bins. (B) Average roaming fraction of 1-day starved cat-2 animals compared to the unstarved population. (C) Average roaming fraction of 3- and 4-day starved cat-2 animals compared to the unstarved population. (D) Average roaming fraction relative to the unstarved population in cat-2 and wild-type individuals, in each developmental stage. Error bar indicates standard error of the mean. Upper bars indicate statistical significance (Wilcoxon rank-sum test, FDR corrected) of the difference in behavioral effect following early stress between the cat-2 and wild-type populations (−log(p-value), indicated are p-values <0.01).
Figure 3—figure supplement 1
Development time and roaming quantification in starved and unstarved cat-2 individuals.
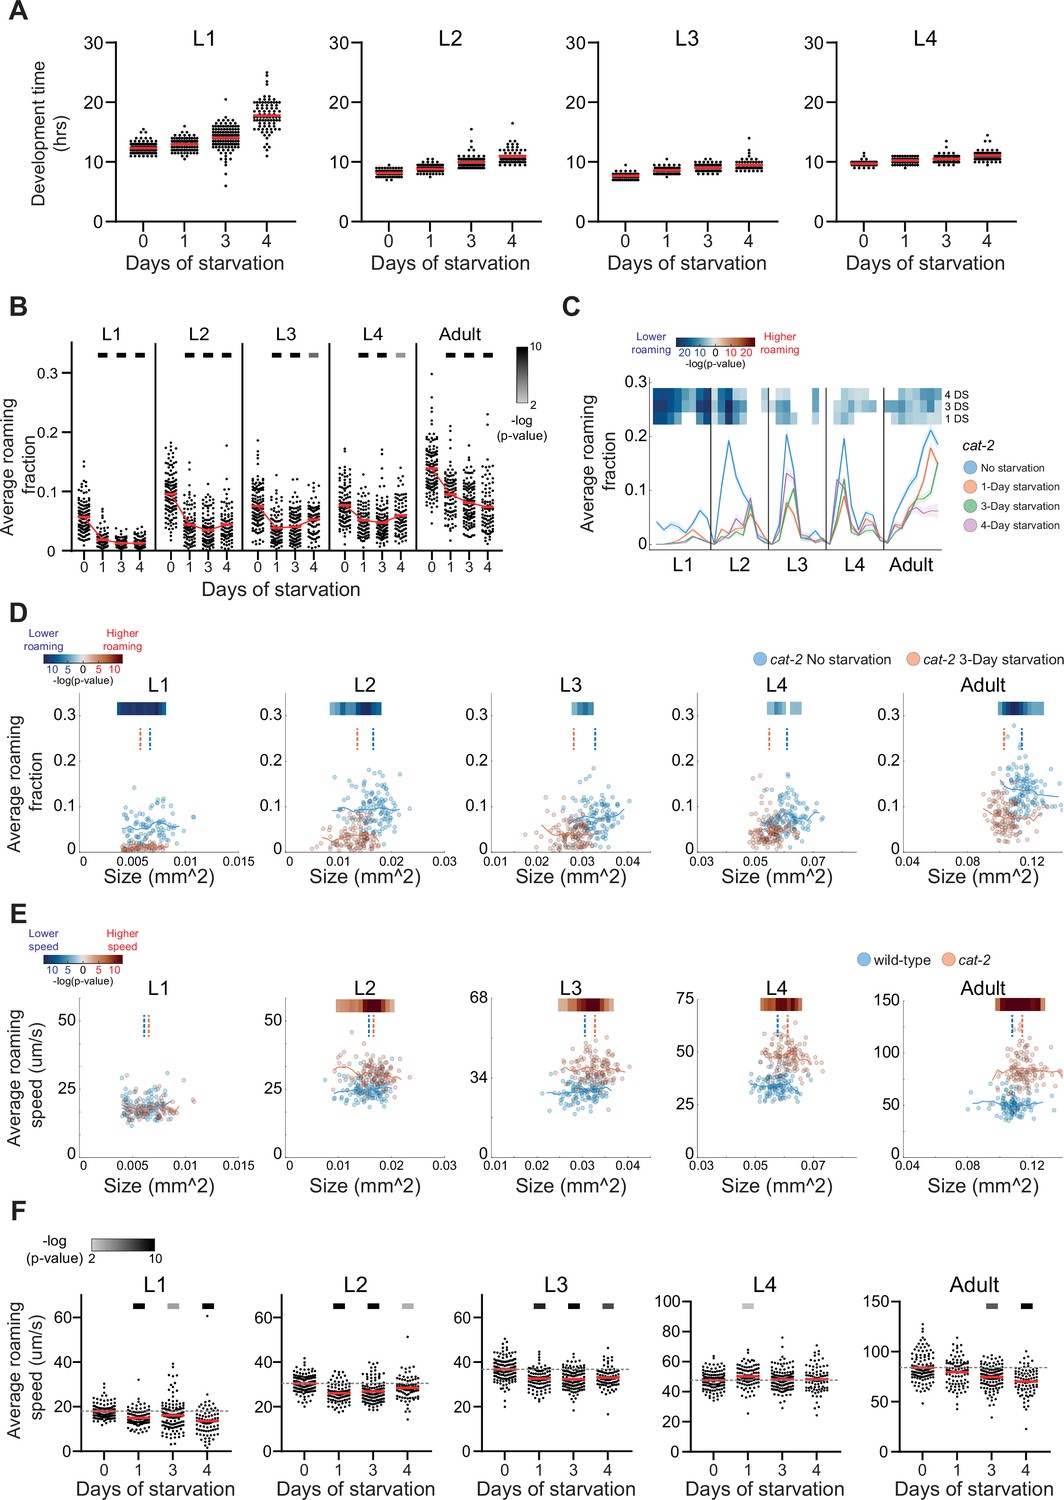
(A) Development time across L1–L4 larval stages within starved and unstarved cat-2 populations (no starvation n = 124; 1-day starvation n = 98; 3-day starvation n = 124; 4-day starvation n = 85). (B) Average roaming fraction of starved and unstarved cat-2 individuals in each developmental stage. Upper bars indicate statistical significance (Wilcoxon rank-sum test, FDR corrected) of the difference between unstarved and starved populations in each developmental stage (−log(p-value)). Indicated are p-values <0.01. (C) Average roaming fraction of starved and unstarved cat-2 individuals across 40 developmental windows (8 per stage). Upper bars indicate statistical significance (Wilcoxon rank-sum test, FDR corrected) of the difference between starved and unstarved populations in each developmental window (−log(p-value)). Color code marks higher (red) or lower (blue) roaming activity, relative to the unstressed population. Indicated are p-values <0.01. Shaded area indicates standard error of the mean. (D) Comparison of roaming behavior in size-matched individuals between starved and unstarved cat-2 populations. Lines represent roaming running average of the population. Upper bars indicate statistical significance (Wilcoxon rank-sum test, FDR corrected) of the difference in roaming activity in 20 running size windows (−log(p-value)). Color code marks higher (red) or lower (blue) roaming activity, relative to the unstarved population (min of five animals for each condition in each tested size window). Indicated are p-values <0.01. Dashed lines indicate size median of the population. Each point represents average size of a single individual within a stage. (E) Comparison of roaming speed in size-matched individuals between unstarved cat-2 and wild-type populations. Lines represent roaming speed running average of the population. Upper bars indicate statistical significance (Wilcoxon rank-sum test, FDR corrected) of the difference in roaming speed in 20 running size windows (−log(p-value)). Color code marks higher (red) or lower (blue) roaming speed, relative to the wild-type population (min of five animals for each condition in each tested size window). Indicated are p-values <0.01. Dashed lines indicate size median of the population. Each point represents average size of a single individual within a stage. (F) Average roaming speed of starved and unstarved cat-2 individuals in each developmental stage. Upper bars indicate statistical significance (Wilcoxon rank-sum test, FDR corrected) of the difference between unstarved and starved populations in each developmental stage (−log(p-value)). Indicated are p-values <0.01. Each point in (A, B, D–F) represents a single individual. Red bars in (A, B, F) represent population mean.
Figure 4 with 3 supplements
Effects of exogenous dopamine and temporally restricted functions of dopamine receptors across intermediate developmental stages.
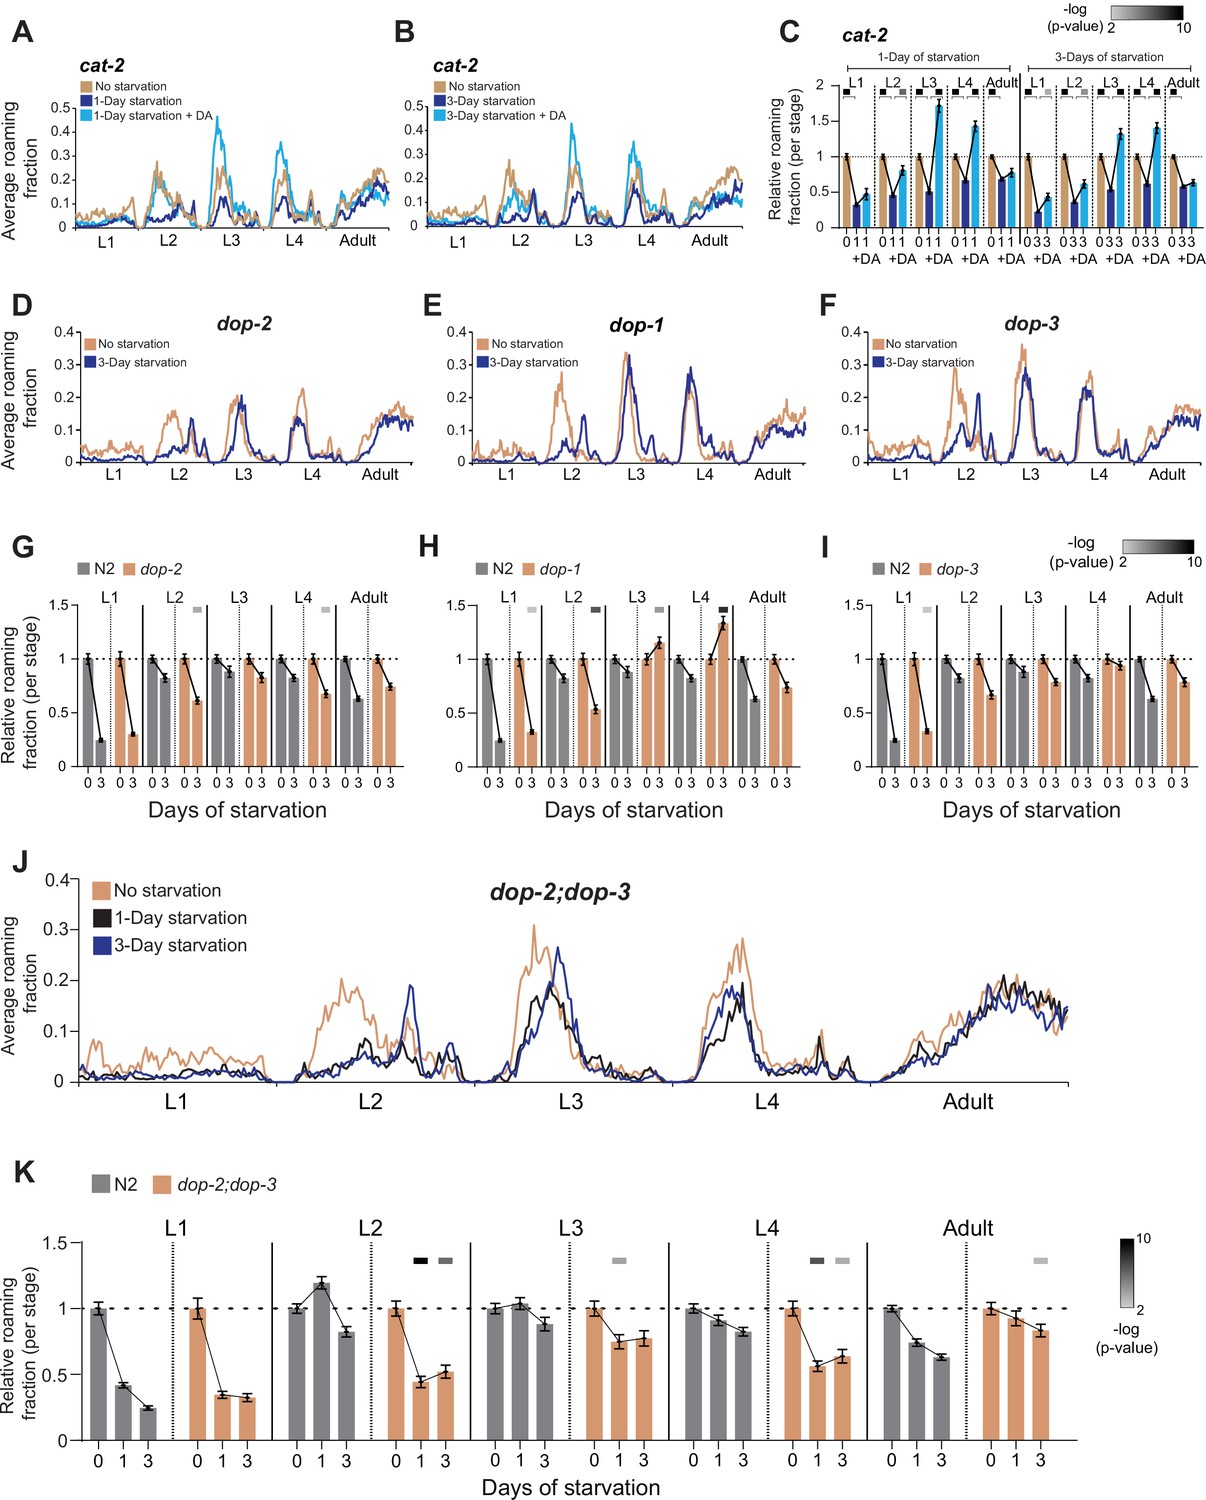
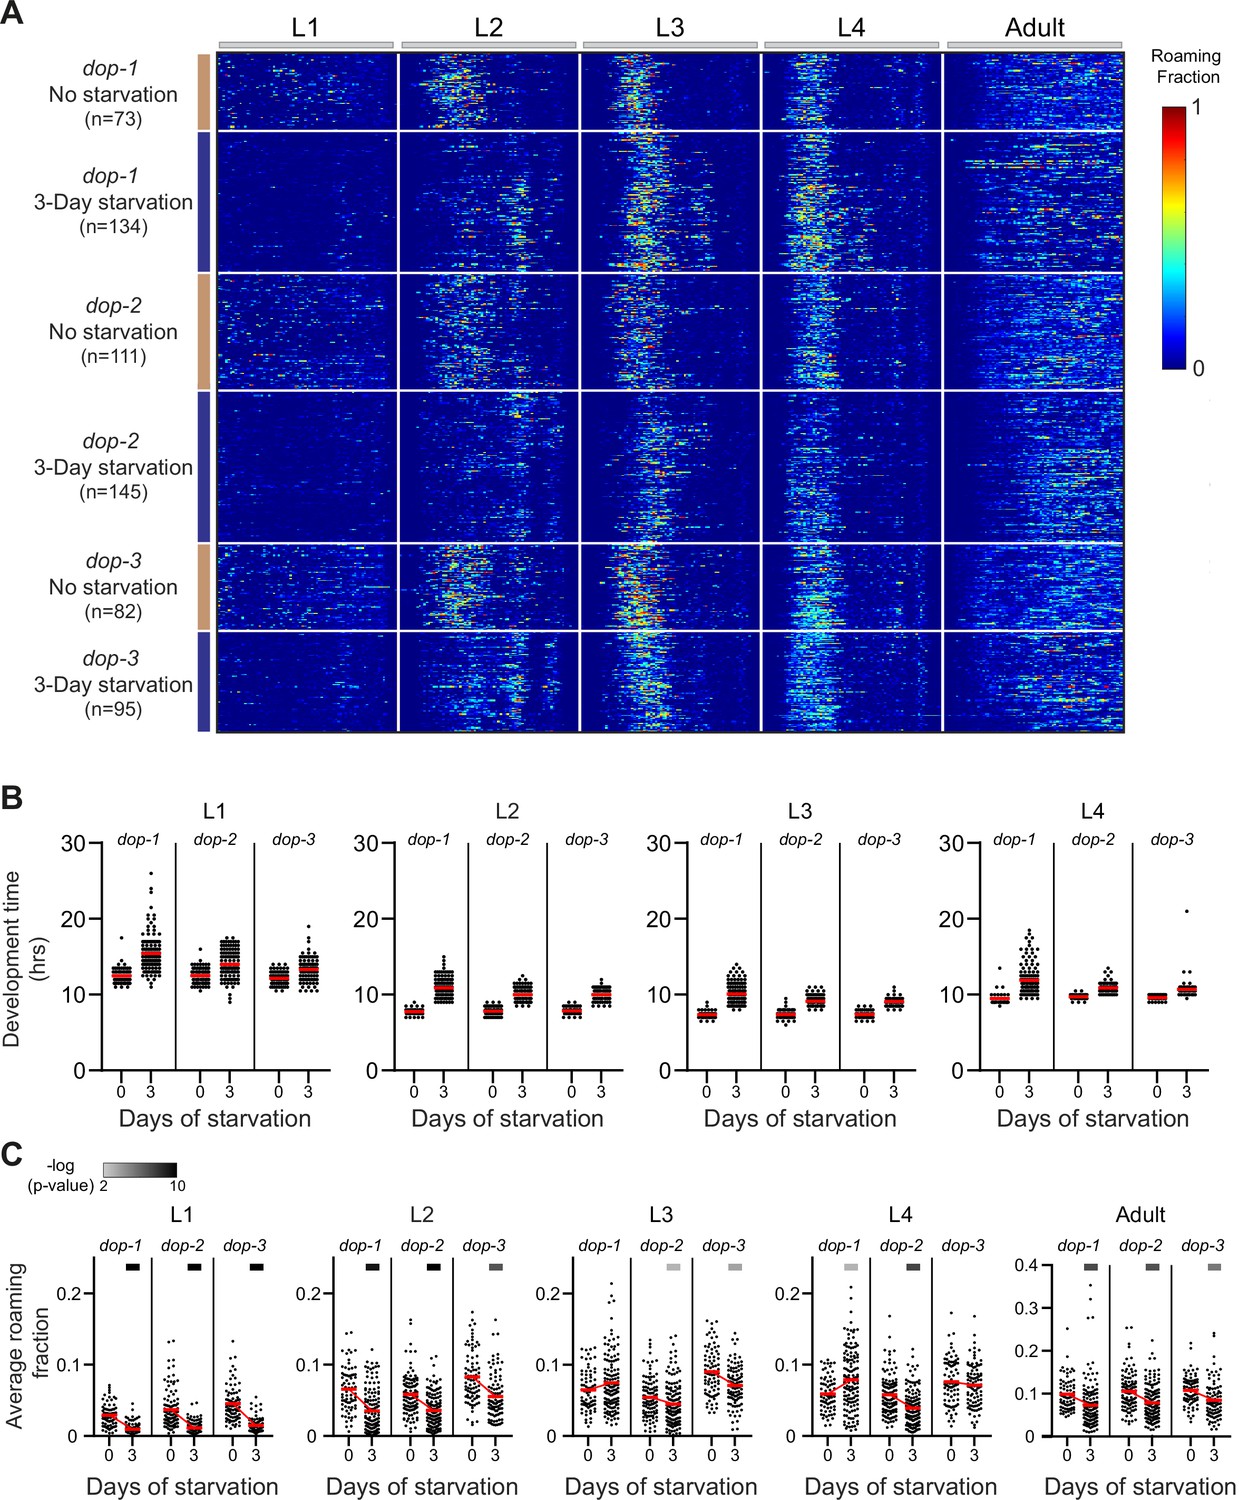
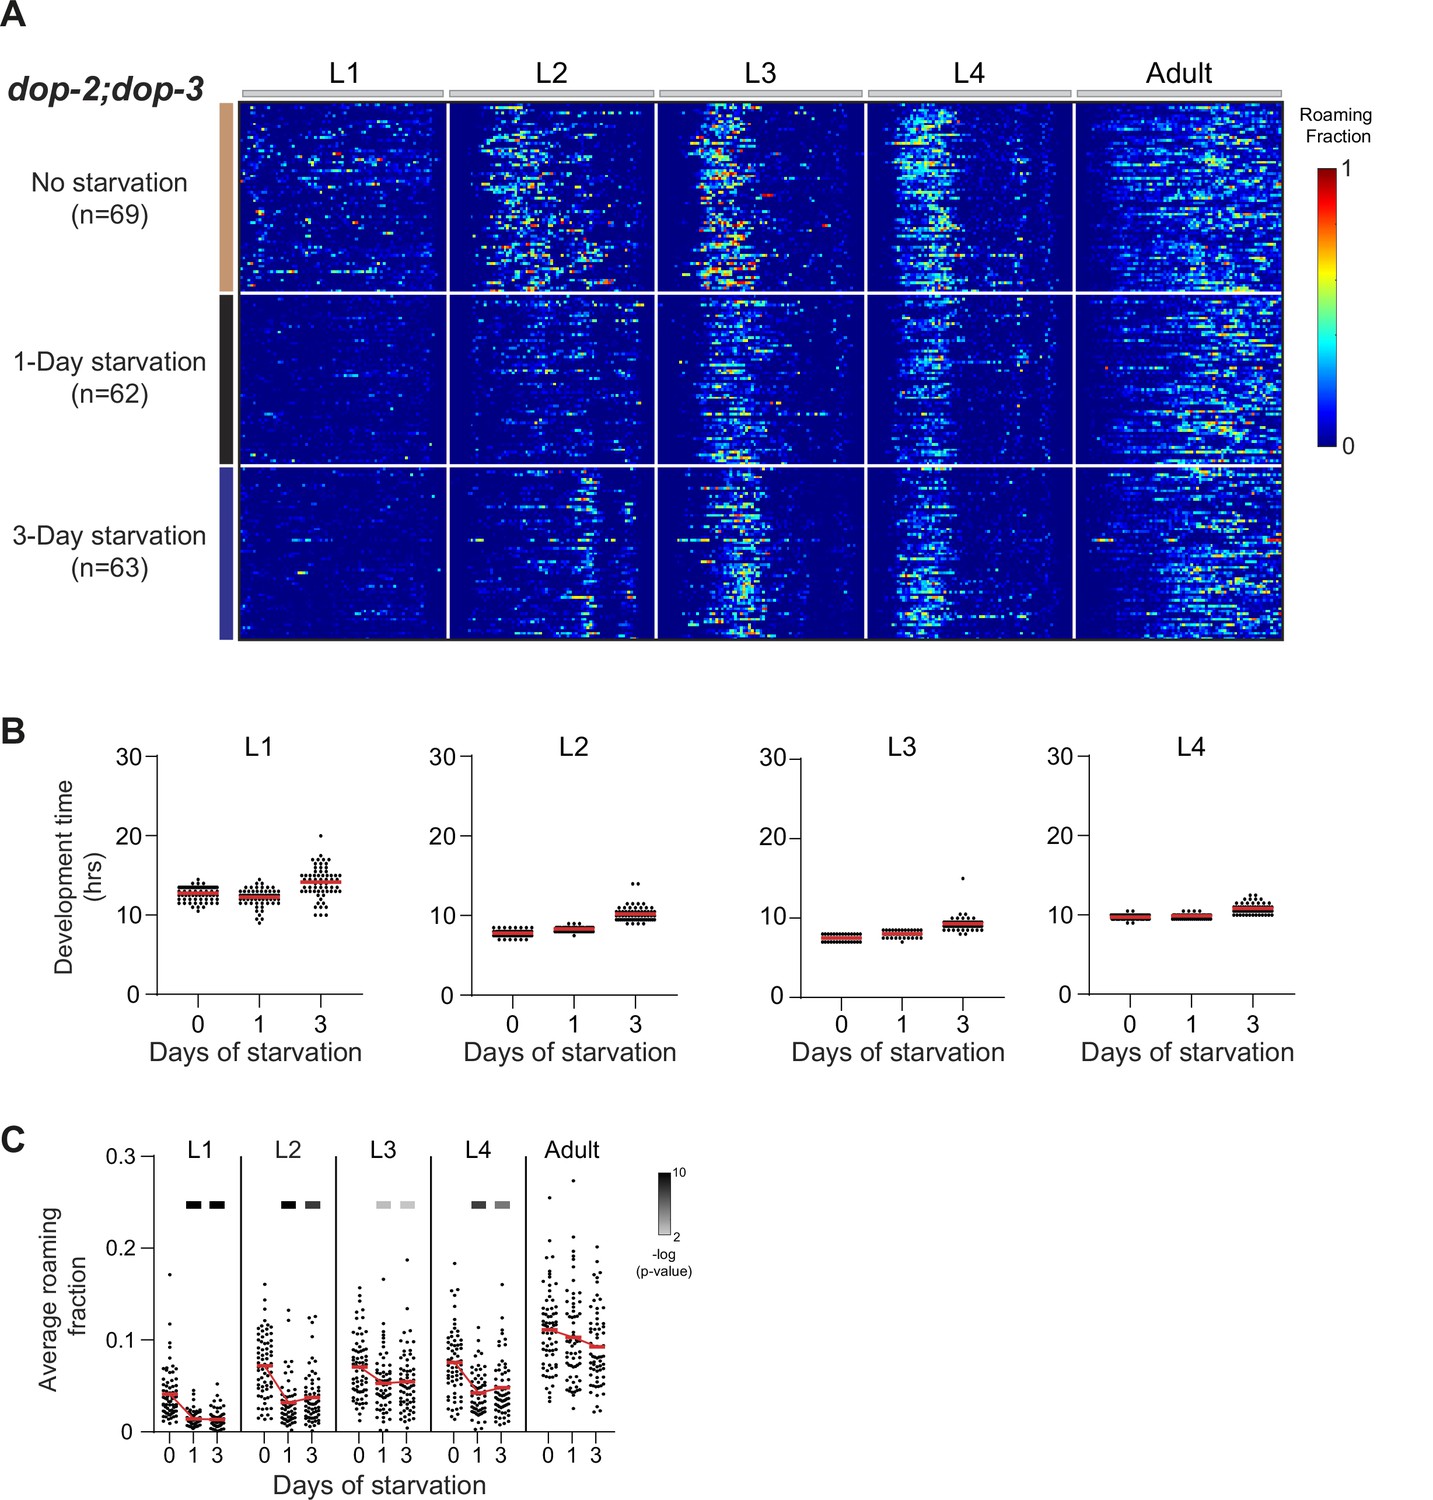
(A) Average roaming fraction of unstarved (n = 124), 1-day starved (n = 98), and 1-day starved with exogenous DA (n = 46) cat-2 populations. (B) Average roaming fraction of unstarved (n = 124), 3-day starved (n = 124), and 3-day starved with exogenous DA (n = 50) cat-2 populations. (C) Average roaming fraction relative to the unstarved population in 1- and 3-day starved cat-2 populations, with or without exogenous DA, in each developmental stage. Upper bars indicate statistical significance (−log(p-value), Wilcoxon rank-sum test (FDR corrected), indicated are p-values <0.01). (D) Average roaming fraction of 3-day starved (n = 145) and unstarved (n = 111) dop-2 populations. (E) Average roaming fraction of 3-day starved (n = 134) and unstarved (n = 73) dop-1 populations. (F) Average roaming fraction of 3-day starved (n = 95) and unstarved (n = 82) dop-3 populations. (G) Average roaming fraction relative to the unstarved population in dop-2 and wild-type individuals, in each developmental stage. (H) Average roaming fraction relative to the unstarved population in dop-1 and wild-type individuals, in each developmental stage. (I) Average roaming fraction relative to the unstarved population in dop-3 and wild-type individuals, in each developmental stage. (J) Average roaming fraction of 1-day starved (n = 62), 3-day starved (n = 63), and unstarved (n = 69) dop-2;dop-3 populations. (K) Average roaming fraction relative to the unstarved population in dop-2;dop-3 and wild-type individuals, in each developmental stage. Upper bars in (G, H, I, K) indicate statistical significance (Wilcoxon rank-sum test, FDR corrected) of the difference in behavioral effect following early stress between the dopamine receptors mutants and N2 populations (−log(p-value), indicated are p-values <0.01). Error bars indicate standard error of the mean.
Figure 4—figure supplement 1
Development time and roaming quantification in unstarved, starved, and starved with exogenous DA cat-2 mutants.
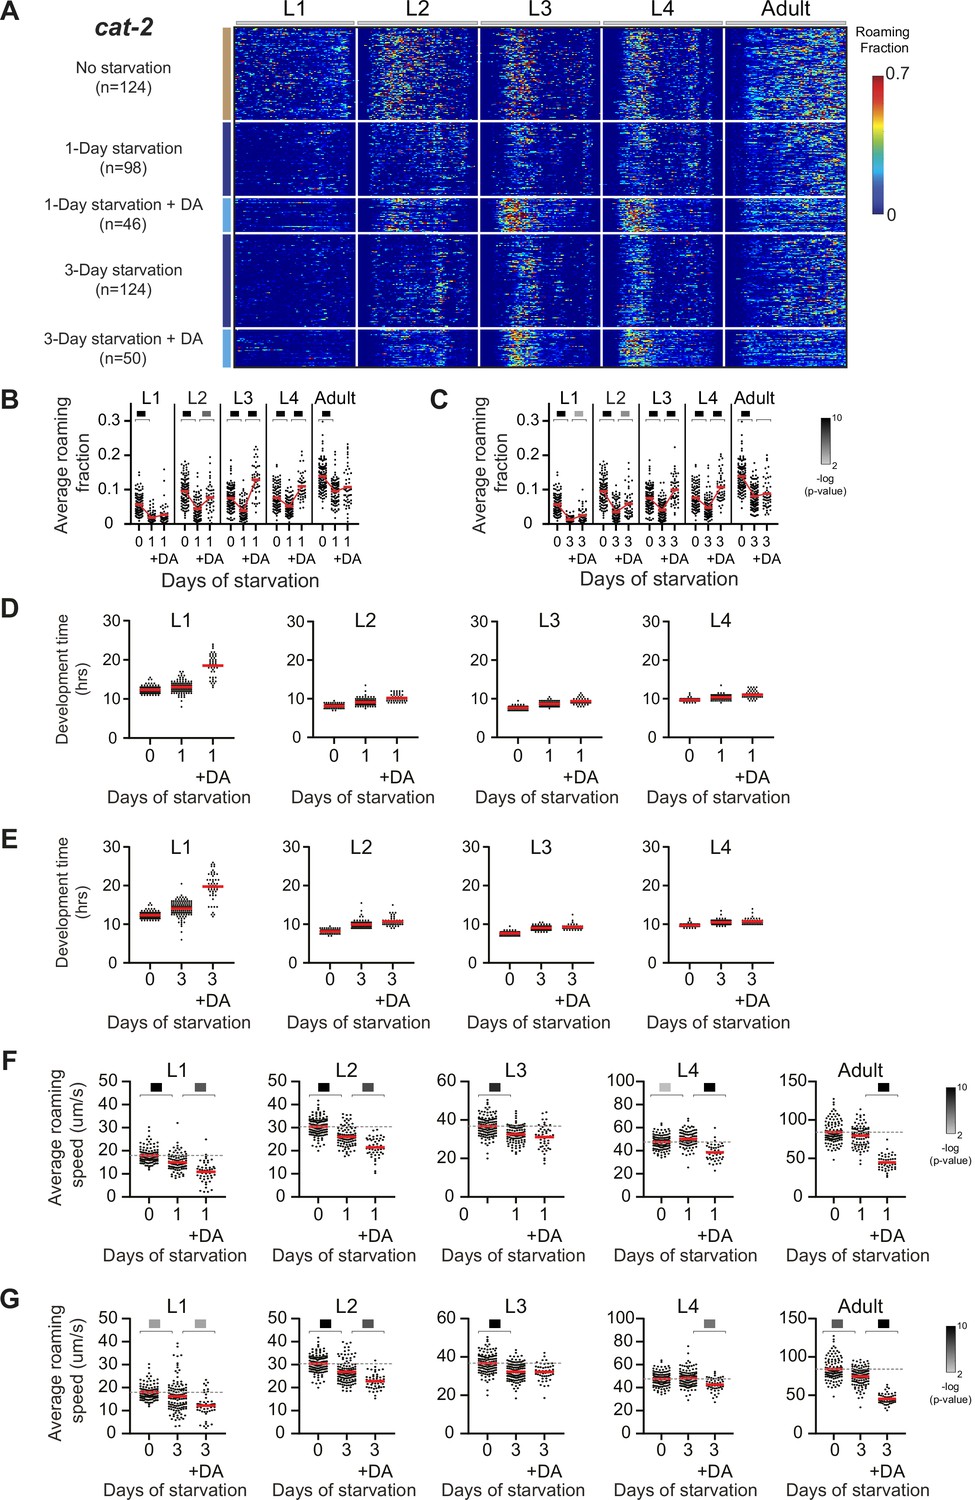
(A) Roaming and dwelling behavior of unstarved (n = 124), 1-day starved (n = 98), 1-day starved with exogenous DA (n = 46), 3-day starved (n = 124), and 3-day starved with exogenous DA (n = 50) cat-2 populations. Each row indicates the age-normalized behavior of one individual across all developmental stages. The different stages are separated by white lines indicating the middle of the lethargus state. Color bar represents the fraction of time spent roaming in each of the 375 time bins. (B) Average roaming fraction of unstarved, 1-day starved, and 1-day starved with exogenous DA cat-2 individuals in each developmental stage. (C) Average roaming fraction of unstarved, 3-day starved, and 3-day starved with exogenous DA cat-2 individuals in each developmental stage. (D) Development time across L1–L4 larval stages within unstarved, 1-day starved, and 1-day starved with exogenous DA cat-2 populations. (E) Development time across L1–L4 larval stages within unstarved, 3-day starved, and 3-day starved with exogenous DA cat-2 populations. (F) Average roaming speed of unstarved, 1-day starved, and 1-day starved with exogenous DA cat-2 individuals in each developmental stage. (G) Average roaming speed of unstarved, 3-day starved, and 3-day starved with exogenous DA cat-2 individuals in each developmental stage. Upper bars in (B, C, F, G) indicate statistical significance (Wilcoxon rank-sum test, FDR corrected) of behavioral differences in each developmental stage (−log(p-value), indicated are p-values <0.01). Each point in (B–G) represents a single individual. Red bars represent the population mean.
Figure 4—figure supplement 2
Development time and roaming quantification in starved and unstarved dopamine receptors mutants.
(A) Roaming and dwelling behavior of single dopamine receptor mutants without early starvation (dop-1 n = 73; dop-2 n = 111; dop-3 n = 82) and following 3 days of early starvation (dop-1 n = 134; dop-2 n = 145; dop-3 n = 95). Each row indicates the age-normalized behavior of one individual across all developmental stages. The different stages are separated by white lines indicating the middle of the lethargus state. Color bar represents the fraction of time spent roaming in each of the 375 time bins. (B) Development time across L1–L4 larval stages within starved and unstarved dopamine receptors mutants. (C) Average roaming fraction of starved and unstarved dopamine receptors mutant individuals in each developmental stage. Each point represents a single individual. Red bars represent population mean. Upper bars indicate statistical significance (Wilcoxon rank-sum test, FDR corrected) of the difference between unstarved and starved populations in each developmental stage (−log(p-value), indicated are p-values <0.01).
Figure 4—figure supplement 3
Development time and roaming quantification in starved and unstarved dopamine receptors double mutants.
(A) Roaming and dwelling behavior of dop-2;dop-3 animals without early starvation (n = 69) and following 1 day (n = 62) and 3 days (n = 63) of early starvation. Each row indicates the age-normalized behavior of one individual across all developmental stages. The different stages are separated by white lines indicating the middle of the lethargus state. Color bar represents the fraction of time spent roaming in each of the 375 time bins. (B) Development time across L1–L4 larval stages within starved and unstarved dop-2;dop-3 populations. (C) Average roaming fraction of starved and unstarved dop-2;dop-3 mutant individuals in each developmental stage. Each point represents a single individual. Red bars represent the population mean. Upper bars indicate statistical significance (Wilcoxon rank-sum test, FDR corrected) of the difference between unstarved and starved populations in each developmental stage (−log(p-value), indicated are p-values <0.01).
Figure 5 with 1 supplement

Serotonin affects the level of behavioral sensitivity to early stress during early and late developmental stages.
(A) Roaming and dwelling behavior of tph-1 animals without early starvation (n = 51) and following 1-day (n = 87), 3-day (n = 96), and 4-day starvation (n = 104). Each row indicates the age-normalized behavior of one individual across all developmental stages. The different stages are separated by white lines indicating the middle of the lethargus state. Color bar represents the fraction of time spent roaming in each of the 375 time bins. (B) Average roaming fraction of 1-day starved tph-1 animals compared to the unstarved population. (C) Average roaming fraction of 3- and 4-day starved tph-1 animals compared to the unstarved population. (D) Average roaming fraction relative to the unstarved population in tph-1 and wild-type individuals, in each developmental stage. Error bar indicates standard error of the mean. Upper bars indicate statistical significance (Wilcoxon rank-sum test, FDR corrected) of the difference in behavioral effect following early stress between the tph-1 and N2 populations (−log(p-value), indicated are p-values <0.01).
Figure 5—figure supplement 1
Development time and roaming quantification in starved and unstarved tph-1 individuals.
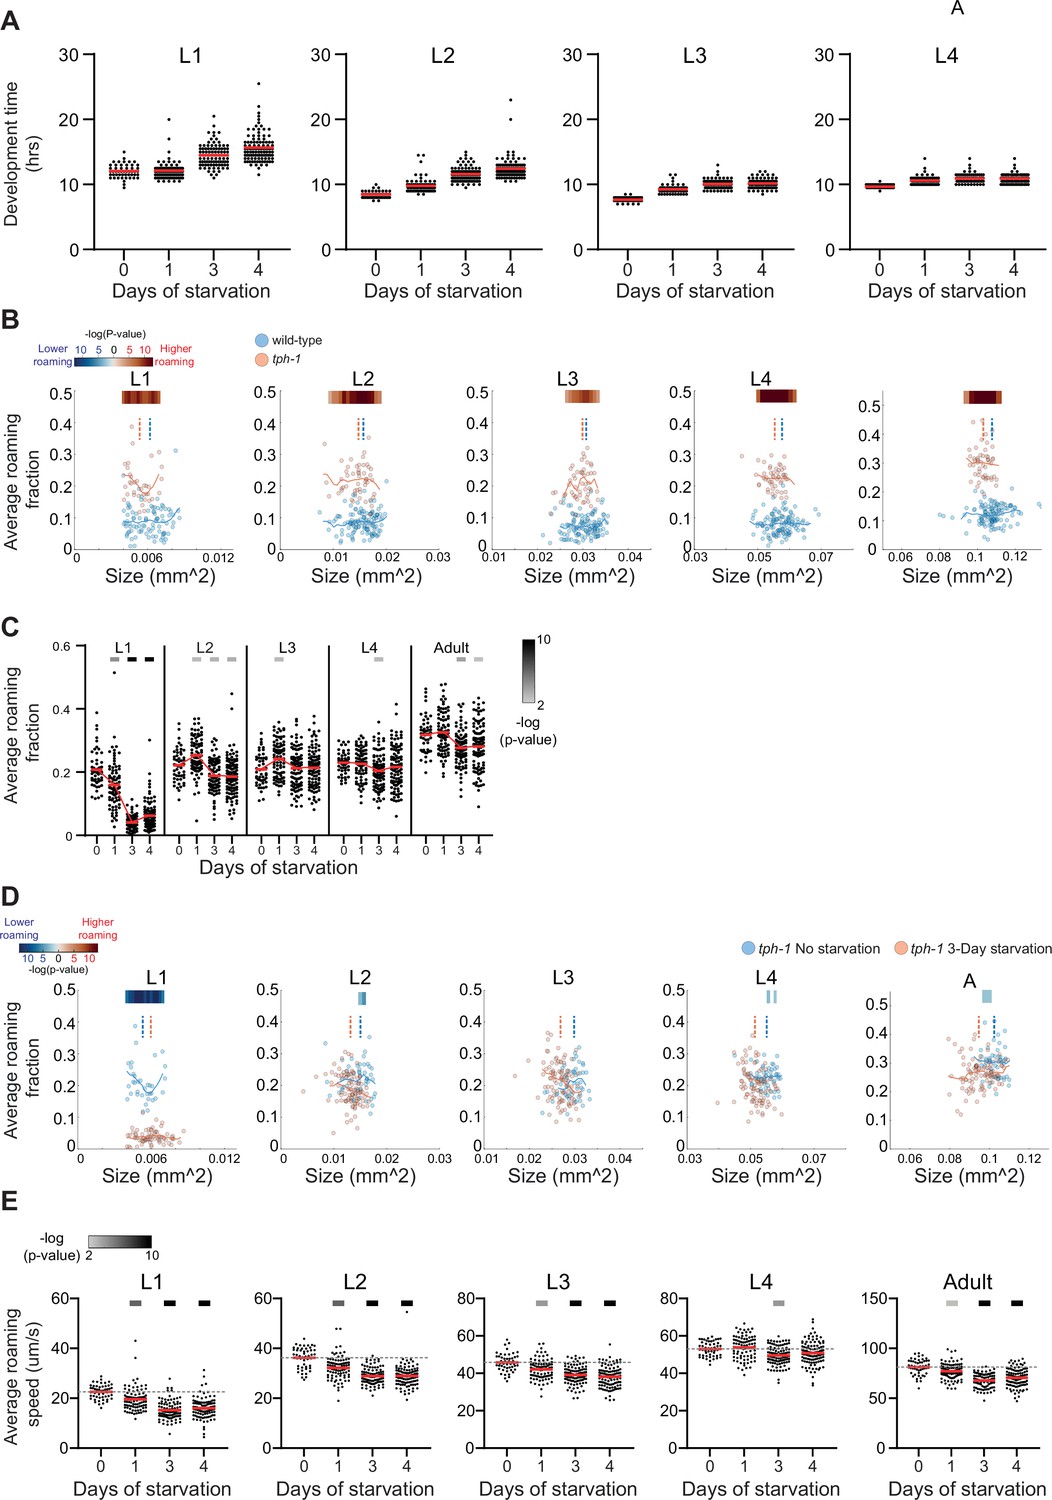
(A) Development time across L1–L4 larval stages within starved and unstarved tph-1 populations (no starvation n = 51; 1-day starvation n = 87; 3-day starvation n = 96; 4-day starvation n = 104). (B) Comparison of roaming behavior in size-matched individuals between unstarved tph-1 and wild-type populations. Lines represent roaming running average of the population. Upper bars indicate statistical significance (Wilcoxon rank-sum test, FDR corrected) of the difference in roaming activity in 20 running size windows (−log(p-value)). Color code marks higher (red) or lower (blue) roaming activity, relative to the wild-type population (min of five animals for each condition in each tested size window). Indicated are p-values <0.01. Dashed lines indicate size median of the population. Each point represents average size of a single individual within a stage. (C) Average roaming fraction of starved and unstarved tph-1 individuals in each developmental stage. Upper bars indicate statistical significance (Wilcoxon rank-sum test, FDR corrected) of the difference between unstarved and starved populations in each developmental stage (−log(p-value), indicated are p-values <0.01). (D) Comparison of roaming behavior in size-matched individuals between starved and unstarved tph-1 populations. Lines represent roaming running average of the population. Upper bars indicate statistical significance (Wilcoxon rank-sum test, FDR corrected) of the difference in roaming activity in 20 running size windows (−log(p-value)). Color code marks higher (red) or lower (blue) roaming activity, relative to the unstressed population (min of five animals for each condition in each tested size window). Indicated are p-values <0.01. Dashed lines indicate size median of the population. Each point represents average size of a single individual within a stage. (E) Average roaming speed of starved and unstarved tph-1 individuals in each developmental stage. Upper bars indicate statistical significance (Wilcoxon rank-sum test, FDR corrected) of the difference between unstarved and starved populations in each developmental stage (−log(p-value), indicated are p-values <0.01). Each point represents a single individual. Red line in (A, C, E) indicates population mean.
Figure 6 with 1 supplement

Experience-dependent and neuromodulatory effects on variation within individuality dimensions.
(A) Left: PC1 components in each of the 50 time windows. Bar plots represent inter-individual variation in PC1 individual scores within the wild-type and neuromodulatory mutant populations. p-values in bar plots were calculated using bootstrapping (see Methods) for difference in PC1 variation between starved and unstarved populations. Each dot within bars represents PC1 variation within a shuffled rank dataset in the same principal component analysis (PCA) space (500 repetitions). Distributions show dispersion of PC1 individual scores (blue) within starved and unstarved wild-type and neuromodulatory mutant populations, compared to a shuffled rank dataset in the same PCA space (orange). p-values above distributions were calculated using bootstrapping (see Methods) for significance of difference in PC1 variation to variation of a shuffled dataset in the same PCA space (bottom asterisks) or in a PCA space extracted from the shuffled dataset (upper asterisks). (B) Same as (A) for PC3. (C) Same as (A) for PC6. (D–F) Heat maps represent inter-individual variation in PC scores within the PC1–6 individuality dimensions in starved and unstarved populations of wild-type (D), tph-1 (E), and cat-2 (F) individuals. Significant differences (p < 0.05, FDR corrected) in (D–F) are marked for comparisons between starved and unstarved populations of the same genotype (yellow) and for comparisons between neuromodulatory mutants and wild-type populations exposed to the same starvation condition (green). *p < 0.05, **p < 0.01, ***p < 0.001 (FDR corrected).
Figure 6—figure supplement 1
Principal component analysis (PCA) and behavioral consistency analyses in wild-type and neuromodulatory mutants.
(A) Variance explained by each of the first 20 PCs following PCA (blue bars) of the pooled wild-type, tph-1, and cat-2 individuals rank dataset, compared to the variance explained by the first 20 PCs of a shuffled dataset (500 repetitions, orange lines). (B) Variance explained by each of the first 25 PCs following PCA (blue bars) of the pooled wild-type, tph-1, and cat-2 individuals rank dataset, compared to the variance of a shuffled dataset within the same PCA space (500 repetitions, orange lines). (C) PC1–6 vectors across developmental time bins extracted by PCA of a shuffled behavioral rank dataset. (D) Bar plots represent inter-individual variation in PC1 individual scores within unstarved tph-1 and wild-type populations. P-value was calculated using bootstrapping (see Methods) for difference in PC1 variation. Each dot within bars represents PC1 variation within a shuffled rank dataset in the same PCA space (500 repetitions). (E) Correlation between behavioral consistency indices and PC1–6 individual scores within stressed and unstressed wild-type, tph-1, and cat-2 populations. Each dot is a single individual, colored by starvation condition. Dotted line is linear least-squares regression with intercept. Pearson correlation coefficient R between behavioral consistency and each PC is noted above the corresponding subplot. (F) Left: PC2 components in each time window. Bar plots represent inter-individual variation in PC2 individual scores within the wild-type and mutant populations. p-values in bar plots were calculated using bootstrapping (see Methods) for difference in PC2 variation between starved and unstarved populations. Each dot within bars represents PC2 variation within a shuffled rank dataset in the same PCA space (500 repetitions). Distributions show dispersion of PC2 individual scores (blue) within starved and unstarved wild-type and mutant populations, compared to a shuffled rank dataset in the same PCA space (orange). p-values above distributions were calculated using bootstrapping (see Methods) for significance of difference in PC2 variation to variation of a shuffled dataset in the same PCA space (bottom asterisks) or in a PCA space extracted from the shuffled dataset (upper asterisks). (G) Same as (F) for PC4. (H) Same as (F) for PC5. *p < 0.05, **p < 0.01, ***p < 0.001 (FDR corrected).
Additional files
Download links
A two-part list of links to download the article, or parts of the article, in various formats.
Downloads (link to download the article as PDF)
Open citations (links to open the citations from this article in various online reference manager services)
Cite this article (links to download the citations from this article in formats compatible with various reference manager tools)
Early-life experience reorganizes neuromodulatory regulation of stage-specific behavioral responses and individuality dimensions during development
eLife 12:e84312.
https://doi.org/10.7554/eLife.84312


