Vernalization-triggered expression of the antisense transcript COOLAIR is mediated by CBF genes
- School of Biological Sciences, Seoul National University, Republic of Korea
- Research Center for Plant Plasticity, Seoul National University, Republic of Korea
- Shanghai Center for Plant Stress Biology & National Key Laboratory for Plant Molecular Genetics, CAS Center for Excellence in Molecular Plant Sciences, Chinese Academy of Sciences, China
- Peking University Institute of Advanced Agricultural Sciences, China
Figures
Figure 1 with 2 supplements
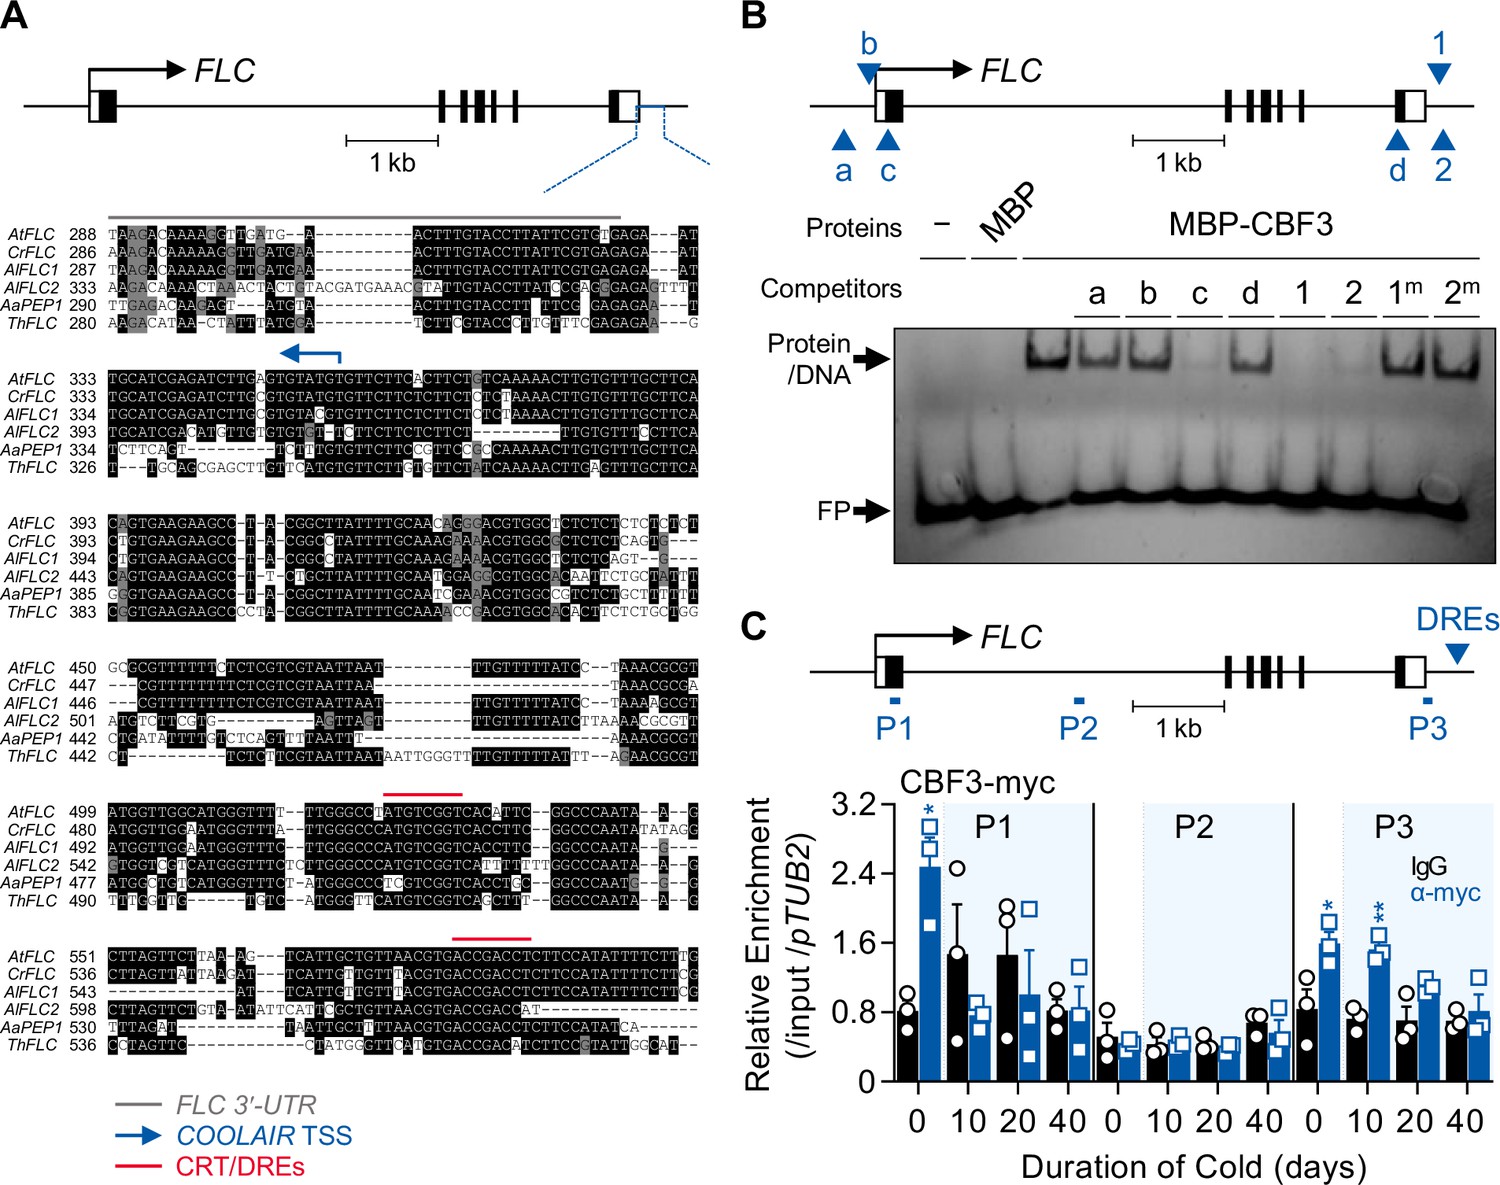
CBF3 directly binds to the CRT/DREs at the 3′-end of FLC.
(A) Comparison of sequences around the 3′-end of the FLC orthologs from Arabidopsis relatives. The upper graphic presents the gene structure of AtFLC. The black bars, black lines, and white bars indicate exons, introns, and untranslated regions (UTRs), respectively. The blue line presents the region used for sequence comparison among six orthologous genes from five plant species. In the sequence alignment below, the gray line indicates the 3′-UTR of FLC orthologs, the blue arrow indicates the transcriptional start site (TSS) of AtCOOLAIR, and the red lines indicate CRT/DREs. At, Arabidopsis thaliana; Cr, Capsella rubella; Al, Arabidopsis lyrata; Aa, Arabis alpina; Th, Thellungiella halophila. (B) EMSA using one of the CRT/DREs located at the AtCOOLAIR promoter, DRE1, as a probe. In the upper graphic showing AtFLC gene structure, CRT/DRE-like sequences are marked as blue arrows and labeled as a, b, c, and d for CRT/DRE-like sequences and as 1 and 2 for CRT/DRE sequences. For the competition assay, these CRT/DRE-like sequences and mutant forms of DRE1 and DRE2 were used as competitors. A 100-fold molar excess of unlabeled competitors was added. No protein (−) or maltose-binding protein (MBP) were used as controls. FP, free probe. (C) ChIP assay result showing the enrichment of CBF3-myc protein on the AtFLC locus. Samples of NV, 10V, 20V, and 40V plants of pSuper:CBF3-myc were collected at zeitgeber time (ZT) 4 in an SD cycle. The CBF3-chromatin complex was immunoprecipitated (IP) with anti-myc antibodies (blue bars), and mouse IgG (black bars) was used as a control. Positions of qPCR amplicons used for ChIP-qPCR analysis are illustrated as P1, P2, and P3 in the upper graphic. The blue arrow in the graphic denotes the position of CRT/DREs on the AtCOOLAIR gene. ChIP-qPCR results have been represented as mean ± SEM of the three biological replicates in the lower panel. Open circles and squares represent each data point. Relative enrichments of the IP/5% input were normalized to that of pTUB2. The blue shadings indicate cold periods. Asterisks indicate a significant difference between IgG and anti-myc ChIP-qPCR results at each vernalization time point (*, p < 0.05; **, p < 0.01; unpaired Student’s t-test).
-
Figure 1—source data 1
Uncropped labeled gel image and the original image file for the EMSA result.
- https://cdn.elifesciences.org/articles/84594/elife-84594-fig1-data1-v3.zip
Figure 1—figure supplement 1
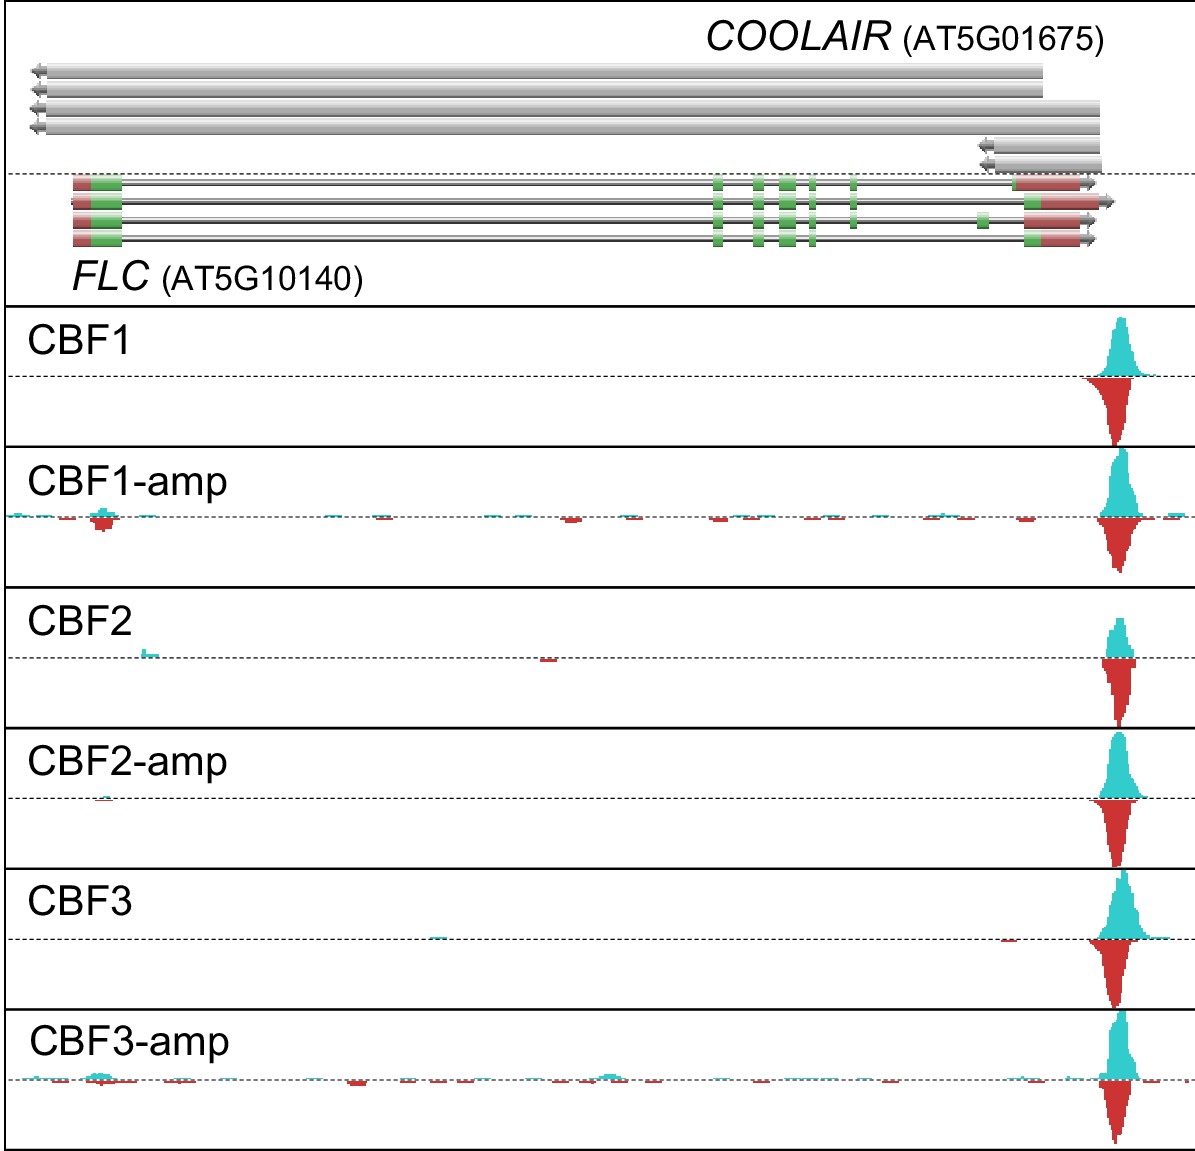
CBF proteins directly bind to the sequence at the 3′-end of FLC in DAP-seq.
Figure 1—figure supplement 2
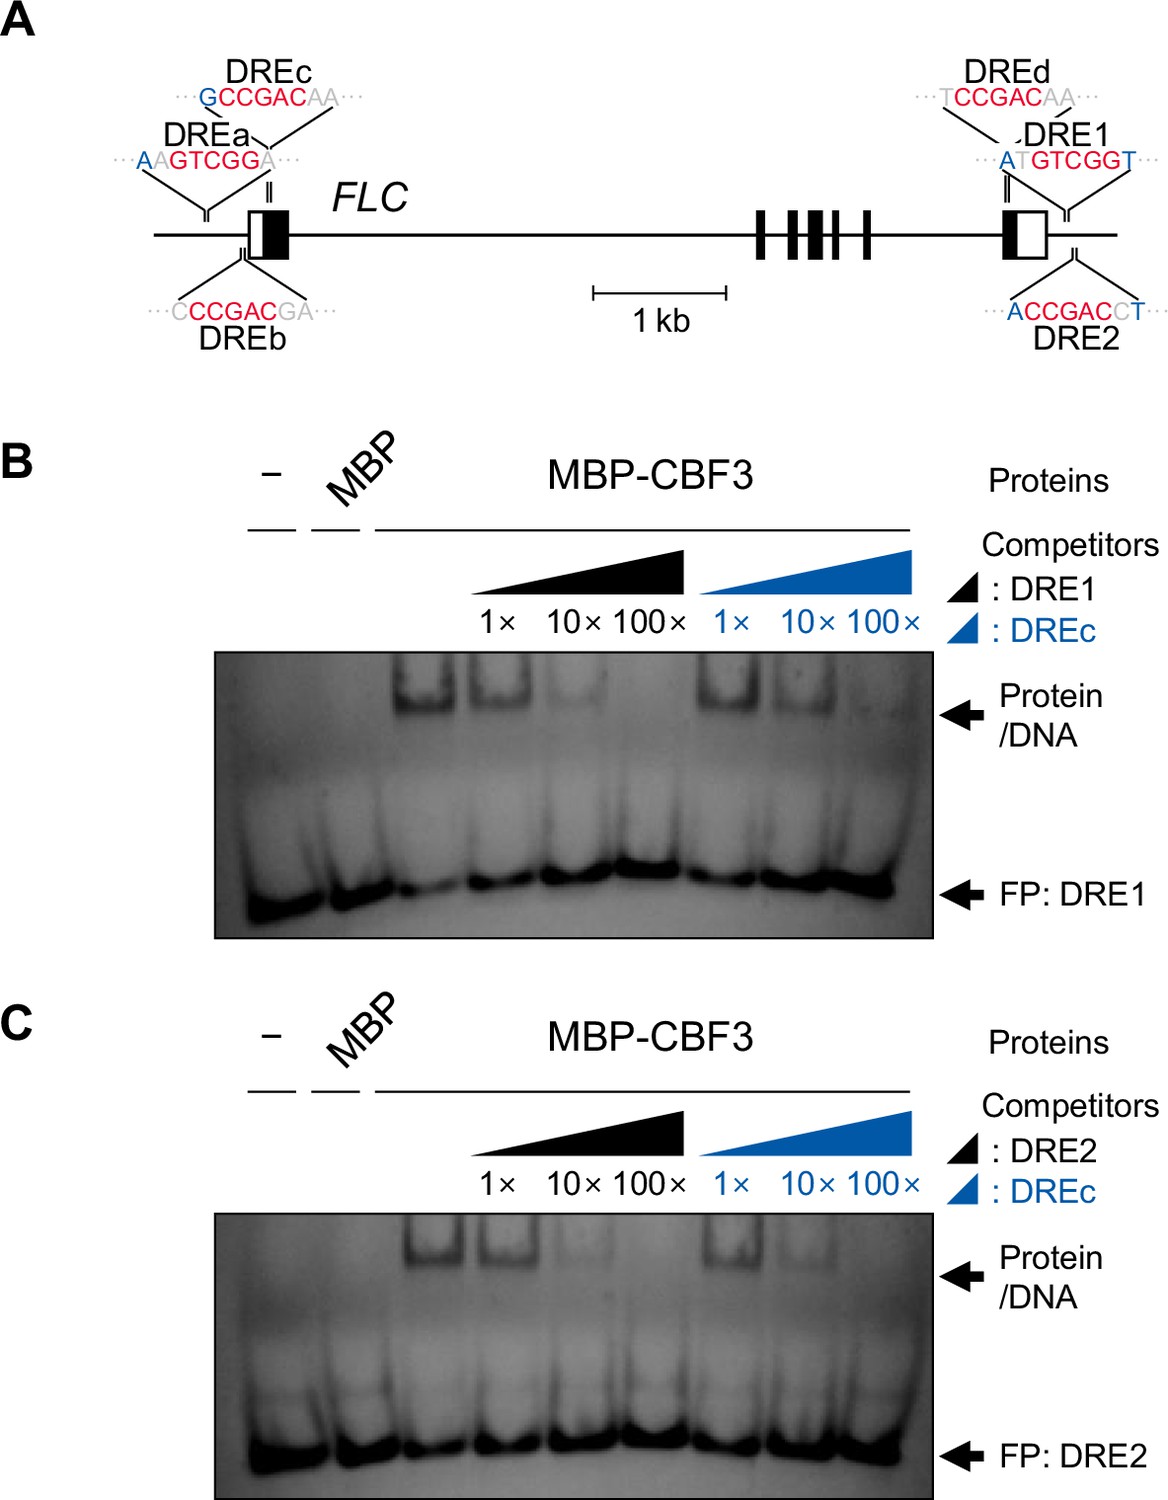
CBF3 binds to DRE1 and DRE2 on the COOLAIR promoter and DREc on the first exon of FLC.
-
Figure 1—figure supplement 2—source data 1
Uncropped labeled gel images and the original image files for the EMSA results.
- https://cdn.elifesciences.org/articles/84594/elife-84594-fig1-figsupp2-data1-v3.zip
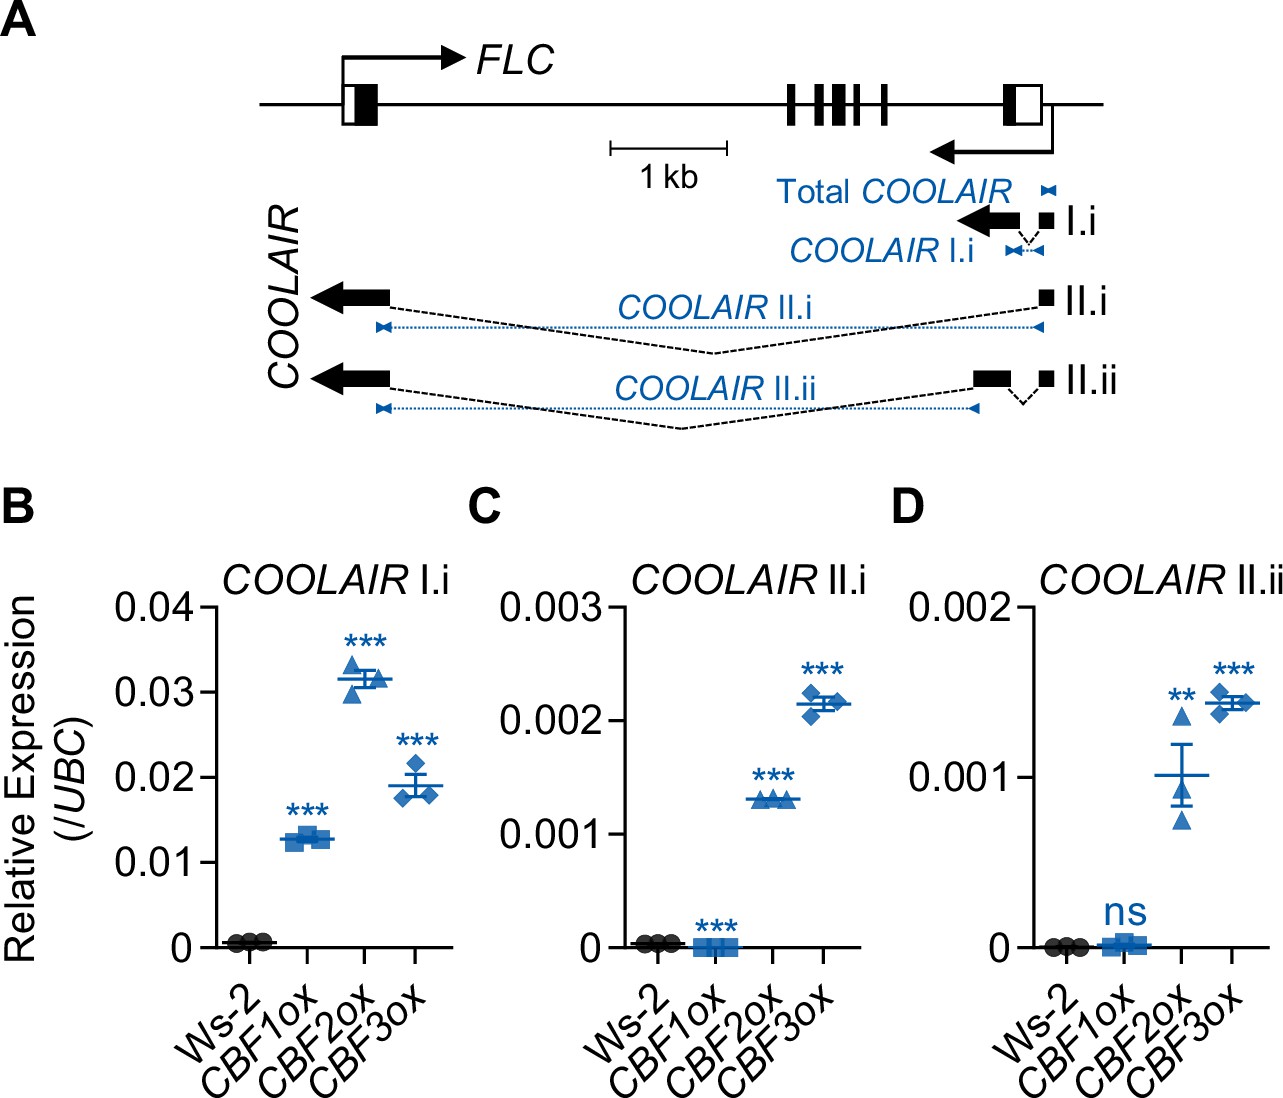
Figure 2 with 1 supplement
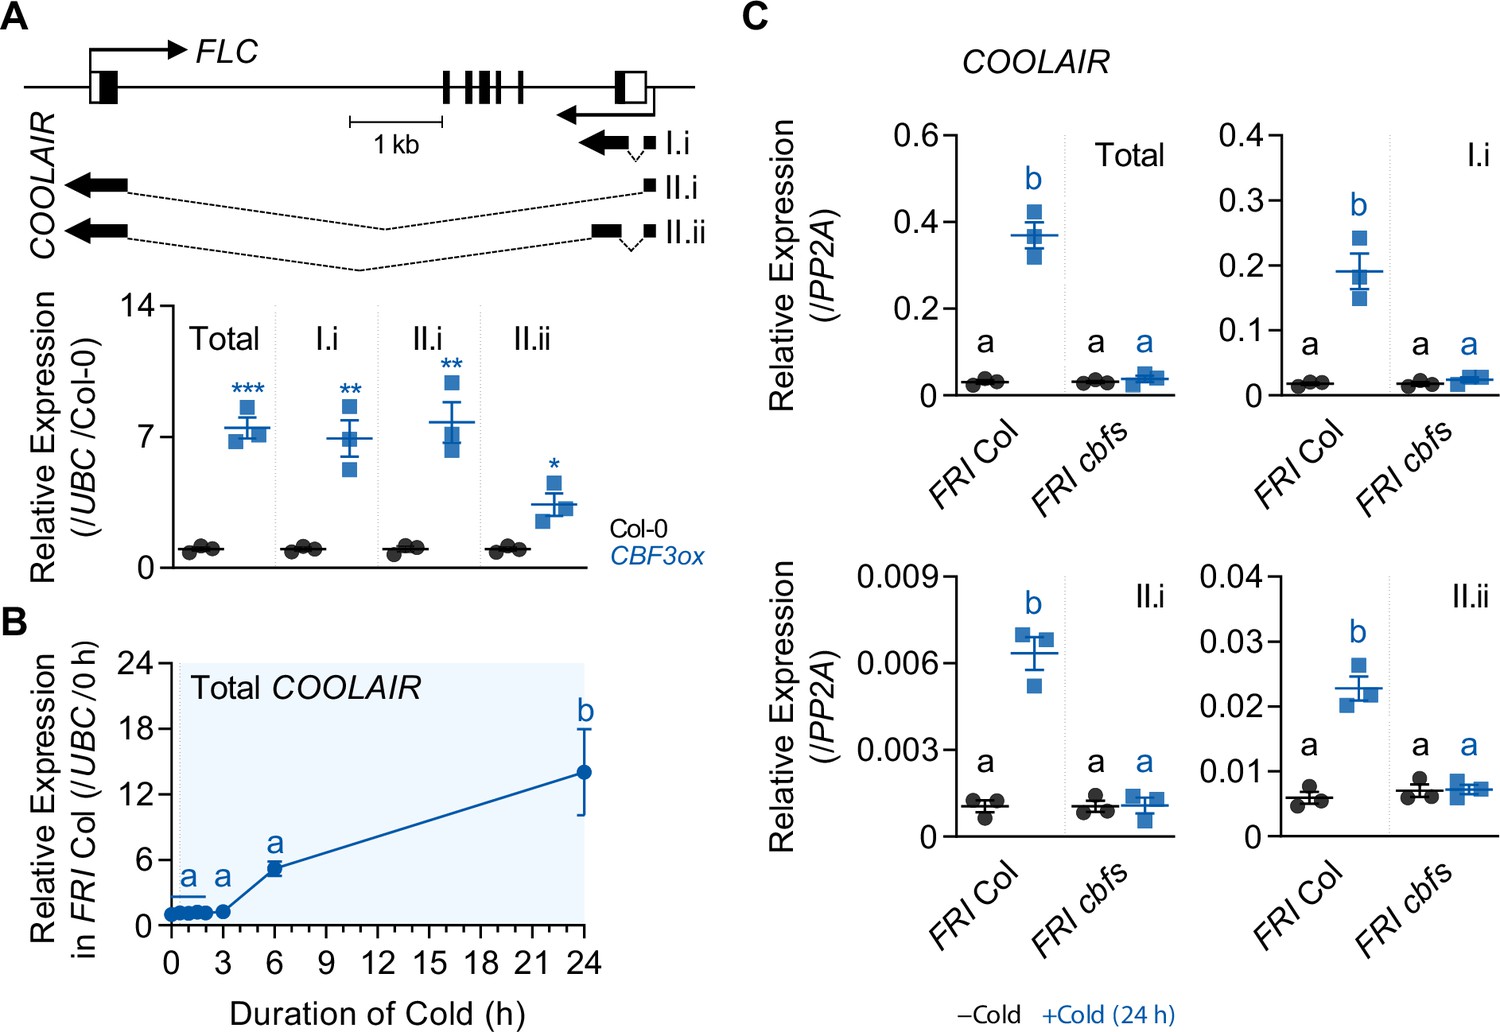
COOLAIR shows a similar expression pattern with CBF regulons.
(A) Expression levels of total COOLAIR and COOLAIR isoforms in the wild-type (Col-0) and CBF3-overexpressing plants (pSuper:CBF3-myc [CBF3ox]). The gene structures of FLC and COOLAIR variants are illustrated in the upper panel. The thin black arrows indicate the transcription start sites of FLC and COOLAIR. The thick black arrows indicate the exons of each COOLAIR isoform. The structures of proximal (I.i) and distal (II.i and II.ii) COOLAIR isoforms are shown. The primer sets used for total, proximal (I.i), and distal (II.i, II.ii) COOLAIRs are marked in Figure 2—figure supplement 1. Relative transcript levels of total COOLAIR and COOLAIR variants were normalized to that of UBC and have been represented as mean ± SEM of three biological replicates. Dots and squares represent each data point. Asterisks indicate a significant difference as compared to the wild type (*, p < 0.05; **, p < 0.01; ***, p < 0.001; unpaired Student’s t-test). (B) Expression dynamics of total COOLAIR after short-term (0, 0.5, 1, 1.5, 2, 3, 6, and 24 hr) cold treatment. Wild types (FRI Col) were subjected to 4 °C cold and harvested at each time point. Relative transcript levels of total COOLAIR to UBC were normalized to that of non-cold treated wild type. The values have been represented as mean ± SEM of three biological replicates. The blue shading indicates periods under cold treatment. Significant differences have been marked using different letters (a, b; p < 0.05; one-way ANOVA followed by Tukey’s post-hoc test). (C) Transcript levels of total COOLAIR and COOLAIR isoforms in wild type and cbfs-1 mutant before (−Cold) and after (+Cold) a day of 4 °C cold treatment. Relative levels of total COOLAIR and COOLAIR variants were normalized to that of PP2A. Values have been represented as mean ± SEM of three biological replicates. Dots and squares indicate each data point. Significant differences have been marked using different letters (a, b; p < 0.05; two-way ANOVA followed by Tukey’s post-hoc test).
Figure 2—figure supplement 1
Overexpression of CBF1, 2, or 3 causes an increase in COOLAIR level, but the effects on COOLAIR variants are subtly different.
Figure 3 with 1 supplement
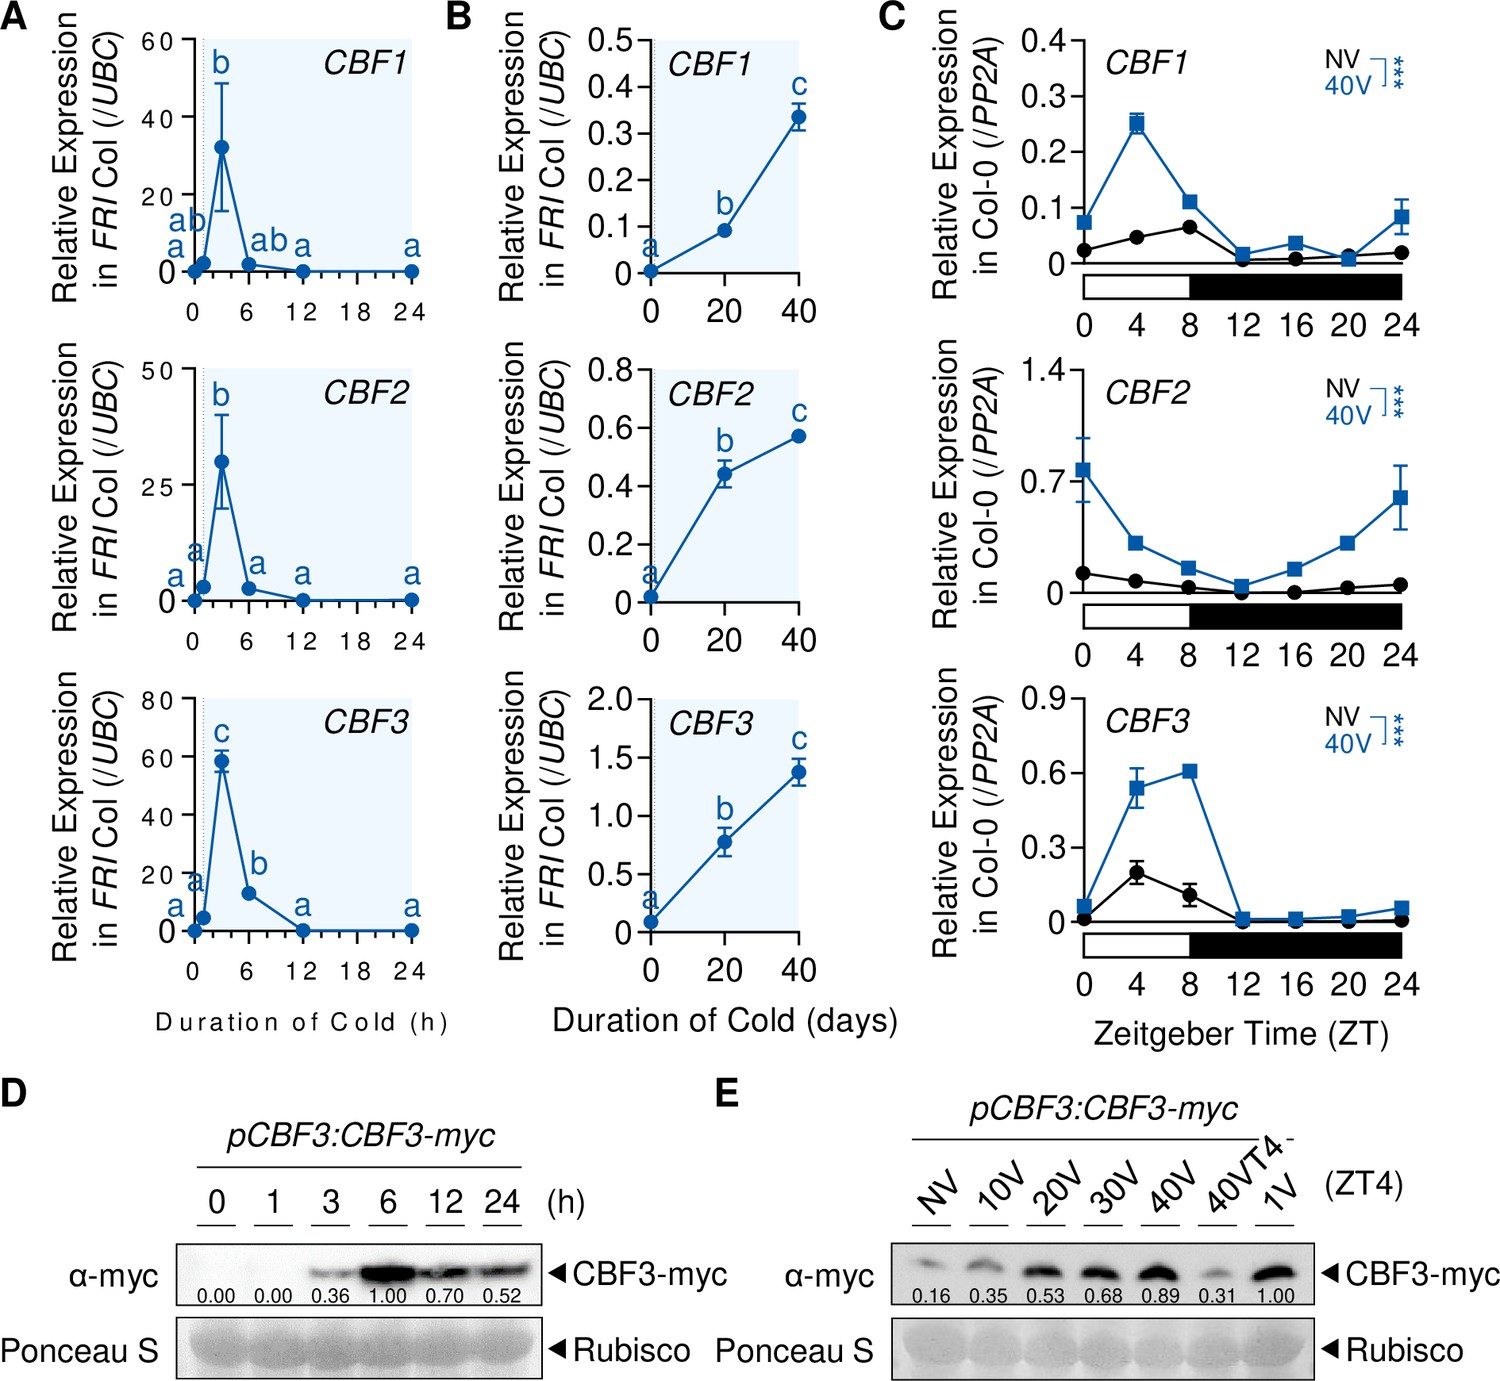
Protein levels of CBFs increase during the vernalization process.
(A) Transcript levels of CBF1, 2, and 3 under short-term cold exposure. Wild-type plants were subjected to 0, 1, 3, 6, 12, and 24 hr of 4 °C cold treatment. Relative levels of CBF1, 2, and 3 were normalized to that of UBC. Values have been represented as mean ± SEM of three biological replicates. The blue shadings indicate cold periods. Significant differences have been marked using different letters (a–c; p < 0.05; one-way ANOVA followed by Tukey’s post-hoc test). (B) Transcript levels of CBF1, 2, and 3 after 20V and 40V. Wild-type plants were treated with 4 °C vernalization under an SD cycle and collected at ZT4. Relative levels of CBF1, 2, and 3 were normalized to that of UBC. Values have been represented as mean ± SEM of three biological replicates. The blue shadings denote periods under cold. Significant differences have been marked using different letters (a–c; p < 0.05; one-way ANOVA followed by Tukey’s post-hoc test). (C) Daily rhythms of CBF1, 2, and 3 transcript levels in NV or 40V plants. Col-0 plants grown under an SD cycle were collected every 4 hr between ZT0 and ZT24. Relative transcript levels of CBF1, 2, and 3 were normalized to that of PP2A. Values have been represented as mean ± SEM of three biological replicates. The white and black bars represent light and dark periods, respectively. Asterisks indicate a significant difference between NV and 40V (***, p < 0.001; two-way ANOVA). (D) Dynamics of CBF3 protein level under short-term cold exposure. The pCBF3:CBF3-myc transgenic plants were subjected to 0, 1, 3, 6, 12, and 24 hr of 4 °C cold treatment. CBF3 proteins were detected using anti-myc antibodies. Rubisco was considered the loading control. Numbers below each band indicate relative signal intensity compared to 6 hr. The mean values of two biological replicates are presented. (E) Increase of CBF3 protein level during the vernalization process. The pCBF3:CBF3-myc transgenic plants, subjected to 4 °C vernalization, were collected at ZT4 of the indicated time point. CBF3 proteins were detected using anti-myc antibodies. Rubisco was considered the loading control. Numbers below each band indicate relative signal intensity compared to 1V. The mean values of three biological replicates are presented.
-
Figure 3—source data 1
Uncropped labeled blot images and the original image files for the immunoblots.
- https://cdn.elifesciences.org/articles/84594/elife-84594-fig3-data1-v3.zip
Figure 3—figure supplement 1
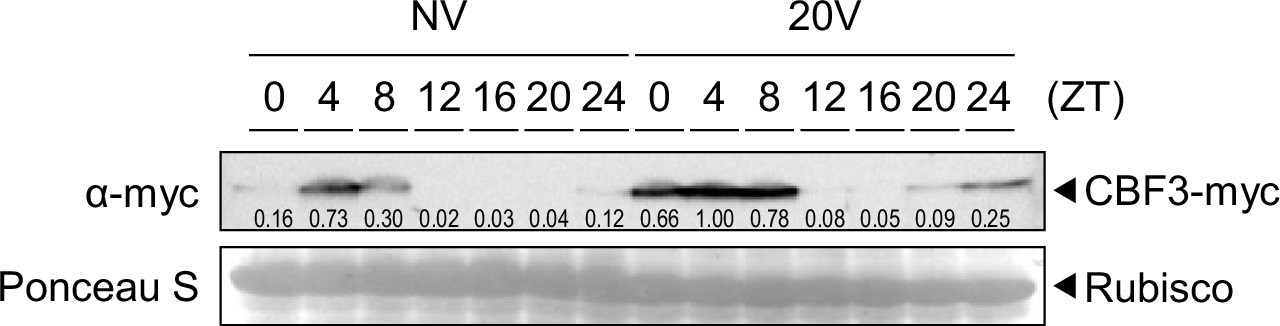
Vernalization increases CBF3 protein levels with a minor effect on the daily rhythm.
-
Figure 3—figure supplement 1—source data 1
Uncropped labeled blot images and the original image files for the immunoblots.
- https://cdn.elifesciences.org/articles/84594/elife-84594-fig3-figsupp1-data1-v3.zip
Figure 4 with 3 supplements
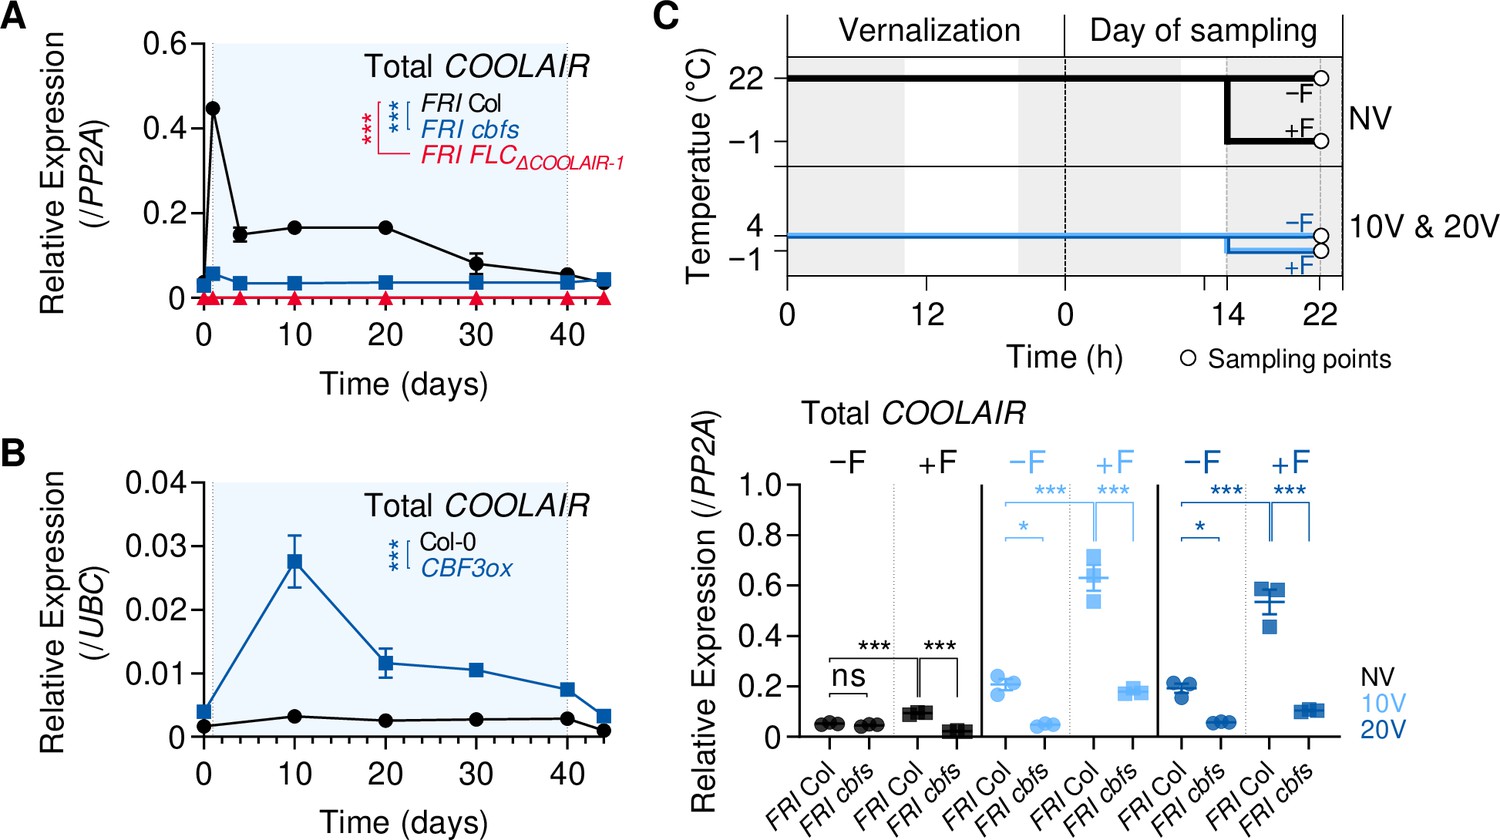
CBFs are involved in vernalization-induced COOLAIR expression.
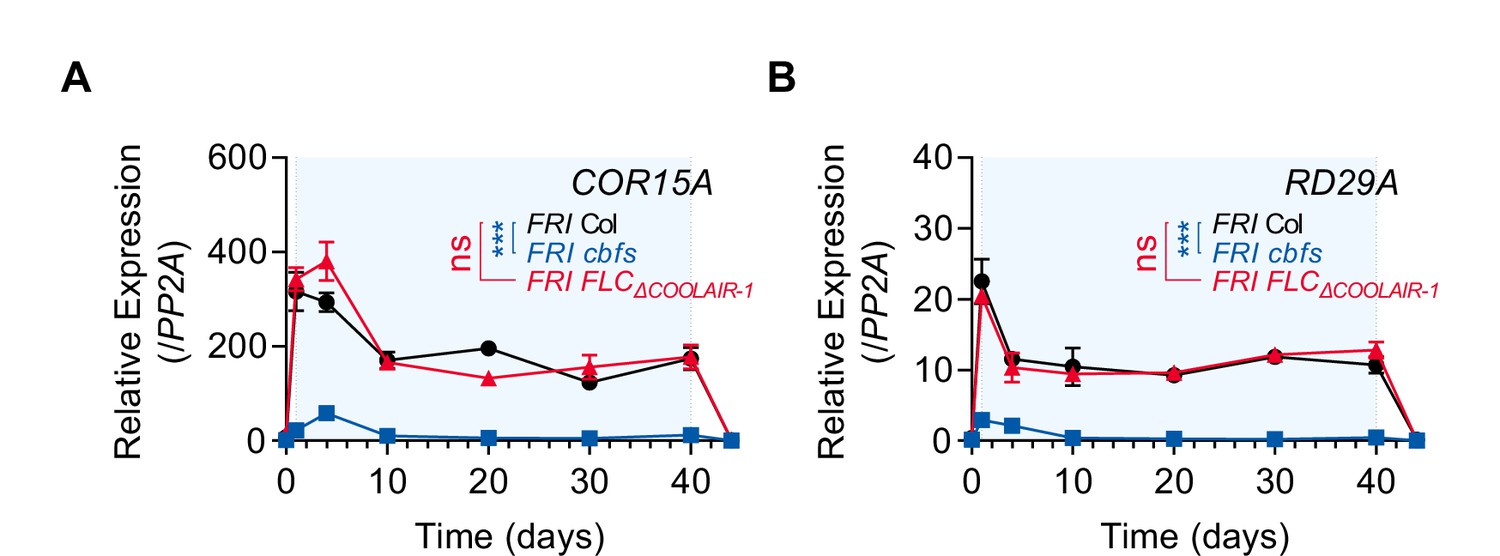
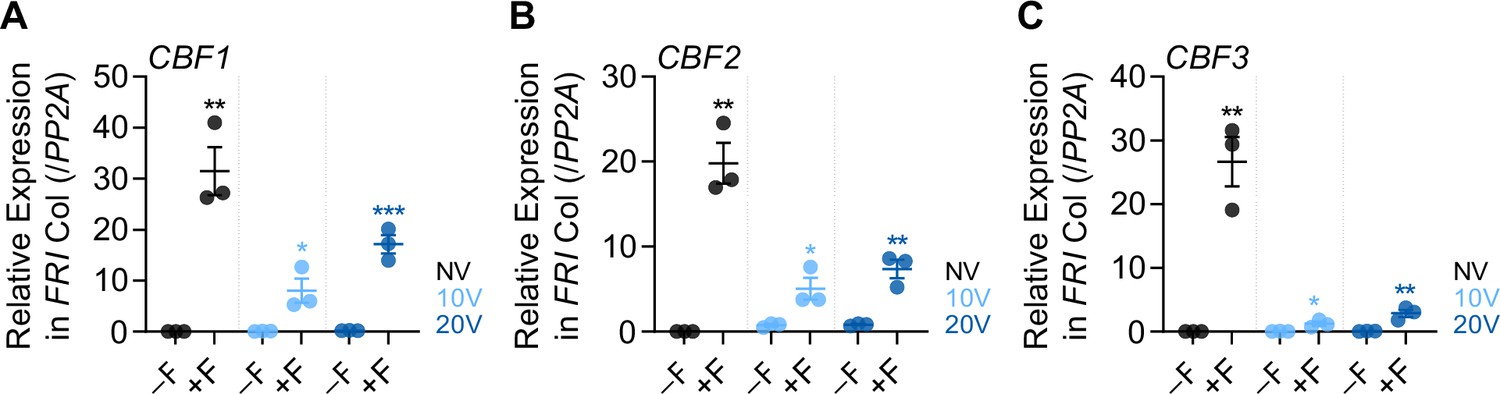
(A) Expression dynamics of total COOLAIR in the wild-type, cbfs-1, and FLCΔCOOLAIR-1 plants during vernalization. Relative transcript levels of total COOLAIR were normalized to that of PP2A. Values have been represented as mean ± SEM of three biological replicates. Asterisks indicate a significant difference compared to the wild-type (***, p < 0.001; two-way ANOVA followed by Tukey’s post-hoc test). (B) Transcript level of total COOLAIR in wild type (Col-0) and CBF3-overexpressing transgenic plant (pSuper:CBF3-myc [CBF3ox]) during vernalization. Relative levels of total COOLAIR were normalized to that of PP2A. Values have been represented as mean ± SEM of three biological replicates. Asterisks indicate a significant difference between the wild-type and CBF3 overexpressor (***, p < 0.001; two-way ANOVA). Blue shading denotes cold periods in (A) and (B). (C) Effect of first frost-mimicking treatment (8 hr of freezing [< 0 °C]) on the level of total COOLAIR in NV, 10V, and 20V wild type and cbfs-1. The upper panel shows a schematic of the experimental procedure. The non-frost treated (−F) wild type and cbfs-1 were collected at ZT22 after an 8 hr of dark treatment at 22 °C (NV) or 4 °C (10V and 20V). For the first frost treatment, wild type and cbfs-1 mutant were treated with an additional 8 hr of −1 °C (+F) under dark, and then the whole seedlings were collected at ZT22 for analysis. All the plants were grown under an SD cycle. The gray shadings denote dark periods. Total COOLAIR levels have been represented as mean ± SEM of three biological replicates in the lower panel. Dots and squares indicate each data point. Relative levels of total COOLAIR were normalized to that of PP2A. Asterisks indicate a significant difference (*, p < 0.05; ***, p < 0.001; two-way ANOVA followed by Tukey’s post-hoc test). ns, not significant (p ≥ 0.05).
Figure 4—figure supplement 1
CBF regulons show strongly reduced expression in cbfs mutants similar to COOLAIR.
Figure 4—figure supplement 2
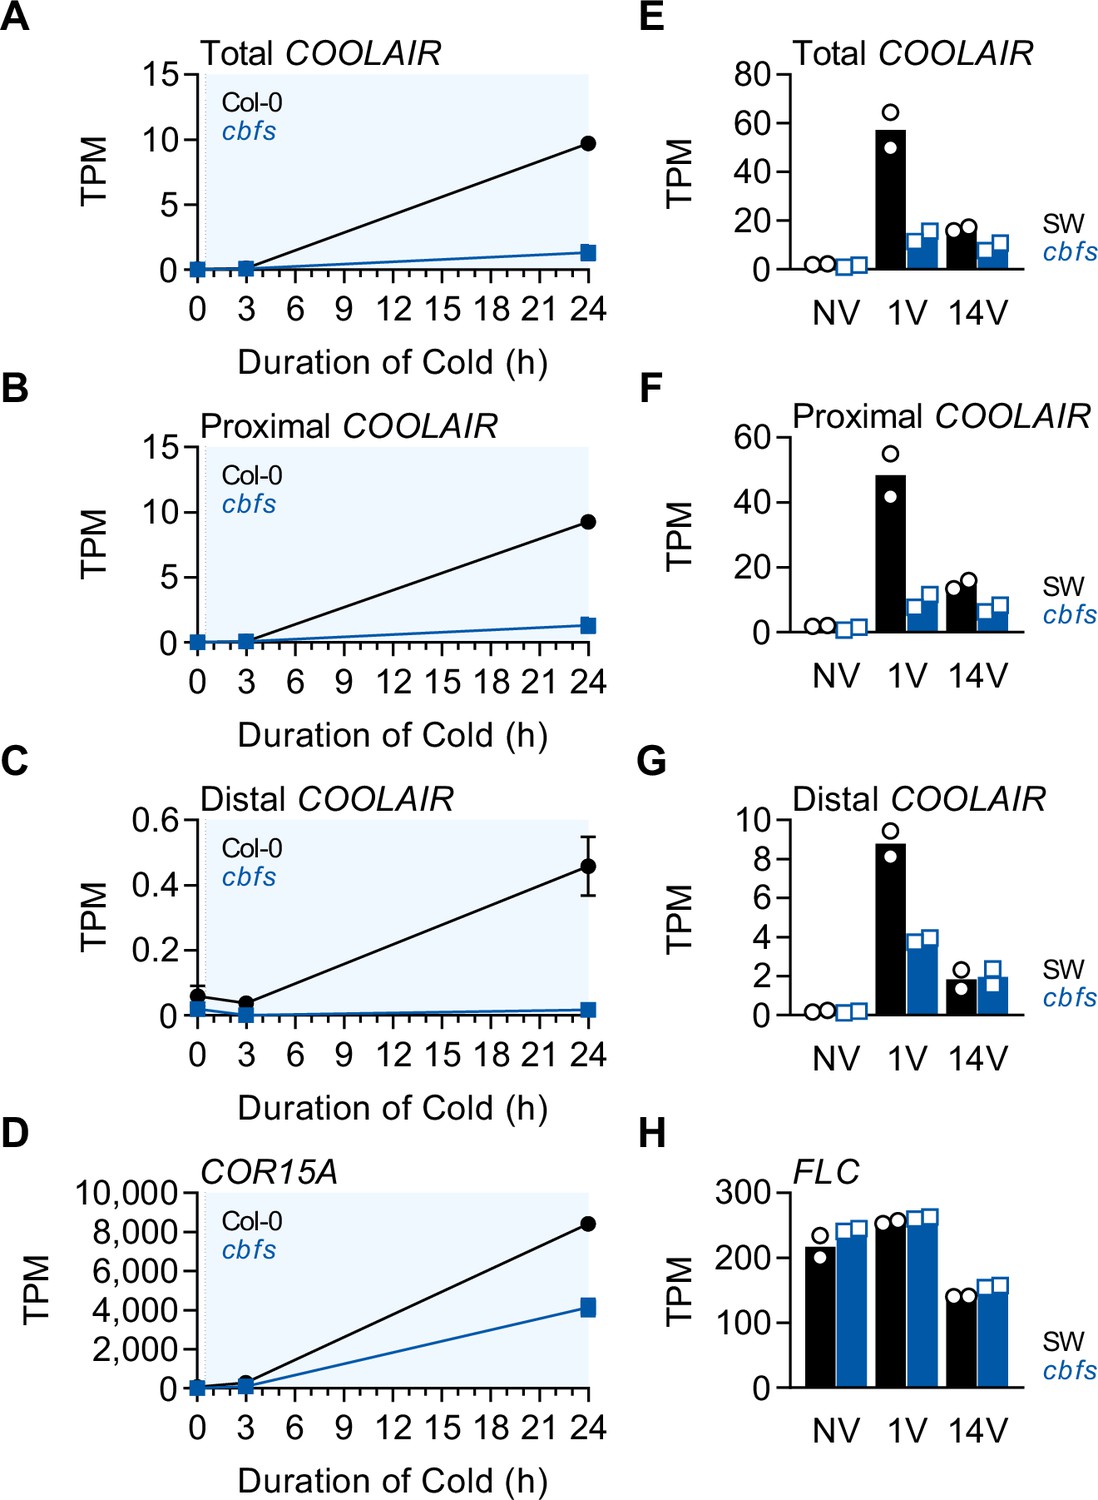
Cold-triggered COOLAIR expression is impaired in cbfs mutants in Col-0 and Sweden-ecotype background.
Figure 4—figure supplement 3
Freezing temperature increases the levels of CBFs.
Figure 5 with 3 supplements
COOLAIR promoter region containing CRT/DREs is necessary for the COOLAIR induction by vernalization.
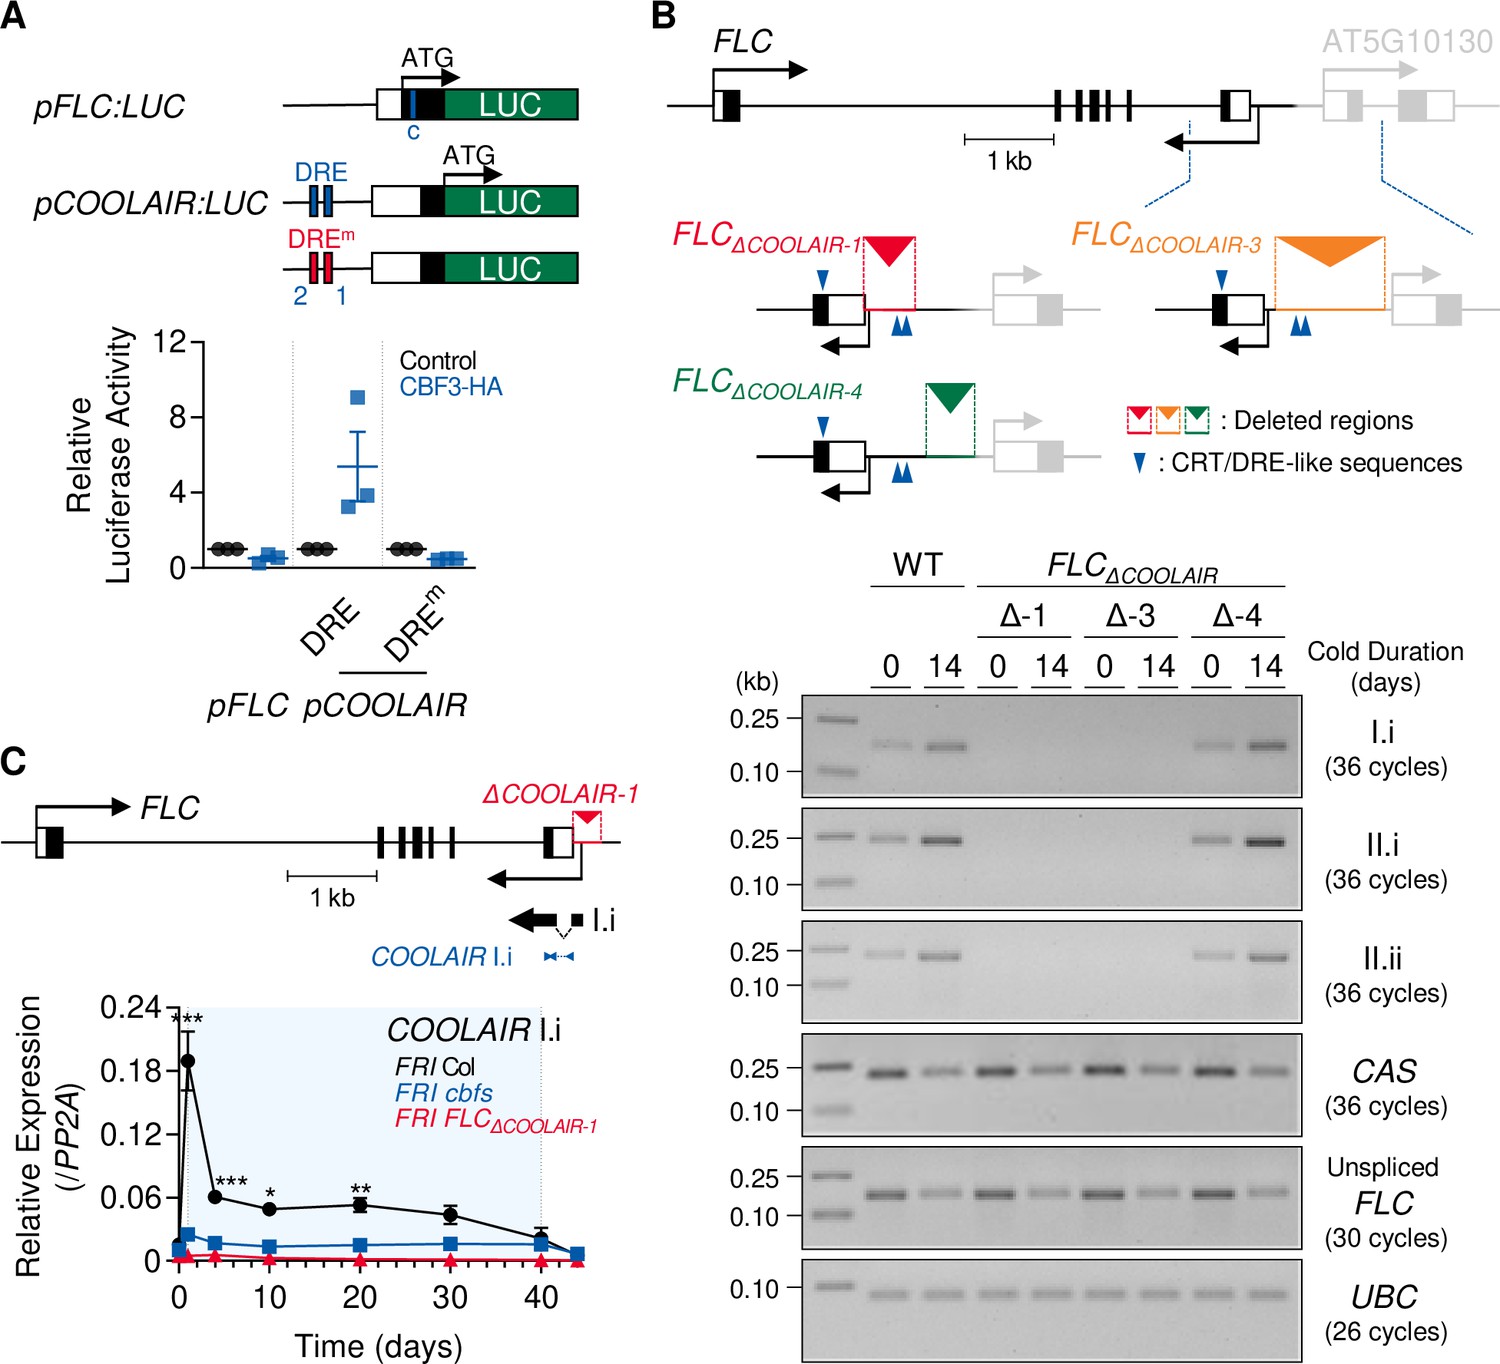
(A) Arabidopsis protoplast transfection assay showing that CBF3 activates COOLAIR promoter with wild-type CRT/DRE (DRE) but fails to activate the one with mutant CRT/DRE (DREm). A schematic of the reporter constructs used for the luciferase assay is presented in the upper panel. pFLC:LUC contains 1 kb of the promoter, the 5′-UTR, and the first exon of FLC. The blue line in the pFLC:LUC graphic indicates the location of DREc. Wild-type and mutant forms of pCOOLAIR:LUC include 1 kb of the COOLAIR promoter with the 3′-UTR and the last exon of FLC. The blue and red lines mark the positions of the wild-type (DRE) and mutant (DREm) forms of DRE1 and DRE2, respectively. Each reporter construct was co-transfected into Arabidopsis protoplast together with the 35S:CBF3-HA effector construct. In parallel, 35S-NOS plasmid was transfected as a control. The result is shown below. Relative luciferase activities were normalized to that of the 35S-NOS control. Values have been represented as mean ± SEM of three biological replicates. Dots and squares represent each data point. (B) Transcript levels of proximal (I.i) and distal (II.i and II.ii) COOLAIR isoforms in wild-type, FLCΔCOOLAIR-1, FLCΔCOOLAIR-3, and FLCΔCOOLAIR-4 plants before and after 14 days of vernalization. FLCΔCOOLAIR-1 and FLCΔCOOLAIR-3 have a 324- and 685 bp deletion of the COOLAIR promoter region, respectively, where DRE1 and 2 are located. FLCΔCOOLAIR-4 has a deletion in the 301 bp COOLAIR promoter region outside of DRE1 and 2 location. The positions of the deleted region are marked in red, orange, and green lines with reversed triangle in the upper graphic. Blue arrows denote CRT/DRE-like sequences. Black and gray bars denote exons, thin lines denote introns, and white bars denote UTRs of FLC and its neighboring gene (AT5G10130). Results of RT-PCR analysis are shown below. UBC was used as a quantitative control. (C) Transcript levels of proximal (I.i) COOLAIR isoform in wild-type, cbfs-1, and FLCΔCOOLAIR-1 plants during vernalization. The position of the deleted region is marked in red lines with a reversed triangle in the upper graphic. Black bars denote exons, thin lines denote introns, and white bars denote UTRs of FLC. The thin black arrow below the gene structure indicates the transcriptional start site of COOLAIR. The thick black arrow below denotes exons of the type I.i COOLAIR variant. The position of the amplicon used for the qPCR analysis is marked with blue arrows. The result of qPCR analysis is presented in the lower panel. Relative transcript levels were normalized to that of PP2A. Values have been represented as mean ± SEM of three biological replicates. The blue shading indicates periods under cold treatment. Asterisks indicate a significant difference, as compared to NV (*, p < 0.05; **, p < 0.01; ***, p < 0.001; two-way ANOVA followed by Tukey’s post-hoc test).
-
Figure 5—source data 1
Uncropped labeled gel images and the original image files for the RT-PCR results.
- https://cdn.elifesciences.org/articles/84594/elife-84594-fig5-data1-v3.zip
Figure 5—figure supplement 1
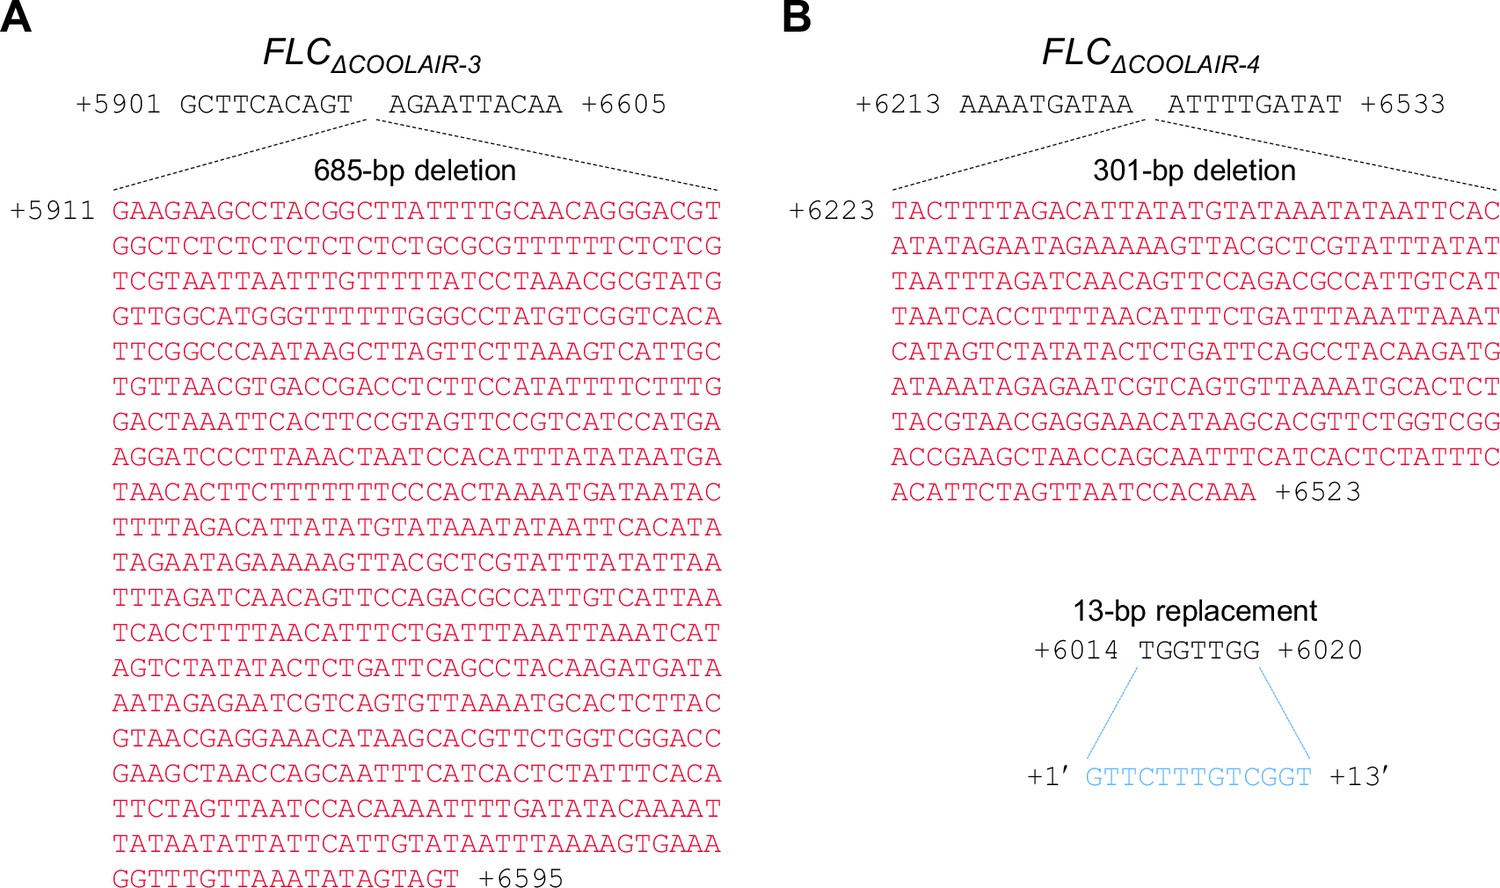
Genomic sequences near the deleted regions in two COOLAIR promoter deletion lines, FLCΔCOOLAIR-3 and FLCΔCOOLAIR-4.
Figure 5—figure supplement 2
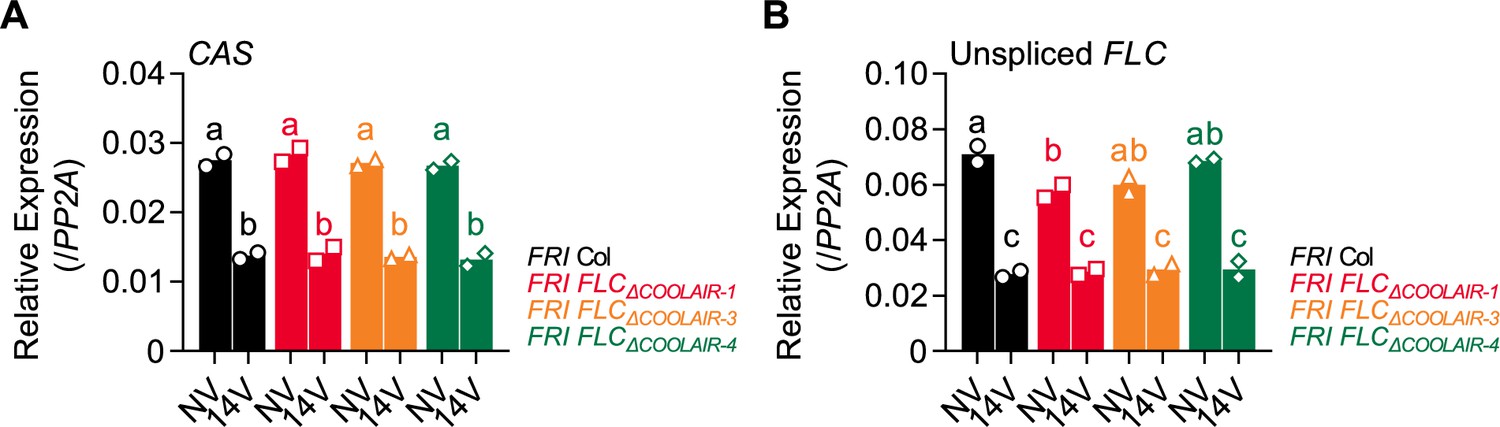
Levels of CAS and unspliced FLC are not significantly altered in the FLCΔCOOLAIR mutant lines.
Figure 5—figure supplement 3
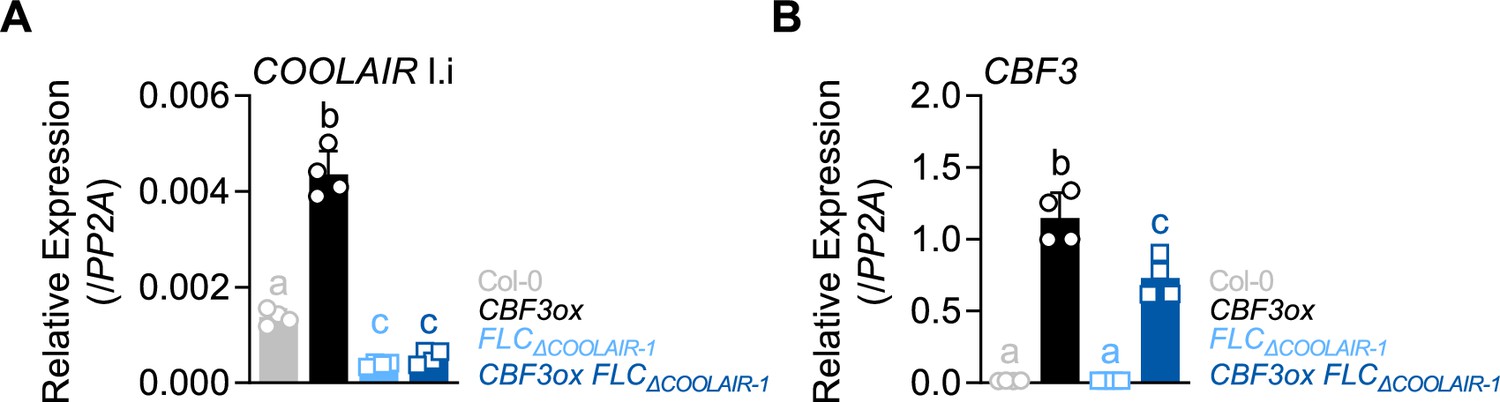
Proximal COOLAIR level is not significantly increased by CBF3 overexpression in the FLCΔCOOLAIR mutant lacking CRT/DREs.
Figure 6
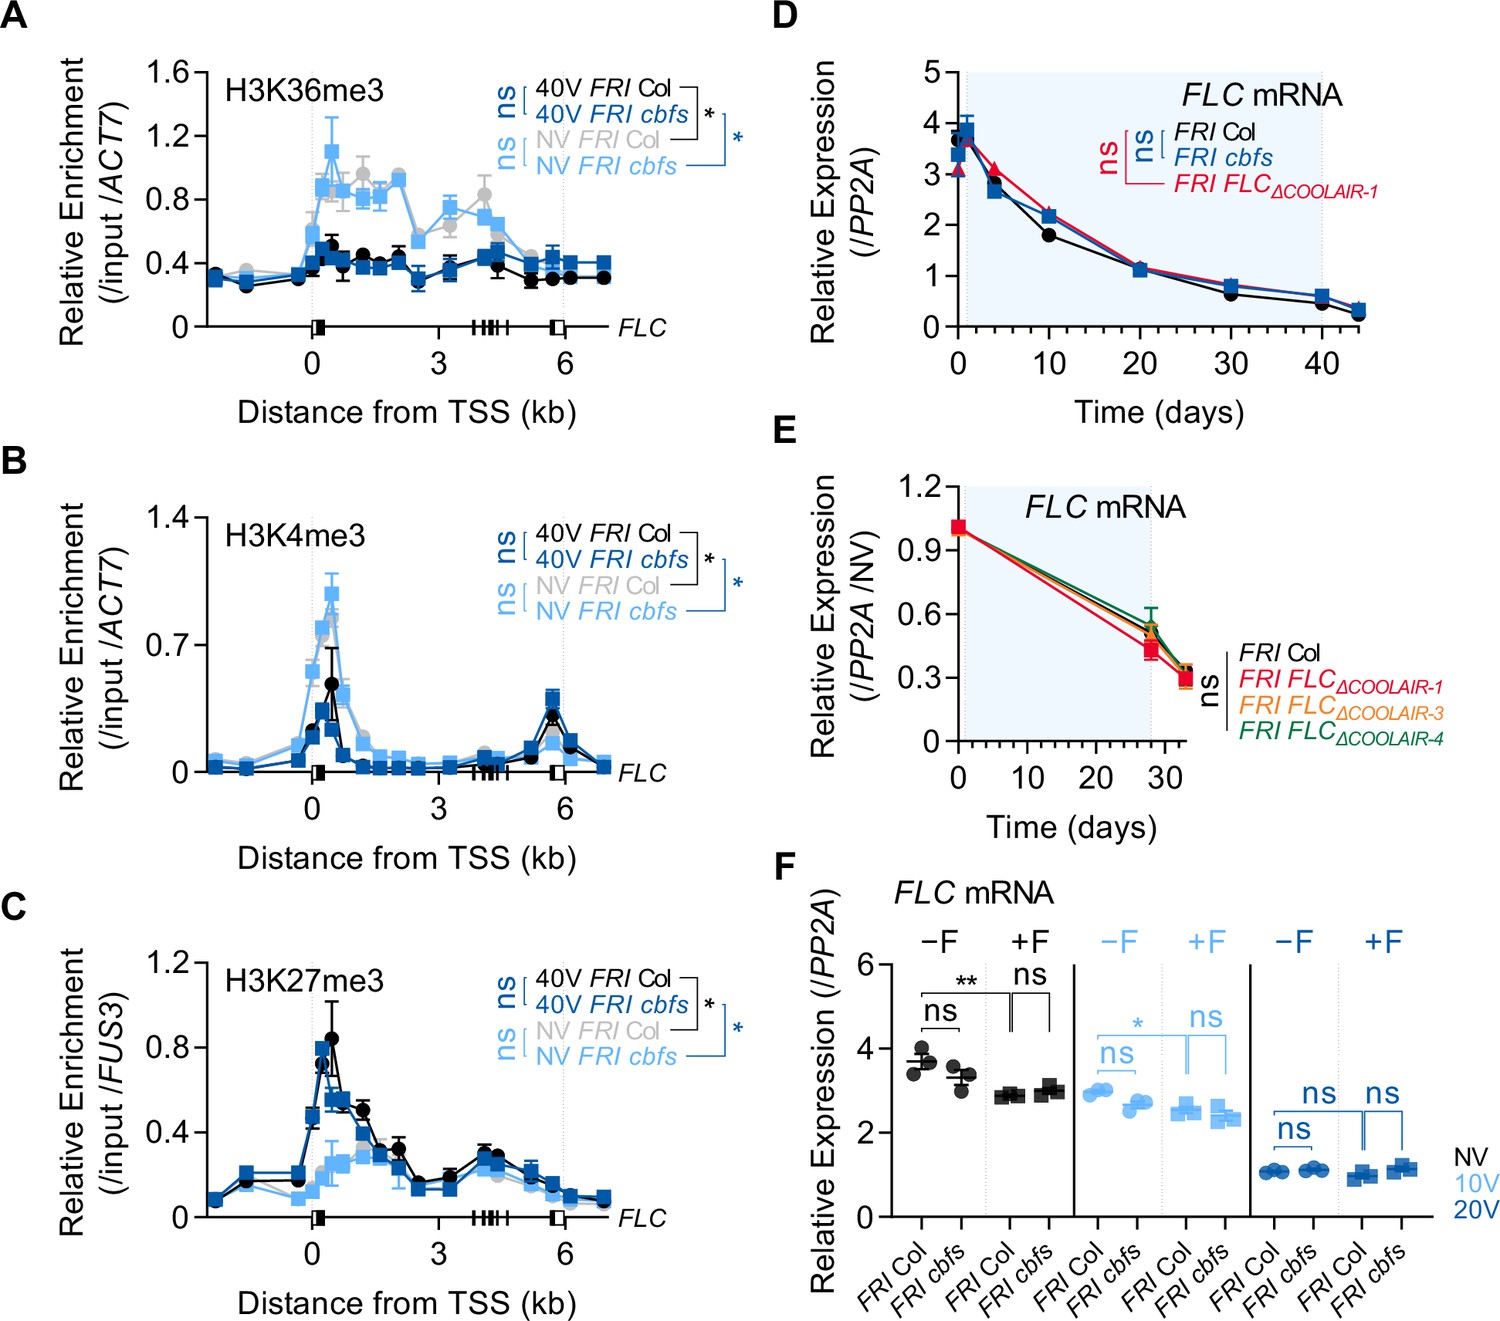
Vernalization-triggered epigenetic silencing of FLC is not affected by CBFs-mediated COOLAIR induction.
(A–C) Enrichments of H3K36me3 (A), H3K4me3 (B), and H3K27me3 (C) on the FLC locus in NV or 40 V wild-type and cbfs-1 plants. The whole seedlings were collected at ZT4 under an SD cycle. Modified histones were immunoprecipitated with anti-H3K36me3, anti-H3K4me3, or anti-H3K27me3 antibodies. H3K36me3, H3K4me3, and H3K27me3 enrichments of the IP/5% input were normalized to those of ACT7 or FUS3. Relative enrichments have been represented as mean ± SEM of three biological replicates. One-way ANOVA and Tukey’s post-hoc test were performed on the ChIP results obtained using two primer pairs corresponding to the FLC nucleation region (Yang et al., 2017). Asterisks indicate a significant difference (*, p < 0.05). ns, not significant (P ≥ 0.05). (D) Transcript levels of FLC mRNA in wild-type, cbfs-1 and FLCΔCOOLAIR-1 plants during and after vernalization. Blue shading denotes cold periods. Relative levels were normalized to that of PP2A. Values have been represented as mean ± SEM of three biological replicates. ns, not significant between wild type and mutants, as assessed using two-way ANOVA followed by Tukey’s post-hoc test (p ≥ 0.05). (E) Transcript levels of FLC mRNA in wild type, FLCΔCOOLAIR-1, FLCΔCOOLAIR-3, and FLCΔCOOLAIR-4 during and after vernalization. Blue shading denotes cold periods. Relative levels were normalized to that of PP2A, and then normalized to NV of each genotype. Values have been represented as mean ± SEM of three biological replicates. ns, not significant between wild type and mutants, as assessed using two-way ANOVA followed by Tukey’s post-hoc test (p ≥ 0.05). (F) Effect of the first frost-mimicking treatment (8 hr freezing) on the FLC mRNA level in wild type and cbfs-1 after vernalization. NV, 10V, 20V, NV +F, 10V+F, and 20V+F plants were subjected to the treatments described in Figure 4C. Relative levels were normalized to that of PP2A. Values have been represented as mean ± SEM of three biological replicates. Dots and squares represent each data point. Asterisks indicate a significant difference (*, p < 0.05; **, p < 0.01; two-way ANOVA followed by Tukey’s post-hoc test). ns, not significant (p ≥ 0.05).
Figure 7
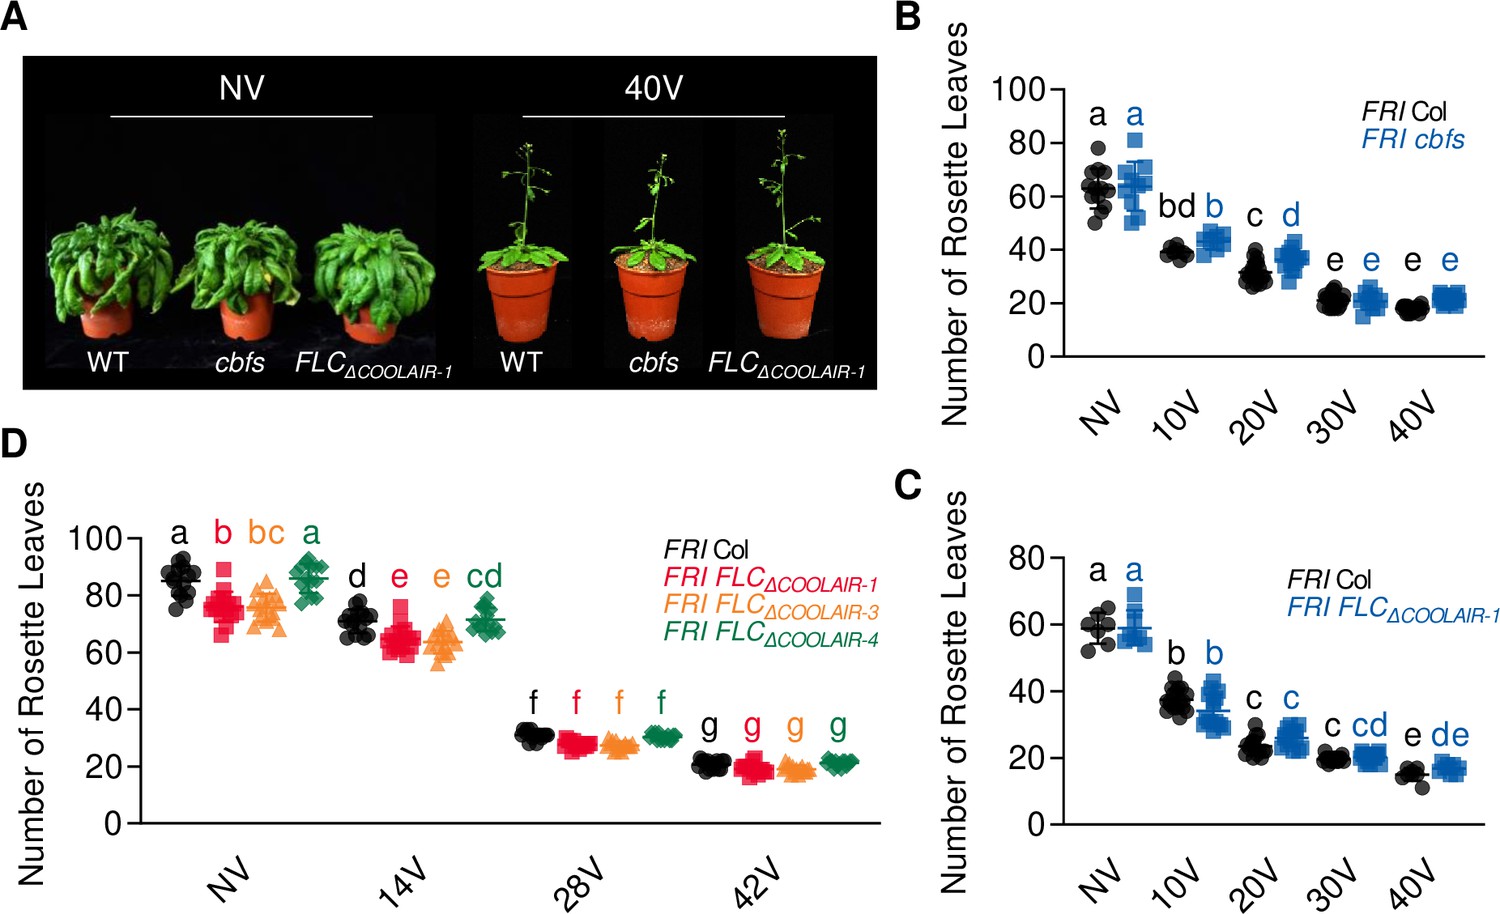
CBF-mediated COOLAIR induction under long-term cold is not absolutely necessary for vernalization response.
(A) Photographs of NV and 40 V wild type, cbfs-1, and FLCΔCOOLAIR-1. NV plants were grown at 22 °C under LD and 40V plants were grown at 22 °C under LD after being treated for 40V under SD. The photos were taken when the NV plants started to bolt and the 40V plants showed the first open flower. (B) Flowering times of NV and vernalized (10V–40V) wild-type and cbfs-1 plants. Flowering time was measured in terms of the number of rosette leaves produced when bolting. Plants were grown under LD after vernalization treatment. Bars and error bars represent the mean ± standard deviation (SD) of three biological replicates. Each dot and square indicates individual flowering time. Significant differences have been marked using different letters (a–e; two-way ANOVA followed by Tukey’s post-hoc test; p < 0.05). (C) Flowering times of non-vernalized (NV) and vernalized (10V–40V) wild-type and FLCΔCOOLAIR-1 plants. Flowering time was measured in terms of the number of rosette leaves produced when bolting. Plants were grown under LD after vernalization. Bars and error bars indicate the mean ± SD. Each dot and square represents the individual flowering time. Significant differences have been indicated using different letters (a–e; two-way ANOVA followed by Tukey’s post-hoc test; P < 0.05). (D) Flowering times of non-vernalized (NV) and vernalized (14V–42V) wild-type, FLCΔCOOLAIR-1, FLCΔCOOLAIR-3, and FLCΔCOOLAIR-4 plants. Flowering time was measured in terms of the number of rosette leaves produced when bolting. Plants were grown under LD after vernalization. Bars and error bars indicate the mean ± SD. Each dot, square, triangle, and polygon represents the individual flowering time. Significant differences have been indicated using different letters (a–g; two-way ANOVA followed by Tukey’s post-hoc test; p < 0.05).
Figure 8
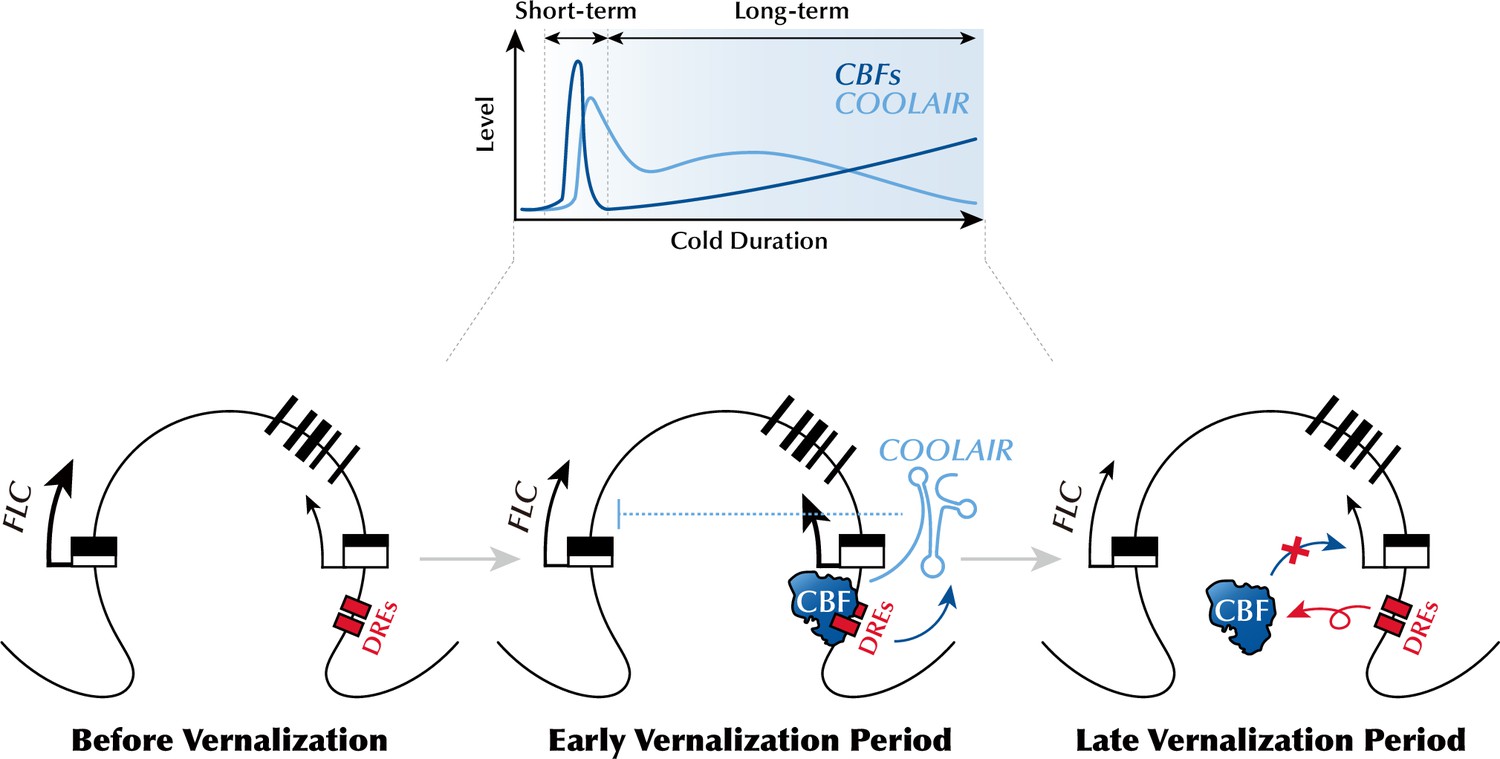
Schematic model describing the mechanism of CBFs-mediated COOLAIR expression during the early phase of vernalization.
During the early phase of vernalization, increased CBF upregulates COOLAIR expression by binding to CRT/DREs at the 3′-end of FLC. In the late phase of vernalization, owing to the silencing of FLC chromatin, CBF proteins are released from the CRT/DREs in the COOLAIR promoter, which leads to a reduction in COOLAIR levels.
Additional files
-
Supplementary file 1
Oligonucleotide sequences used in this study.
- https://cdn.elifesciences.org/articles/84594/elife-84594-supp1-v3.xlsx
-
MDAR checklist
- https://cdn.elifesciences.org/articles/84594/elife-84594-mdarchecklist1-v3.docx
Download links
A two-part list of links to download the article, or parts of the article, in various formats.
Downloads (link to download the article as PDF)
Open citations (links to open the citations from this article in various online reference manager services)
Cite this article (links to download the citations from this article in formats compatible with various reference manager tools)
Vernalization-triggered expression of the antisense transcript COOLAIR is mediated by CBF genes
eLife 12:e84594.
https://doi.org/10.7554/eLife.84594


