Global change in brain state during spontaneous and forced walk in Drosophila is composed of combined activity patterns of different neuron classes
- School of Life Sciences, Technical University of Munich, Germany
- University of Bonn, Medical Faculty (UKB), Institute of Physiology II, Germany
- Max Planck Institute for Brain Research, Computation in Neural Circuits, Germany
Figures
Figure 1 with 1 supplement
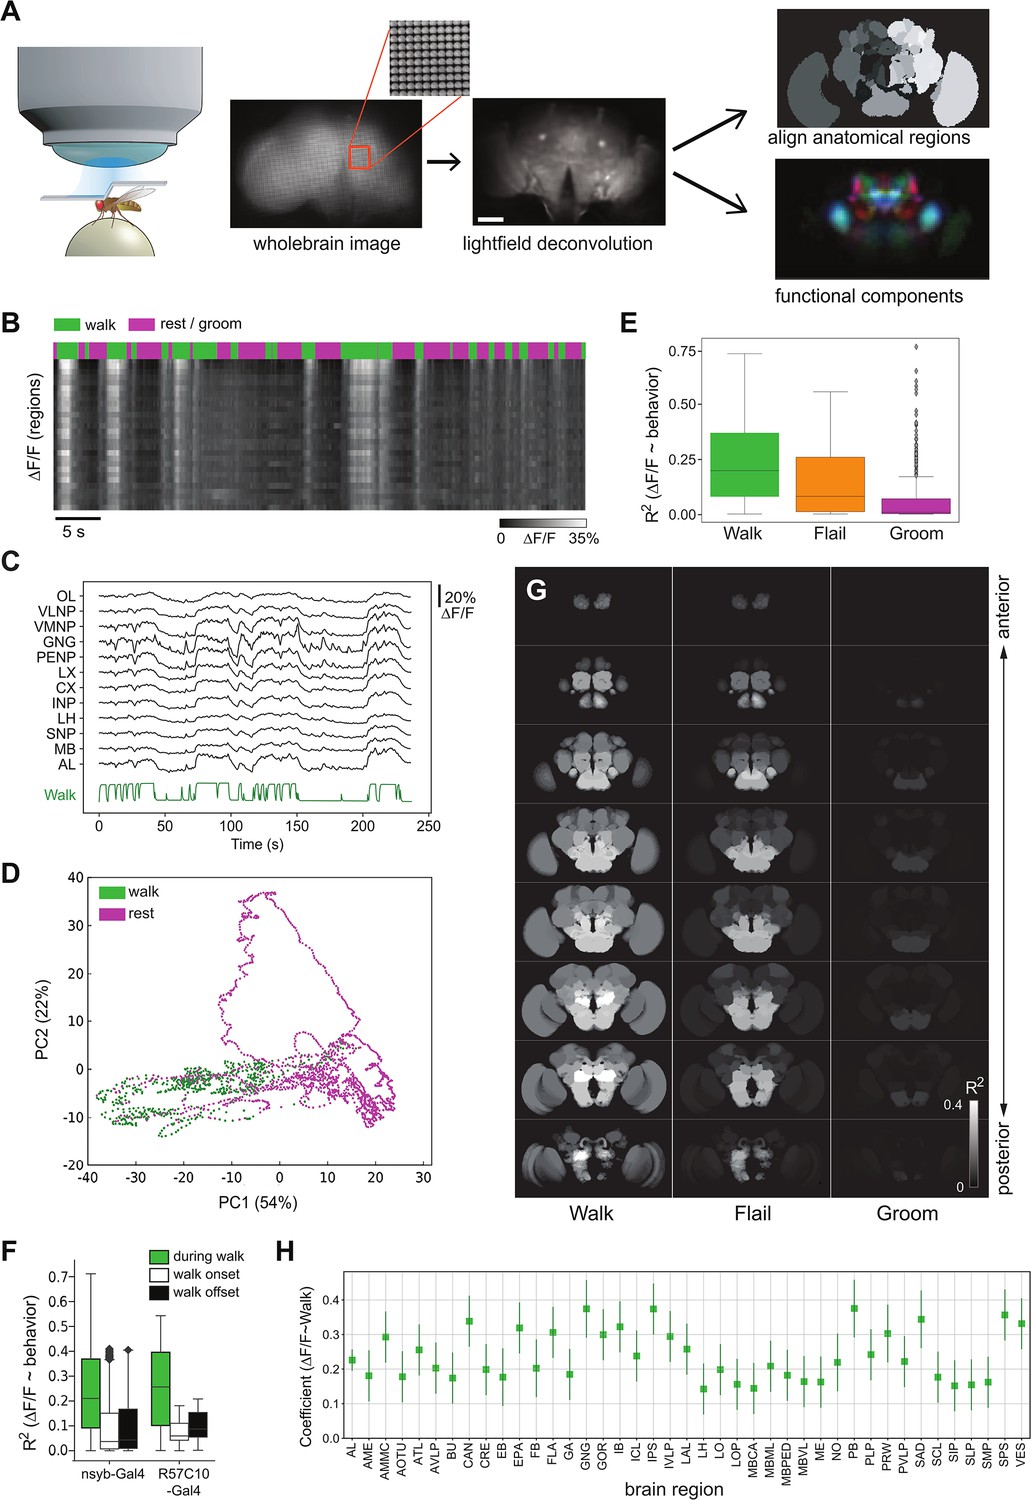
Global brain activation during walk.
(A) Schematic overview of the preparation and analysis method. Please see methods for details. (B) Raster plot of the activity of regions. Top panels depict walking bouts in green and rest or grooming in magenta. Lower panel shows calcium activity elicited throughout the experiment. The brighter the higher the calcium transients. Mean forward speed: 5.6 mm/s, mean angular velocity: 0.4 rad/s. Bar is 60 μm. (C) Sample traces (ΔF/F) for different brain regions relative to walk (green). (D) First two principal components from whole brain activity color coded with behavior (see additional examples in Figure 1—figure supplement 1). (E) R2 for regression of single regions with single behaviors (all regions were pooled, but p-values are obtained after averaging regions for each fly. Walk: N = 16, Flail: N = 7, Groom: N = 6). Mann–Whitney U-test Bonferroni adjusted p-values: Walk vs. Flail: 0.085, Walk vs. Groom: 0.011, Flail vs. Groom: 0.26. Center line, median; box limits, upper and lower quartiles; whiskers, ×1.5 interquartile range; points, outliers. (F) R2 of single region activity regression with walk, walk onset and walk offset (all regions were pooled, nsyb-Gal4: N = 16, GMR57C10-Gal4: N = 4). Regressors for walk onset or offset are Dirac functions convolved with the GCaMP response (see Methods). Box plots show: center line, median; box limits, upper and lower quartiles; whiskers, ×1.5 interquartile range; points, outliers. Mann–Whitney U-test for the two genotypes grouped (comparison of fly-wise averages): walk vs. walk onset: p = 3 × 10⁻⁵, walk vs. walk offset: p = 6 × 10⁻⁵. (G) Z-stack map of R2 median (Walk: N (flies) = 16, Flail: N = 7, Groom: N = 6) for regression between single region activity and walk, flail or groom (see values in Figure 1—figure supplement 1D-F). (H) Coefficient of single region’ activity regression with walk. All regions’ 95% CI ( bars) are above zero and all adjusted p-values <0.001 (Benjamini–Hochberg correction). N = 16.
Figure 1—figure supplement 1
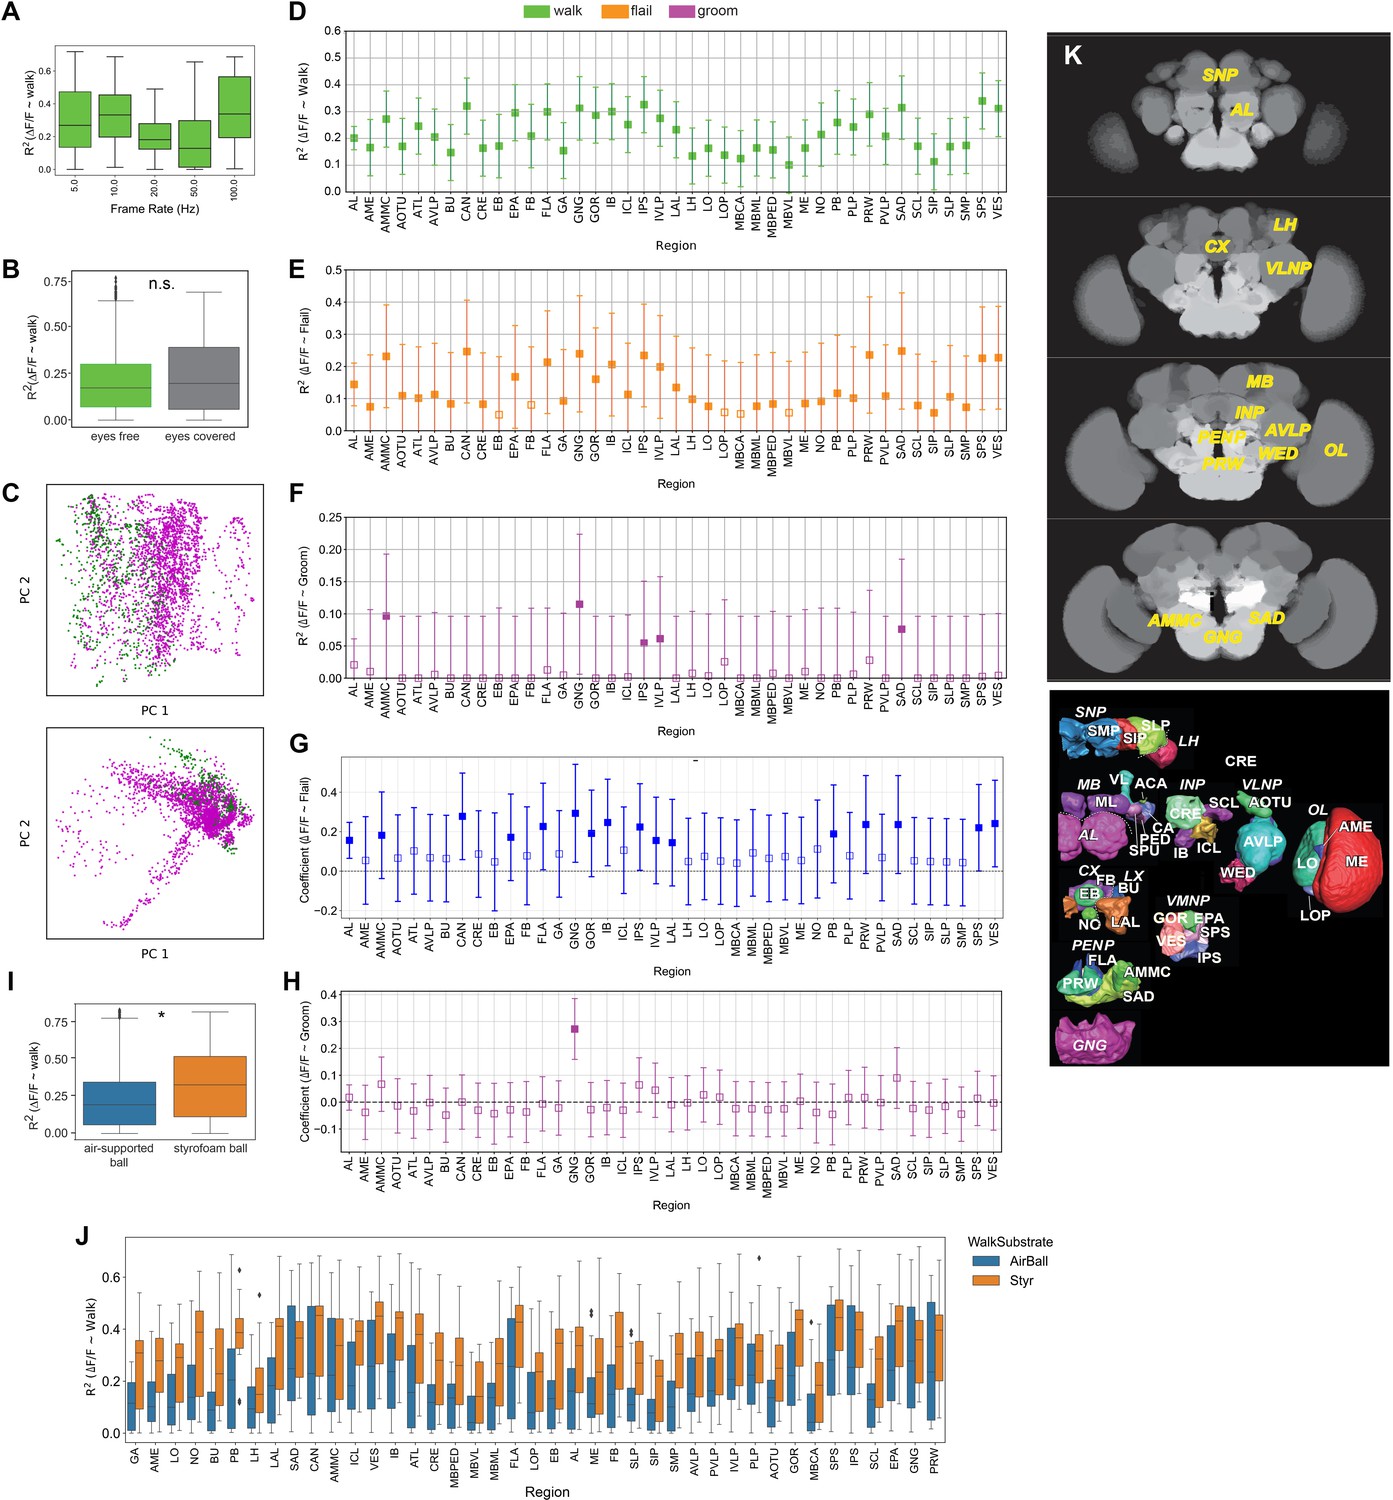
Correlation of regional activity with walk.
(A) R2 during walk at different recording frequencies for pan-neuronally expressed GCaMP6f or GCaMP6m (all regions were pooled). No significant difference was found for walk between the different frequencies. Box plots show: center line, median; box limits, upper and lower quartiles; whiskers, ×1.5 interquartile range; points, outliers. (B) R2 for walking with eyes free (not painted, N = 5) and eyes covered (painted, N = 5, p-value: 0.34). Box plots show: center line, median; box limits, upper and lower quartiles; whiskers, ×1.5 interquartile range; points, outliers. (C) Additional examples (two different flies) of whole brain activity reduced to the two first principal component space. (D) R2 obtained with regressing activity of individual regions with walk (pan-Gal4;UAS-GCaMP). Adjusted p-values (Benjamini–Hochberg correction) were all <0.01. Bars are 95% CI. (E) R2 obtained with regressing activity of individual regions with flail (pan-Gal4;UAS-GCaMP). Empty markers correspond to adjusted (Benjamini–Hochberg correction) p-value >0.05 for comparison to 0. Bars are 95% CI. (F) R2 obtained with regressing activity of individual regions with groom (pan-Gal4;UAS-GCaMP). Bars are 95% CI. (G) Correlation coefficient obtained with regressing activity of individual regions with flail (pan-Gal4;UAS-GCaMP). Bars are 95% CI. (H) Correlation coefficient obtained with regressing activity of individual regions with grooming behavior (pan-Gal4;UAS-GCaMP). Bars are 95% CI. (I) R2 obtained with regressing activity of individual regions with walking on an air-supported (N = 19) vs. a styrofoam ball (N = 13), p-value = 0.02. Box plots show: center line, median; box limits, upper and lower quartiles; whiskers, ×1.5 interquartile range; points, outliers. (J) R2 obtained with regressing activity of individual regions with walking on an air-supported (N = 19) vs. a Styrofoam ball (N = 13). Box plots show: center line, median; box limits, upper and lower quartiles; whiskers, ×1.5 interquartile range; points, outliers. (K) Top: Examples of brain activity maps (R2 as z-stacks) and names of individual brain regions. Bottom: Schematic showing brain regions in adult fly brain adapted from Ito et al., 2014.
Figure 2 with 1 supplement
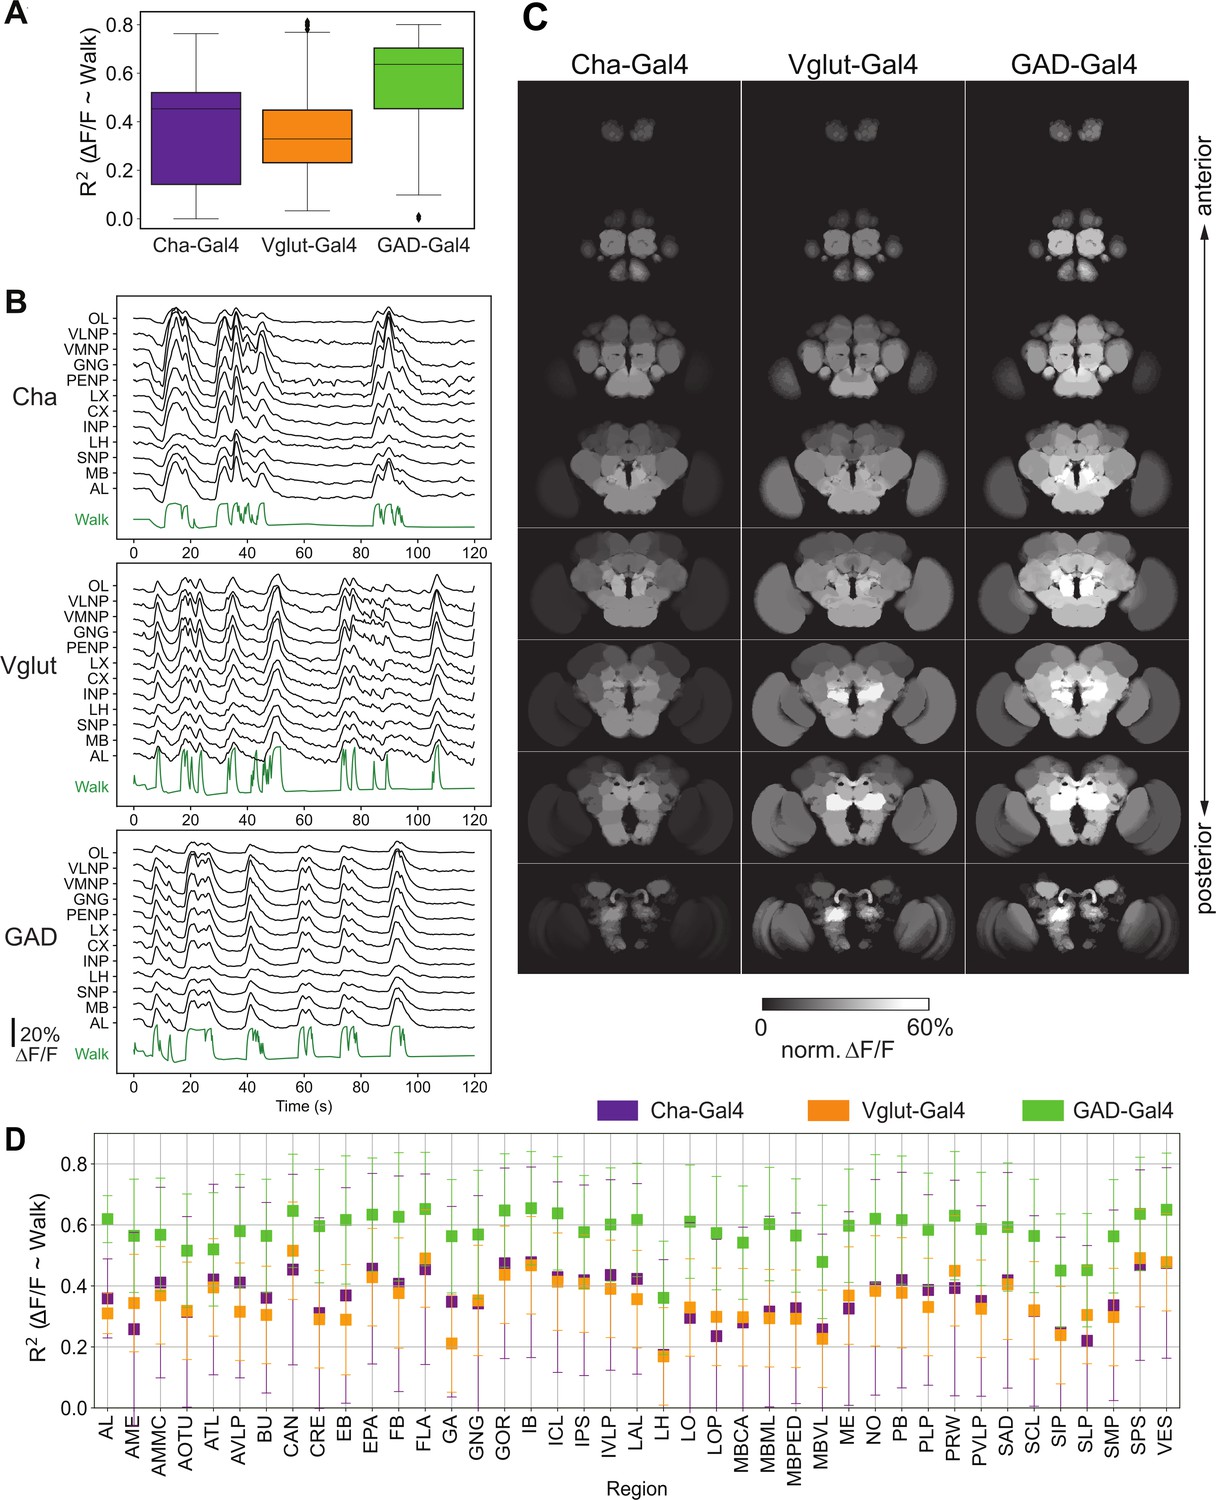
Activity of neurons releasing the three major neurotransmitters, glutamate, GABA, and acetylcholine, during walk.
N = 5 flies for each genotype. (A) R2 for regression of single region activity with walk for different genotypes (all regions were pooled). No pairwise comparison of fly-wise averages is significantly different (Mann–Whitney U-test). Box plot: center line, median; box limits, upper and lower quartiles; whiskers, ×1.5 interquartile range; points, outliers. (B) Maps of activation during walk (regression coefficient of single region activity with walk) for Cha-Gal4, GAD-Gal4, and Vglut-Gal4 expressing neurons. See Figure 2—figure supplement 1 for values and statistical tests. Cosine similarity: Cha vs. Vglut: 0.98, Vglut vs. GAD: 0.98, Cha vs. GAD: 0.99. (C) Sample traces (ΔF/F) for different brain regions relative to forward walk (green). See Figure 2—figure supplement 1 for values. (D) R2 for regression of single region activity with walk for Cha-Gal4, GAD-Gal4, and Vglut-Gal4. 95% CI is shown. All values are significantly above zero (Benjamini–Hochberg adjusted t-test p-values <0.001).
Figure 2—figure supplement 1
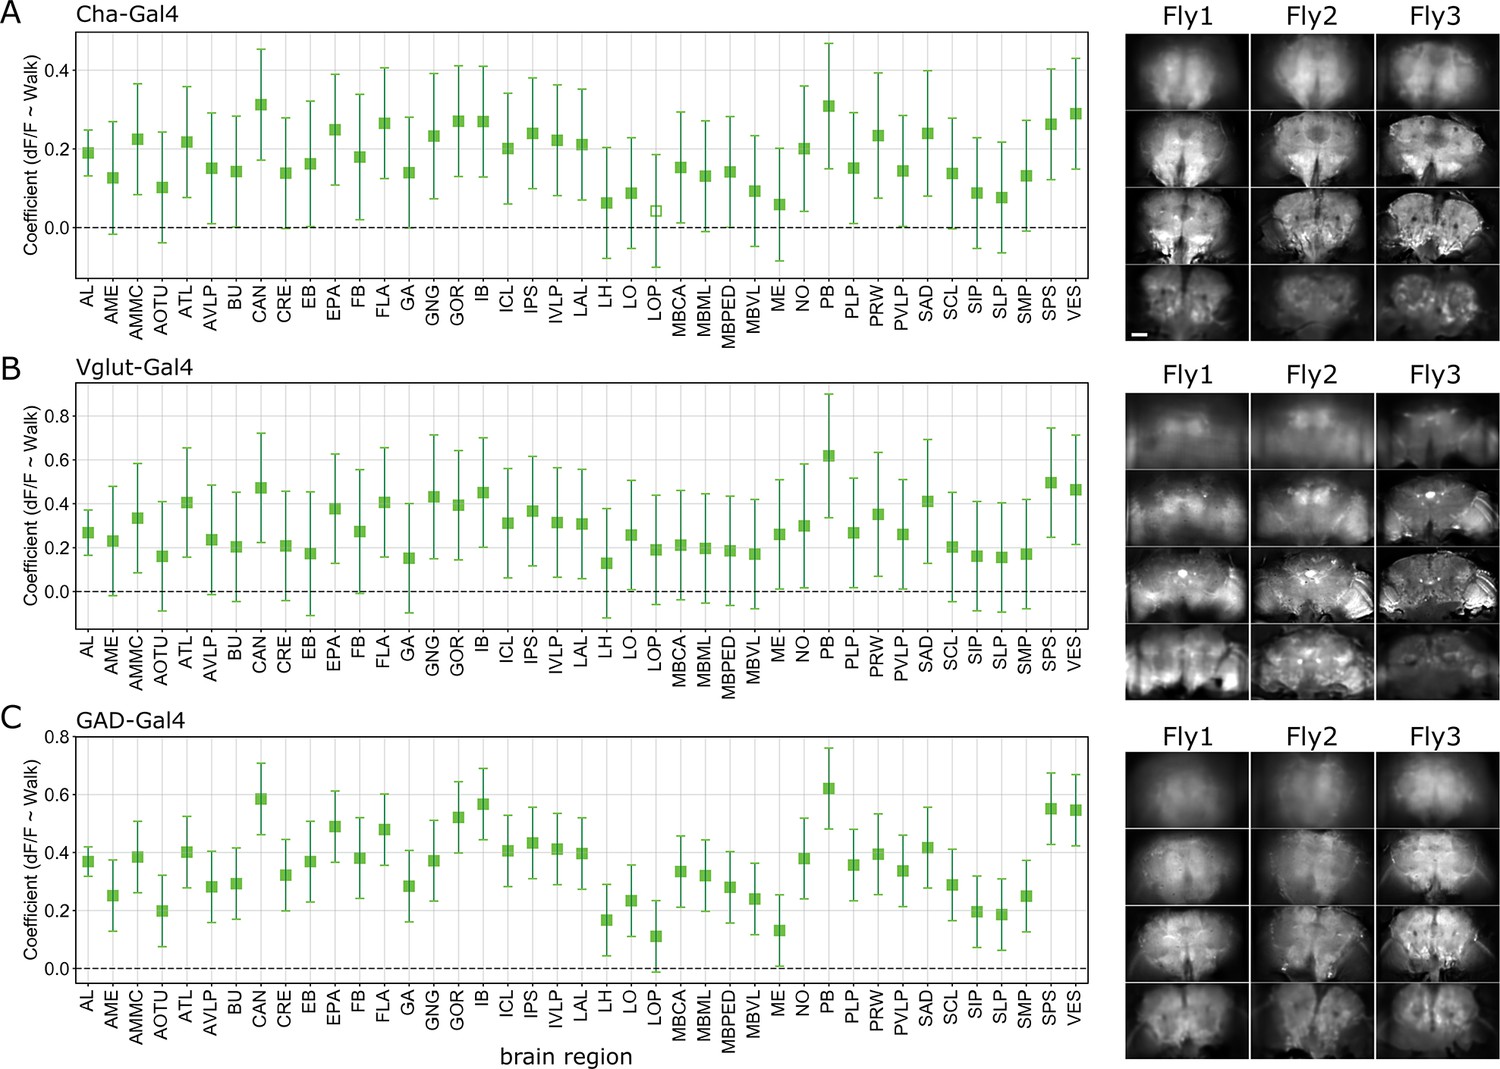
Correlation coefficients for regression of single region activity with walk.
N = 5 flies for each genotype. Empty markers correspond to adjusted (Benjamini–Hochberg correction) p-value >0.05 for comparison to 0. Right, expression pattern for three example flies per genotype (baseline fluorescence at z = −60, −18, 24, and 66 µm). (A) Cholinergic neurons (Cha-Gal4;UAS-GCaMP6). (B) Glutamatergic neurons (Vglut-Gal4;UAS-GCaMP6). (C) GABAergic neurons (GAD-Gal4;UAS-GCaMP6). 95% CI. Bar is 60 µm.
Figure 3 with 1 supplement
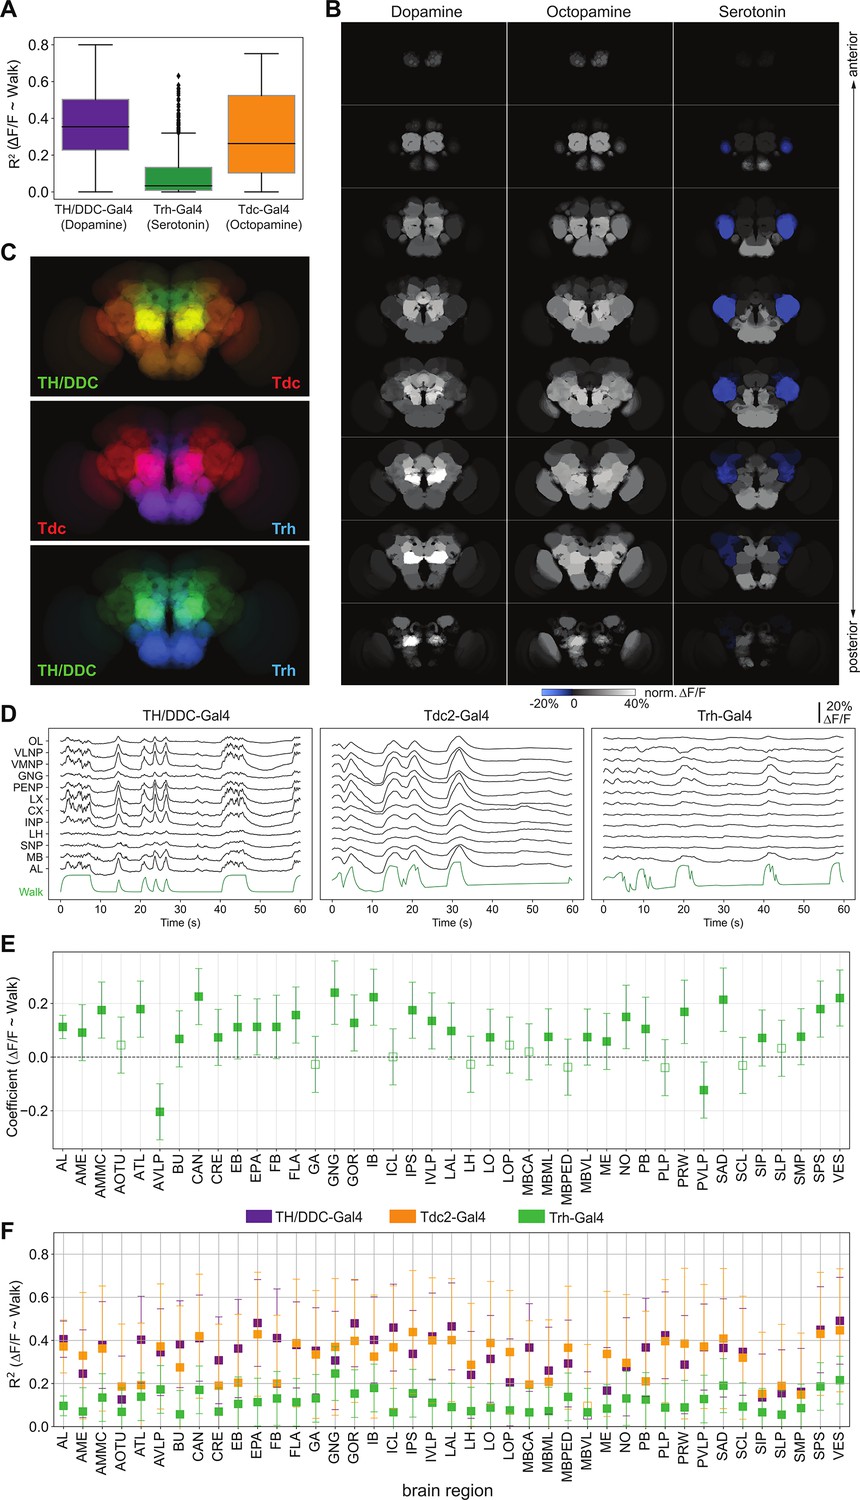
Neuromodulatory neurons are strongly and differentially activated during walk.
TH/DDC-Gal4: N = 9, Tdc2-Gal4: N = 7, Trh-Gal4: N = 6 flies. (A) R2 for regression of single region activity with walk for different genotypes (all regions were pooled). Mann–Whitney U-test Bonferroni adjusted p-values: TH vs. Trh: 0.032, TH vs. TDC: ns, Trh vs. TDC: 0.040. Box plot: center line, median; box limits, upper and lower quartiles; whiskers, ×1.5 interquartile range; points, outliers. (B) Maps of activation during walk (regression coefficient of single region activity with walk) for TH-Gal4 and DDC-Gal4 or GMR58E04-Gal4 (dopaminergic neurons), TDC2-Gal4 (octopaminergic neurons), and Trh-Gal4 (serotonergic neurons) expressing neurons. Blue indicates inhibition. (C) Overlay of activity maps of two neuromodulators in each panel. Cosine similarity: TH vs. Trh: 0.69, TH vs. TDC: 0.93, TDC vs. Trh: 0.69. (D) Sample traces (ΔF/F) for different brain regions relative to forward walk (green). (E) Coefficient during walk for different brain regions for Trh-Gal4 expressing serotonergic neurons. All regions are significantly correlated. (F) R2 of regression of fluorescence vs. walk for TH/DDC(58E02)-Gal4, Tdc2-Gal4, and Trh-Gal4 expressing neurons. Bars are 95% CI.
Figure 3—figure supplement 1
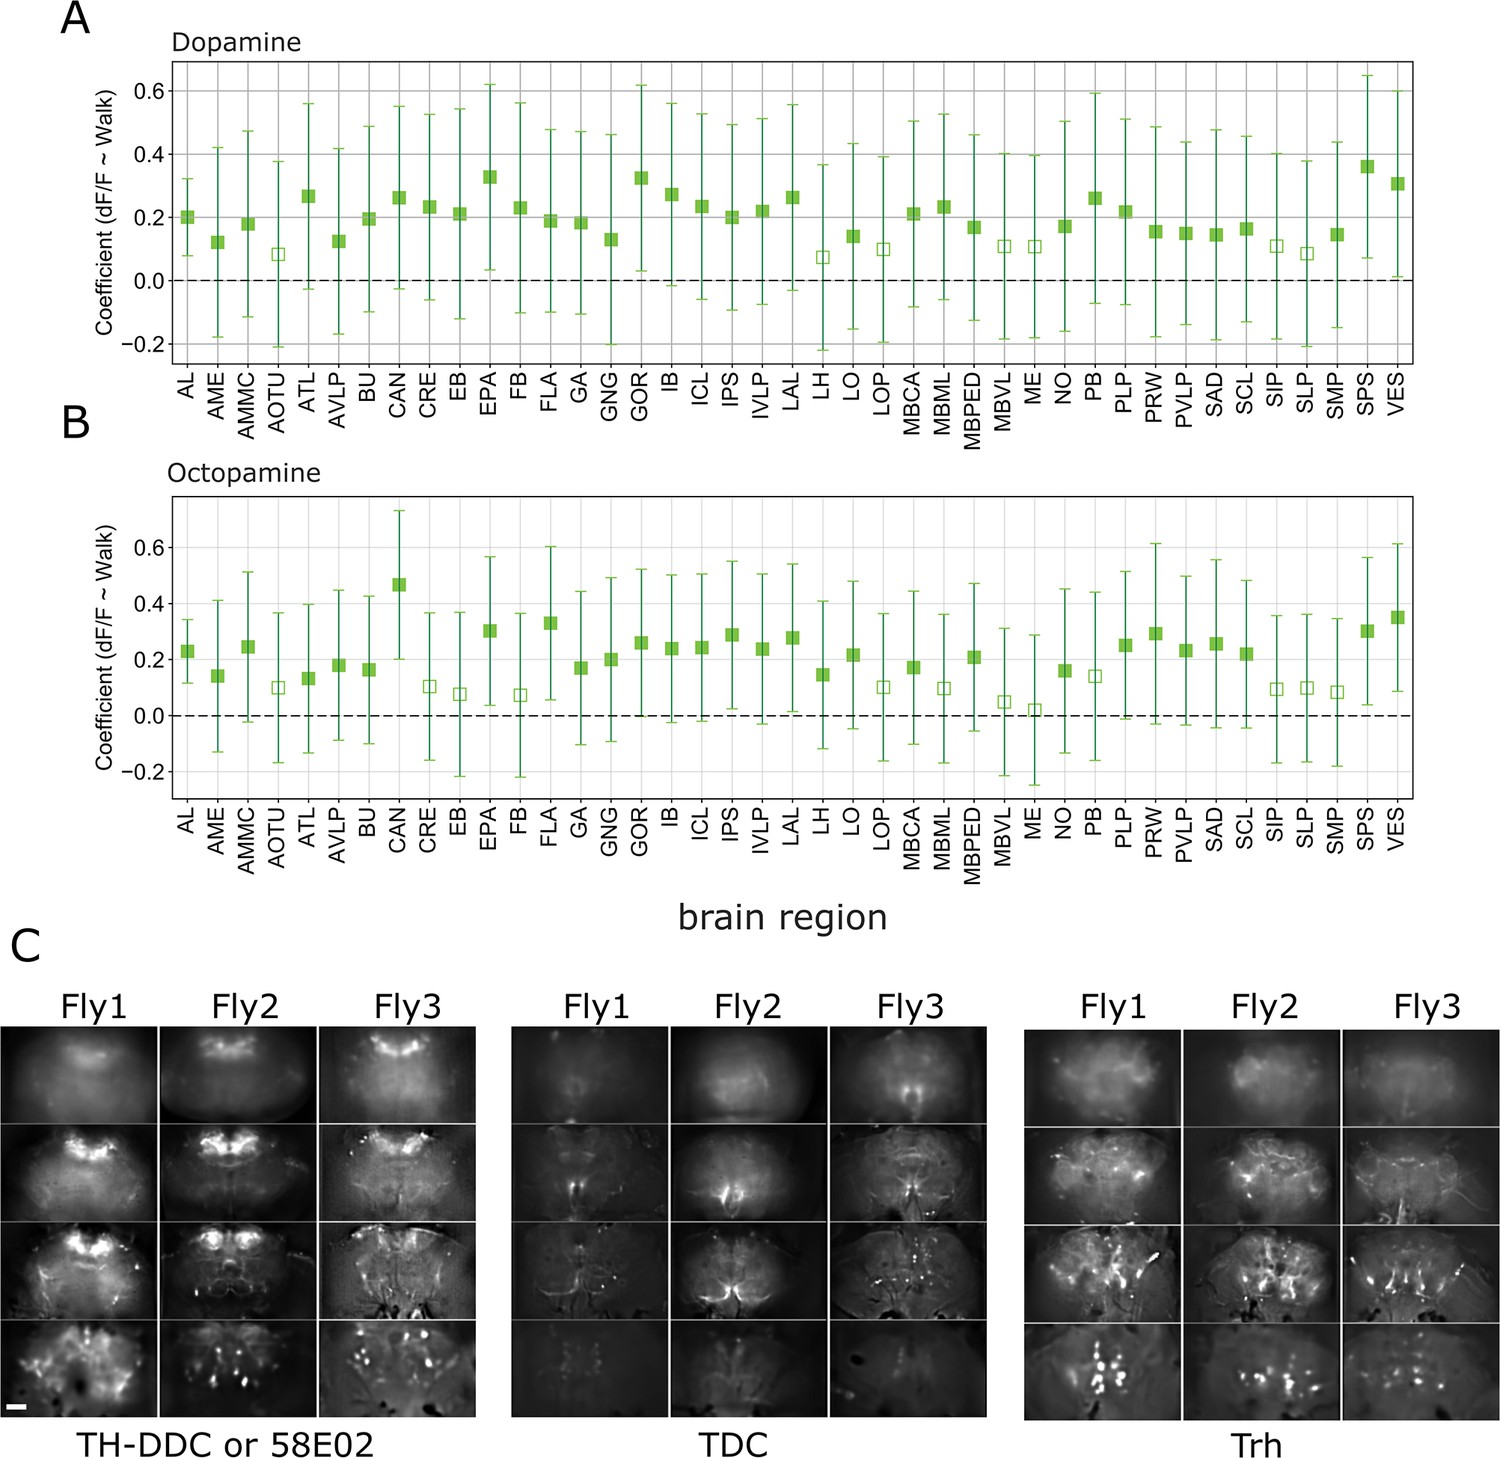
Correlation coefficients for regression of single region activity with walk.
Empty markers correspond to adjusted (Benjamini–Hochberg correction) p-value >0.05 (null hypothesis is 0). TH/DDC-Gal4: N = 9, Tdc2-Gal4: N = 7. (A) Dopaminergic neurons (TH/DDC-Gal4 or GMR58E04-Gal4;UAS-GCaMP6). (B) Octopaminergic neurons (Tdc2-Gal4;UAS-GCaMP6). Bars are 95% CI. (C) Expression pattern for three example flies per genotype (baseline fluorescence at z = −60, −18, 24, and 66 µm).
Figure 4 with 1 supplement

Whole brain analysis pinpoints specific subregions responding to walk.
(A) Images of example components that are significantly correlated with walk (coefficient or R2 95% CI above zero). Upper left: Components derived from imaging with a pan-neuronal driver. Upper right: Components derived with Tdc2-Gal4. Lower left: Components derived with TH/DDC or GMR58E02-Gal4. Lower right: Components derived with Trh-Gal4. (B) Correlation coefficient for component activity vs. walk. N = 58 flies of different genotypes, see table in methods for details. Empty markers correspond to adjusted (Benjamini–Hochberg correction) p-value >0.05 for comparison to 0. Bars are 95% CI.
Figure 4—figure supplement 1
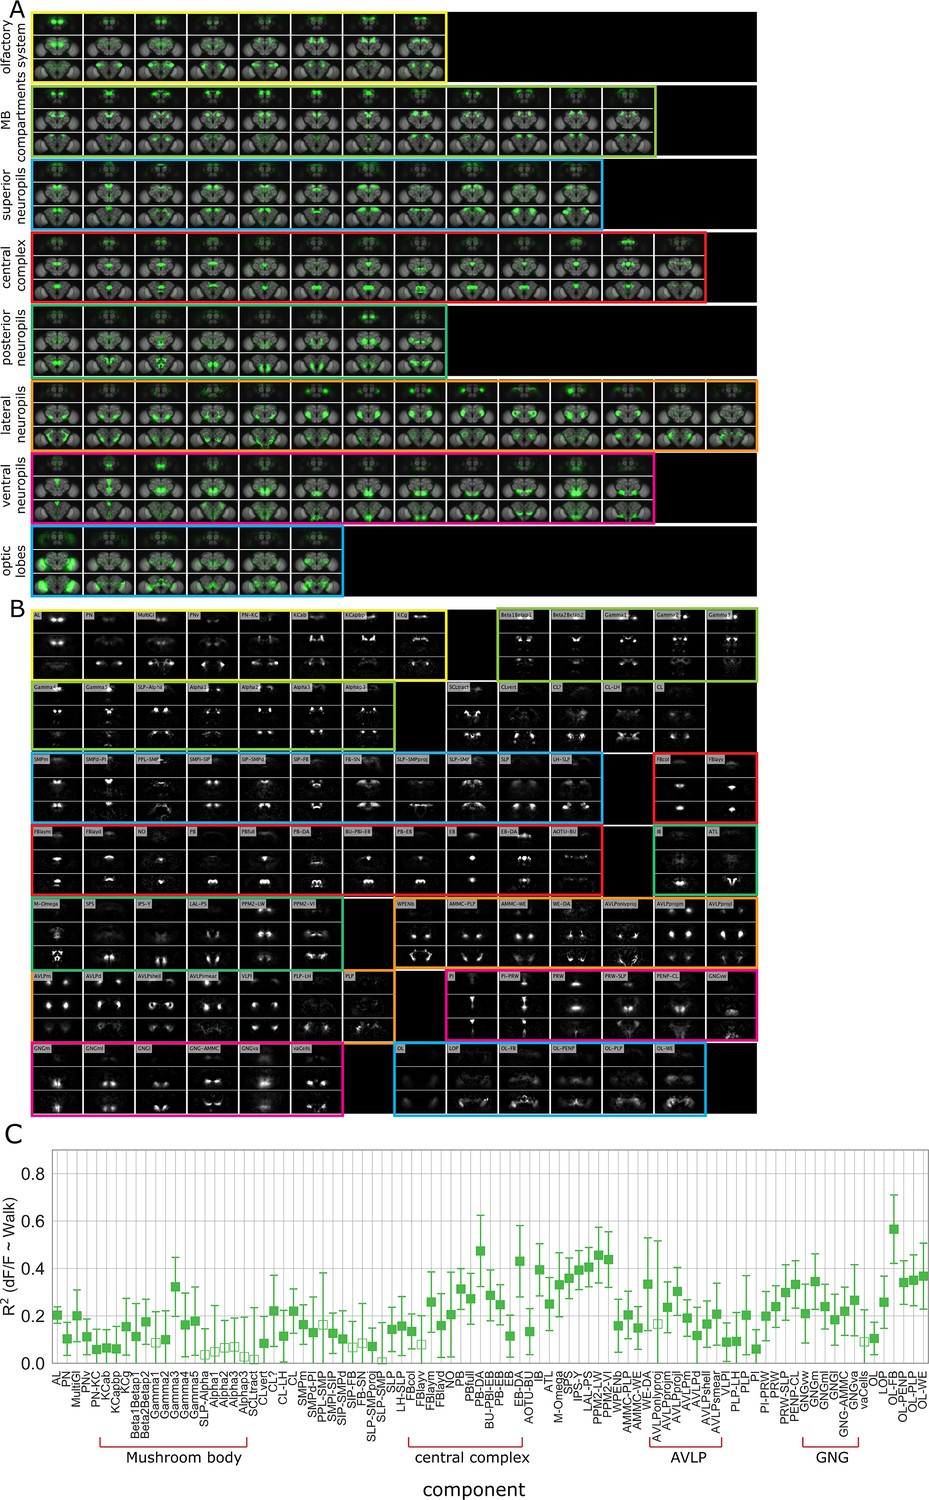
Component maps and correlation with walk.
(A) Z-stacks of functional components for walk mapped onto the adult fly brain. (B) Functional components for walk and their names or acronyms. See Table 2 for definition of acronyms. (C) R2 for regression of components activity with walk. See Table 2 for definition of acronyms. N = 58 flies of different genotypes; see table in methods for details. Bars are 95% CI.
Figure 5 with 1 supplement
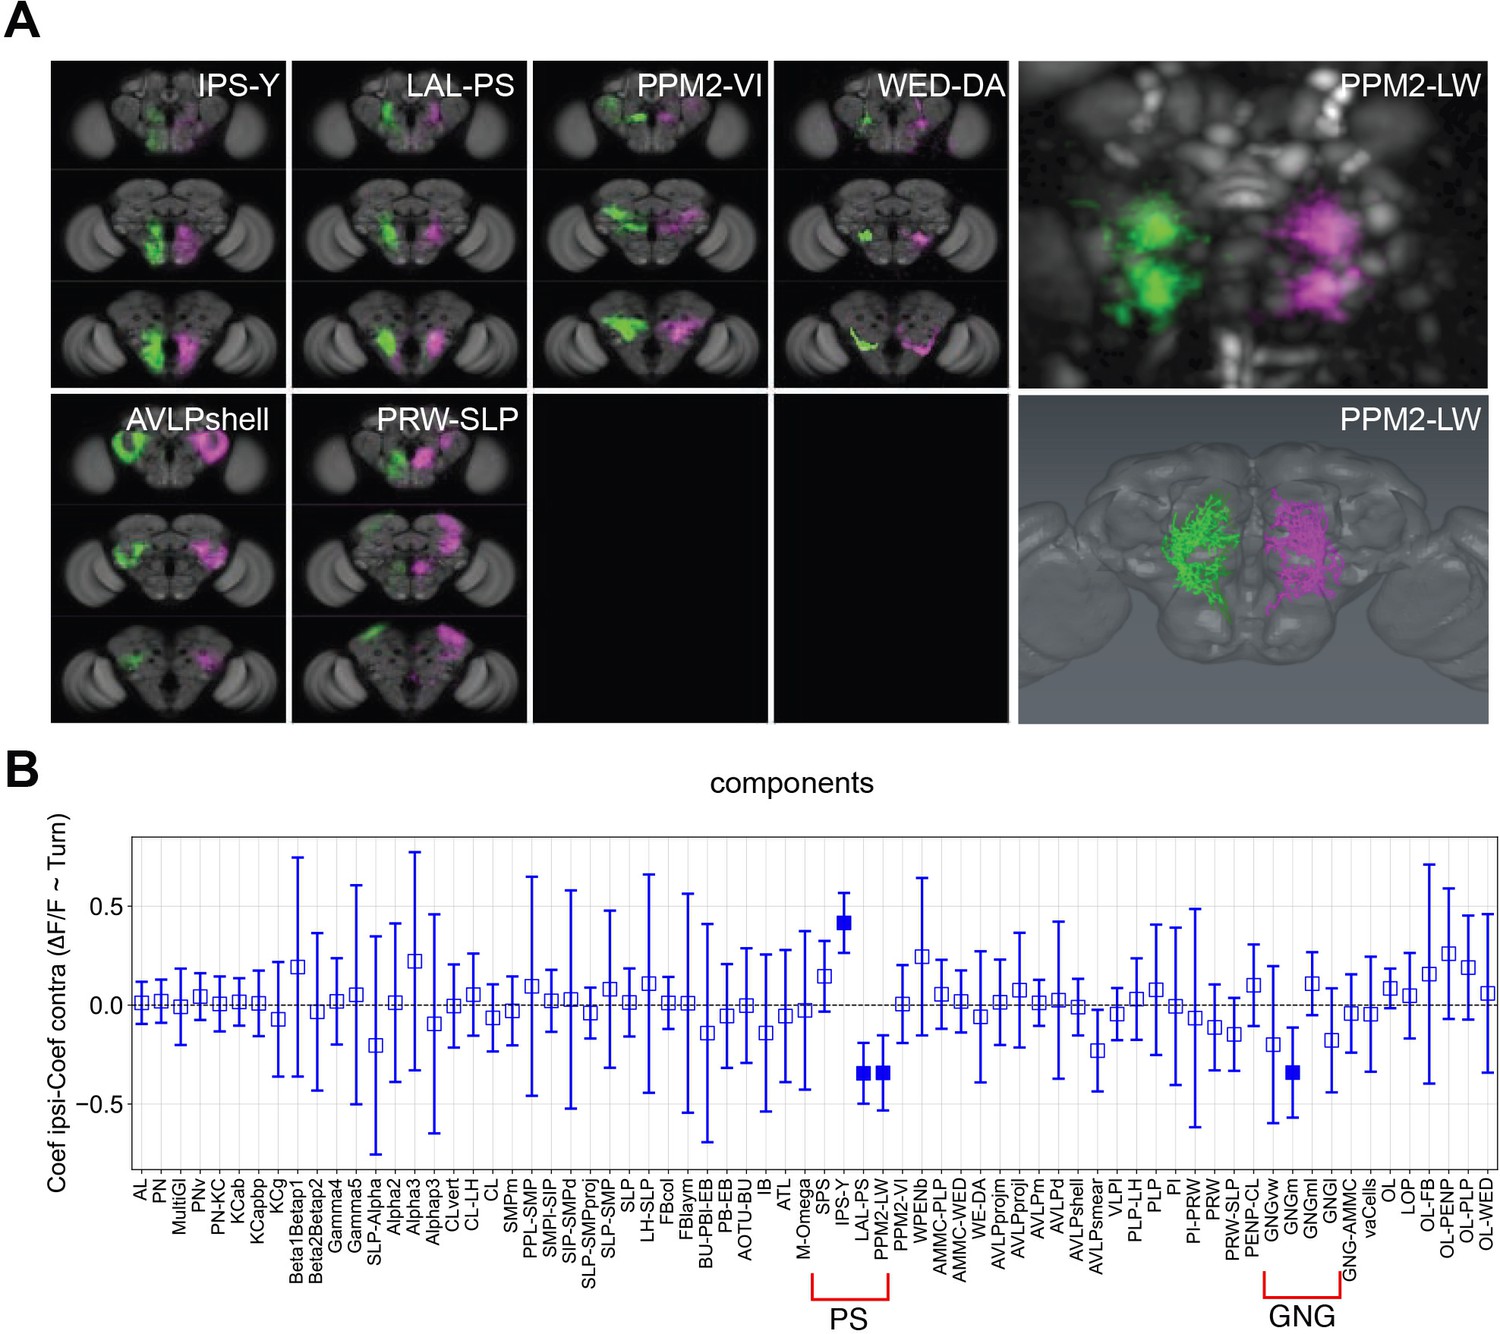
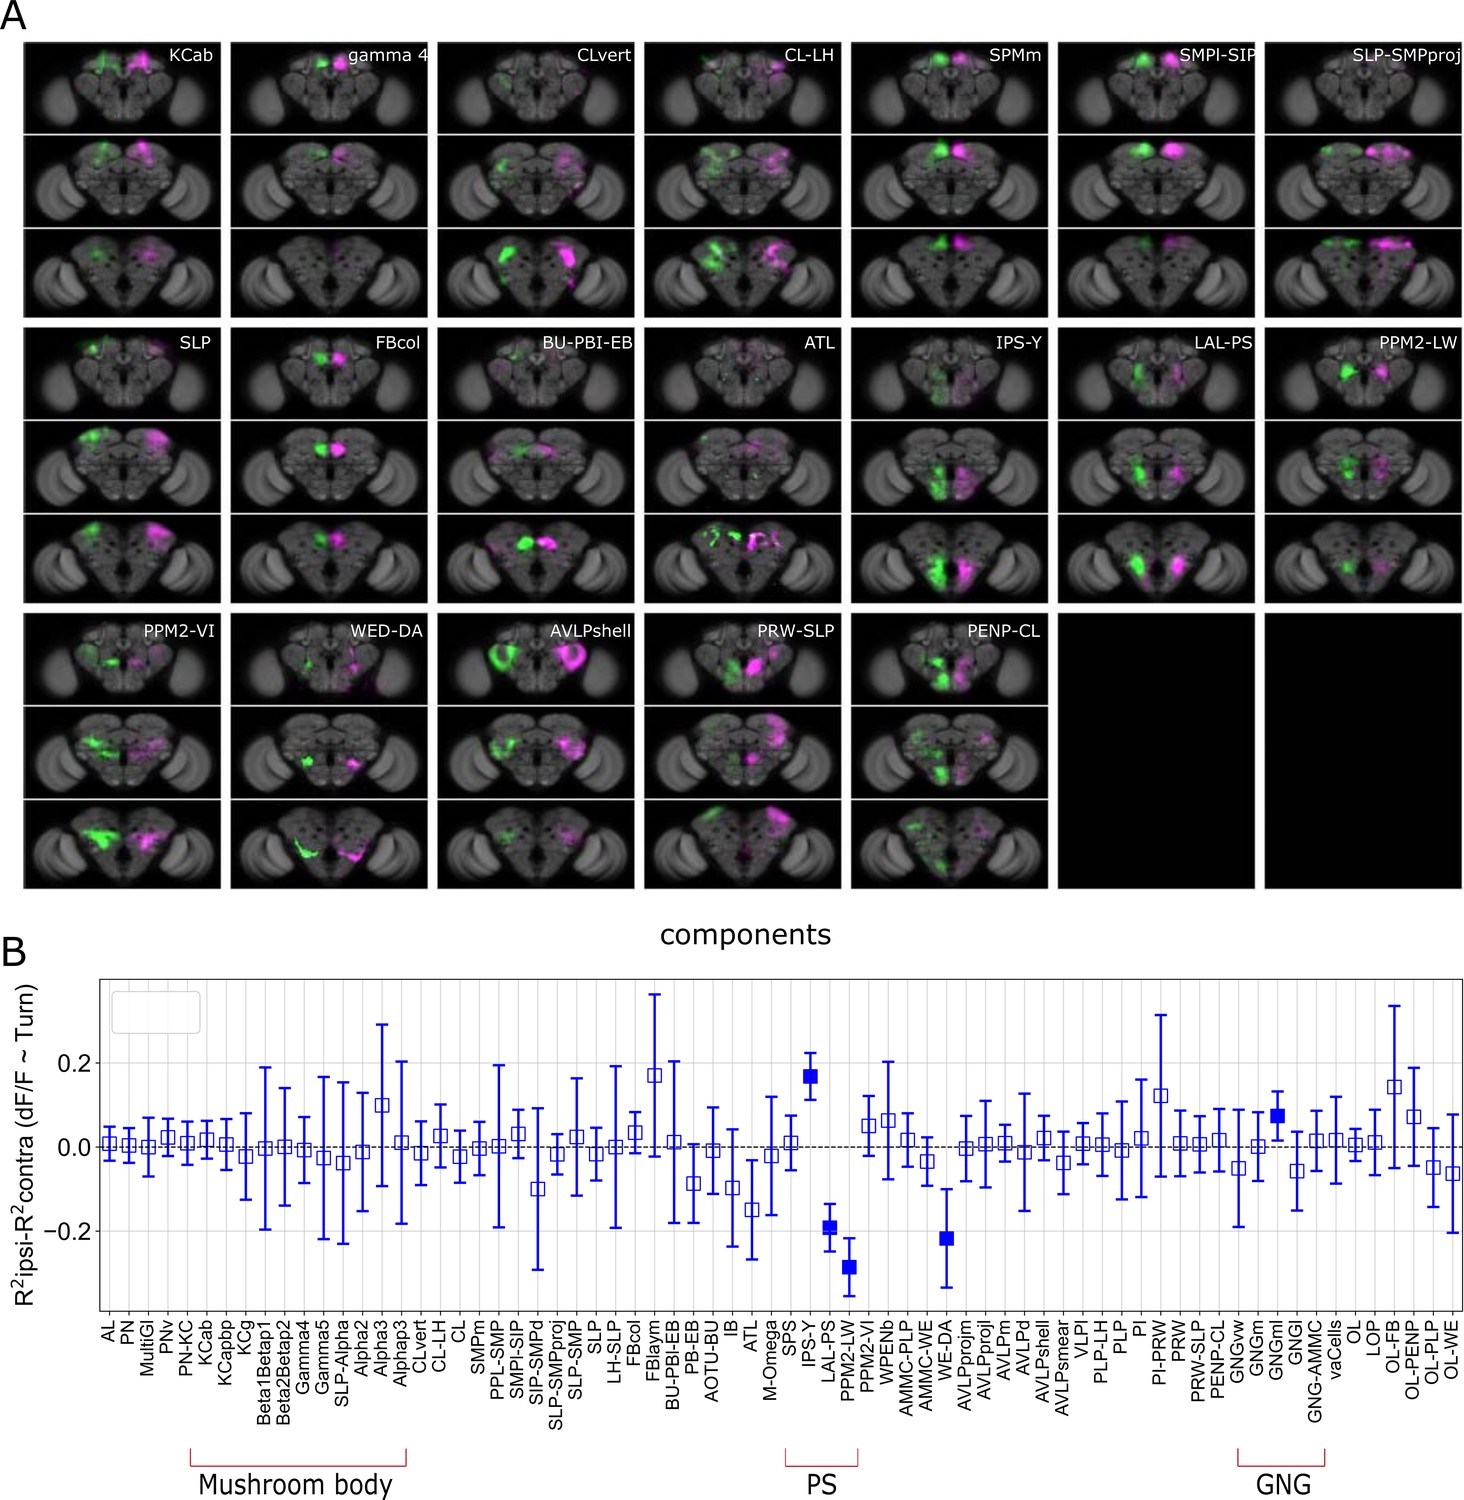
Turning activates specific components and candidate neurons.
(A) Examples of components present in both the left and right hemispheres labeled in different colors (magenta and green). Panels on the right present an example component that could be mapped to a single neuron. Upper right panel: Turning-correlated component, lower right panel: reconstruction of neuron that this functional component was mapped to. (B) Difference between the correlation coefficient (normalized ∆F/F) for turning on the ipsilateral side and the coefficient on the contralateral side is displayed as a function of the identified components. Positive and negative correlations correspond to components being active more during turn on the ipsilateral side than the contralateral side and the reverse, respectively. See Table 2 for definition of acronyms. N = 58 flies of different genotypes, see table in methods for details. Empty markers correspond to adjusted (Benjamini–Hochberg correction) p-value >0.05 for comparison to 0. Bars are 95% CI.
Figure 5—figure supplement 1
Turning activates specific components and candidate neurons.
(A) Examples of components present in both the left and right hemispheres labeled in different colors (magenta and green). (B) R2 of regression coefficients during turn for all genotypes. The value for the contralateral side was subtracted from the ipsilateral side and plotted for every component. N = 58 flies of different genotypes, see table in methods for details. Empty markers correspond to adjusted (Benjamini–Hochberg correction) p-value >0.05 for comparison to 0. Bars are 95% CI.
Figure 6 with 2 supplements
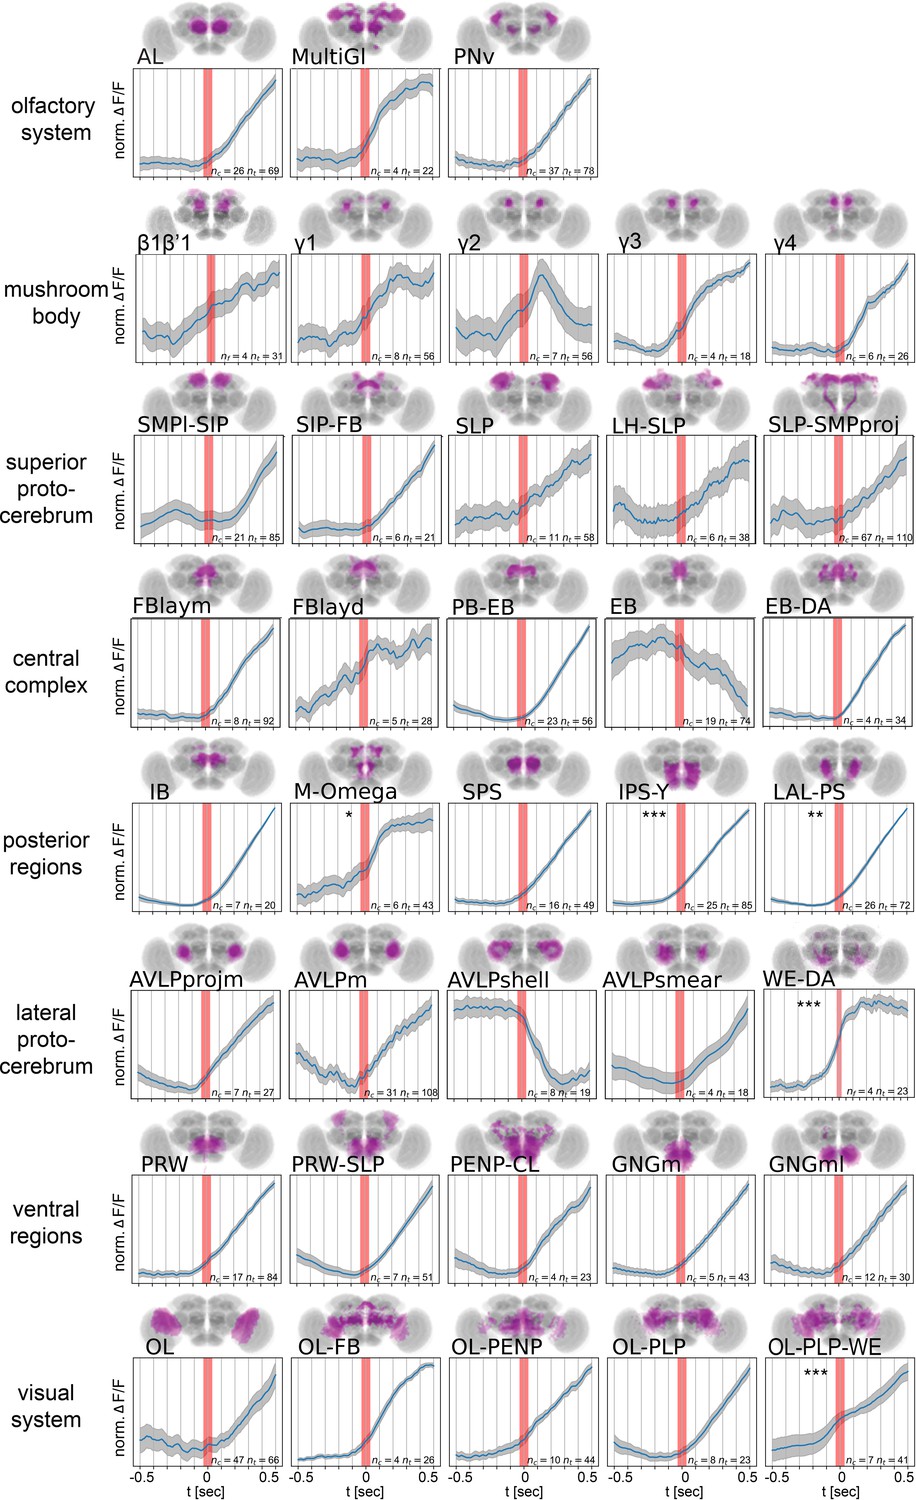
Onset dynamics of activity in multiple functional components across the brain at start of walk.
Walk-onset triggered average activity for pan-neuronal data in individual active components at 30 Hz or higher temporal resolution. Trials were normalized individually before averaging (see Figure 6—figure supplement 1 for non-normalized traces and all recording frame rates). Red band indicates walk onset. Note that while most components are activated after walk onset, several components show activity before start of walk. Stars correspond to an above zero significance for integrated traces from −0.5 s to start of walk (Wilcoxon one-sided test). Multiple comparison adjusted p-values (Benjamini–Hochberg): *p < 0.05, **p < 0.01, ***p < 0.001. See Table 2 for definition of acronyms. N = 30 flies of different genotypes, see table in methods for details.
Figure 6—figure supplement 1
Graphs show onset of walk trials for all flies and all transgenic lines at all recording speeds.
The gray band represents the uncertainty of walk-onset time due to lower temporal resolution in some recordings. A corrective factor based on regression coefficient with walk (fluorescence response to walk = coeff × UAS-GCaMP version: GCaMP7f: 0.6, GCaMP6f: 1, GCaMP6M: 1.1, GCaMP7s: 1.2, GCaMP6s: 1.4) was applied for direct comparison between experiments with different reporter versions. The average value for the first 50 ms was taken as baseline and subtracted. Gray shaded area represents walk onset.
Figure 6—figure supplement 2
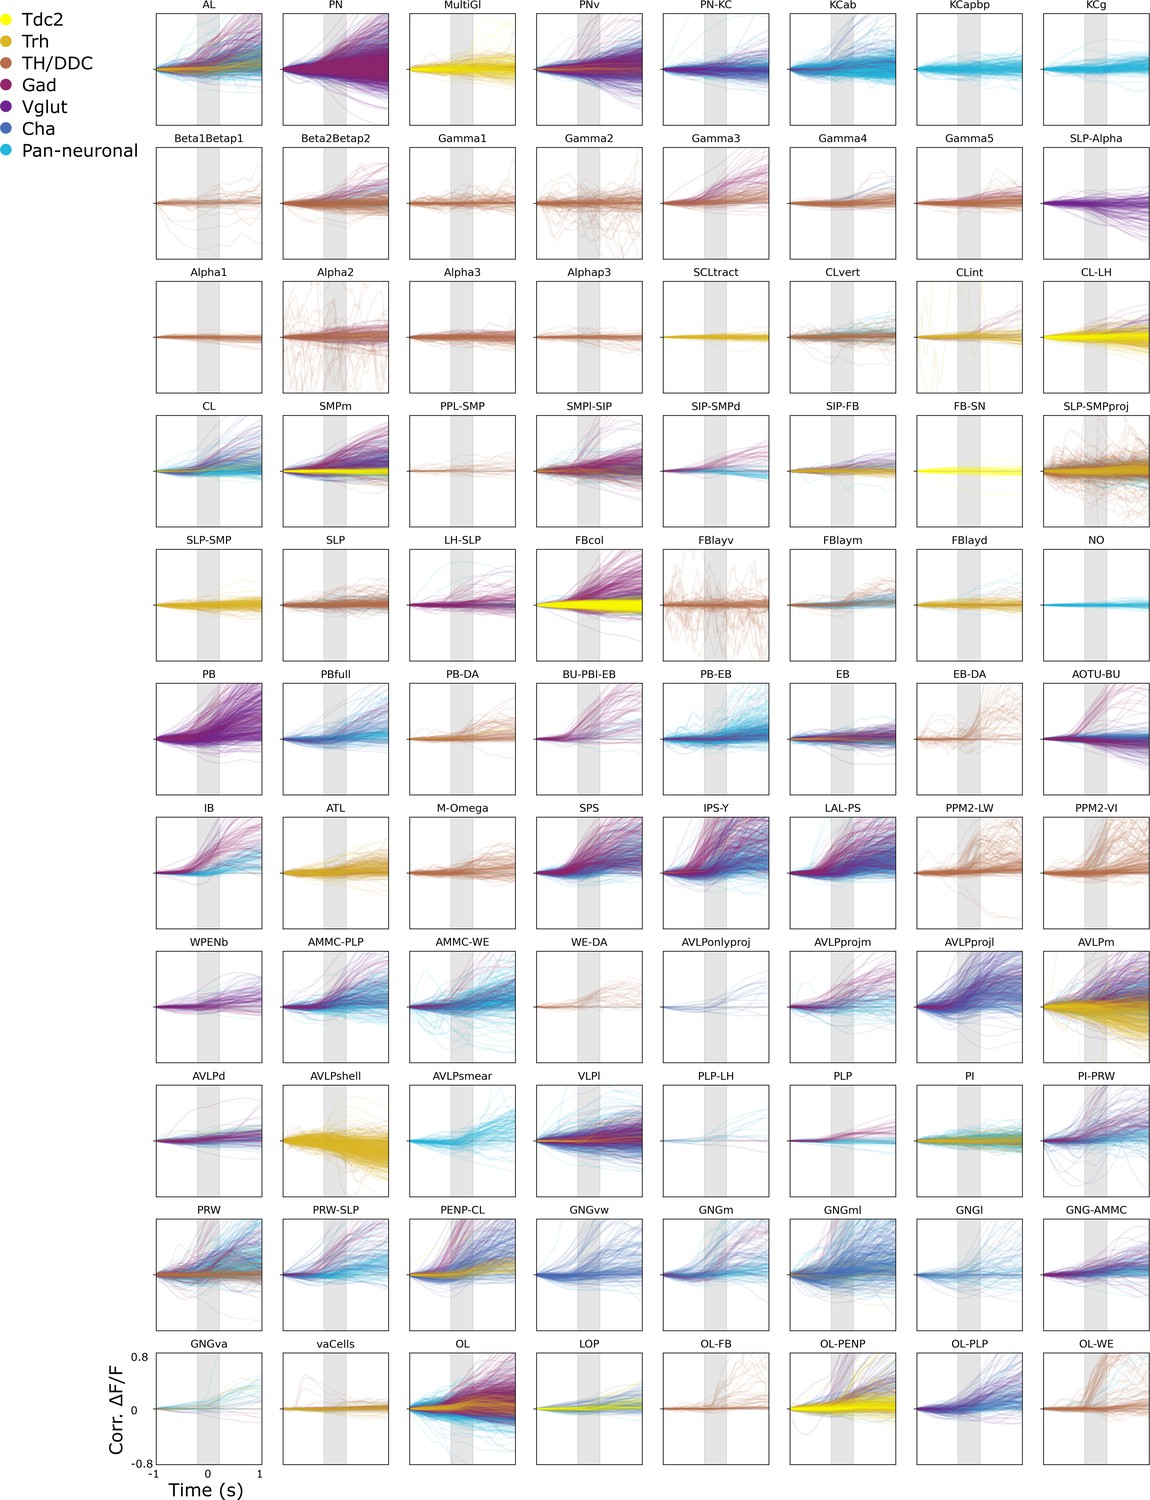
Normalized trials ∆F/F GCaMP fluorescence in brain regions 1 s before to 1 s after walk onset for different anatomically defined brain regions: (A) dopaminergic neurons (TH/DDC-Gal4;UAS-GCaMP), (B) octopaminergic neurons (Tdc2-Gal4;UAS-GCaMP), and (C) serotonergic neurons (Trh-Gal4;UAS-GCaMP).
Gray shading corresponds to the standard deviation. Red band is the onset of walk.
Figure 7 with 1 supplement
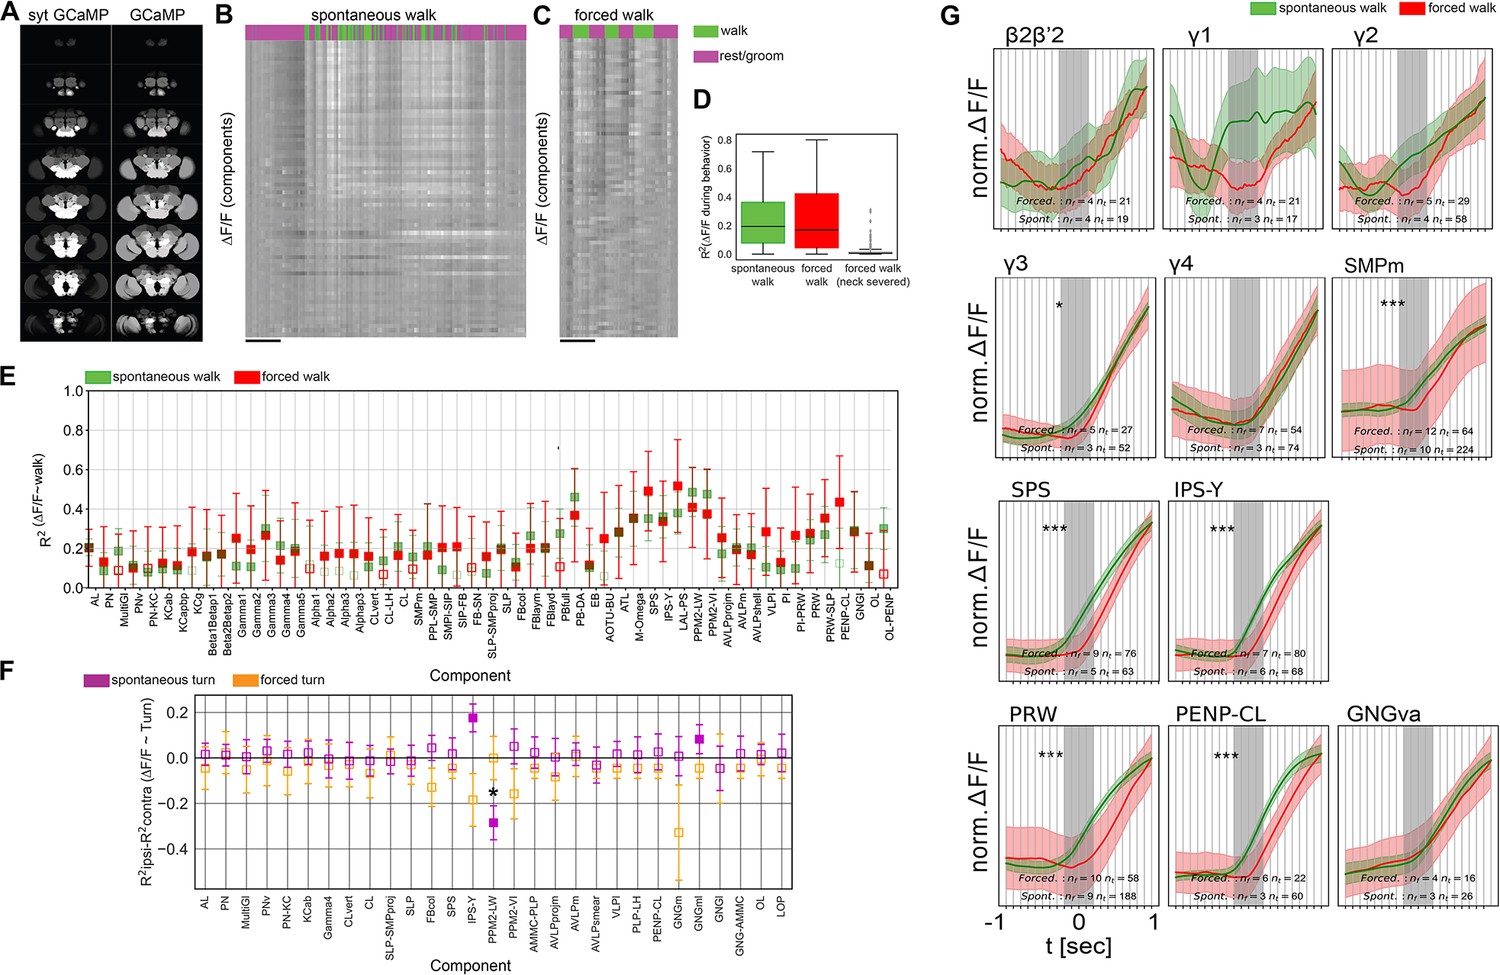
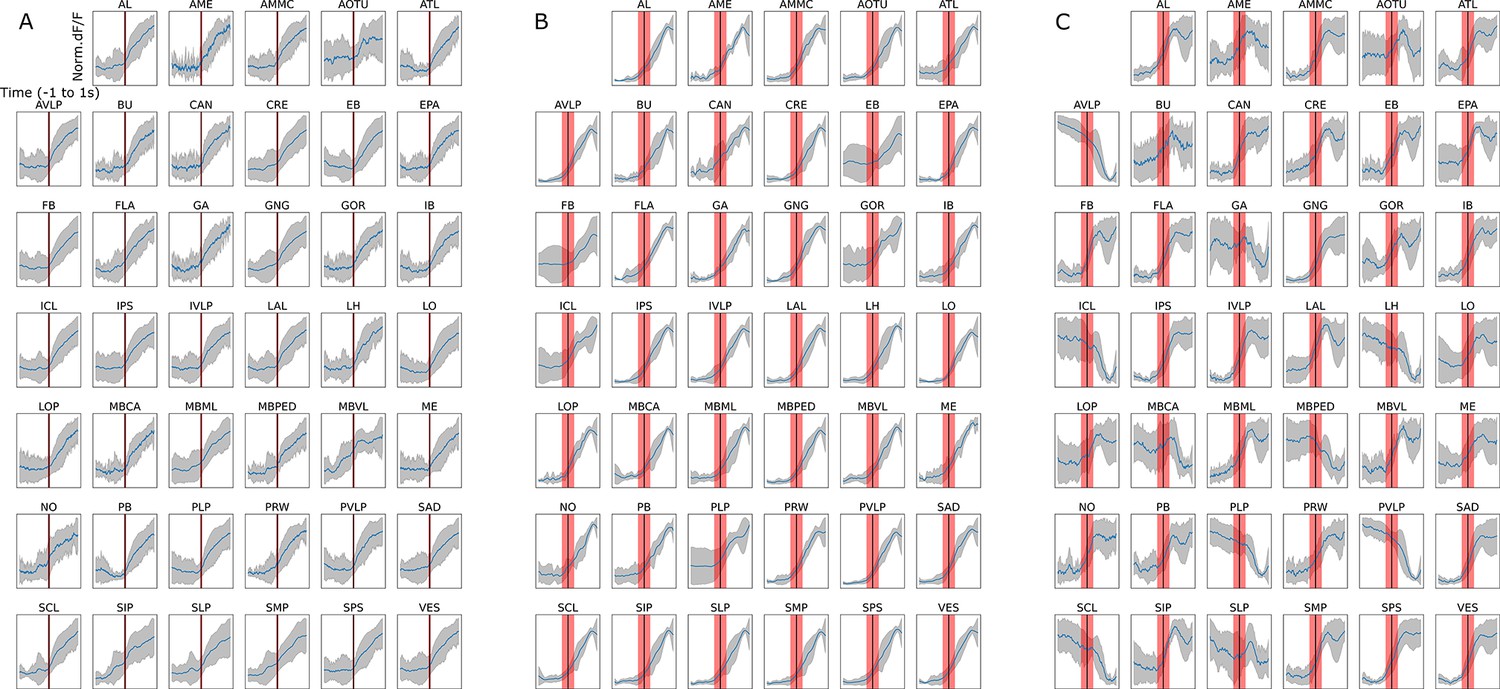
Forced and spontaneous walk elicit highly similar global brain activity.
(A) Z-stacks of map of brain regions activated by walk in flies expressing cytosolic GCaMP (pan-Gal4;UAS-GCaMP6m) or synaptically tagged GCaMP (pan-Gal4;UAS-sytGCaMP6m) (R2 of ). (B) Time series of components during spontaneous walk (green) or rest (magenta). Box plots show: center line, median; box limits, upper and lower quartiles; whiskers, ×1.5 interquartile range; points, outliers. (C) Time series of active components during forced walk (green) or forced rest (magenta). (D) R2 for behavior regression at different conditions (all regions were pooled, spontaneous, forced, forced with severed connection between ventral nerve cord (VNC) and brain). (E) R2 for behavior regression for different active components for forced (red) vs. spontaneous (green) walk. Empty markers correspond to adjusted (Benjamini–Hochberg correction) p-value >0.05 for comparison to 0. Bars are 95% CI. (F) R2 difference between brain region activity during forced turn on the ipsilateral side and forced turn on the contralateral side (orange). Forced turning speeds ranged from 0.3 to 2 rad/s. Only data with N ≥ 4 components were analyzed. Lilac shows the difference for spontaneous turns. N = 58 flies for spontaneous walk/turn of different genotypes and N = 26 flies for forced walk/turn, see table in methods for details. Empty markers correspond to adjusted (Benjamini–Hochberg correction) p-value >0.05 for comparison to 0. Star corresponds to a significant difference between spontaneous and forced turns: Mann–Whitney U-test adjusted p-value <0.05 (Benjamini–Hochberg correction). Box plots show: center line, median; box limits, upper and lower quartiles; whiskers, ×1.5 interquartile range; points, outliers. Bars are 95% CI. (G) Comparison between activity at walk onset for spontaneous (green) and forced (red) walk for additional components. Individual trials were normalized and averaged for each component. Shaded regions represent the trial SEM (standard error of the mean), nf: number of flies, nt: total number of trials. Gray shaded area indicate walk onset. Stars show the significance of difference in the integral between −0.5 s and the start of walk, and is corrected for multiple comparison (Benjamini–Hochberg): *p < 0.05, ***p < 0.001.
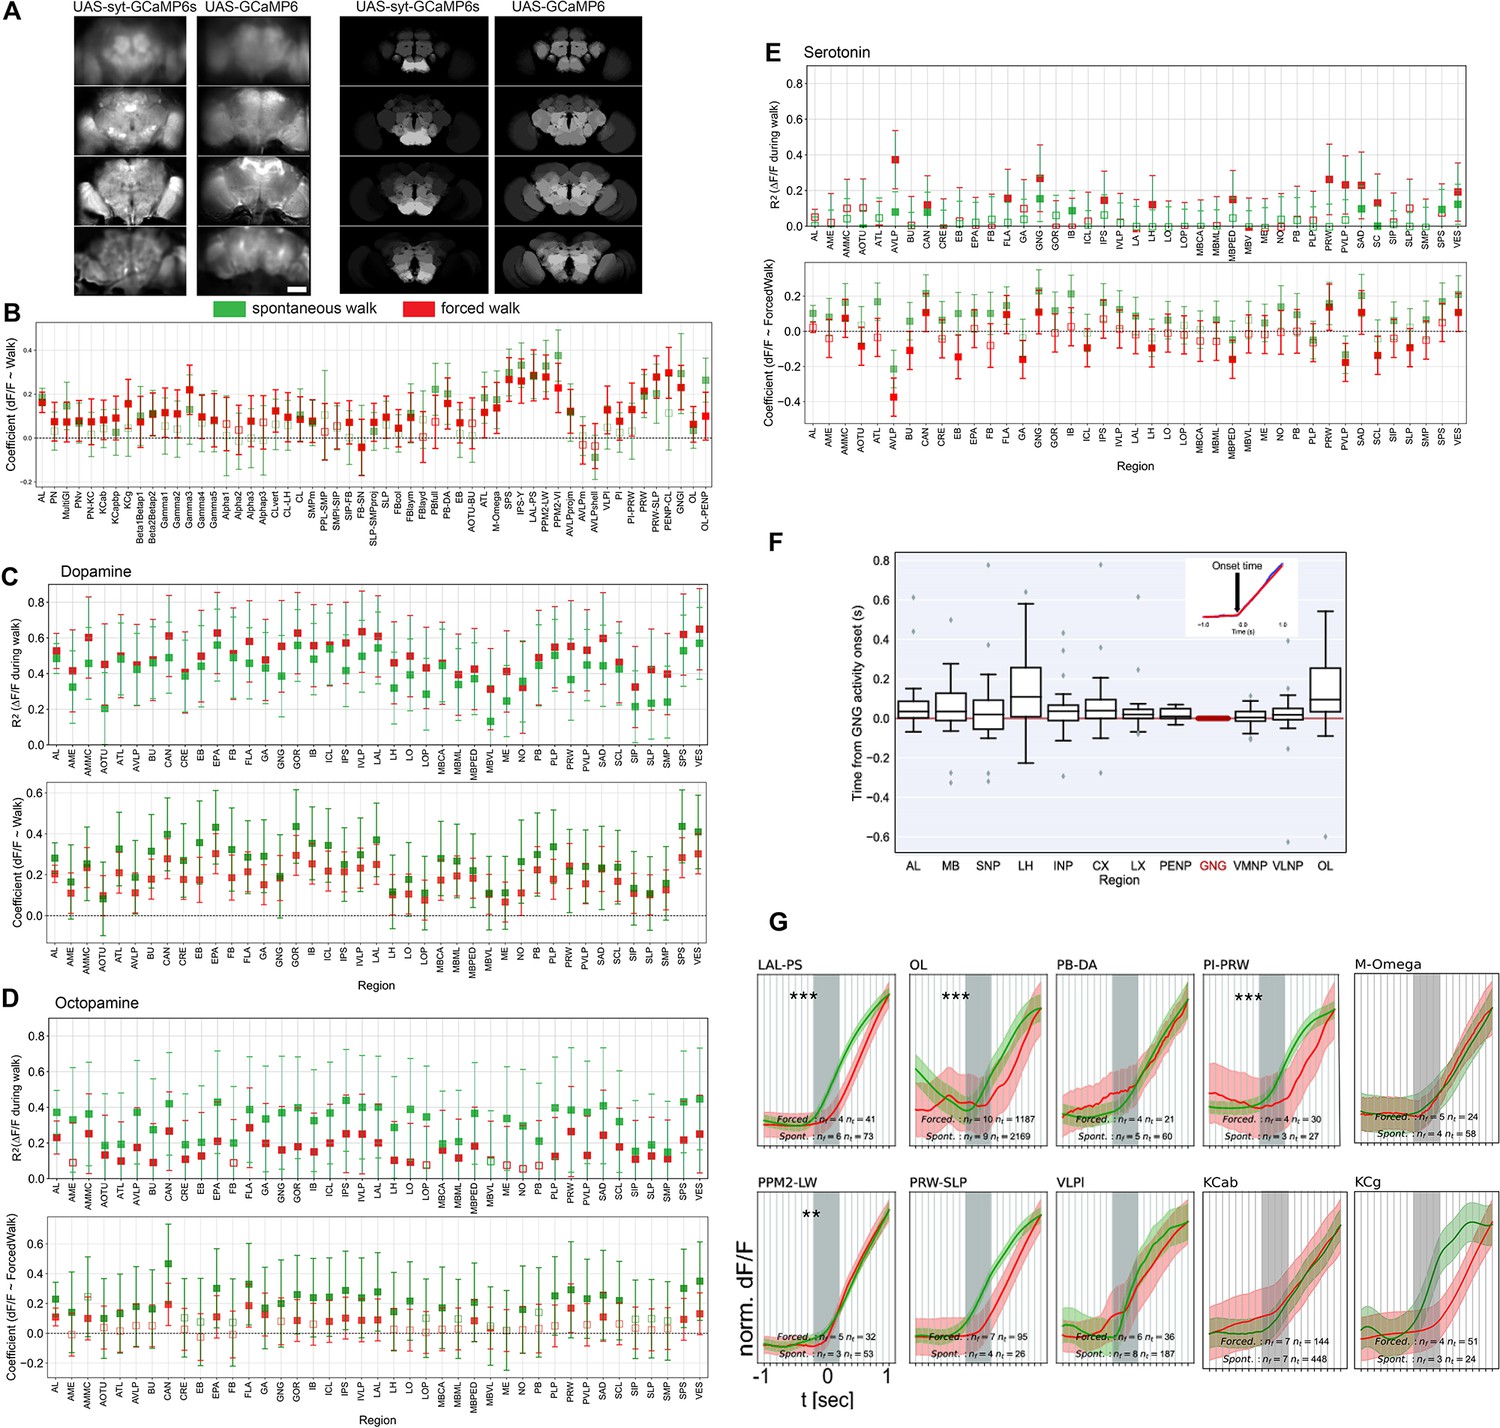
Figure 7—figure supplement 1
Additional evidence for most activity being induced by walk.
(A) Comparison of activity during walk for cytosolic and synaptically tagged GCaMP. Left: expression patterns (baseline fluorescence), Right: Coefficient in linear models of regional activity as a function of walk. (B) Regression coefficients with forced or spontaneous walk for components. Bar is 60 µm. (C) R2 and coefficient for ∆F/F regression with forced and spontaneous walk for different brain regions for dopaminergic neurons. (D) R2 and coefficient for ∆F/F regression with forced and spontaneous walk for different brain regions for octopaminergic neurons. (E) R2 and coefficient for ∆F/F regression with forced and spontaneous walk for different brain regions for serotonergic neurons. TH/DDC-Gal4: spontaneous, N = 9, forced, N = 5; Tdc2-Gal4: spontaneous, N = 7, forced, N = 6; Trh-Gal4: spontaneous, N = 6, forced, N = 6 flies. (B-E): Empty markers correspond to adjusted (Benjamini–Hochberg correction) p-value >0.05 for comparison to 0. Bars are 95% CI. (F) Panel showing GCaMP-fluorescence relative to onset of walk for pan-neuronally expressed GCaMPs in different regions relative to the GNG. Piece-wise linear curves were fitted to fluorescence traces 0.5 s before to 0.5 s after the onset of walk. The onset time was determined as the point of change from one linear piece to the next. Note that all medians are positive. Inset: Fit of activity onset. TH/DDC-Gal4: N = 9, Tdc2-Gal4: N = 7, Trh-Gal4: N = 6 flies. (G) Comparison between activity at walk onset for spontaneous (green) and forced (red) walk for additional components. Individual trials were normalized and averaged for each component. Shaded regions represent the trial SEM, nf: number of flies, nt: total number of trials. Stars show the significance of difference in the integral between −500 ms to start of walk, and is corrected for multiple comparison (Benjamini–Hochberg): **p < 0.01, ***p < 0.01.
Videos
Video 1
Movie of pan-neuronal activation during walk and groom (accelerated).
Video 2
Movie of TH/DDC-neuronal activation during walk (accelerated).
Video 3
Movie of TDC2-neuronal activation during walk (accelerated).
Video 4
Movie of Trh-neuronal activation during walk (accelerated).
Video 5
Video sequence showing activation of the PPM2-LW neurons during turning.
Video 6
Video showing neuronal activation moving from ventral to dorsal brain areas.
Note that a clear progression of activation was observed only in a fraction of trials.
Video 7
Video showing whole brain activity of a fly being forced to walk on a rotating rod.
Video 8
Video showing whole brain activity of a fly with a severed connection between the brain and ventral nerve cord (VNC) being forced to walk on a treadmill.
Note that the fly is still capable of walking on the rod when being forced. We did not, however, observe spontaneous walking activity.
Tables
Table 1
Summary statistics of R2 dependence on different factors where R2 is obtained from regressing a single regionally averaged brain activity with a single behavior.
| sum_sq | PR(>F) | |
|---|---|---|
| GAL4 | 0.002197 | 7.58E−01 |
| Behavior | 12.215185 | 1.64E−106 |
| RegionNames | 10.372902 | 4.13E−65 |
| UAS | 2.083138 | 2.13E−18 |
| Behavior:RegionNames | 1.45213 | 9.17E−01 |
| Residual | 67.904784 | NaN |
Table 2
List of components with potential underlying candidate neurons.
Most matches are speculative except those in bold that correspond to high confidence matches due to the lack of other Gal4-positive neurons in the region.
| Short name | Description | Examples of matching (Flycircuit) neurons | Present in Gal4 line (detected in ≥5 flies) |
|---|---|---|---|
| Antennal lobe and mushroom body | |||
| AL | Whole antennal lobe | Gad1-F-000394; Gad1-F-100601; Gad1-F-800129; VGlut-F-900126 | Nsyb, GMR57C10, Vglut, Gad |
| PN | Antennal lobe projection neuron | VGlut-F-500486 | Nsyb, GMR57C10, Cha, Vglut, Gad |
| MultiGl | Whole antennal lobe and PN-like projections | Trh-F-600017 | TH, Trh, TDC |
| PNv | Antennal lobe projection neuron, ventral tract of the lateral horn | VFB_00101133 | Nsyb, GMR57C10, Cha, Vglut, Gad |
| PN-KC | Antennal lobe projection neuron and kenyon cell in the same component | Nsyb, GMR57C10, Cha, Vglut | |
| KCab | Alpha-Beta Kenyon cell | Cha-F-300226; Cha-F-100049; fru-F-000026; Vglut-F-100284; Gad1-F-100014; | Nsyb, GMR57C10 |
| KCapbp | Alpha’-Beta’; Kenyon cell | Gad1-F-100024; Trh-F-200069; | Nsyb, GMR57C10 |
| KCg | Gamma kenyon cells | fru-F-000006; Vglut-F-100359; Gad1-F-100021; | Nsyb, GMR57C10 |
| Beta1Betap1 | Beta1 and/or Beta’1 mushroom body compartment | PAM10(B1)_L (FlyEM-HB:1328522741) [VFB_jrchk385] | TH |
| Beta2Betap2 | Beta2 and/or Beta’2 mushroom body compartment | PAM02(B’2a)_L (FlyEM-HB:1295566429) | Nsyb, Gad, TH |
| Gamma1 | Gamma1 mushroom body compartment | PPL1-gamma1-pedc | TH |
| Gamma2 | Gamma2 mushroom body compartment | PPL1-gamma2-alpha’1 | TH |
| Gamma3 | Gamma3 mushroom body compartment | MBON-γ3, PAM-γ3 | Gad, TH |
| Gamma4 | Gamma4 mushroom body compartment | PAM-γ4 | TH |
| Gamma5 | Gamma5 mushroom body compartment | PAM-γ5 | TH |
| SLP-Alpha | Alpha or Alpha’ lobe with projection through the superior lateral neuropil | VGlut-F-500002 | Vglut |
| Alpha1 | Alpha1 mushroom body compartment | PAM-alpha1 | TH |
| Alpha2 | Alpha2 mushroom body compartment | PPL1-alpha’2alpha2 | TH |
| Alpha3 | Alpha3 mushroom body compartment | PPL1-alpha3 | TH |
| Alphap3 | Alpha’3 mushroom body compartment | PPL1-alpha’3 | TH |
| Superior neuropil | |||
| SCLtract | Tract linking both superior clamp | Trh-F-200082,Trh-F-100051 | Trh |
| CLvert | Lateral part of the superior clamp | TH-F-000023 | Nsyb, TH |
| CL? | Interrogation point surrounding the pedonculus, | Trh-F-300074,Trh-M-700081, DNp32 | TH, Trh |
| CL-LH | Surrounds the lateral horn from the medial and ventral directions | Trh-F-200047 | Trh, TDC |
| CL | Other shapes at the level of the clamp | Gad1-F-700550,Gad1-F-800055 | Nsyb, GMR57C10, Gad, TH, TDC |
| SMPm | Medial part of the superior medial protocerebrum | TH-F-000021; VGlut-F-700286, Cha-F-300251 | Nsyb, GMR57C10, Cha, Vglut, Gad, TH, TDC |
| PPL-SMP | Ventral lateral part of the superior medial protocerebrum, with tracts coming from a posterior lateral cell cluster | TH-F-000019,TH-F-000018,TH-F-000046 | TH |
| SMPl-SIP | Superior intermediate protocerebrum and lateral part of the superior medial protocerebrum | Cha-F-000221,Cha-F-300154, TH-F-300056 | Nsyb, GMR57C10, Cha, Gad, TH, TDC |
| SIP-SMPd | Superior intermediate protocerebrum and dorsal part of the superior medial protocerebrum | fru-F-800063 | Nsyb |
| SIP-FB | Superior intermediate protocerebrum and dorsal layer of the fan-shaped body | Trh-F-100015 | Nsyb, GMR57C10, TH, Trh |
| FB-SN | Broad innervaion of the superior neuropil, and fan-shaped body | OA-VMP3, OA-VPM4 | TDC |
| SLP-SMPproj | Large SMP neuron projecting to ventral regions | Trh-F-700011,Trh-F-000083 | Nsyb, GMR57C10, TH, Trh |
| SLP-SMP | Superior lateral protocerebrum and superior medial protocerebrum | Trh-F-500176, DNp25 | Trh |
| SLP | Superior lateral protocerebrum only | TH-F-100046 | Nsyb, GMR57C10, TH, TDC |
| LH-SLP | Lateral horn and superior lateral protocerebrum | Gad1-F-900346,Gad1-F-600340 | Nsyb, Gad |
| Central complex | |||
| FBcol | Fan-shaped body columns | Tdc2-F-100009; Tdc2-F-300026; Tdc2-F-300001; Tdc2-F-200011; Tdc2-F-100062; Tdc2-F-100016; Gad1-F-900245; Gad1-F-800329; Gad1-F-500513; Gad1-100157 | Nsyb, GMR57C10, Vglut, Gad, TDC |
| FBlayv | Ventral layer of the fan-shaped body | TH-M-300065 | Nsyb, TH |
| FBlaym | Medial layer of the fan-shaped body | TH-F-200055 | Nsyb, TH |
| FBlayd | Dorsal layer of the fan-shaped body | TH-F-200054; Trh-F-300036; Trh-F-400062 | Nsyb, TH, Trh |
| NO | Nodulus or noduli | Cha-F-100429 | Nsyb |
| PB | Protocerebral bridge only | Vglut-F-800282; Vglut-F-600784; Vglut-F-600229; Gad1-F-600267; Gad1-F-100361; Gad1-F-100593; Vglut-F-000156; Vglut-F-100064 | Nsyb, Vglut, Gad |
| PBfull | Components with full protocerebral bridge | Cha-F-900016, Cha-F-200148 | Nsyb, GMR57C10, Cha |
| PB-DA | Protocerebral bridge and two dots (maybe cell bodies) at the top of the trachea | TH-F-000048 | TH |
| BU-PBl-EB | Bulb, ellipsoid body and lateral part of the protocerebral bridge | Gad1-F-900445 | Nsyb, Gad |
| PB-EB | EB-radial and PB glomeruli | Cha-F-500009 | Nsyb, GMR57C10, Cha, Gad |
| EB | Ellipsoid body rings | Trh-F-300095; Cha-F-800146 | Nsyb, GMR57C10, Cha, Vglut, Trh |
| EB-DA | Ellipsoid body and lateral accessory lobe | TH-F-100001 | TH |
| AOTU-BU | Anterior optic tubercule and bulb | Gad1-F-200712, VGlut-F-400630 | Nsyb, GMR57C10, Cha, Vglut, Gad |
| Posterior neuropil | |||
| IB | Inferior bridge | Nsyb, Gad | |
| ATL | Antler | Adult antler neuron 031 | TH, Trh |
| M-Omega | Posterior ensemble forming an M dorsally and an omega ventrally | TH-F-300078 | TH |
| SPS | Superior posterior slope | VGlut-F-900089, VGlut-F-800136,Cha-F-800003,Gad1-F-900039 | Nsyb, GMR57C10, Cha, Vglut, Gad |
| IPS-Y | Inverse Y shape in the posterior slope | DNb02? | Nsyb, GMR57C10, Cha, Vglut, Gad |
| LAL-PS | Lateral accessory lobe and posterior slope | DNb01? | Nsyb, GMR57C10, Cha, Vglut, Gad |
| PPM2-LW | PPM2-LAL-We L,R | TH-F-000000,TH-F-000015,TH-F-000016 | TH |
| PPM2-VI | PPM2-VMNP-INP L,R | TH-F-000007,TH-F-300058 | TH |
| Lateral neuropil | |||
| WPENb | Antennal mechanosensory and motor center and/or Wedge, in the posterior lateral protocerebrum and posterior connection to opposite side | VGlut-F-200005,WPNb, WPNB3#5 (FAFB:4271367) [VFB_001011lp] | Vglut, Gad |
| AMMC-PLP | Antennal mechanosensory and motor center and/or Wedge and branch in the posterior lateral protocerebrum | VGlut-F-400269 | Nsyb, Cha, Vglut, Gad |
| AMMC-WE | Antennal mechanosensory and motor center and/or Wedge | VGlut-F-000138, VGlut-F-400586 | Nsyb, GMR57C10, Vglut, Gad |
| WE-DA | Wedge with two branches forming a large V | TH-F-200127,TH-F-000024 | TH |
| AVLPonlyproj | Lowest medial part of the anterior ventral lateral protocerebrum projecting ventrally | Cha-F-700097 | |
| AVLPprojm | Lowest medial part of the anterior ventral lateral protocerebrum projecting ventrally | Gad1-F-500762, Cha-F-400059; Gad1-F-000013 | Nsyb, GMR57C10, Gad |
| AVLPprojl | Lowest lateral part of the anterior ventral lateral protocerebrum projecting ventrally | Cha-F-800125 | Cha |
| AVLPm | Anterior ventral lateral protocerebrum medial part | Gad1-F-900529, Cha-F-800062,Trh-F-400039,Trh-F-400070; Vglut-F-200405*; Vglut-F-900122; Cha-F-400237; Cha-F-200299; Gad1-F-500279 | Nsyb, GMR57C10, Vglut, Gad, TH, Trh, TDC |
| AVLPd | Anterior ventral lateral protocerebrum dorsal part | Cha-F-000424 | Nsyb |
| AVLPshell | Anterior ventral lateral protocerebrum surface | Trh-F-100082 | TH, Trh |
| AVLPsmear | Anterior ventral lateral protocerebrum anterior part | Nsyb | |
| VLPl | Ventro-lateral protocerebrum most lateral part | Gad1-F-900096, Vglut-F-500616,Cha-F-800087 | Nsyb, GMR57C10, Cha, Vglut, Gad |
| PLP-LH | Posterior lateral protocerebrum to the basis of the lateral horn | Gad1-F-500325 | Nsyb |
| PLP | Posterior lateral protocerebrum | Gad1-F-800092 | Nsyb, Gad |
| Ventral neuropil | |||
| PI | Pars intercerebralis | Trh-F-100040, Trh-M-000056 | Nsyb, GMR57C10, TH, Trh |
| PI-PRW | Pars intercerebralis connected to Prow | VGlut-F-600158 | Nsyb, GMR57C10, Gad |
| PRW | Prow | TH-M-000037 | Nsyb, GMR57C10, Vglut, Gad, TH |
| PRW-SLP | Prow and superior lateral protocerebrum | Gad1-F-600213, Cha-F-200258; fru-F-000133; Gad1-F-600213; Trh-F-100091 | Nsyb, GMR57C10 |
| PENP-CL | Periesophageal neuropils and clamp | mALD3_L (FlyEM-HB:822708945) | Nsyb, GMR57C10, Cha, Gad |
| GNGvw | Gnathal ganglia medial and lateral | Cha-F-400186 | Cha |
| GNGm | Gnathal ganglia medial | Cha-F-300235 | Nsyb, GMR57C10 |
| GNGml | Gnathal ganglia medial–lateral | Cha-F-400159 | Nsyb, GMR57C10, Cha, Gad |
| GNGl | Gnathal ganglia lateral | Cha-F-400146 | Nsyb, Cha |
| GNG-AMMC | Gnathal ganglia and on the opposite side antennal mechanosensory and motor center and posterior lateral protocebrum | VGlut-F-600685 | Nsyb, Vglut |
| GNGva | Ventral anterior part of the gnathal ganglia | Nsyb | |
| vaCells | Ventral anterior cells | TH-F-100049 | TH, Trh |
| Optic lobe | |||
| OL | Optic lobe; mostly medulla and lobulla | Nsyb, GMR57C10, Cha, Vglut, Gad | |
| LOP | Lobulla plate | Cha-F-600161 | Cha, TDC |
| OL-FB | Optic lobe to central regions including the fan-shaped body | TH | |
| OL-PENP | Optic lobe and periesophageal neuropils | Tdc2-F-200056 | Nsyb, Gad, Trh, TDC |
| OL-PLP | Optic lobe and posterior lateral protocerebrum | Cha-F-000316 | Nsyb, Cha, Gad |
| OL-WE | Optic lobe and wedge | TH-F-300030 | TH |
Key resources table
| Reagent type (species) or resource | Designation | Source or reference | Identifiers | Additional information |
|---|---|---|---|---|
| Genetic reagent (D. melanogaster) | UAS-GCaMP6s | Bloomington Drosophila Stock Center | BDSC_42749 | |
| Genetic reagent (D. melanogaster) | UAS-GCaMP6m | Bloomington Drosophila Stock Center | BDSC_42750 | |
| Genetic reagent (D. melanogaster) | UAS-GCaMP7s | Bloomington Drosophila Stock Center | BDSC_79032 | |
| Genetic reagent (D. melanogaster) | UAS-GCaMP6f | Bloomington Drosophila Stock Center | BDSC_42747 | |
| Genetic reagent (D. melanogaster) | UAS-GCaMP7f | Bloomington Drosophila Stock Center | BDSC_79031 | |
| Genetic reagent (D. melanogaster) | UAS-syt-GCaMP6s | Vanessa Ruta | N/A | |
| Genetic reagent (D. melanogaster) | GMR58E04-Gal4 | Bloomington Drosophila Stock Center | BDSC_41347 | |
| Genetic reagent (D. melanogaster) | TH-Gal4 | Bloomington Drosophila Stock Center | BDSC_8848 | |
| Genetic reagent (D. melanogaster) | Tdc2-Gal4 | Bloomington Drosophila Stock Center | BDSC_9313 | |
| Genetic reagent (D. melanogaster) | Trh-Gal4 | Bloomington Drosophila Stock Center | BDSC_38388 | |
| Genetic reagent (D. melanogaster) | Ddc-Gal4 | Bloomington Drosophila Stock Center | BDSC_7009 | |
| Genetic reagent (D. melanogaster) | TH, 58E02-Gal4 | Siju et al. | N/A | |
| Genetic reagent (D. melanogaster) | TH, DDC-Gal4 | This paper | N/A | |
| Genetic reagent (D. melanogaster) | Vglut-Gal4 | Bloomington Drosophila Stock Center | BDSC_24635 | |
| Genetic reagent (D. melanogaster) | Cha-Gal4 | Bloomington Drosophila Stock Center | BDSC_6798 | |
| Genetic reagent (D. melanogaster) | Nsyb-Gal4 | Bloomington Drosophila Stock Center | BDSC_51635 | |
| Genetic reagent (D. melanogaster) | GMR57C10-Gal4 | Bloomington Drosophila Stock Center | BDSC_39171 | |
| Genetic reagent (D. melanogaster) | Gad1-Gal4 | Bloomington Drosophila Stock Center | BDSC_51630 | |
| Software, algorithm | Python 3 | Python Software Foundation | https://www.python.org | |
| Software, algorithm | ImageJ/FIJI | Schindelin et al., 2012 | https://fiji.sc/ | |
| Software, algorithm | MATLAB | MATLAB | mathworks.com | |
| Software, algorithm | Analysis code | GitHub | https://github.com/sophie63/Aimon2022 |
Additional files
-
MDAR checklist
- https://cdn.elifesciences.org/articles/85202/elife-85202-mdarchecklist1-v2.docx
-
Supplementary file 1
Description of components and putative underlying neurons.
- https://cdn.elifesciences.org/articles/85202/elife-85202-supp1-v2.docx
Download links
A two-part list of links to download the article, or parts of the article, in various formats.
Downloads (link to download the article as PDF)
Open citations (links to open the citations from this article in various online reference manager services)
Cite this article (links to download the citations from this article in formats compatible with various reference manager tools)
Global change in brain state during spontaneous and forced walk in Drosophila is composed of combined activity patterns of different neuron classes
eLife 12:e85202.
https://doi.org/10.7554/eLife.85202


