RANK+TLR2+ myeloid subpopulation converts autoimmune to joint destruction in rheumatoid arthritis
- Department of Orthopaedic Surgery, Johns Hopkins University, United States
- Zhejiang Chinese Medical University, China
- Department of Biomedical Engineering, Johns Hopkins University, United States
- Division of Pediatric Endocrinology, Johns Hopkins University School of Medicine, United States
- Department of Pathology, Johns Hopkins Medical Institutions, United States
Figures
Figure 1 with 1 supplement
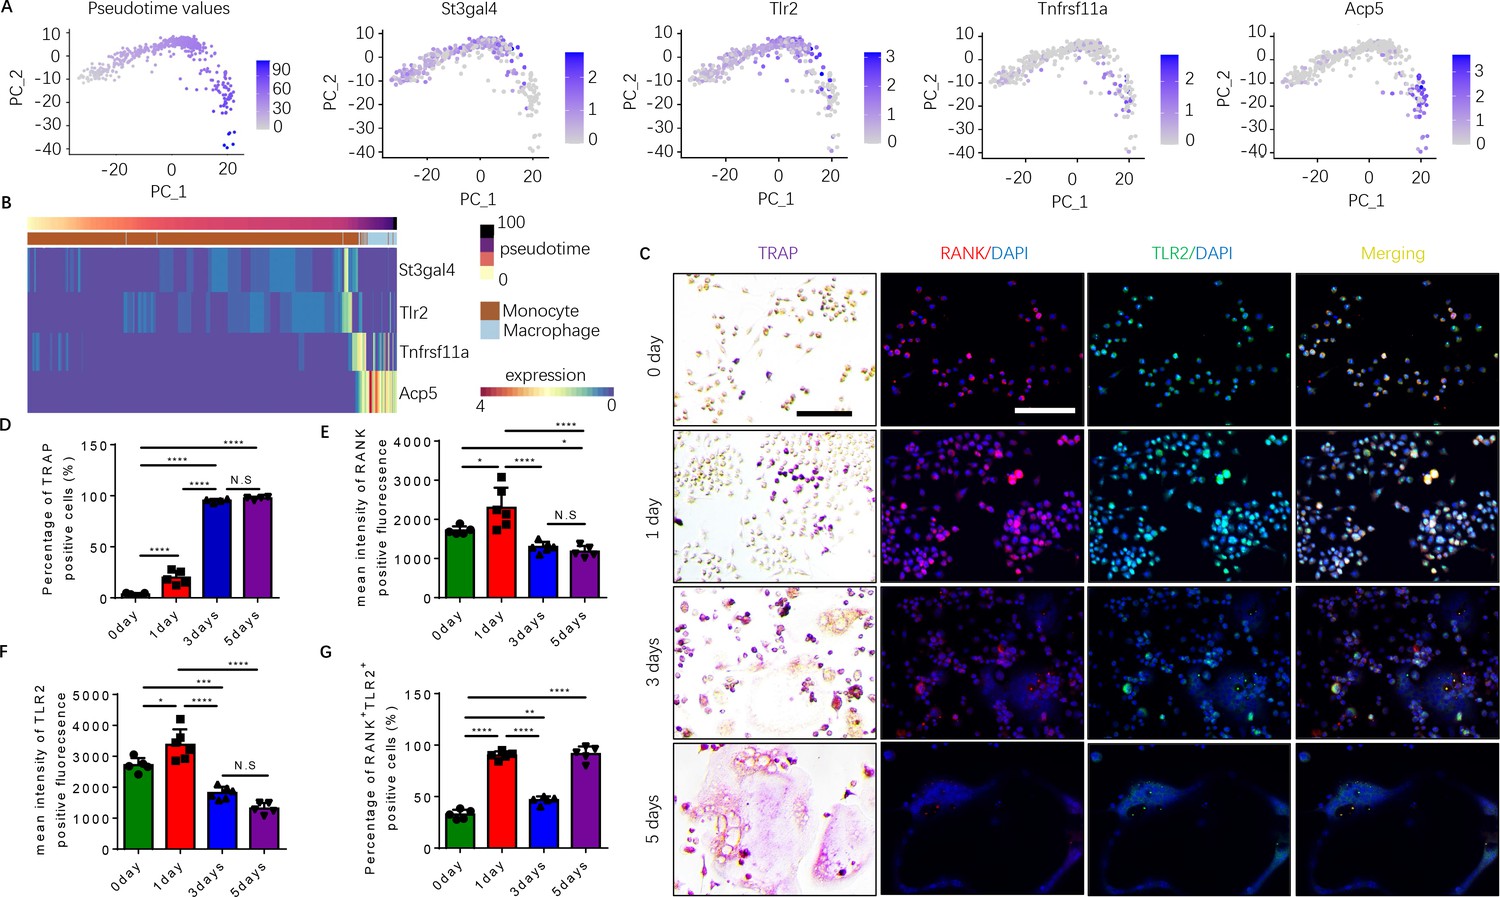
Expression of RANK (Tnfrsf11a), TLR2 (Tlr2), and tartrate-resistant acid phosphatase (TRAP) (Acp5) is elevated during the commitment of monocytes to a tartrate-resistant acid phosphatase-positive (TRAP+) lineage.
(A) Dimensional reduction projection of monocyte and macrophage cells expressing RANK, TRAP, and/or TLR2 from all sample groups onto two dimensions using principal components, depicting values of Slingshot pseudotime followed by gene expression levels of St3gal4, Tlr2, Tnfrsf11a, and Acp5. (B) A heat map of dynamic expression of St3gal4, Tlr2, Tnfrsf11a, and Acp5 in monocyte and macrophage cells expressing RANK, TRAP, and/or TLR2 from all sample groups. Pseudotime values and annotated cell types are depicted in the color-coded bars atop the heat map. (C) Representative images of TRAP staining and immunofluorescence co-staining for RANK (red), TLR2 (green), and DAPI (blue) staining for nuclei for bone marrow macrophages cultured with macrophage colony stimulating factor (M-CSF) ( + ng/ml) and RANKL (200 ng/ml) for 0, 1, 3, and 5 days. Scale bar, 0.1 mm. (D) Quantitative analysis of the percentage of TRAP+ cells in bone marrow macrophages at different time points (n=4 or 5, one-way ANOVA with Tukey’s multiple comparisons test). (E–G) Quantitative analysis of the mean intensity of RANK and TLR2 positive fluorescence, and the percentage of RANK+TLR2+ positive cells in bone marrow macrophages at different time points (n=5 or 6, one-way ANOVA with Tukey’s multiple comparisons test). All data are means ± SD. N.S=No Significant difference, *p<0.05, **p<0.01, ***p<0.001, ****p<0.0001.
Figure 1—figure supplement 1
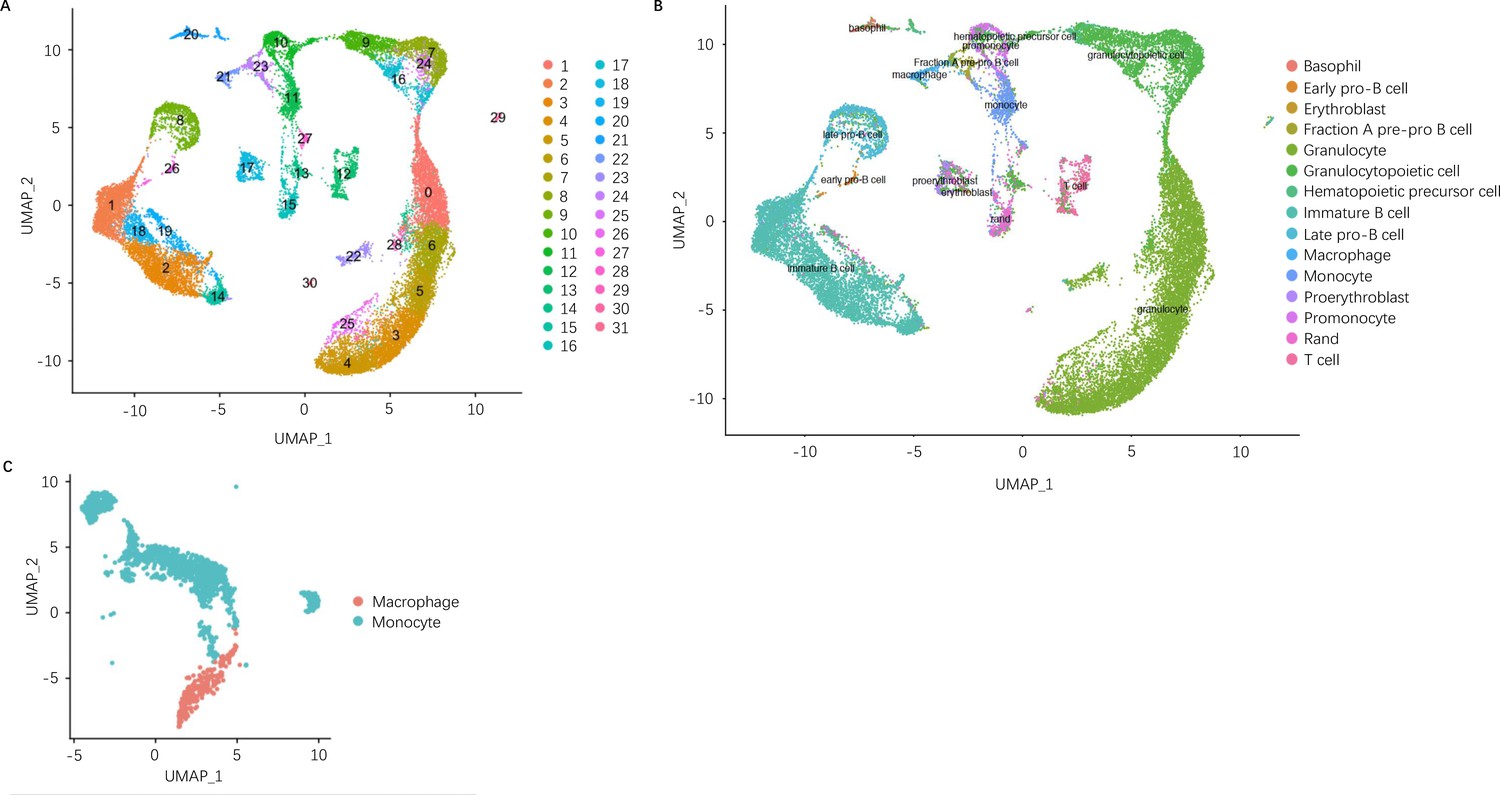
Clustering and annotation of scRNA-seq data.
(A) Leiden clustering and UMAP embedding of cells from CIA vehicle, CIA treated with soyasaponin Bb, and DBA control sample groups. (B) Cell type annotation of cells from all sample groups on UMAP embedding. Single-cell annotations were assigned by the SingleCellNet classification of our data using a classifier trained on Tabula Muris bone marrow single-cell RNA-sequence (scRNA-seq) data. (C) Cell type annotation of macrophages and monocytes from all sample groups on UMAP embedding. Monocytes and macrophages were identified by the consensus of SingleCellNet classification, differential gene expression, and marker gene expression. Monocytes and macrophages were subsetted from the original dataset and downstream analysis was repeated on the resulting subset.
Figure 2 with 1 supplement
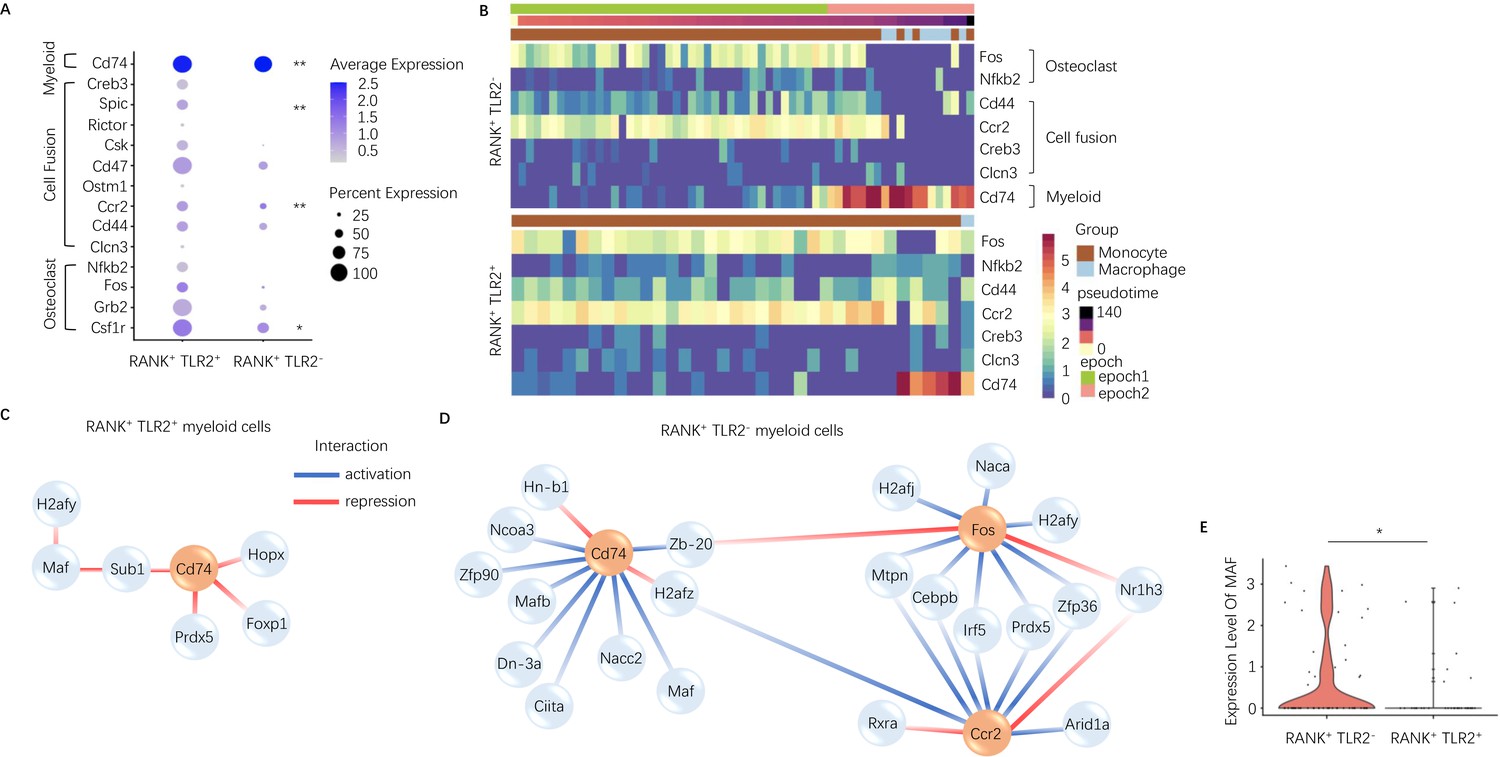
Expression of osteoclast fusion genes in RANK+TLR2+ subset peak during differentiation to a TRAP+ linage, but not in the RANK+TLR2− subset.
(A) Dot plot of average expression of select myeloid, cell fusion, and osteoclast differentiation genes in RANK+TLR2+ myeloid cells (left) and RANK+TLR2− myeloid cells (right) from epoch 2. The color of each dot corresponds to average expression and the size corresponds to the percentage of cells expressing the gene of interest (n=3, Poisson test with FDR adjustment). (B) Heat maps of dynamic expression of select osteoclast differentiation, cell fusion, and myeloid marker genes in RANK+TLR2− myeloid cells (top) and RANK+TLR2+ myeloid cells (bottom). (C) Top downstream regulators for Cd74 in the epoch 2 stage of RANK+TLR2+ populations. Blue: activation regulation; Red: repression regulation. (D) Top downstream regulators for Cd74, Fos, and Ccr2 in the epoch 2 stage of RANK+TLR2− cells. Zb-20: Zbtb20, Dn-3a: Dnmt3a, Hn-b1: Hnrnpa2b1. (E) Violin plots of the expression level of macrophage activating factor Maf in RANK+TLR2− and RANK+TLR2+ myeloid cells (n=3, Poisson test with FDR adjustment). *p<0.05, **p<0.01.
Figure 2—figure supplement 1
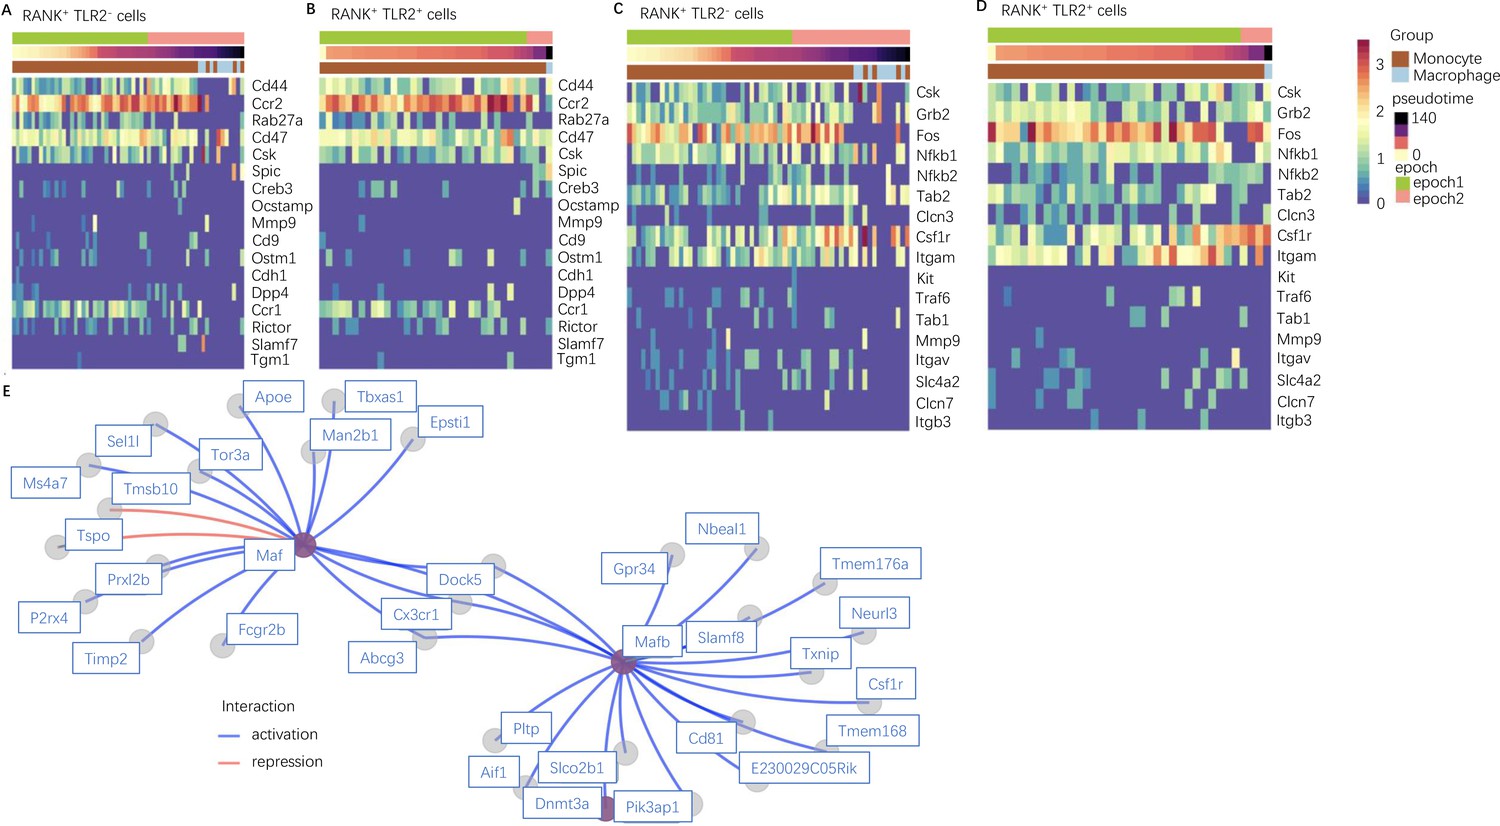
The dynamic gene expression of those related to cell fusion and osteoclast differentiation in RANK+TLR2+ and RANK+TLR2− populations.
(A–B) A heat map depicting dynamic expression of cell fusion marker genes in RANK+TLR2− cells (A) and RANK+TLR2+ population (B) myeloid cells. Cells were split into two pseudotemporal intervals, or epochs, based on their Slingshot pseudotime values. (C–D) A heat map depicting dynamic expression of osteoclast differentiation marker genes over pseudotime in the RANK+TLR2− (C) and the RANK+TLR2+ (D) populations. (E) Gene regulatory networks depicting the top targets of Maf and Mafb in RANK+TLR2− myeloid cells in epoch 2 (late monocyte to macrophage). Edges are colored by interaction (blue = activation, red = repression).
Figure 3
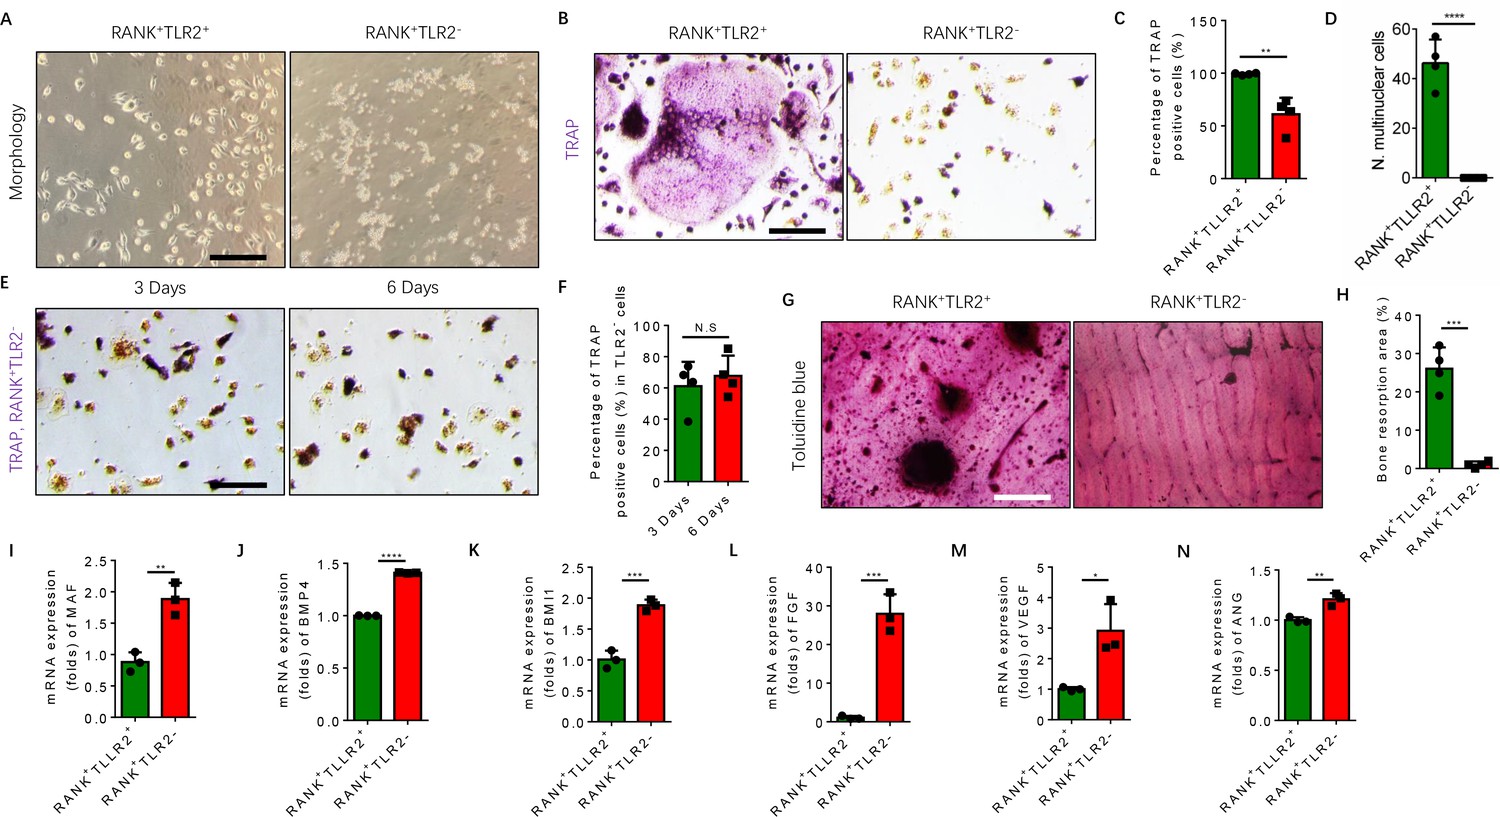
RANK+TLR2− myeloid monocytes did not fuse to form osteoclasts after commitment to a tartrate-resistant acid phosphatase-positive (TRAP+) mononuclear lineage.
(A) Representative images of the morphology of the RANK+TLR2+ and the RANK+TLR2− monocytes after treatment with M-CSF (30 ng/ml) for 3 days (n=3). Scale bar, 0.1 mm. (B) Representative images of TRAP staining of RANK+TLR2+ and the RANK+TLR2− monocytes after treatment with M-CSF (30 ng/ml) and RANKL (200 ng/ml) for 3 days. Scale bar, 0.1 mm. (C) Quantitative analysis of the percentage of TRAP-positive RANK+TLR2− and RANK+TLR2+ monocytes (n=4, t-test). (D) Quantitative analysis of the number of multinuclear cells in the RANK+TLR2+ and the RANK+TLR2− monocytes (n=4, t-test). (E) Representative images of TRAP staining of RANK+TLR2− monocytes after treatment with macrophage colony stimulating factor (M-CSF) (30 ng/ml) and RANKL (200 ng/ml) for three days and six days, respectively. Scale bar, 0.1 mm. (F) Quantitative analysis of the percentage of TRAP-positive RANK+TLR2− cells. (n=4, t-test). (G) Representative images of toluidine blue staining of bone slices after culture with RANK+TLR2+ or RANK+TLR2− monocytes treated with M-CSF (30 ng/ml) and RANKL (200 ng/ml) for 1 week. Scale bar, 0.1 mm. (H) The quantitative analysis of bone resorption area in the bone slices (n=4, t-test). (I–N) The mRNA expression changes of macrophage activating gene and osteogenesis-related genes, including Maf, BMP4, BMI1, FGF, VEGF, ANG, in FACS-sorted RANK+TLR2+ and RANK+TLR2− monocytes (n=3, t-test). All data are means ± SD. N.S=No Significant difference, *p<0.05, **p<0.01, ***p<0.001, ****P<0.0001.
Figure 4
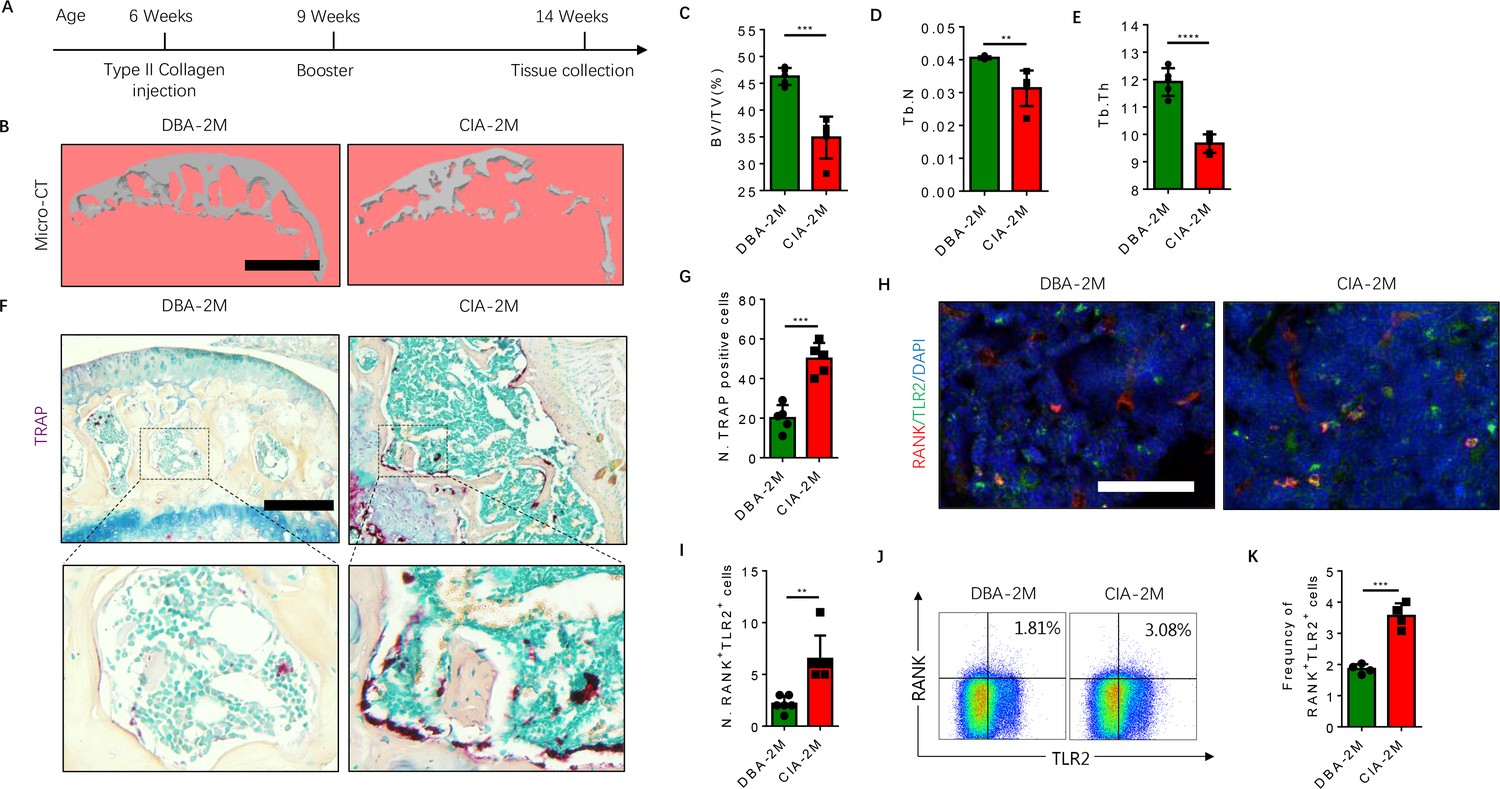
The frequency of RANK+TLR2+ myeloid monocytes is greater in CIA mice.
(A) A schematic diagram illustrating the experimental regimen for arthritis induction in the CIA model of RA. (B) Representative 3D μCT images of the subchondral bone of the medial compartment of the tibia (sagittal view) of DBA (control) and CIA mice after 2 months of immunization (DBA-2M and CIA-2M, respectively). Scale bar, 0.1 mm. (C–E) Quantitative analysis of bone volume/tissue volume (BV/TV), trabecular number (Tb. N), trabecular thickness (Tb. Th) of the CIA-2M and DBA-2M mice (n=5, t-test). (F) Representative images of TRAP staining in knee joints. Scale bar, 0.5 mm. (G) Quantitative analysis of the number of tartrate-resistant acid phosphatase-positive (TRAP+) cells (n=5, t-test). (H) Representative images of co-immunofluorescence staining for RANK (red), TLR2 (green), and DAPI (blue) staining of nuclei in knee joints. Scale bar, 0.5 mm. (I) Quantitative analysis of the number of double-positive RANK and TLR2 (n=6, t-test). (J) Representative flow cytometry plots with the percentage of RANK+TLR2+ cells in bone marrow. (K) Frequency of RANK+TLR2+ cells in the bone marrow (n=4, t-test). All data are means ± SD. **p<0.01, ***p<0.001, ****p<0.0001.
Figure 5
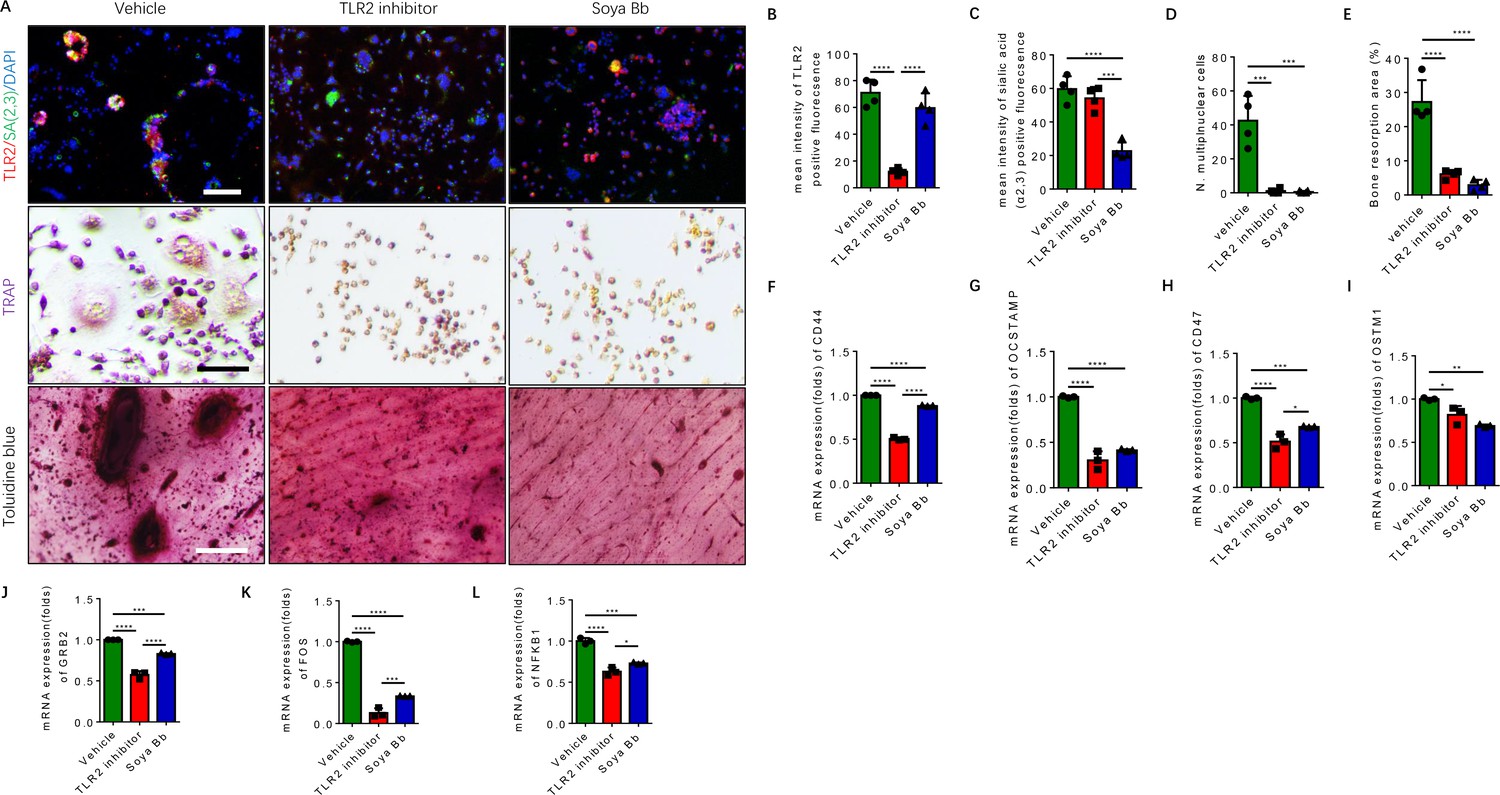
Inhibition of TLR2 activity or its sialylation blocks the osteoclastogenesis of RANK+TLR2+ monocytes.
(A) Upper raw: Representative images of the immunofluorescence co-staining of TLR2 (red) and α(2,3) sialylation (green) of RANK+TLR2+ monocytes treated with vehicle (PBS), a TLR2 inhibitor (C29, 150 μM), or an α(2,3) sialyltransferase inhibitor (soyasaponin Bb, 10 mg/kg), respectively, for three days. DAPI (blue) for the nuclei. Middle raw: Representative images of TRAP staining of RANK+TLR2+ monocytes treated with PBS, C29, or soyasaponin Bb, respectively, for 3 days. Bottom raw: Representative images of toluidine blue staining of bone slices cultured with RANK+TLR2+ monocytes for 1 week, that had been treated with PBS, C29, or soyasaponin Bb, respectively, for 1 week prior. Scale bar, 0.1 mm. (B–C) Quantitative results of the mean intensity of TLR2− and α(2,3) sialylation-positive fluorescence in the RANK+TLR2+ monocytes treated with PBS, C29, or soyasaponin Bb, respectively (n=4, one-way ANOVA with Tukey’s multiple comparisons test). (D) Quantitative analysis for multinuclear cells among the RANK+TLR2+ cells treated with PBS, C29, or soyasaponin Bb, respectively (n=4, one-way ANOVA with Tukey’s multiple comparisons test). (E) Quantitative analysis of the bone resorption area of bone slices cultured with RANK+TLR2+ cells treated with PBS, C29, or soyasaponin Bb, respectively (n=4, one-way ANOVA with Tukey’s multiple comparisons test). (F–I) The mRNA expression of the cell fusion-related genes Cd44, Ocstamp, Cd47, and Ostm1 in RANK+TLR2+ monocytes treated with PBS, C29, or soyasaponin Bb, respectively (n=3, one-way ANOVA with Tukey’s multiple comparisons test). (J–L) The mRNA expression of the osteoclast differentiation-related genes Grb2, Fos, and Nfkb1 in RANK+TLR2+ monocytes treated with PBS, C29, or soyasaponin Bb, respectively (n=3, one-way ANOVA with Tukey’s multiple comparisons test). All data are means ± SD. *p<0.05, **p<0.01, ***p<0.001, ****p<0.0001.
Figure 6 with 1 supplement
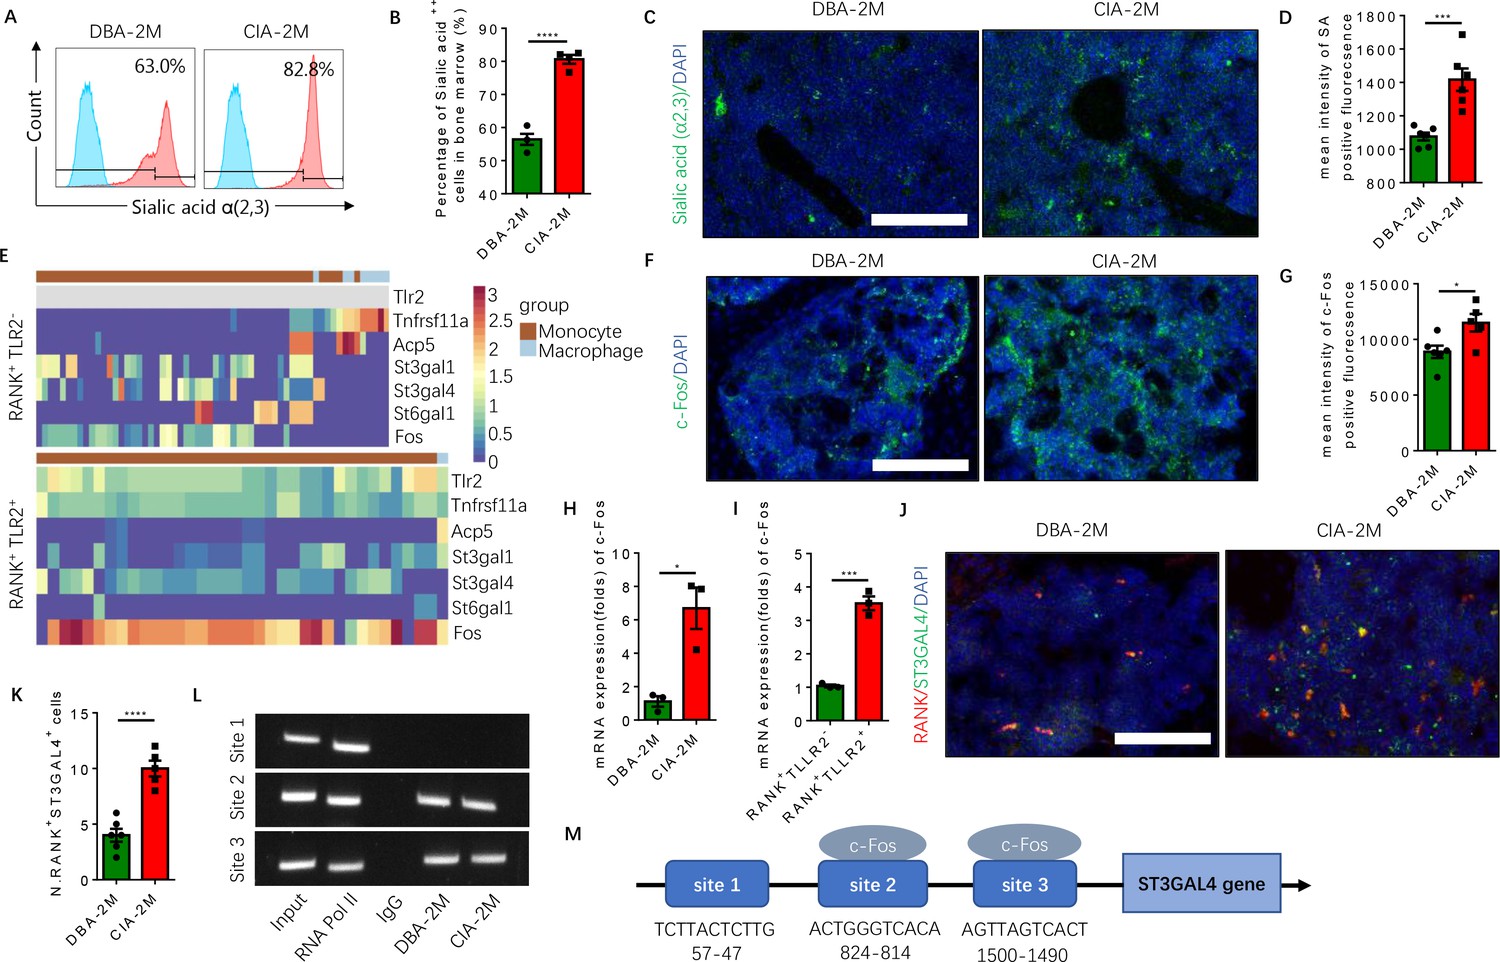
Elevated α(2,3) sialylation in RANK+TLR2+ monocytes is associated with an increase in the transcription of sialyltransferases in CIA mice.
(A) Representative histograms of sialic acid α(2,3)-modified cells in the bone marrow of DBA control mice and CIA mice 2 months after the first immunization. (B) Quantitative analysis of the frequency of sialic acid α(2,3)-positive cells in DBA mice and CIA mice (n=4, t-test). (C) Representative images of the biotin fluorescence staining for sialic acid α(2,3) (green) and of DAPI staining (blue) of the knee joint sections from DBA mice and CIA mice 2 months after the first immunization. Scale bar, 0.5 mm. (D) Quantitative analysis of the mean intensity of sialic acid α(2,3)-positive fluorescence of the images represented in (C) (n=6, t-test). (E) Heat maps of dynamic expression of marker genes Tlr2, Tnfrsf11a, Acp5, sialyltransferases, and Fos in the RANK+TLR2− myeloid cells (top) and RANK+TLR2+ myeloid cells (bottom). (F) Representative images of the immunofluorescence staining for c-Fos (green) of the knee joint section from DBA mice and CIA mice 2 months after the first immunization. Scale bar, 0.5 mm. (G) Quantitative analysis of the mean intensity of c-Fos-positive fluorescence in (F) (n=5, t-test). (H–I) The mRNA expression changes of c-Fos in the knee joint tissue of CIA and DBA mice (H) or in the RANK+TLR2− and RANK+TLR2+ monocytes (I) (n=3, t-test). (J) Representative images of the immunofluorescence co-staining for RANK (red) and ST3GAL4 (green) of the knee joint sections from DBA mice and CIA mice 2 months after the first immunization. (K) Quantitative analysis of the RANK+ST3GAL4+ cells in (J) (n=5, t-test). (L) The electrophoresis of CHIP assay for the binding sites of c-Fos in the promoter sequence of the St3gal4 gene. (M) The diagram of different locations and sequences of the putative binding sites for c-Fos in the promoter of St3gal4 gene. *p<0.05, ***p<0.001, ****p<0.0001.
-
Figure 6—source data 1
Gel blot of CHIP assay of St3gal4 gene expression.
- https://cdn.elifesciences.org/articles/85553/elife-85553-fig6-data1-v3.zip
Figure 6—figure supplement 1
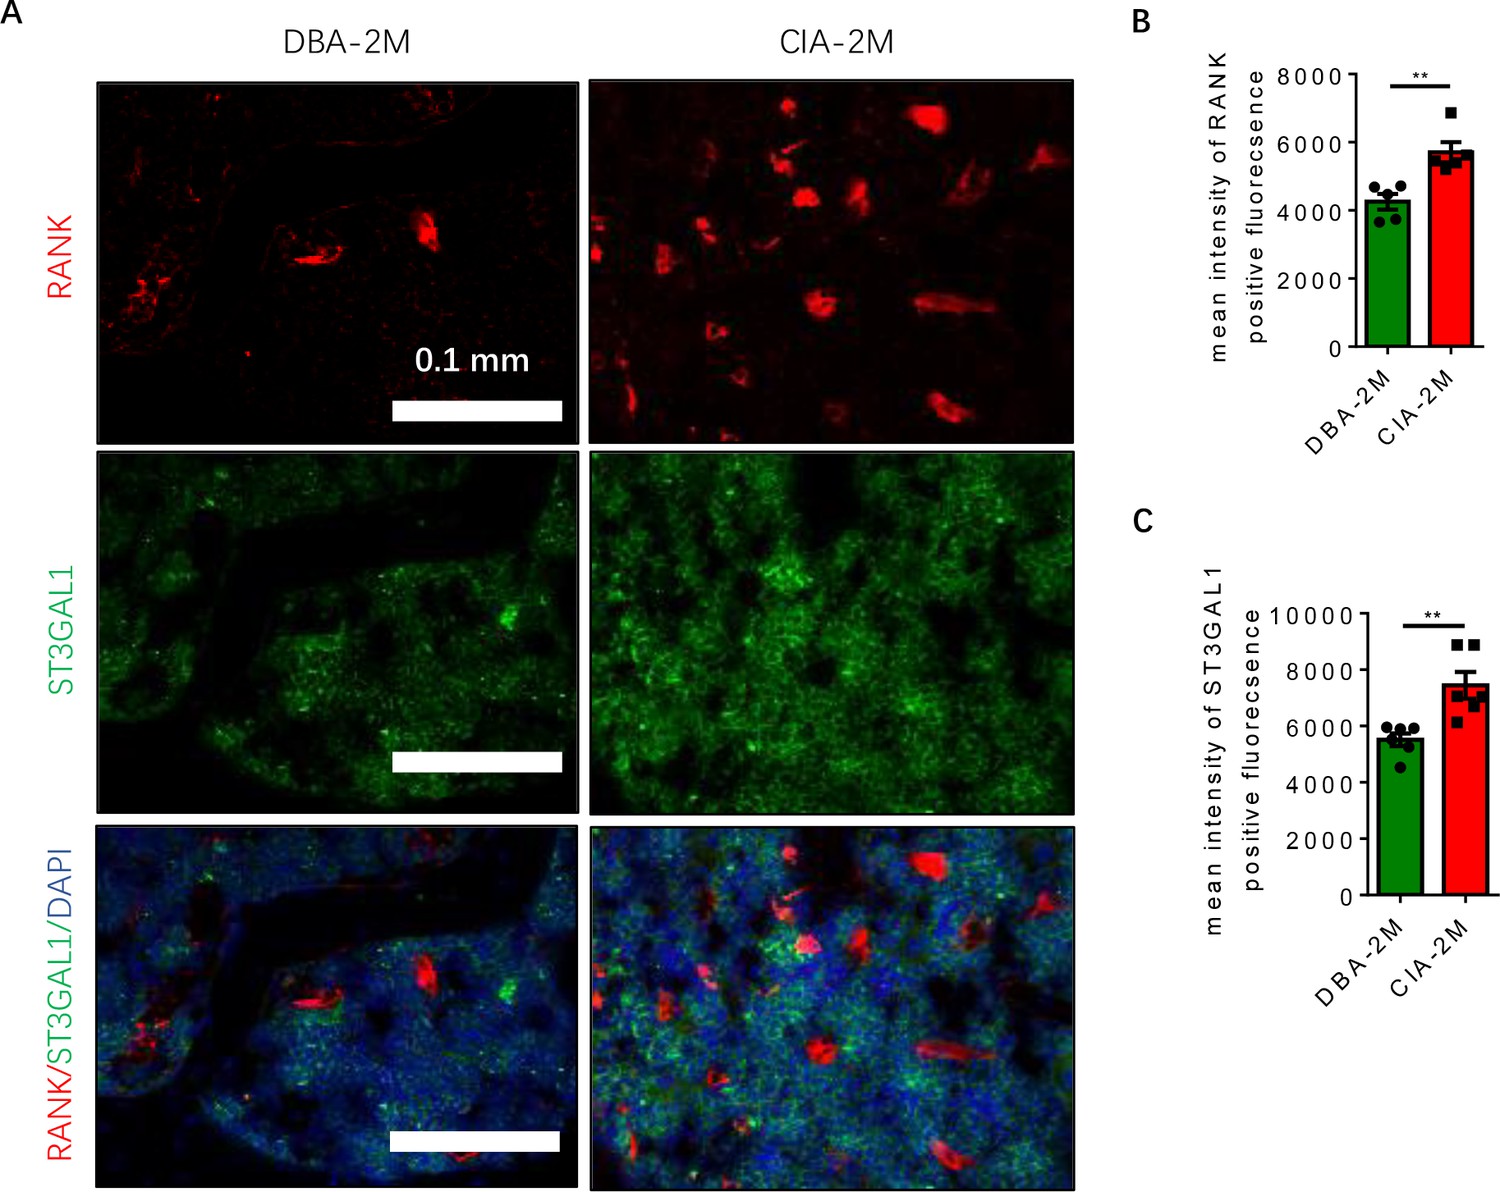
Different expression of ST3GAL1 in RANK positive population.
(A) Representative images of the immunofluorescence co-staining for RANK (red) and ST3GAL1 (green) in the knee joint in DBA mice and CIA mice. Scale bar, 0.1 mm. (B–C) Quantitative analysis for the mean intensity of RANK (B) or ST3GAL1 (C) positive fluorescence in DBA mice relative to CIA mice (n=5 or 6, t-test). **p<0.01.
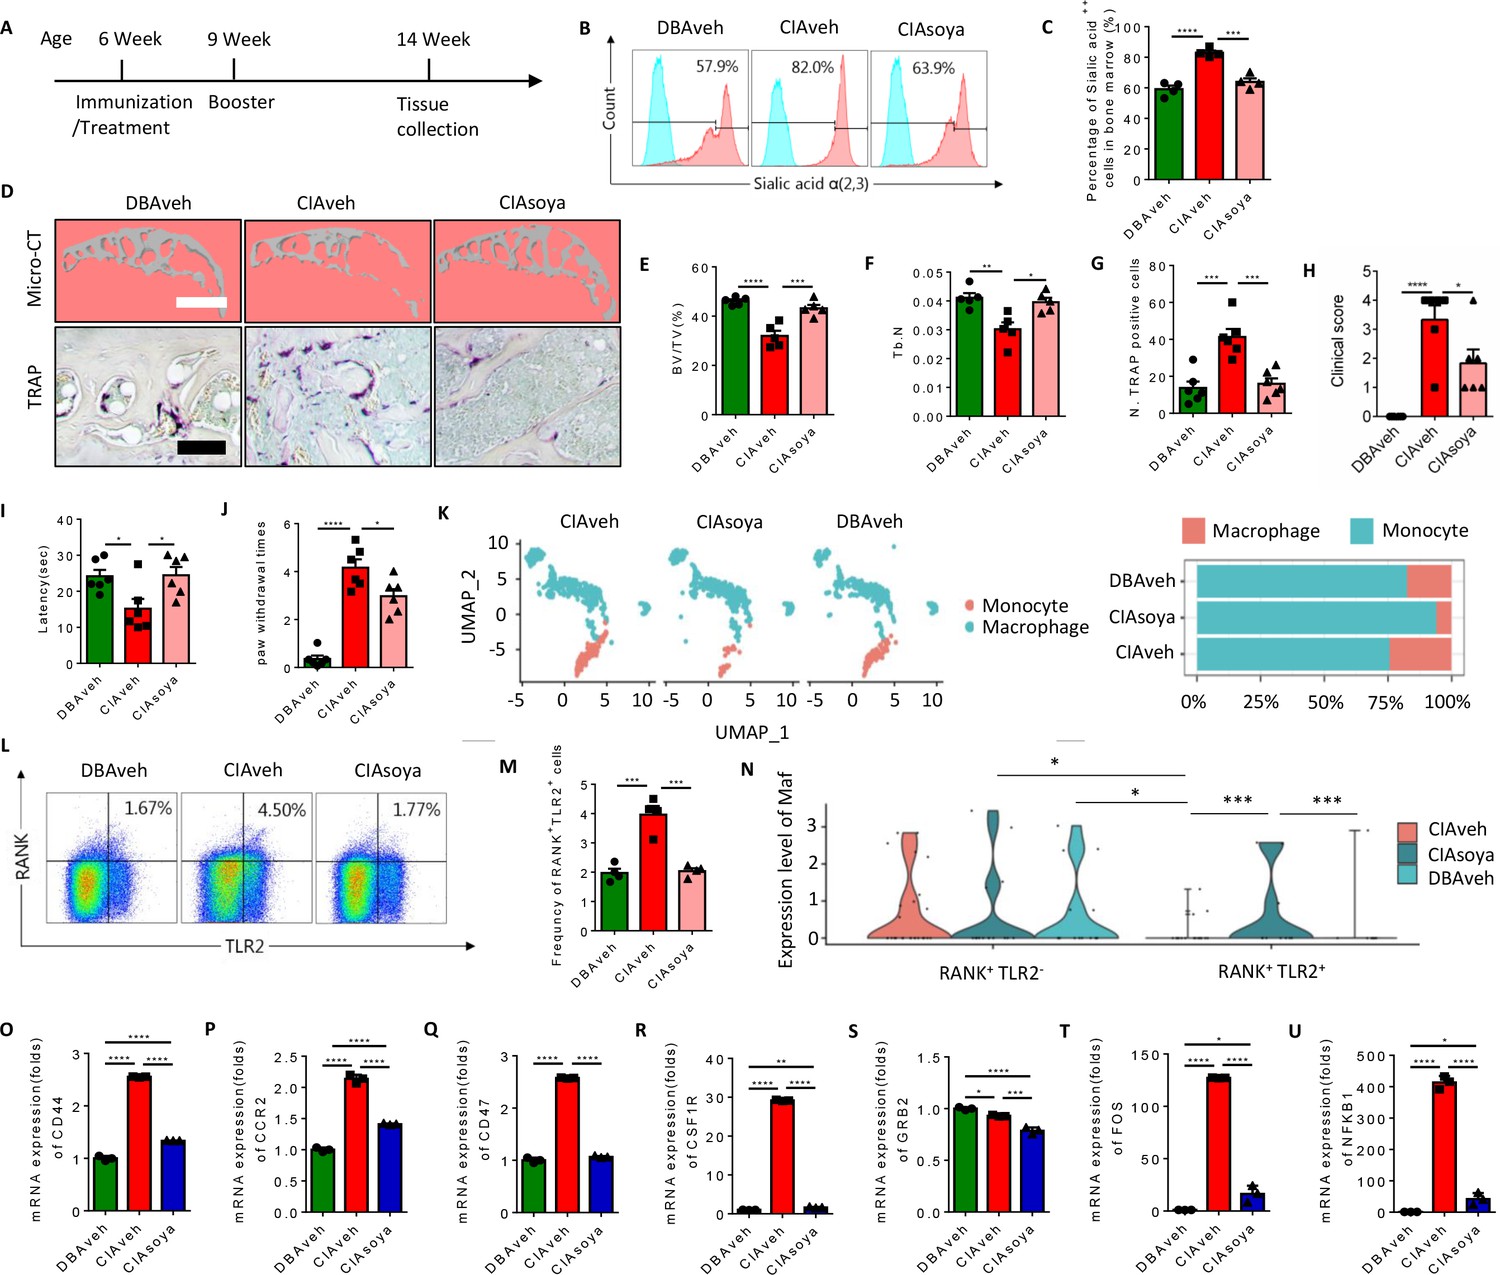
Figure 7 with 1 supplement
Inhibition of α(2,3) sialylation blocks osteoclast fusion and joint destruction in CIA mice.
(A) A schematic diagram illustrating the time frames for immunization and soyasaponin Bb or vehicle (PBS) treatment, booster injection, and analysis. (B) Representative histograms for sialic acid α(2,3) modified cells in the bone marrow of CIA mice treated with PBS or soyasaponin Bb relative to DBA mice. (C) The frequency of sialic acid α(2,3) positive cells in CIA mice treated with PBS or soyasaponin Bb relative to DBA mice (n=4, one-way ANOVA with Tukey’s multiple comparisons test). (D) Upper raw: The representative 3D reconstruction images for subchondral bone of knee joints of DBA mice and CIA mice treated with PBS or soyasaponin Bb for 2 months. Lower raw: Representative images of the TRAP staining for the knee joint sections in DBA mice and CIA mice treated with PBS or soyasaponin Bb. Scale bar, 0.1 mm. (E–F) Quantitative analysis of bone volume/tissue volume (BV/TV) (E) or Tb. N (F) in μCT scan of CIA mice treated with PBS or soyasaponin Bb relative to DBA mice (n=5, one-way ANOVA with Tukey’s multiple comparisons test). (G) Quantitative analysis of TRAP-positive cells in the knee joint of DBA mice and CIA mice treated with PBS or soyasaponin Bb (n=6, one-way ANOVA with Tukey’s multiple comparisons test). (H) The clinical score of the inflammation paws in CIA mice treated with PBS or soyasaponin Bb relative to DBA mice (n=6, one-way ANOVA with Tukey’s multiple comparisons test). (I) The latency time for withdrawal of the paw after light beam-induced heat stimulation in CIA mice treated with PBS or soyasaponin Bb relative to DBA mice (n=6, one-way ANOVA with Tukey’s multiple comparisons test). (J) The frequency of paw withdrawals after the stimulation of the von Frey hair (0.4 g) in CIA mice treated with PBS or soyasaponin Bb relative to DBA mice (n=6, one-way ANOVA with Tukey’s multiple comparisons test). (K) UMAP embedding of cell type annotation of RANK+ monocytes for each sample group. Bar plot of relative cell type abundance of RANK+ monocytes in each sample group. (L) Representative flow cytometry plots for RANK+TLR2+ cells in bone marrow in CIA mice treated with PBS or soyasaponin Bb relative to DBA mice. (M) The frequency of RANK+TLR2+ cells in bone marrow in CIA mice treated with PBS or soyasaponin Bb relative to DBA mice (n=4, one-way ANOVA with Tukey’s multiple comparisons test). (N) Violin plot of Maf expression in RANK+ myeloid cells in the TLR2− and TLR2+ subsets across sample groups (n=3, Poisson test with FDR adjustment). (O–Q) The fold mRNA expression of the cell fusion-related genes Cd44, Ccr2, Cd47 in CIA mice treated with PBS or soyasaponin Bb relative to DBA mice (n=3, one-way ANOVA with Tukey’s multiple comparisons test). (R–U) The mRNA expression changes of the osteoclast differentiation-related genes Csf1r, Grb2, Fos, Nfkb1 in CIA mice treated with PBS or soyasaponin Bb relative to DBA mice (n=3, one-way ANOVA with Tukey’s multiple comparisons test). *p<0.05, **p<0.01, ***p<0.001, ****p<0.0001.
Figure 7—figure supplement 1
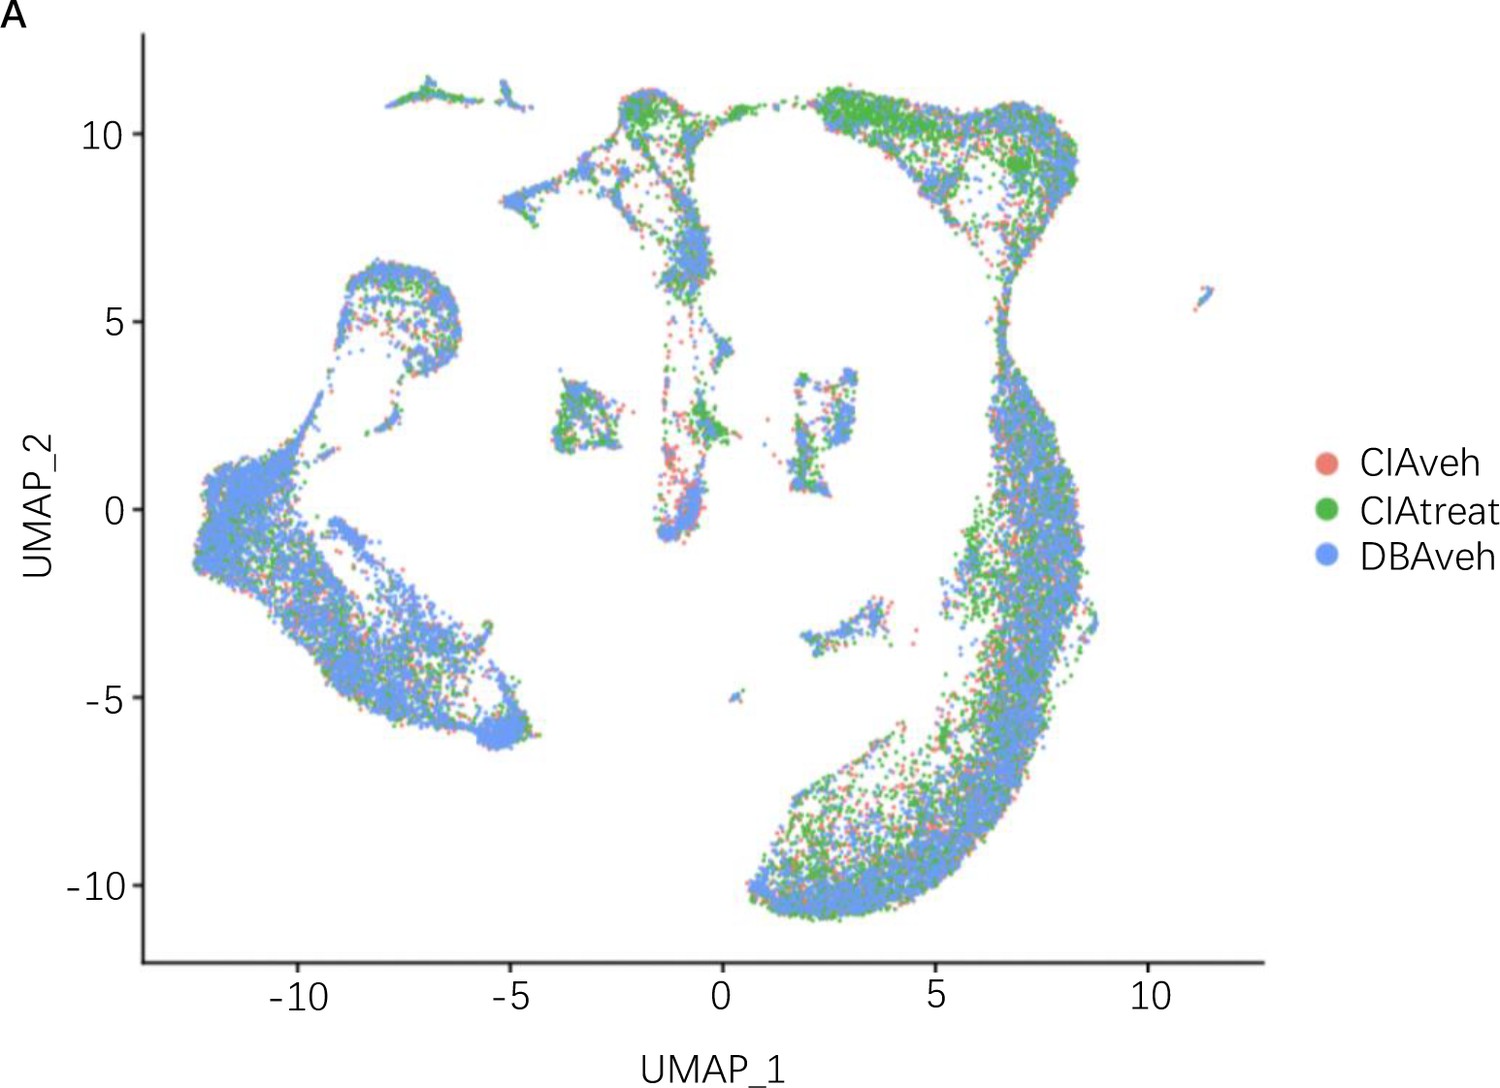
Clustering of single-cell RNA-sequence (scRNA-seq) data in groups.
(A) UMAP embedding depicting the distribution of cells from each sample group (CIA vehicle, CIA treated with soyasaponin Bb, and control DBA mice) following batch correction.
Author response image 1
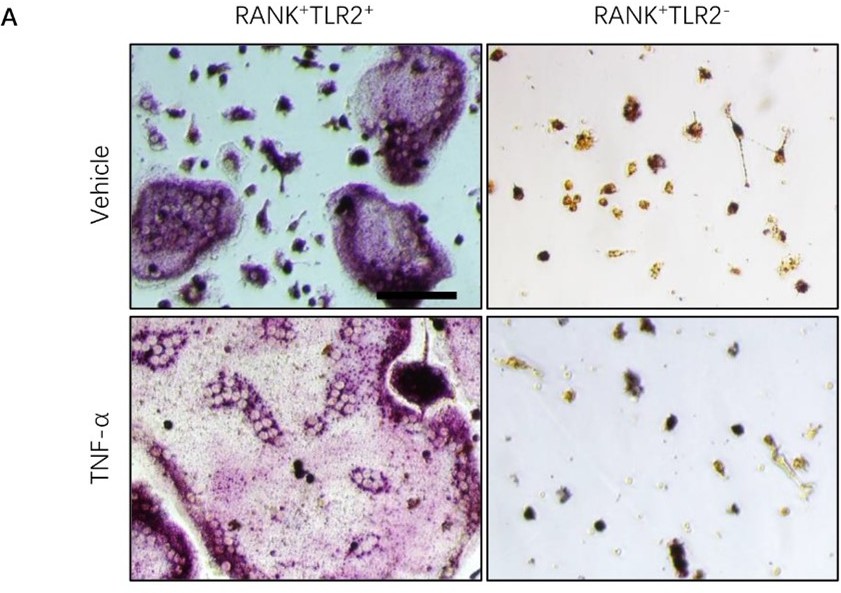
The representative images for TRAP staining of RANK+TLR2+ and RANK+TLR2- cells with RANK (200ng/ml) and M-CSF (30ng/ml) and vehicle or TNF-α (20ng/ml) treatment for three days.
Scale bar, 0.1 mm.
Author response image 2
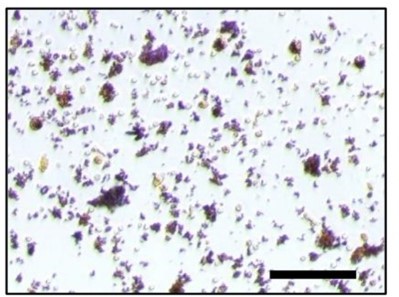
RANK+TLR2- cell were cultured for 10 days with RANK(200ng/ml) and M-CSF(30ng/ml) and stained by TRAP.
Scale bar, 0.1 mm.
Author response image 3
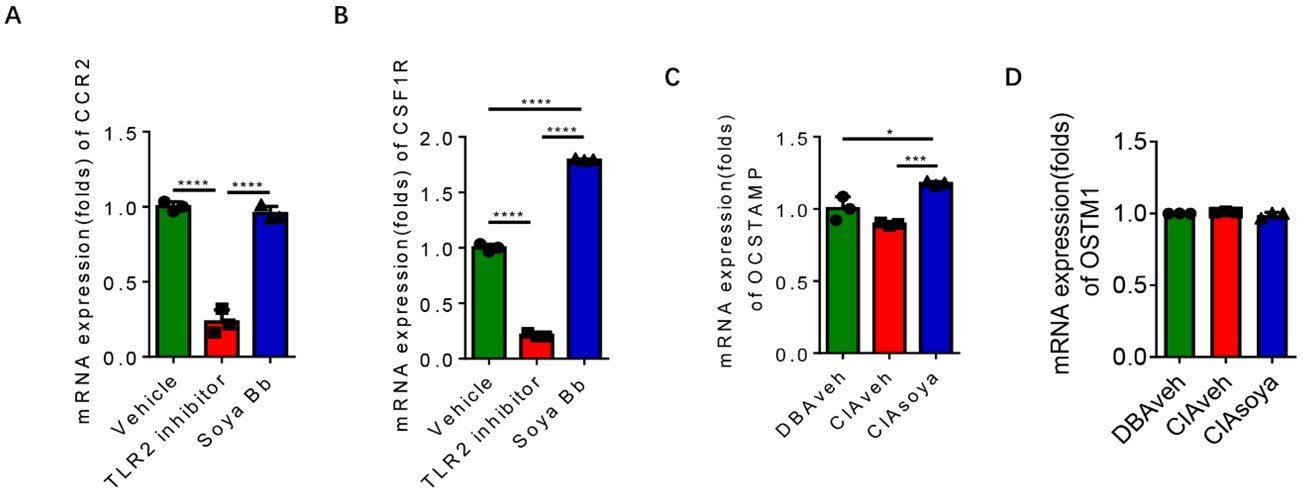
Expression of osteoclast genes in RANK+TLR2+ cells with soyasaponin Bb treatment.
(A-B) The mRNA expression of CCR2, CSF1R genes in RANK+TLR2+ monocytes treated with PBS, C29, or soyasaponin Bb, respectively (n = 3, one-way ANOVA with Tukey’s multiple comparisons test). (C-D) The mRNA expression of OCSTAMP, OSTM1 genes in RANK+TLR2+ monocytes treated with in CIA mice treated with PBS or soyasaponin Bb relative to DBA mice (n = 3, one-way ANOVA with Tukey’s multiple comparisons test). All data are means ± SD. *P < 0.05, ***P < 0.001, ****P < 0.0001.
Additional files
Download links
A two-part list of links to download the article, or parts of the article, in various formats.
Downloads (link to download the article as PDF)
Open citations (links to open the citations from this article in various online reference manager services)
Cite this article (links to download the citations from this article in formats compatible with various reference manager tools)
RANK+TLR2+ myeloid subpopulation converts autoimmune to joint destruction in rheumatoid arthritis
eLife 12:e85553.
https://doi.org/10.7554/eLife.85553


