Cannabidiol sensitizes TRPV2 channels to activation by 2-APB
- Molecular Physiology and Biophysics Section, Porter Neuroscience Research Center, National Institute of Neurological Disorders and Stroke, National Institutes of Health, United States
- Department of Molecular Biosciences, College of Natural Sciences, The University of Texas at Austin, United States
Figures
Figure 1 with 3 supplements
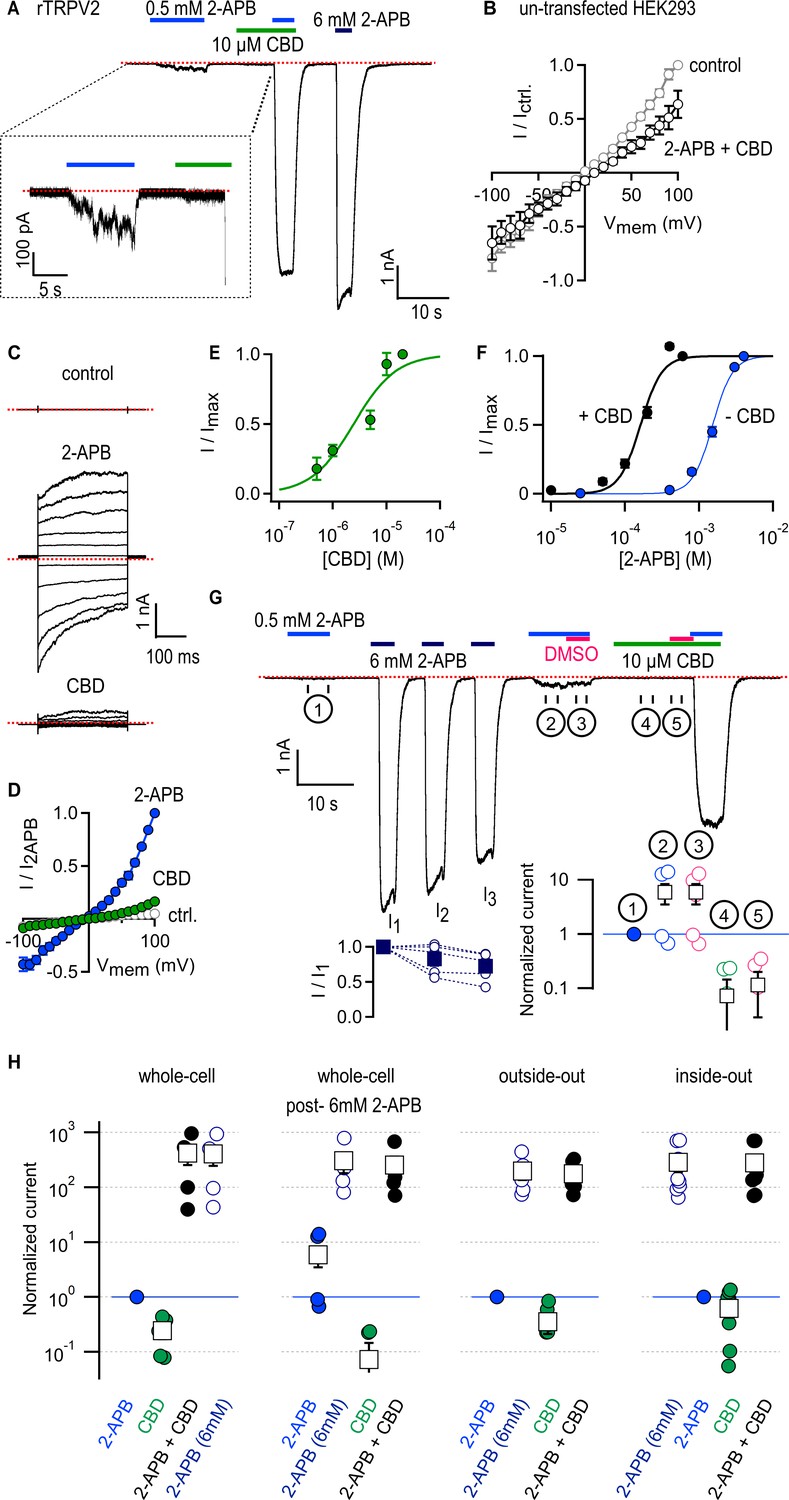
Cannabidiol (CBD) strongly sensitizes rTRPV2 channels to activation by 2-aminoethoxydiphenyl borate (2-APB) in whole-cell and in excised patch recordings.
(A) Representative whole-cell gap-free current recording at –80 mV from a cell expressing rTRPV2 channels. The colored horizontal lines denote the duration of exposure to test compounds, and the red dotted line denotes the zero-current level. The inset shows a magnified view of a segment of the recording. (B) Mean current–voltage relations recorded in control solution and in the presence of 0.5 mM 2-APB + 10 µM obtained from un-transfected cells in the whole-cell configuration (n = 8). (C) Representative current families elicited by voltage steps from –100 to +100 mV obtained from an rTRPV2-expressing cell exposed to control solution, 0.5 mM 2-APB or 10 µM CBD. The dotted lines indicate the zero-current level. (D) Mean current–voltage relations obtained from data as in (C) and normalized to the mean value at +100 mV in the presence of 0.5 mM 2-APB. Data are shown as mean ± SEM (n = 5). (E) Dose–response relation for rTRPV2 channel activation by CBD measured at –80 mV in the whole-cell configuration (mean ± SEM; n = 4). The continuous curve is a fit to the Hill equation with parameters: EC50 = 4.3 ± 1.4 µM and Hill coefficient (nH) = 1.7 ± 0.1. (F) Concentration–response relations for rTRPV2 channel activation by 2-APB at –80 mV in the whole-cell configuration measured in the absence (blue symbols) or presence (black symbols) of 10 µM CBD (mean ± SEM; n = 7). Hill equation parameters: no CBD, EC50 = 1.5 ± 0.05 mM, Hill coefficient (nH) = 3.3 ± 0.2; 10 µM CBD, EC50 = 159.9 ± 7.7 µM, Hill coefficient (nH) = 2.9 ± 0.3. (G) Representative whole-cell gap-free recording at –80 mV in an rTRPV2-expressing cell. The bottom-left inset shows group data for the mean current amplitude at each of the three stimulations with 6 mM 2-APB, leak-subtracted and normalized to the amplitude during the first 6 mM 2-APB stimulation (solid squares – mean ± SEM, n = 5; empty circles – data from individual cells). The bottom-right inset displays steady-state data measured over each of the five intervals (① - ⑤) identified by the circled numbers on the current time course, normalized to the response to 2-APB in ① denoted by the horizontal blue line. Black squares are mean ± SEM, and circles are data from individual cells. (H) Leak-subtracted and normalized group data for: experiments in the whole-cell configuration as in (A) (n = 5) or post-sensitization by 6 mM 2-APB as in (G) (n = 5); experiments from outside-out patches as in Figure 1—figure supplement 3A (n = 6); experiments from inside-out patches as in Figure 1—figure supplement 3B (n = 9). Data was normalized to the first stimulation with 0.5 mM 2-APB (denoted by the horizontal blue lines) and shown as mean ± SEM (black squares) or values from individual cells (circles).
-
Figure 1—source data 1
Excel file with group data from electrophysiological recordings shown in Figure 1.
- https://cdn.elifesciences.org/articles/86166/elife-86166-fig1-data1-v1.xlsx
Figure 1—figure supplement 1
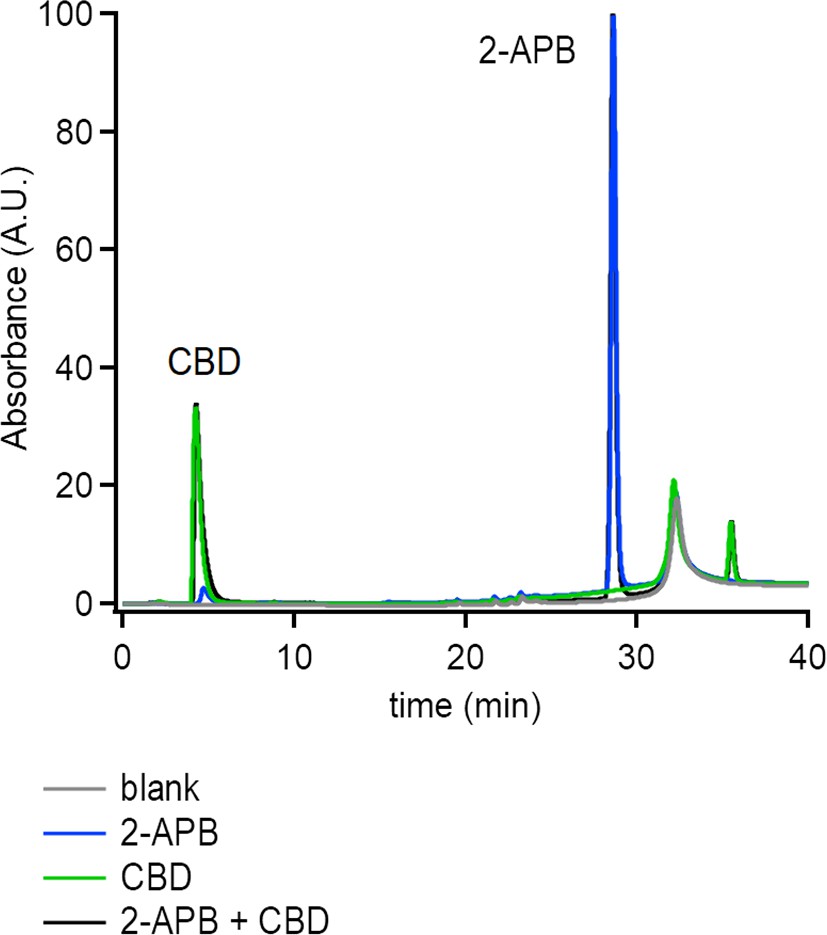
No evidence of chemical reactivity between 2-aminoethoxydiphenyl borate (2-APB) and cannabidiol (CBD).
Representative experiments showing high-performance liquid chromatography (HPLC) runs for a blank sample (i.e. recording solution only), and samples containing 50 nmol of 2-APB or 5 nmol of CBD alone or with both compounds together at the same concentrations. Absorbance was monitored at 228 nm.
Figure 1—figure supplement 2
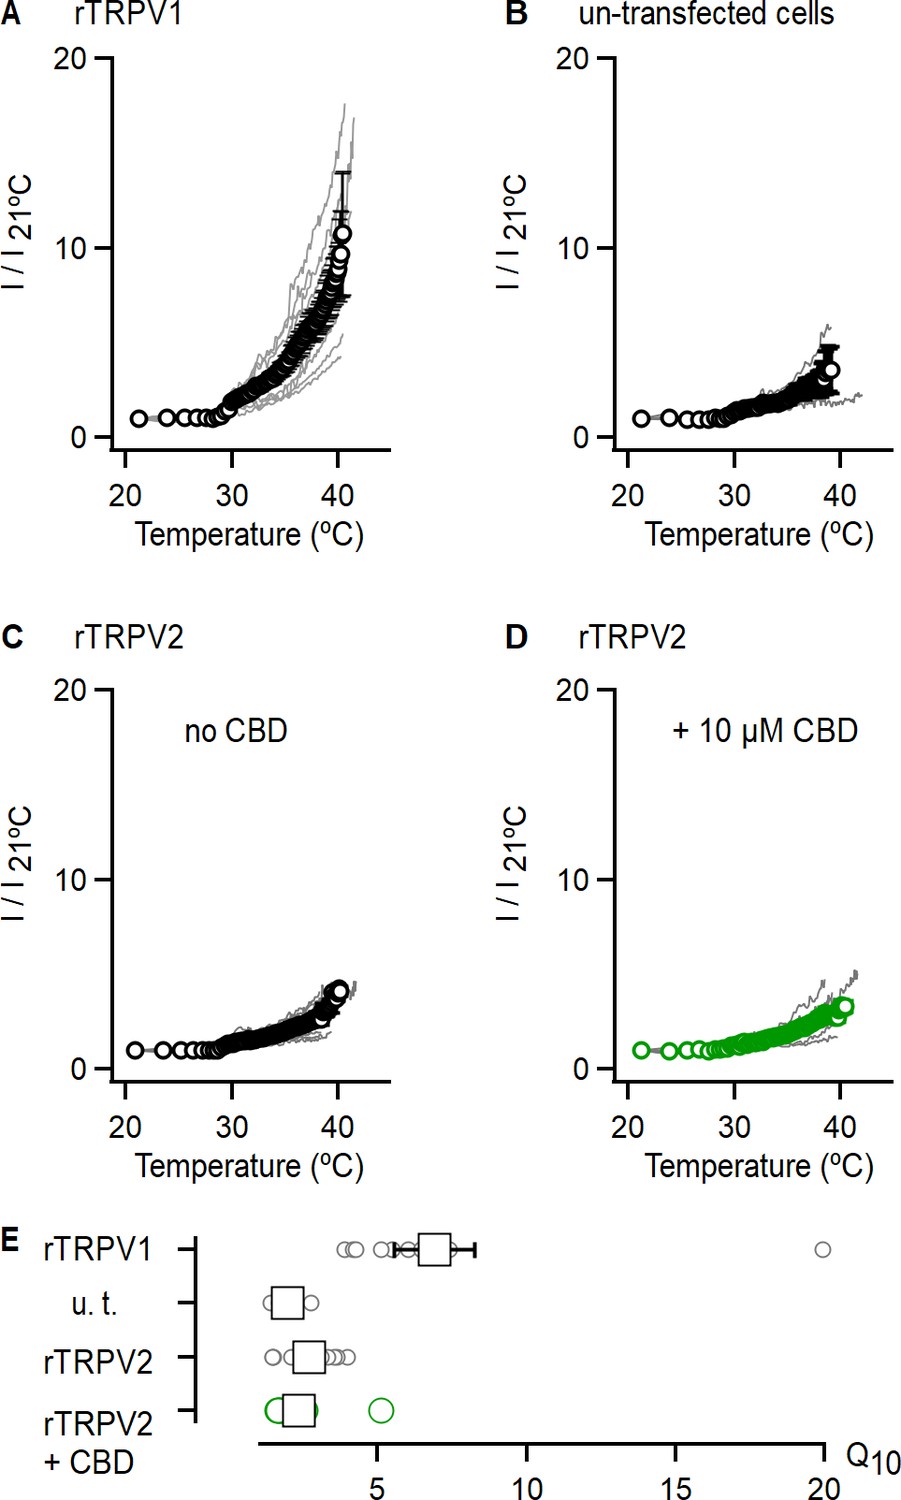
Cannabidiol (CBD) does not strongly sensitize rTRPV2 channels to activation by heat at physiological temperatures.
(A) Current–temperature relations recorded at +90 mV from rTPRV1-expressing cells in the whole-cell configuration. Currents were recorded during the first 90 s after the heating device was turned on, and the mean current at the end of each pulse plotted against temperature as calculated from Equation 4 (see ‘Materials and methods’). Relations from individual experiments are shown as gray lines, and their mean ± SEM shown in black (n = 11). Currents from individual experiments were normalized to their magnitude at 21°C. (B–D) Current temperature relations obtained and plotted as in (A) for experiments with (B) un-transfected cells (n = 5), (C) rTRPV2-expressing cells (n = 9), and (D) rTRPV2-expressing cells in the presence of 10 µM CBD (n = 9). (E) Q10 values calculated from data in (A–D). The circles denote the values for individual experiments, and the mean ± SEM is shown as squares.
-
Figure 1—figure supplement 2—source data 1
Current–temperature relations and Q10 values.
- https://cdn.elifesciences.org/articles/86166/elife-86166-fig1-figsupp2-data1-v1.xlsx
Figure 1—figure supplement 3
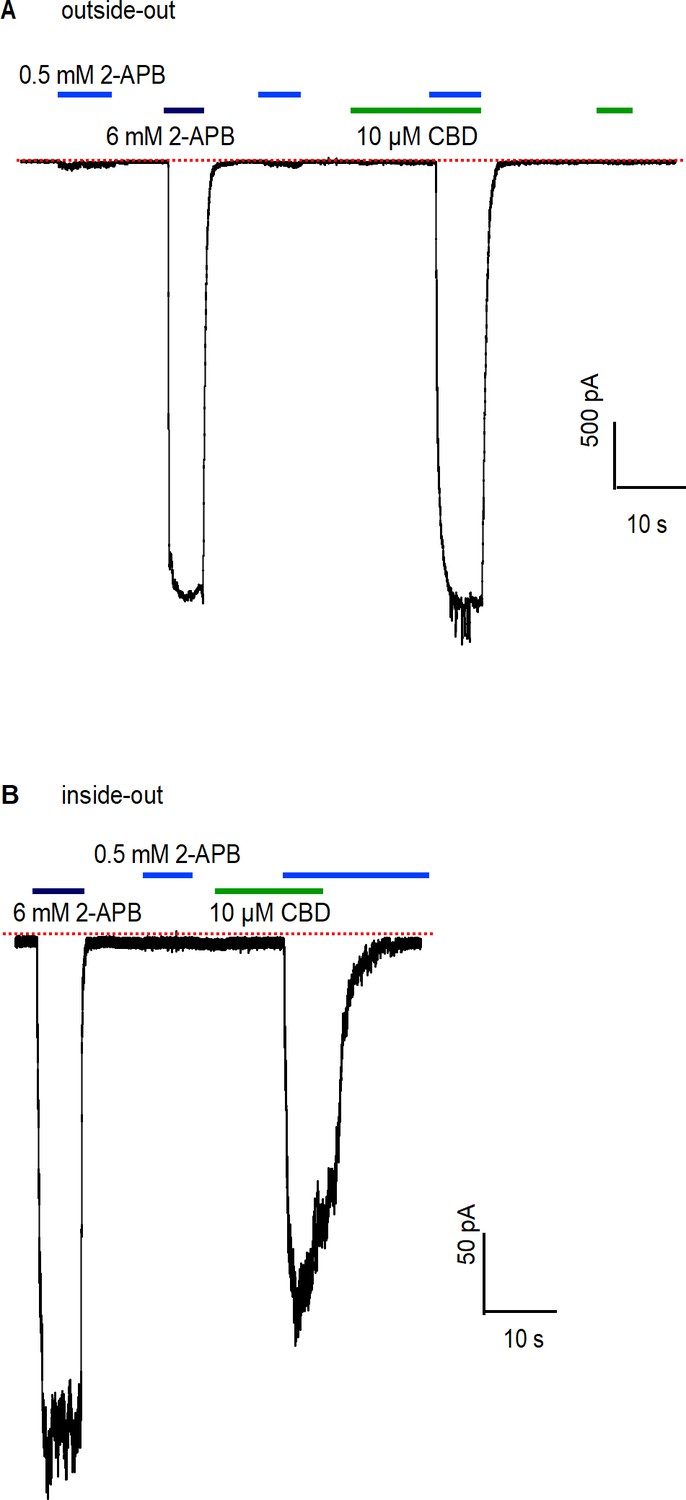
Sensitization of rTRPV2 channels by cannabidiol (CBD) observed in excised membrane patches.
(A) Representative gap-free recording at –80 mV obtained from an outside-out patch expressing rTRPV2 channels. The colored horizontal lines denote the duration of exposures to test compounds. The red dotted line denotes the zero-current level. Group data shown in Figure 1H. (B) Representative gap-free recording at –80 mV obtained from an inside-out patch expressing rTRPV2 channels. Group data shown in Figure 1H.
Figure 2
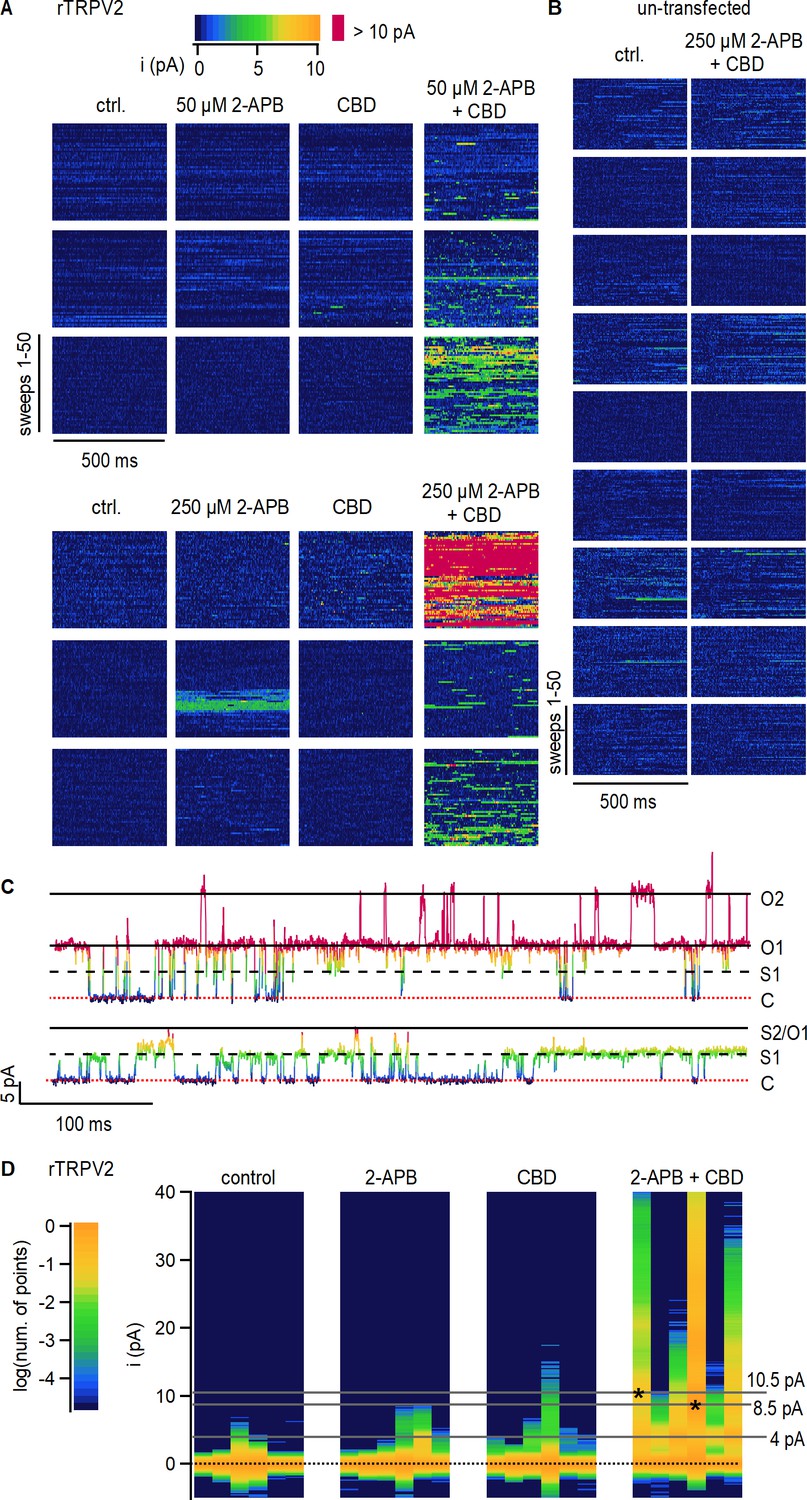
Cannabidiol (CBD) sensitization of rTRPV2 channels involves an increase in open probability.
(A) Data obtained from six rTRPV2-expressing inside-out patches at +80 mV under conditions of low open probability. Each row of data blocks shows data from a different patch, and columns are for each of the different experimental conditions. Each data block contains 50 vertically stacked current sweeps of 500 ms duration. Data points at each sweep are colored by their current amplitude as indicated by the color bar at the top. (B) Data obtained from nine inside-out patches at +80 mV obtained from un-transfected cells, displayed as in (A). (C) Representative current traces from the same rTRPV2-expressing patch in the presence of 50 µM 2-aminoethoxydiphenyl borate (2-APB) and 10 µM CBD showing two distinct open current amplitudes (S1 and O1) and simultaneous opening of two channels (O2). Data points in each trace are colored as in (A). The red dotted line indicates the zero-current amplitude measured when all channels are closed. (D) All-points histograms for data in (A). Each vertical lane is a histogram, with the single-channel current amplitude bins along the y-axis and the number of points per bin shown as a log-scale color heatmap (see scale bar on the left) and normalized to the peak centered at 0 pA (black dotted line). Histograms from each patch are displayed in the same order as in (A). Asterisks at peak values of 8.5 or 10.5 pA indicate the patches where these single-channel amplitudes were observed.
Figure 3 with 6 supplements
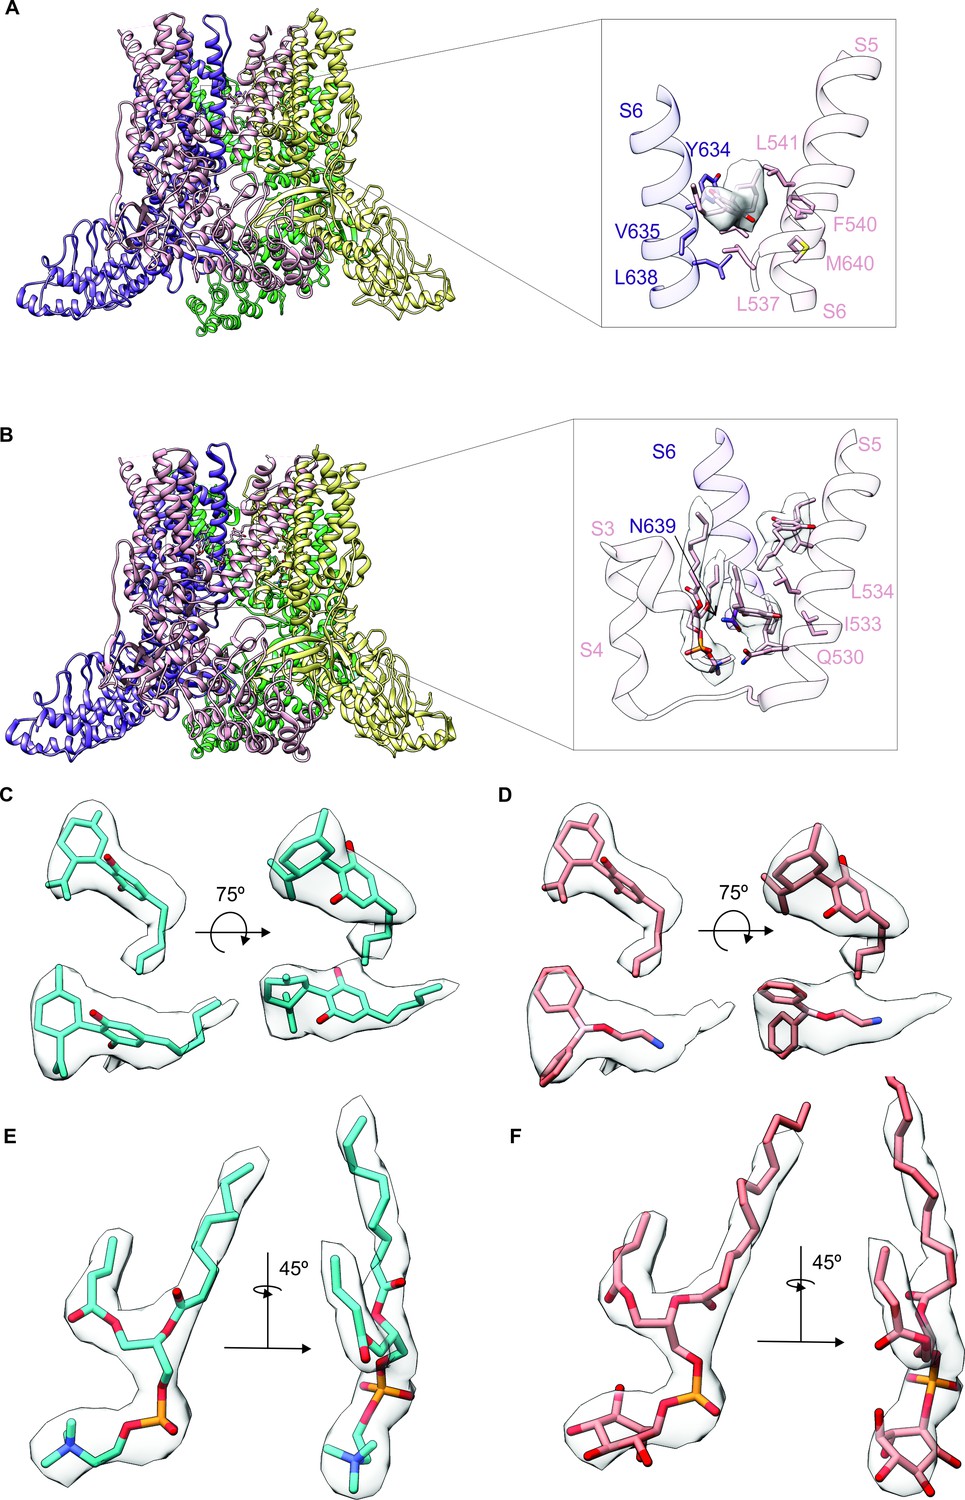
Identifying cannabidiol (CBD) binding sites in TRPV2.
(A) Overall structure of the rTRPV2 channel in lipid nanodiscs in conformation A with one CBD molecule bound to each monomer (PDB: 8SLX). Magnified view of the single CBD binding site is shown in the right panel. Both CBD and interacting residues are presented in stick with the cryo-EM density (EMD-40582) corresponding to CBD shown as a white surface. (B) Overall structure of the rTRPV2 channel in lipid nanodiscs in conformation B with two CBD molecules bound to each monomer (PDB: 8SLY). Magnified view of the two CBD binding sites are shown in the right panel. CBD with interacting residues and lipid were presented in stick configuration and cryo-EM density (EMD-40583) corresponding to CBD and lipid are shown as a white surface. (C) Cryo-EM density for the two CBD binding sites in conformation B modeled using CBD and shown in two orientations. The top density corresponds to that closer to the extracellular side of the channel and the bottom towards the intracellular side. (D) Same cryo-EM densities shown in (C), but in this case modeling the more intracellular density using 2-aminoethoxydiphenyl borate (2-APB). (E) Cryo-EM density for the lipid near the more intracellular CBD binding site fitted with 1-palmitoyl-2-oleoyl-sn-glycero-3-phosphocholine (POPC). (F) Same cryo-EM density shown in (E), but fitted with phosphatidylinositol.
Figure 3—figure supplement 1
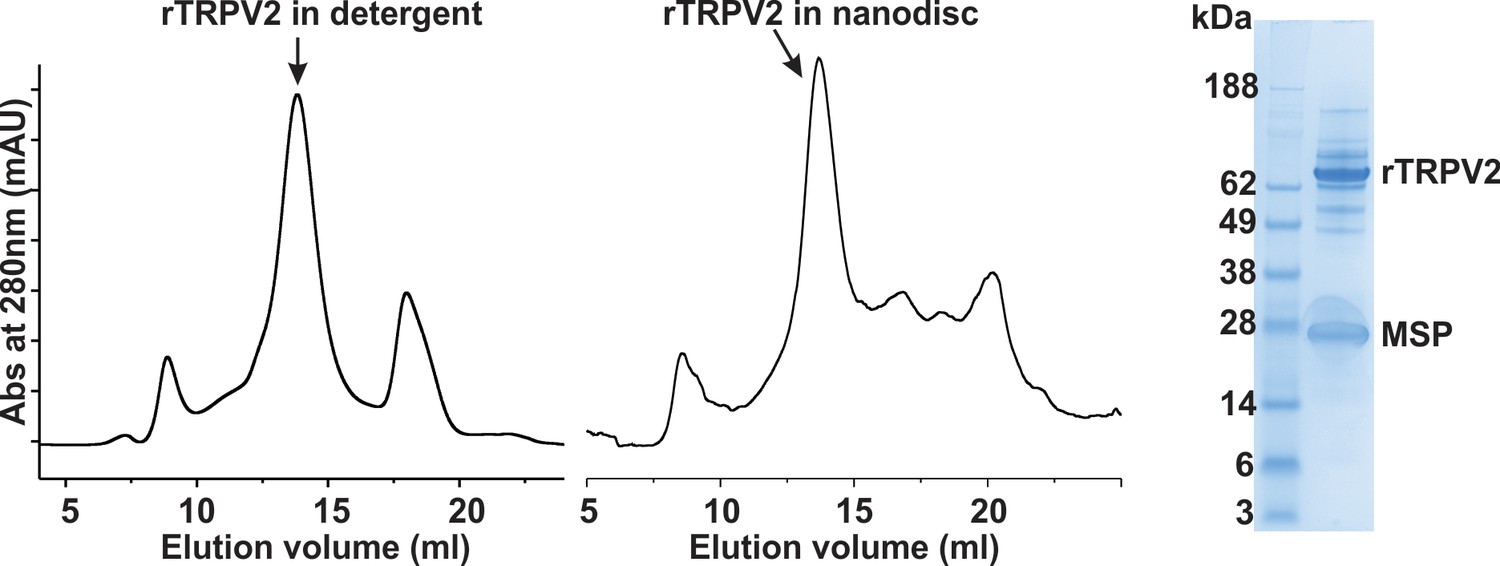
Biochemistry for rTRPV2.
Gel filtration chromatograms of the rTRPV2 in detergent (left), reconstituted into nanodisc using MSP1E3D1 (middle) and SDS-PAGE of rTRPV2 in nanodisc (see Figure 3—figure supplement 1—source data 1 for uncropped gel image).
-
Figure 3—figure supplement 1—source data 1
Uncropped SDS-PAGE of rTRPV2 in nanodisc.
- https://cdn.elifesciences.org/articles/86166/elife-86166-fig3-figsupp1-data1-v1.pdf
Figure 3—figure supplement 2
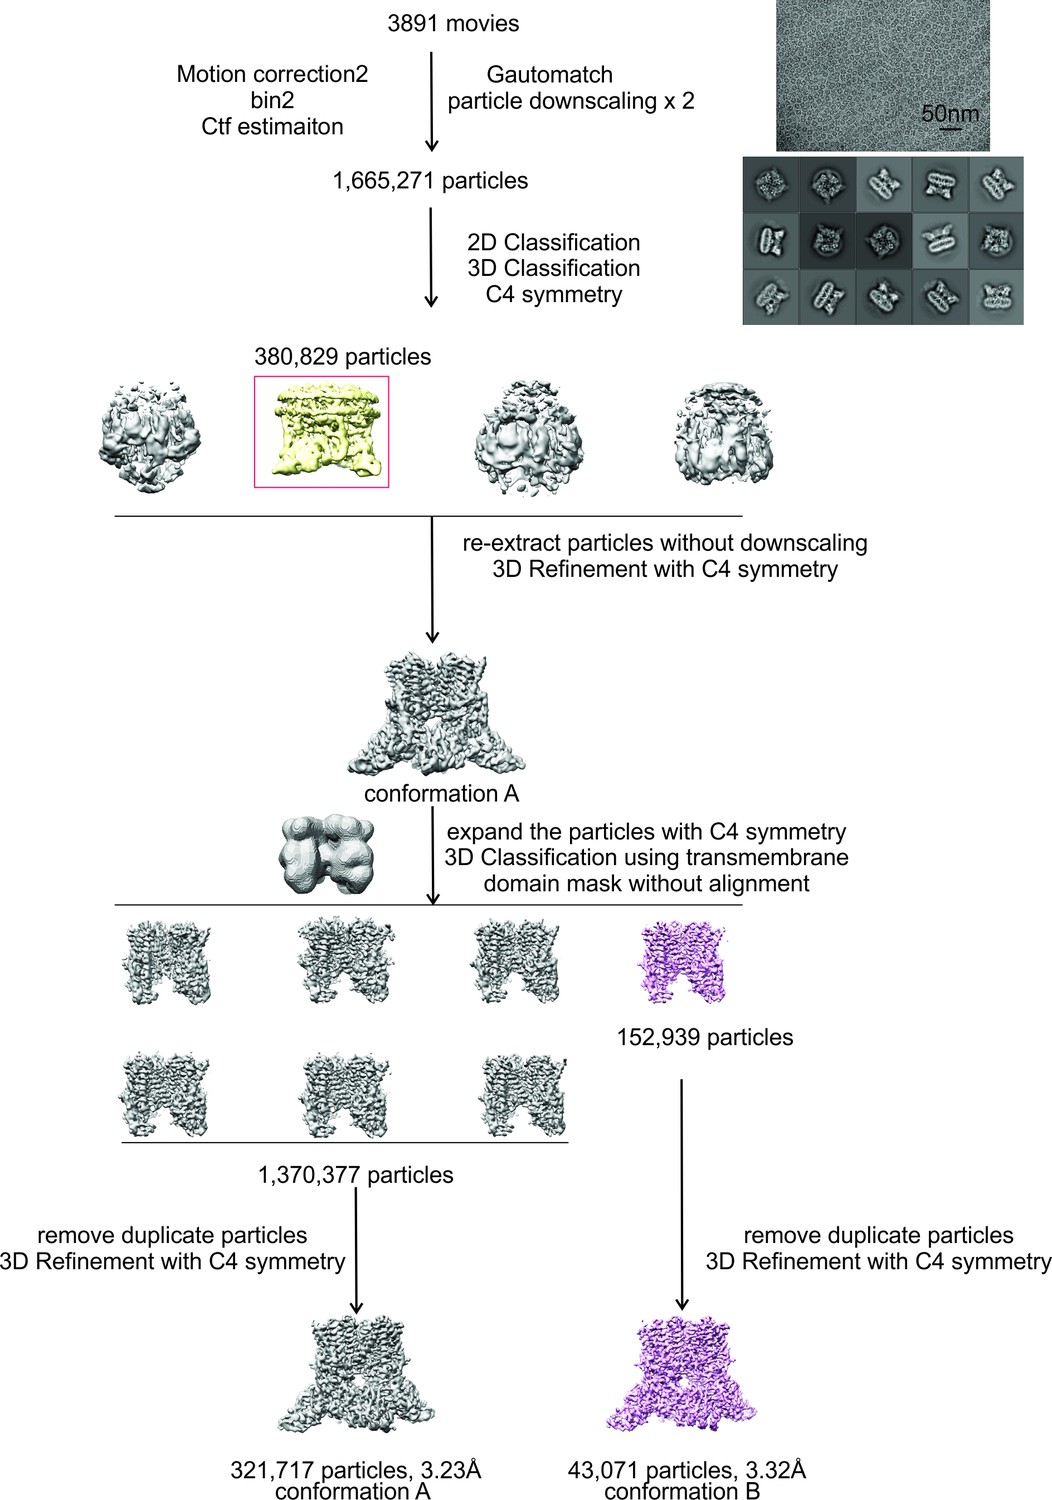
Data processing workflow for the cryo-EM structures of rTRPV2 in conformations A and B.
Figure 3—figure supplement 3
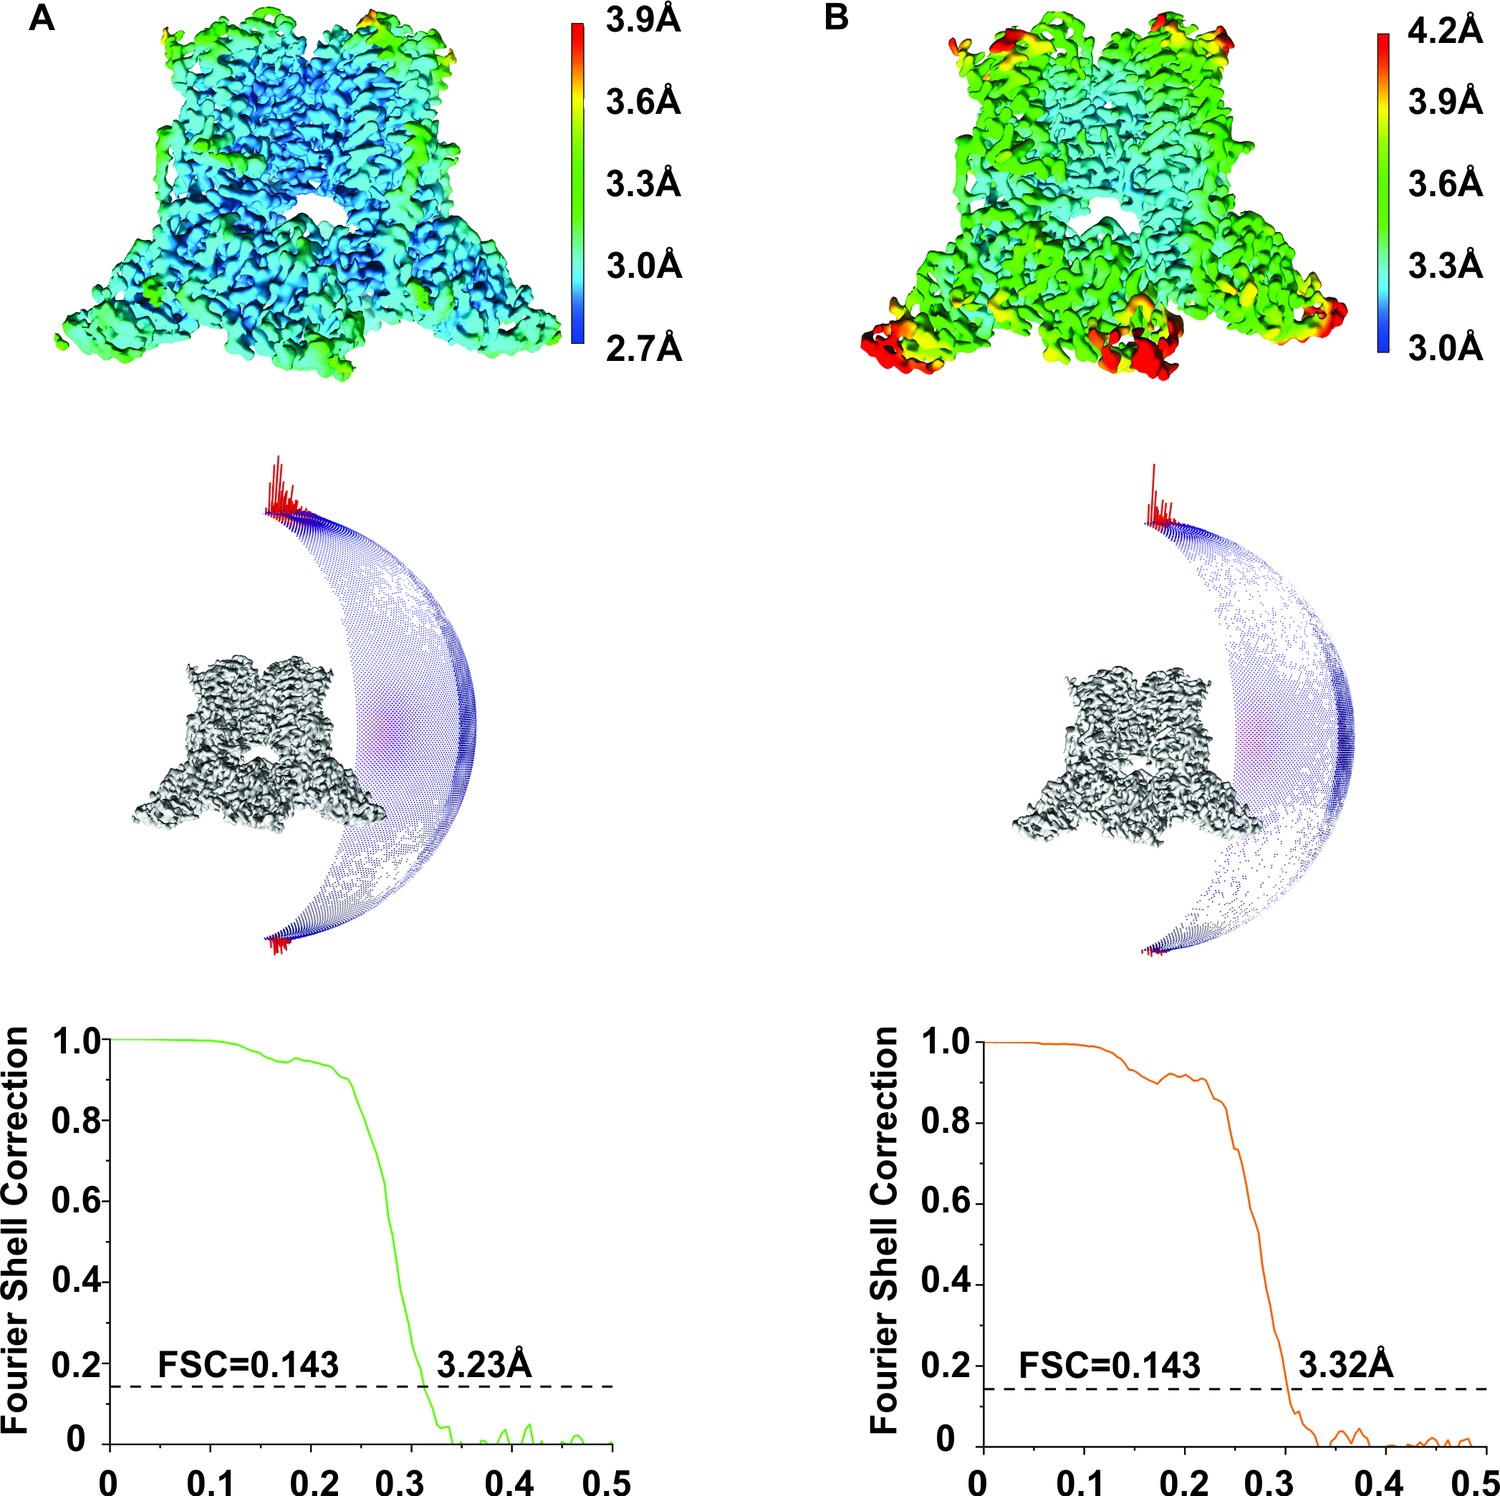
Cryo-EM imaging of rTRPV2.
(A) Local resolution map for the entire TM region (top), direction distribution plots of the 3D reconstruction (middle) and Fourier shell correlation (FSC) curves for rTRPV2 conformation A. (B) Local resolution map for rTRPV2 (top), direction distribution plots of the 3D reconstruction (middle) and FSC curves for rTRPV2 conformation B.
Figure 3—figure supplement 4
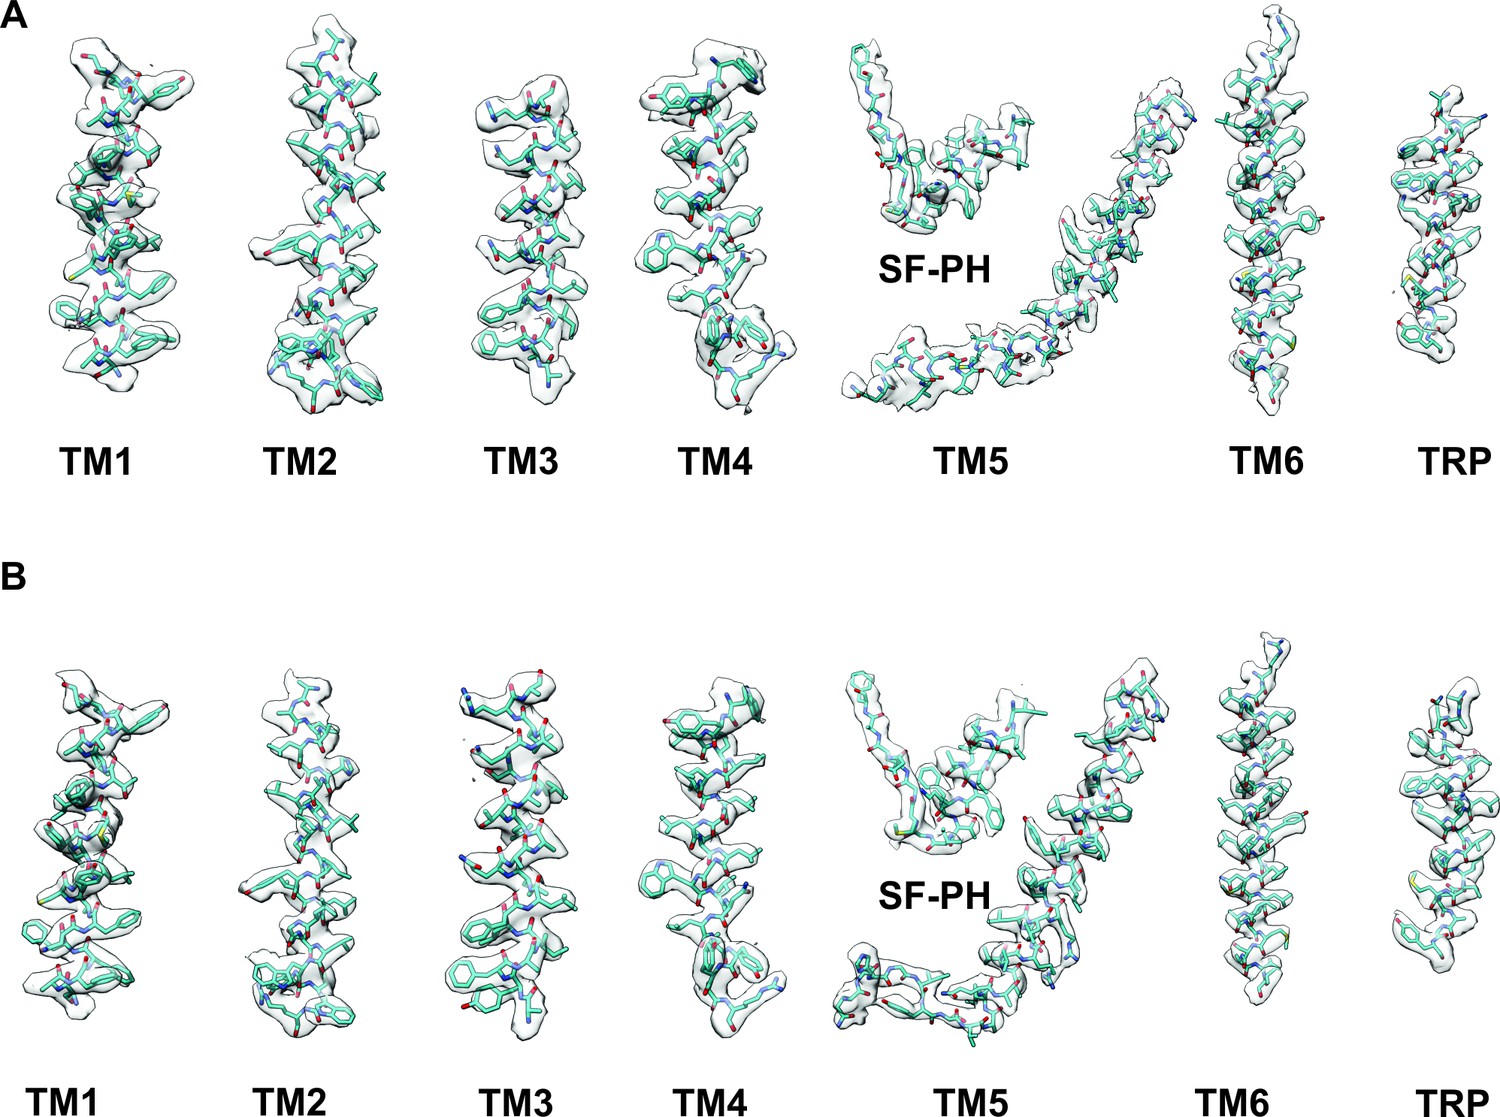
Cryo-EM density for rTRPV2.
Regional cryo-EM densities are shown for conformation A (A) and conformation B (B).
Figure 3—figure supplement 5
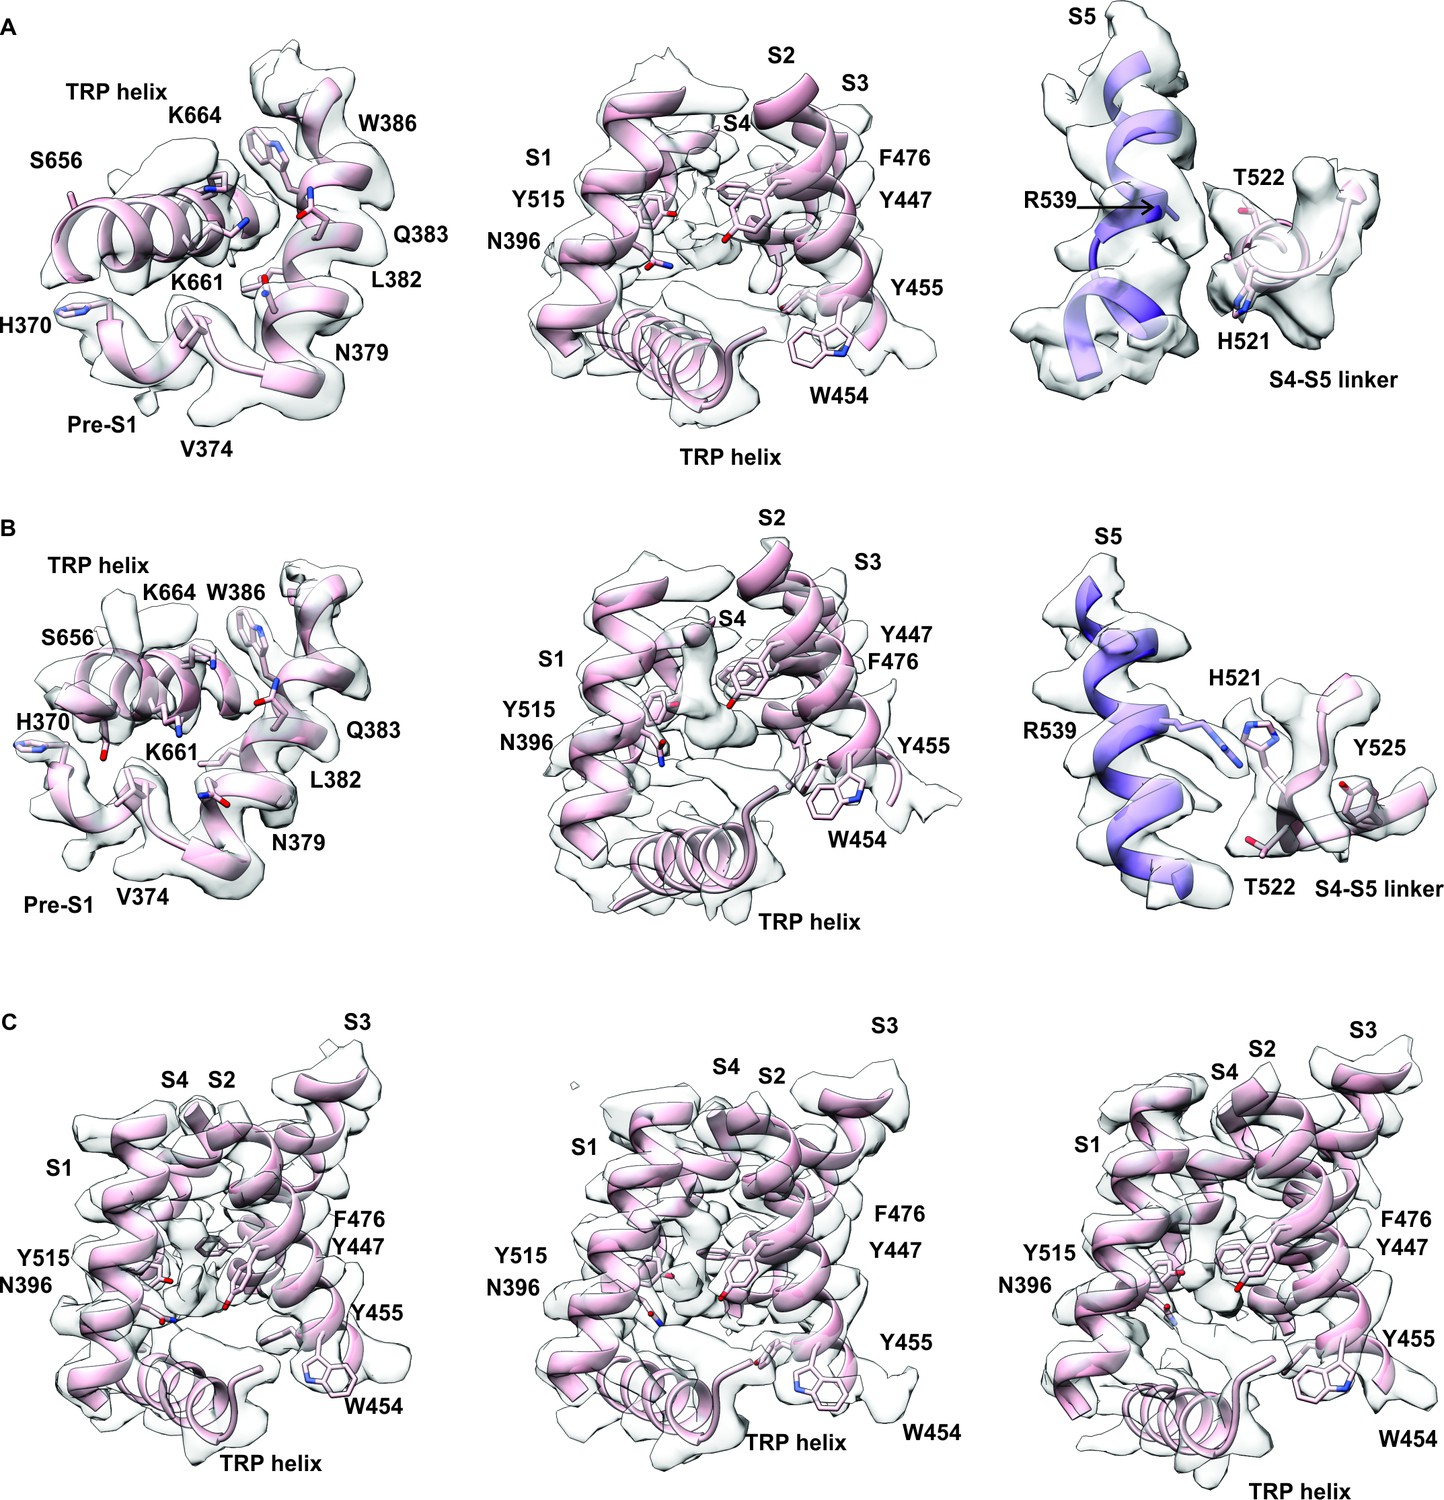
Unassigned cryo-EM density for rTRPV2 conformations A and B in regions where density has been assigned to 2-aminoethoxydiphenyl borate (2-APB) in TRPV2 and TRPV3 channels.
(A) Left: region of rTRPV2 conformation A where 2-APB was assigned in site 1 for TRPV3 (PDB: 6DVZ) (Singh et al., 2018b; Singh et al., 2018a; Zubcevic et al., 2019). (Middle) Region of rTRPV2 conformation A where 2-APB was assigned in site 2 for TRPV3 (PDB: 6DVZ). The extra density can also be found in the structure of TRPV2 without 2-APB added (PDB: 6U8A) (Pumroy et al., 2019). Right: region of rTRPV2 conformation A where 2-APB was assigned in rTRPV2 (PDB: 7NOM) (Pumroy et al., 2022). (B) Left: region of rTRPV2 conformation B where 2-APB was assigned in site 1 for TRPV3 (PDB: 6DVZ). Middle: region of rTRPV2 conformation B where 2-APB was assigned in site 2 for TRPV3 (PDB: 6DVZ). The extra density can also be found in the structure of TRPV2 without 2-APB added (PDB: 6U8A). Right: region of rTRPV2 conformation B where 2-APB was assigned in rTRPV2 (PDB: 7N0M). (C) Extra density within S1-S4 domains can be found in (left) apo-form TRPV2 (PDB: 6U84); (middle) TRPV2 with CBD (PDB:6U8A); and (right) TRPV2 with 2-APB (PDB: 7N0M).
Figure 3—figure supplement 6
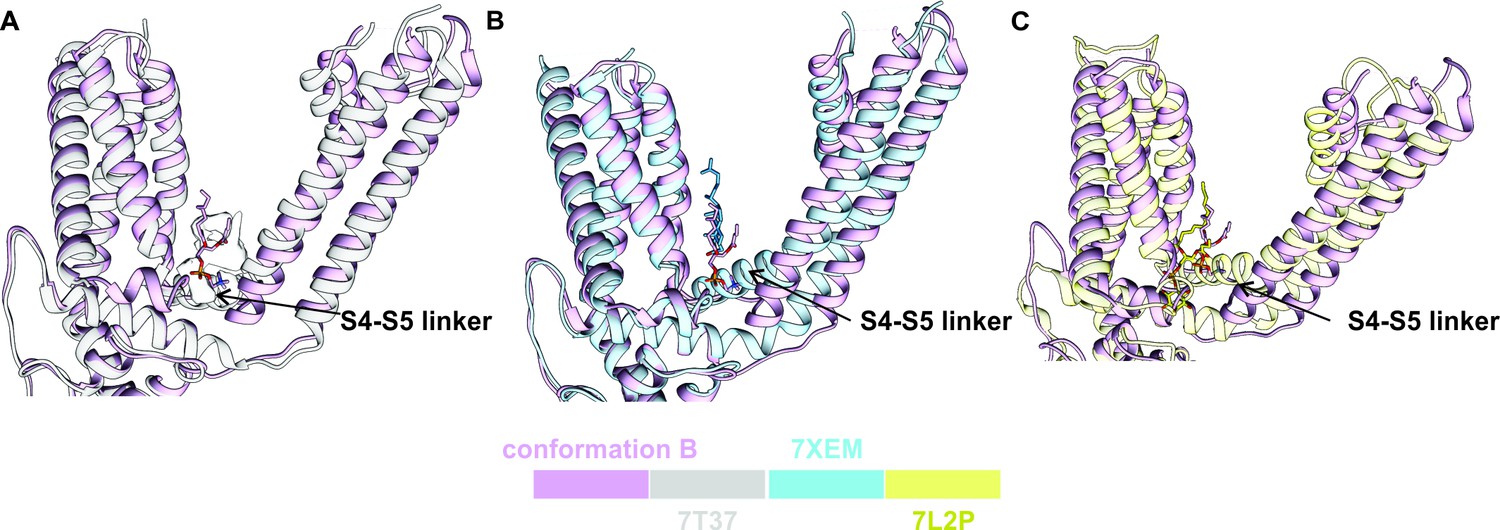
Structural comparison of lipids in the vanilloid pocket.
(A) Comparison between conformation B and TRPV2 in the presence of 2-aminoethoxydiphenyl borate (2-APB) and cannabidiol (CBD) (PDB: 7T37). Lipid in conformation B is shown in stick and density attributed to lipid in 7T37 is presented as a white surface. (B) Comparison between conformation B and TRPV2 with cholesterol bound (PDB: 7XEM). Lipids in vanilloid pocket are shown in stick. (C) Comparison between conformation B and TRPV1 apo form (PDB: 7L2P). Lipids in the vanilloid pocket are presented in stick.
Figure 4
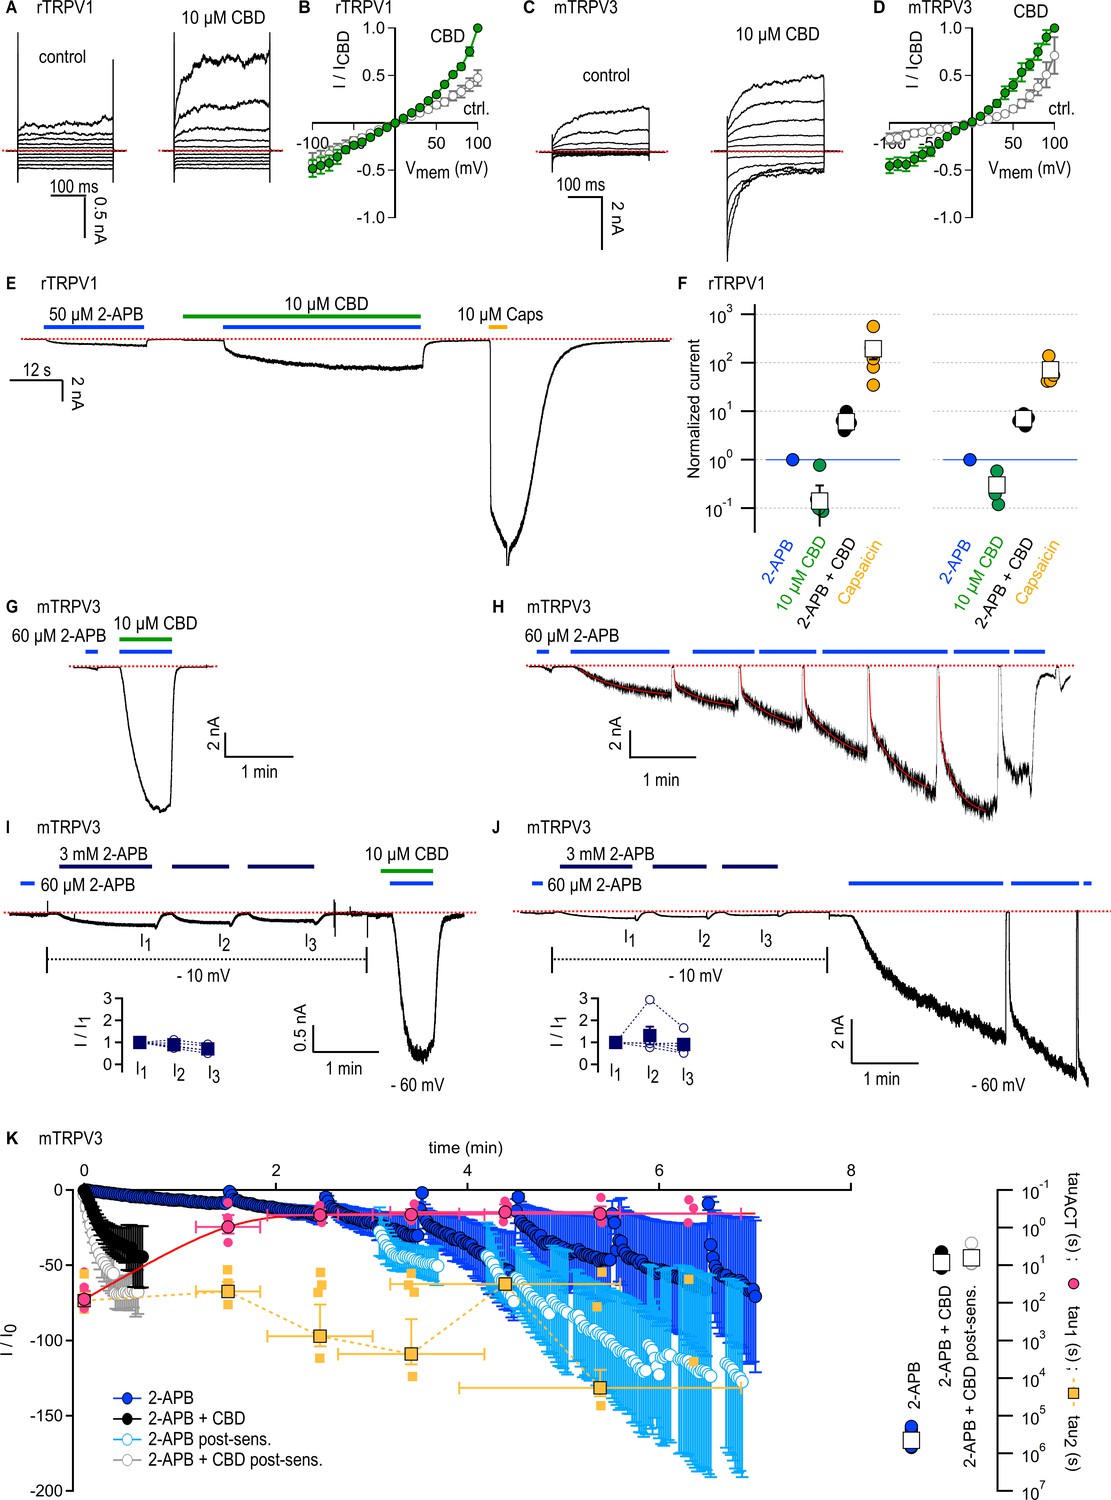
Cannabidiol (CBD) sensitizes rTRPV1 channels weakly and mTRPV3 channels strongly to activation by 2-aminoethoxydiphenyl borate (2-APB).
(A) Representative whole-cell current families obtained from rTRPV1 expressing cells in control or in the presence of 10 µM CBD. Currents were elicited by voltage steps from –100 to +100 mV. The red dotted line denotes the zero-current level. (B) Steady-state current–voltage relations obtained from data as in (A) and normalized to the steady-state current magnitude at +100 mV in CBD. Data is shown as mean ± SEM (n = 6). (C) Representative whole-cell current families from mTRPV3-expressing cells obtained as in (A). (D) Steady state mTRPV3 channel current–voltage relations obtained from data as in (C) (mean ± SEM, n = 7). (E) Representative whole-cell recording at –80 mV obtained from an rTRPV1-expressing cell. (F) Group data from experiments as in (E) obtained using 10 or 40 µM CBD, leak-subtracted and normalized to the current magnitude measured at steady state during the first stimulation with 50 µM 2-APB, denoted by the horizontal blue line. Data are shown as mean ± SEM (squares, 10 µM CBD, n = 6; 40 µM CBD, n = 5) or as individual cells (circles). (G) Representative whole-cell gap-free recording at –60 mV obtained from a cell expressing mTRPV3 channels stimulated with 2-APB and CBD. The first exposure to 2-APB alone (10 s duration) was used for normalization. (H) Representative experiment showing repeated stimulation with 2-APB. The first exposure to 2-APB (10 s duration) was used for normalization. Red curves are fits to a double-exponential function of time, with resulting fast (tau1) and slow (tau2) time constants in magenta and yellow superposed to the mean time-course in (K). (I, J) Representative experiments at – 60 mV for sensitized responses to (I) 2-APB and CBD or (J) 2-APB alone measured after three exposures to 3 mM 2-APB applied at –10 mV to preserve patch integrity (dotted black lines). The first exposure to 60 µM 2-APB (10 s duration) was used for normalization. The inset shows current amplitudes at each stimulation with 3 mM 2-APB (filled squares, mean ± SEM; empty circles, data from individual cells, n = 5). (K) Mean time courses for mTRPV3 channel activation by 60 µM 2-APB in the absence (blue symbols) or presence of 10 µM CBD (black symbols), measured in experiments as in (G) and (H), as well as sensitized responses to 2-APB (light blue symbols) or 2-APB + CBD (gray symbols) measured as in (I) and (J). The time course for the sensitized response to 2-APB alone does not start at t = 0 to account for the sensitizing exposures to 3 mM 2-APB. Data are shown as mean ± SEM (n = 5 for each condition). Data were fit to a mono-exponential function of time, with time constants shown on the right inset as mean ± SEM (open squares) or data from individual cells (circles). The yellow and magenta symbols are the time constants obtained from double-exponential fits to each stimulation by 2-APB over the course of experiments as in (H). Data is shown as mean ± SEM (symbols with black outline) as well as fits from each individual cell (smaller symbols without outline). The magenta curve is a fit to a mono-exponential function.
-
Figure 4—source data 1
Excel file with group data from electrophysiological recordings shown in Figure 4B and D.
- https://cdn.elifesciences.org/articles/86166/elife-86166-fig4-data1-v1.xlsx
-
Figure 4—source data 2
Excel file with group data from electrophysiological recordings shown in Figure 4F.
- https://cdn.elifesciences.org/articles/86166/elife-86166-fig4-data2-v1.xlsx
-
Figure 4—source data 3
Excel file with group data from electrophysiological recordings show in Figure 4I–K.
- https://cdn.elifesciences.org/articles/86166/elife-86166-fig4-data3-v1.xlsx
Figure 5 with 1 supplement
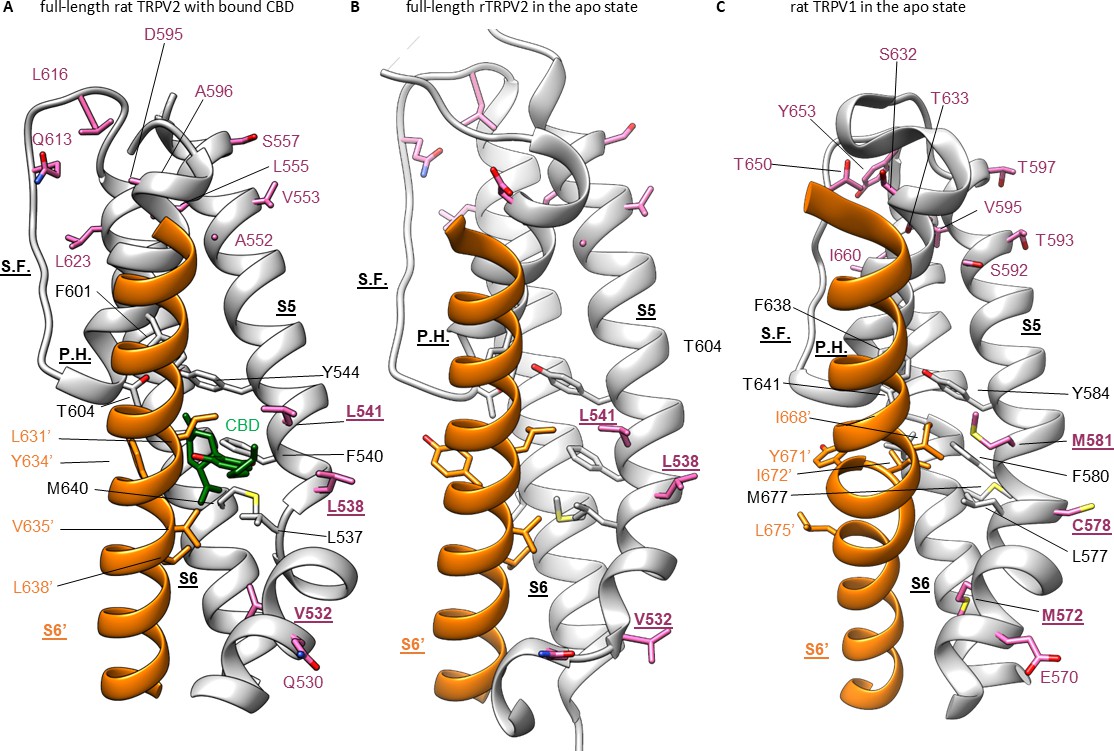
Cannabidiol (CBD) binding site in TRPV2 channels and its conservation in TRPV1 channels.
(A) Structure of full-length rTRPV2 in nanodiscs with CBD bound in conformation A (with one CBD per subunit; PDB: 8SLX). The S6 helix from one subunit is shown in orange, and in the adjacent subunit the S5 and S6 helices, the selectivity filter (S.F.), the pore-helix (P.H.), and the S4-S5 linker helix are shown in gray. Residues near the CBD site are shown in stick representation, and the bound CBD molecule in green. Residues that are similar in rTRPV2 and mTRPV3 channels but different in rTRPV1 channels are shown in purple. (B) Structure of apo full-length rTRPV2 in nanodiscs (PDB: 6U84) (Pumroy et al., 2019). Same color coding as in (A). (C) Structure of apo rTRPV1 (PDB: 5IRZ) (Gao et al., 2016b) depicting the CBD binding region from rTRPV2. Same color coding as in (A) and (B).
Figure 5—figure supplement 1
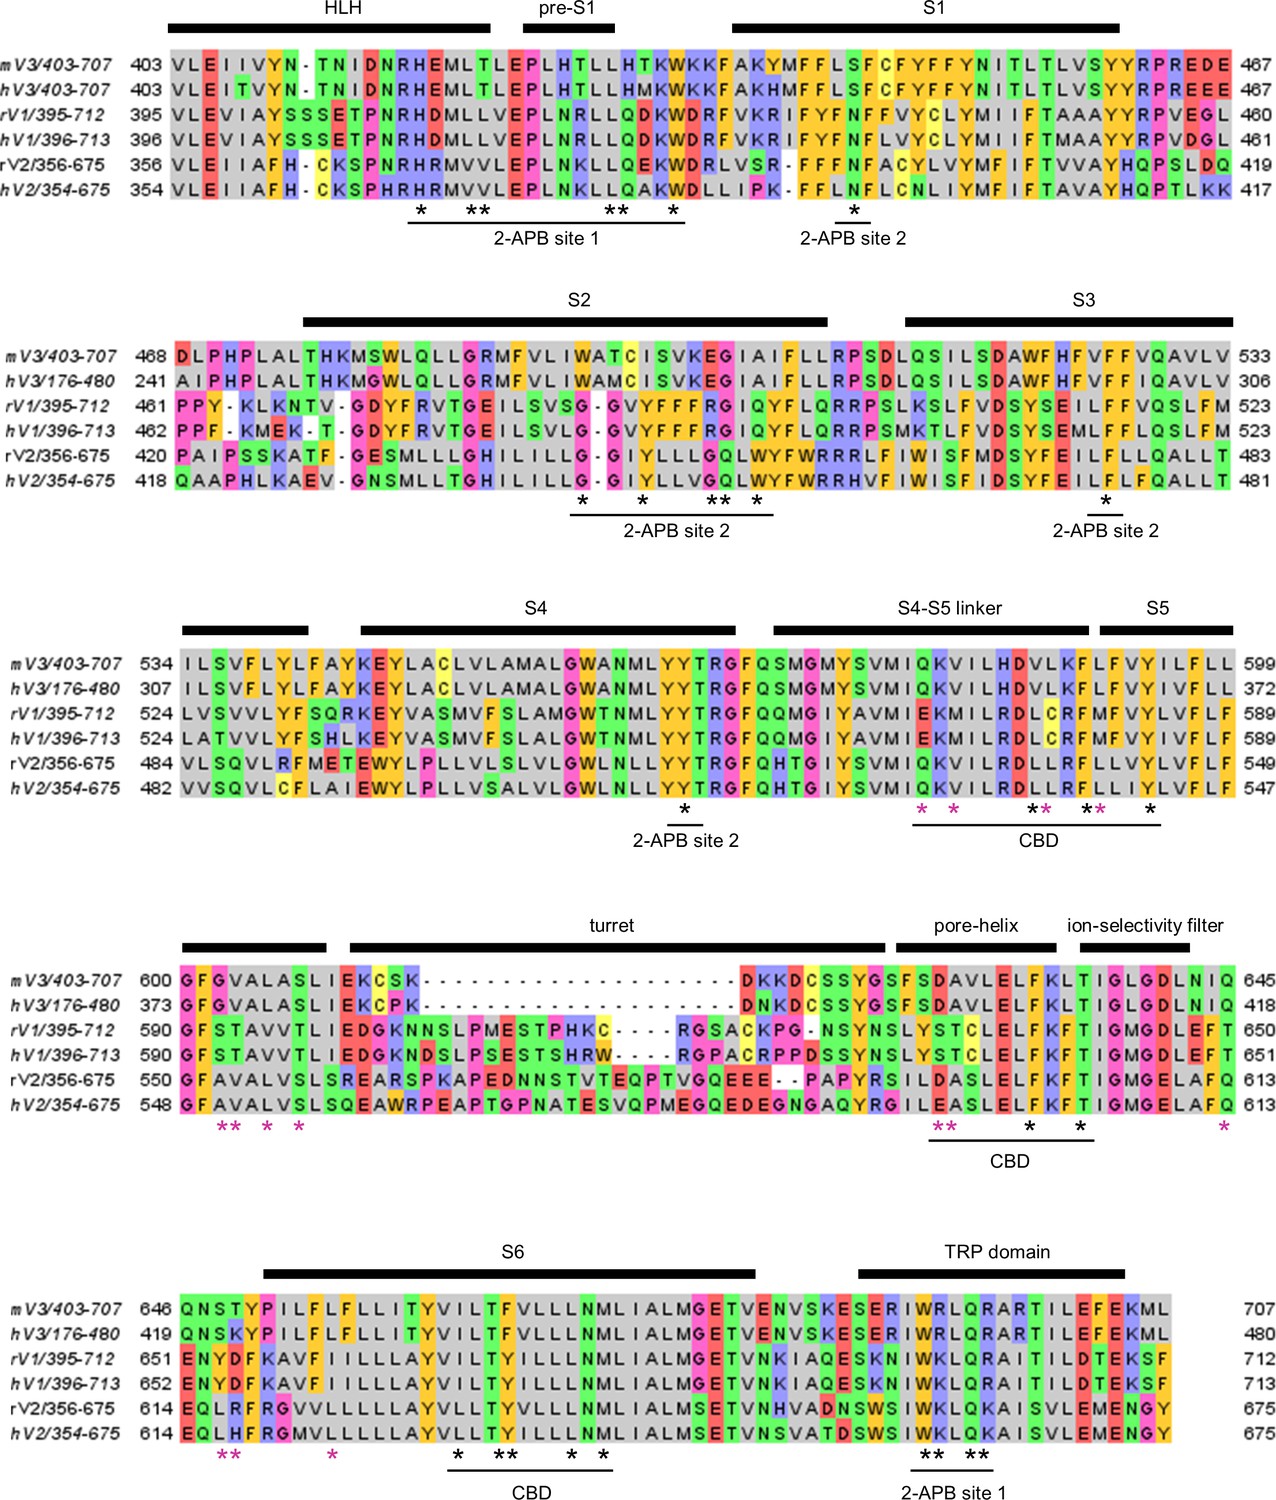
Sequence alignment of rodent and human TRPV1-3 orthologues.
Primary sequence alignment encompassing the pre-S1 helix-loop-helix motif to the TRP helix in rat TRPV2 (rV2), human TRPV2 (hV2), rat and human TRPV1 (rV1 and hV1), and mouse and human TRPV3 (mV3 and hV3). Residues with distinct physical–chemical properties are shown in different colors. All side chains depicted in Figure 5 are highlighted with asterisks, with purple asterisks denoting side chains that are similar between rTRPV2 and mTRPV3 channels and distinct in rTRPV1 – these positions in purple were mutated in rTRPV1 channel constructs in Figure 7.
Figure 6 with 3 supplements
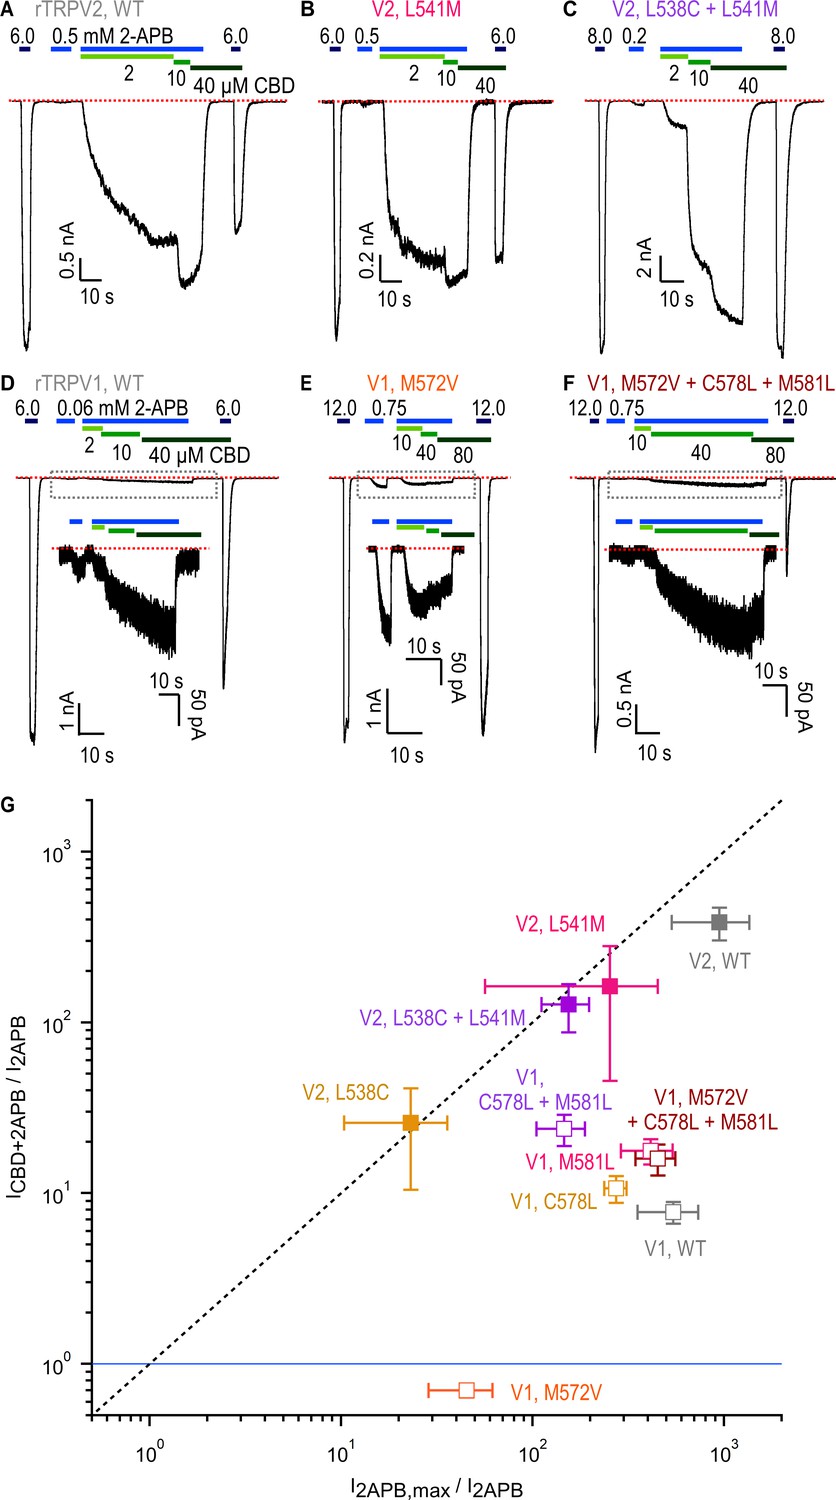
Role of non-conserved residues at the cannabidiol (CBD) site in determining rTRPV1 and rTRPV2 channel sensitivity to CBD and 2-aminoethoxydiphenyl borate (2-APB).
(A–C) Representative gap-free whole-cell recordings at –80 mV obtained from cells expressing WT or mutant rTRPV2 channels. Horizontal bars denote the time of exposure to 2-APB (blue bars, mM concentrations) or CBD (green bars, µM concentrations). The red dotted line denotes the zero-current level. (D–F) Representative gap-free whole-cell recordings at –80 mV obtained from cells expressing WT or mutant rTRPV1 channels. Insets show a magnified view of the portion of the time courses contained within the dotted rectangles. (G) Leak-subtracted group data for WT and mutant rTRPV1 (empty symbols) and rTRPV2 (filled symbols) channels obtained from experiments as in (A–F) relating the response to a low concentration of 2-APB (I2APB) to either the maximal response to the same agonist (I2APB,max/I2APB, horizontal axis) or the sensitized response measured at the highest concentration of CBD in each experiment (ICBD+2APB/I2APB, vertical axis). The blue horizontal line denotes ICBD+2APB/I2APB = 1 (i.e. no sensitized response), and the dashed vertical line denotes ICBD+2APB/I2APB = I2APB,max/I2APB. Data are shown as mean ± SEM (WT rTRPV2, n = 4; L538C, n = 4 ; L541M, n = 4; L538C+L541M, n = 4; WT rTRPV1, n = 5; M572V, n = 5; C578L, n = 5; M581L, n = 5; C578L+M581L, n = 5; M572V+C578L+M581L, n = 6). All group data for measurements in experiments as in (A–F) are shown in Figure 6—figure supplement 2.
Figure 6—figure supplement 1
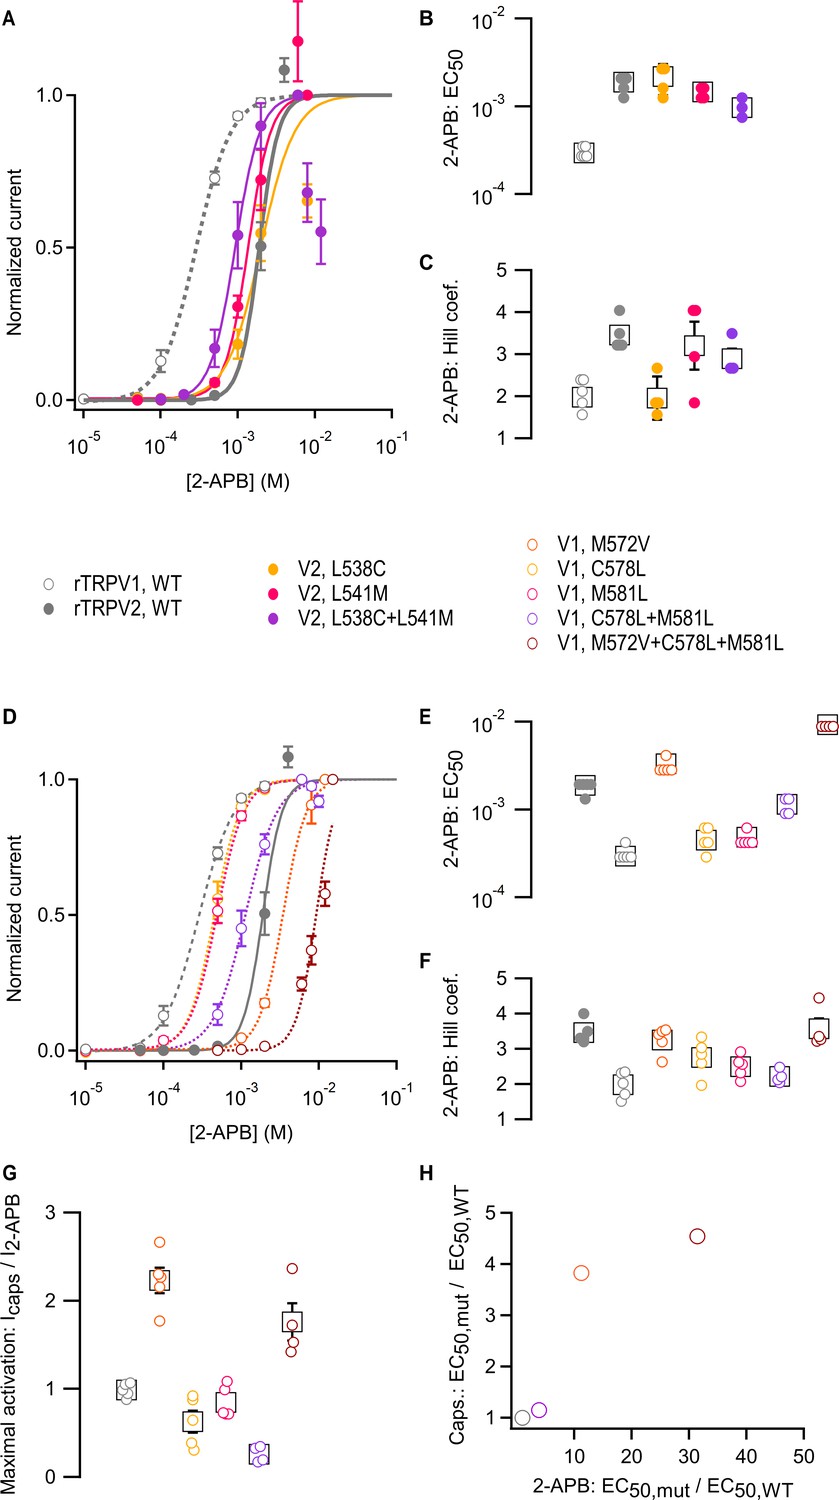
Effects of mutations at non-conserved residues at the cannabidiol (CBD) site on rTRPV1 and rTRPV2 channel sensitivity to agonists.
(A) Dose–response relations for activation by 2-aminoethoxydiphenyl borate (2-APB) for WT and mutant rTRPV2 channels, including also WT rTRPV1 for comparison. Data is shown as mean ± SEM and curves are fits to the Hill equation. Fit parameters are shown in (B, EC50) and (C, Hill coefficients nH) with values: WT rTRPV2, EC50 = 1.88 ± 0.15 mM, nH = 3.46 ± 0.14, n = 5; L538C, EC50 = 2.18 ± 0.84 mM, nH = 1.95 ± 0.51, n = 4; L541M, EC50 = 1.46 ± 0.17 mM, nH = 3.2 ± 0.57, n = 4; L538C+L541M, EC50 = 0.97 ± 0.18 mM, nH = 2.9 ± 0.24, n = 3. Mean ± SEM for fit parameters are shown as black squares, and data from individual experiments as colored circles. (D) Dose–response relations for activation by 2-APB for WT and mutant rTRPV1 channels. Data is shown as mean ± SEM and curves are fits to the Hill equation. Fit parameters are shown in (E, EC50) and (F, Hill coefficients nH) with values: WT rTRPV1, EC50 = 0.294 ± 0.023 mM, nH = 1.98 ± 0.16, n = 5; M572V, EC50 = 3.3 ± 0.2 mM, nH = 3.25 ± 0.17, n = 5; C578L, EC50 = 0.447 ± 0.047 mM, nH = 2.76 ± 0.23, n = 5; M581L, EC50 = 0.485 ± 0.036 mM, nH = 2.5 ± 0.14, n = 5; C578L+M581L, EC50 = 1.15 ± 0.14 mM, nH = 2.21 ± 0.1, n = 4; M572V+C578L+M581L, EC50 > 9.5 ± 0.5 mM, nH = 3.6 ± 0.3, n = 4. Mean ± SEM for fit parameters are shown as black squares, and data from individual experiments as colored circles. (G) Ratios for leak-subtracted currents elicited by maximally activating concentrations of capsaicin relative to 2-APB for WT and mutant rTRPV1 channels. Data shown as mean ± SEM (black squares, n = 4–5) or as values from individual experiments (open circles). (H) Ratios of mean EC50 values for activation by capsaicin or 2-APB for select rTRPV1 channel mutants relative to the EC50 from WT. Dose–response relations for capsaicin (not shown) were fit to the Hill equation with parameters: WT, EC50 = 0.264 ± 0.036 µM, nH = 1.59 ± 0.10, n = 5; M572V, EC50 = 1.01 ± 0.26 µM, nH = 1.8 ± 0.08, n = 4; C578L+M581L, EC50 = 0.303 ± 0.027 µM, nH = 1.47 ± 0.11, n = 4; M572V+C578L+M581L, EC50 = 1.20 ± 0.13 µM, nH = 2.22 ± 0.07, n = 4.
-
Figure 6—figure supplement 1—source data 1
Excel file with 2-aminoethoxydiphenyl borate (2-APB) dose–response relation data for rTRPV1 and rTRPV2 mutants.
- https://cdn.elifesciences.org/articles/86166/elife-86166-fig6-figsupp1-data1-v1.xlsx
-
Figure 6—figure supplement 1—source data 2
Excel file with group data from dose–response relations for capsaicin.
- https://cdn.elifesciences.org/articles/86166/elife-86166-fig6-figsupp1-data2-v1.xlsx
Figure 6—figure supplement 2
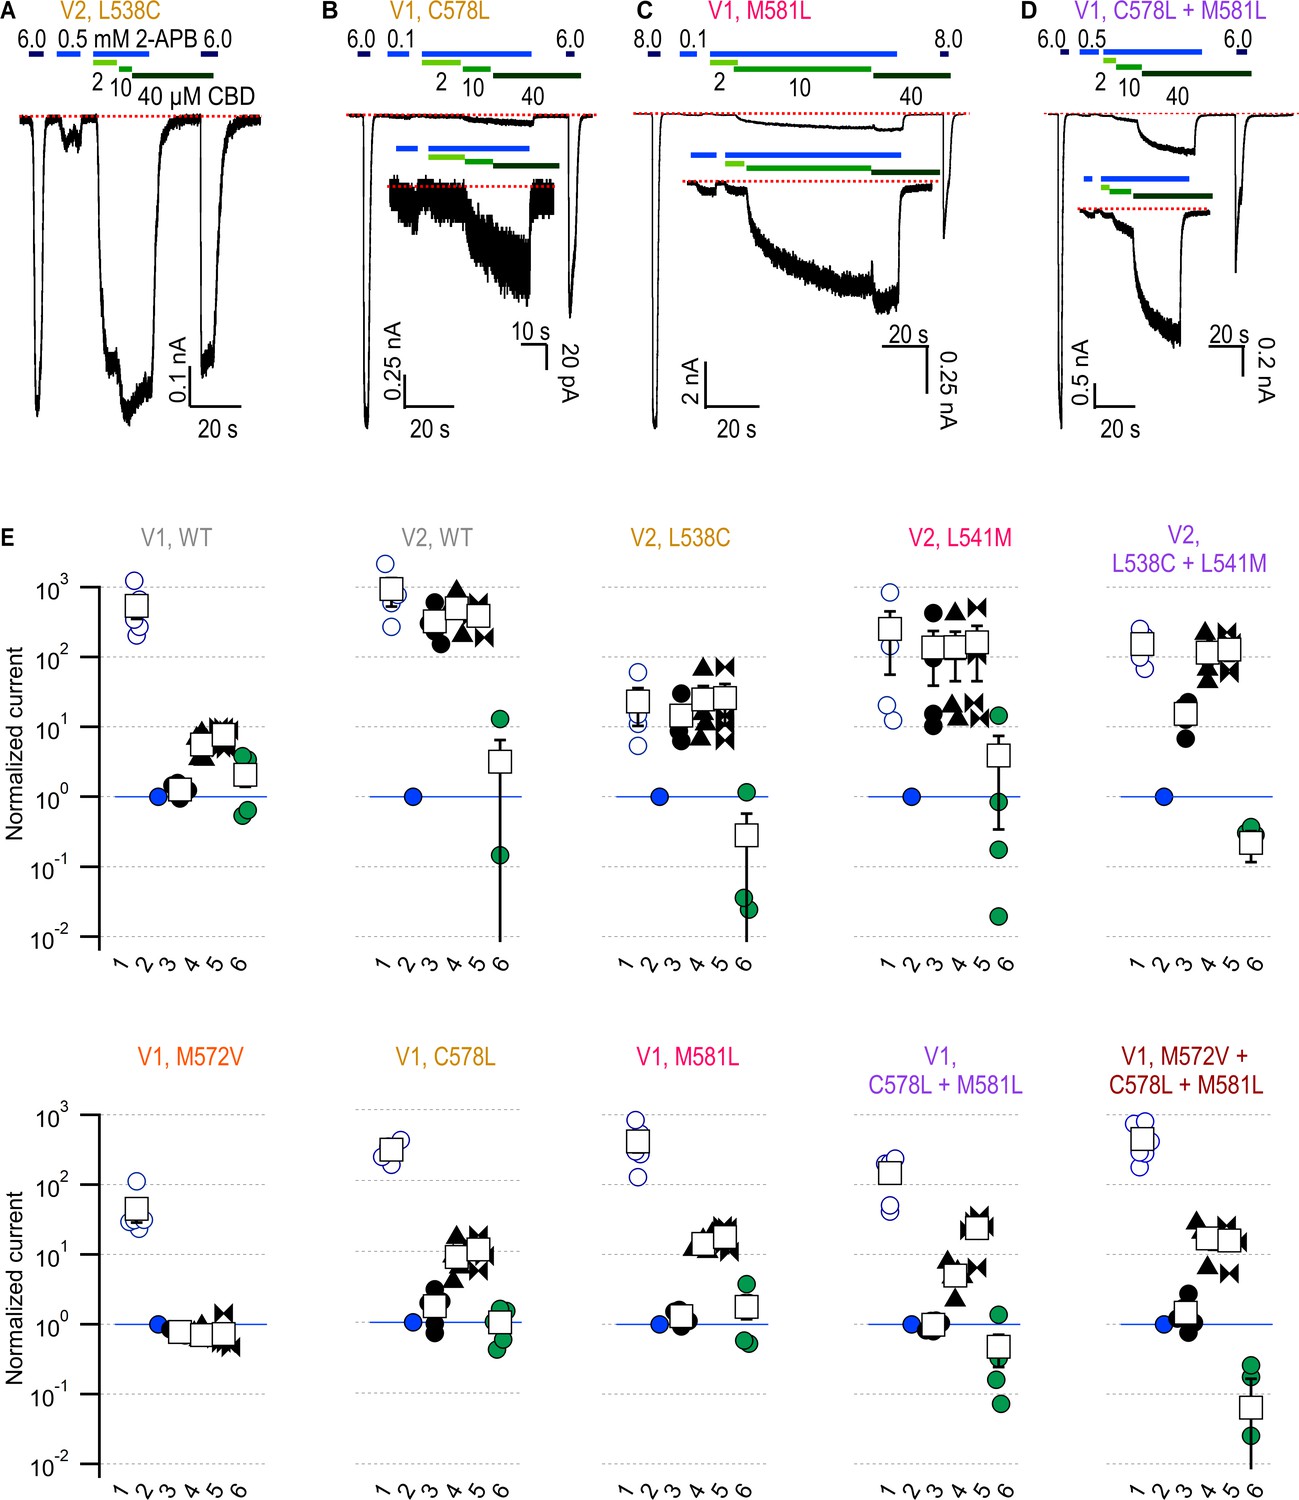
CBD-dependent sensitization in WT and mutant rTRPV1 and rTRPV2 channels.
(A–D) Representative gap-free whole-cell recordings at –80 mV obtained from cells expressing mutant rTRPV2 or rTRPV1 channels. Horizontal bars denote the time of exposure to 2-aminoethoxydiphenyl borate (2-APB) (blue bars, mM concentrations) or cannabidiol (CBD) (green bars, µM concentrations). The red dotted line denotes the zero-current level. The insets on some panels show magnified views of a portion of the experiment. (E) Group data for experiments as in (A–D) and Figure 6A–F for WT or mutant rTRPV1 and rTRPV2 channels. Data represents the leak-subtracted, steady-state current normalized by the non-sensitized response to a low concentration of 2-APB, denoted by the blue horizontal line, for the following conditions: (1) maximal 2-APB (I2APB,max); (2) non-sensitized response to a low concentration of 2-APB (I2APB); (3–5) sensitized response to 2-APB in the presence of three increasing concentrations of CBD (I2APB+CBD); (6) response to the largest concentration of CBD in the absence of 2-APB (ICBD). Data are shown as mean ± SEM (open squares; WT rTRPV1, n = 5; WT rTRPV2, n = 4; rTRPV2 L538C, n = 4; rTRPV2 L541M, n = 4; rTRPV2 L538C+L541M, n = 4; rTRPV1 M572V, n = 5; rTRPV1 C578L, n = 5; rTRPV1 M581L, n = 5; rTRPV1 C578L+M581L, n = 5; rTRPV1 M572V+C578L+M581L, n = 6), or as data from individual cells (circles).
-
Figure 6—figure supplement 2—source data 1
Excel file with group data from electrophysiological recordings of cannabidiol (CBD)-dependent sensitization for WT and mutant rTRPV1 and rTRPV2 channels.
- https://cdn.elifesciences.org/articles/86166/elife-86166-fig6-figsupp2-data1-v1.xlsx
Figure 6—figure supplement 3
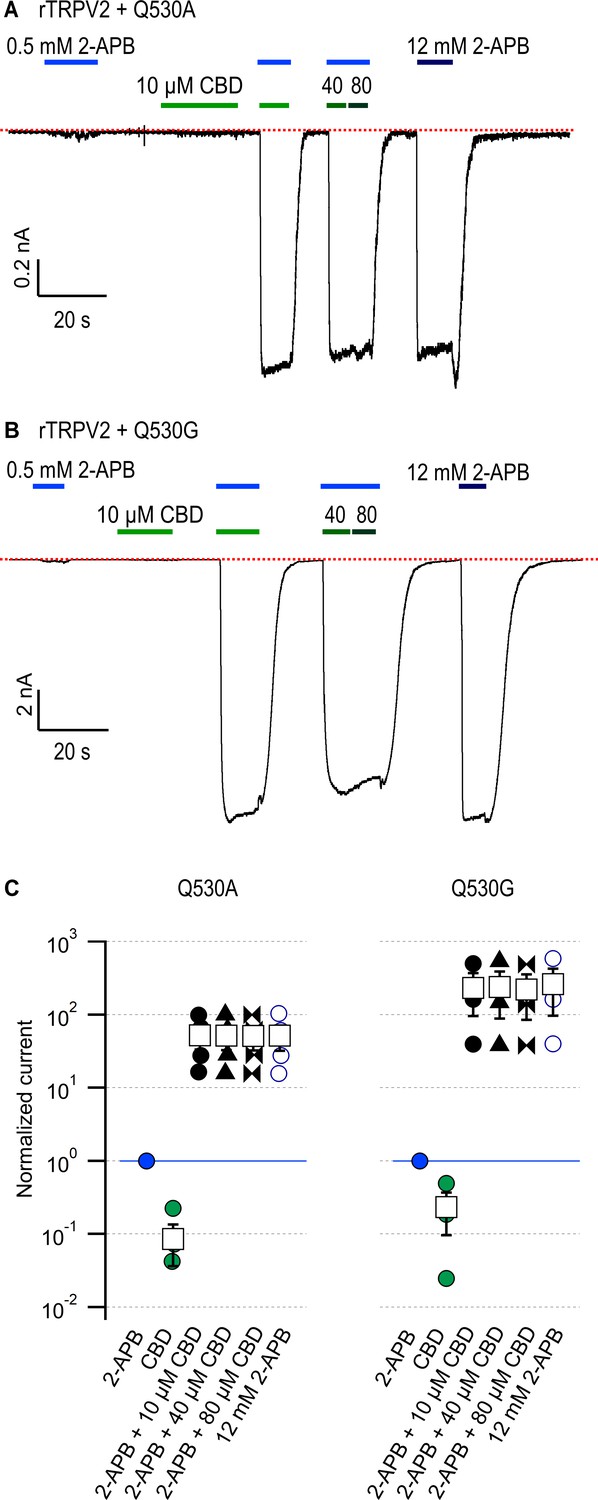
Mutations near the rTRPV2 channel cannabidiol (CBD) binding site 2 do not affect sensitization strength.
(A, B) Representative gap-free whole-cell recordings at –80 mV obtained from cells expressing rTRPV2 channels containing mutations (A) Q530A or (B) Q530G. Horizontal bars denote the time of exposure to 2-aminoethoxydiphenyl borate (2-APB) (blue bars, mM concentrations) or CBD (green bars, µM concentrations). The red dotted line denotes the zero-current level. (C) Group data for experiments as in (A) and (B). Data represents the leak-subtracted, steady-state current normalized by the non-sensitized response to a low concentration of 2-APB, denoted by the blue horizontal line, for the conditions listed on the figure. Data are shown as mean ± SEM (open squares; rTRPV2 Q530A, n = 4; rTRPV2 Q530G, n = 3), or as data from individual cells (circles).
-
Figure 6—figure supplement 3—source data 1
Excel file with group data from electrophysiological recordings of cannabidiol (CBD)-dependent sensitization for rTRPV2 Q530A and Q530G channels.
- https://cdn.elifesciences.org/articles/86166/elife-86166-fig6-figsupp3-data1-v1.xlsx
Figure 7
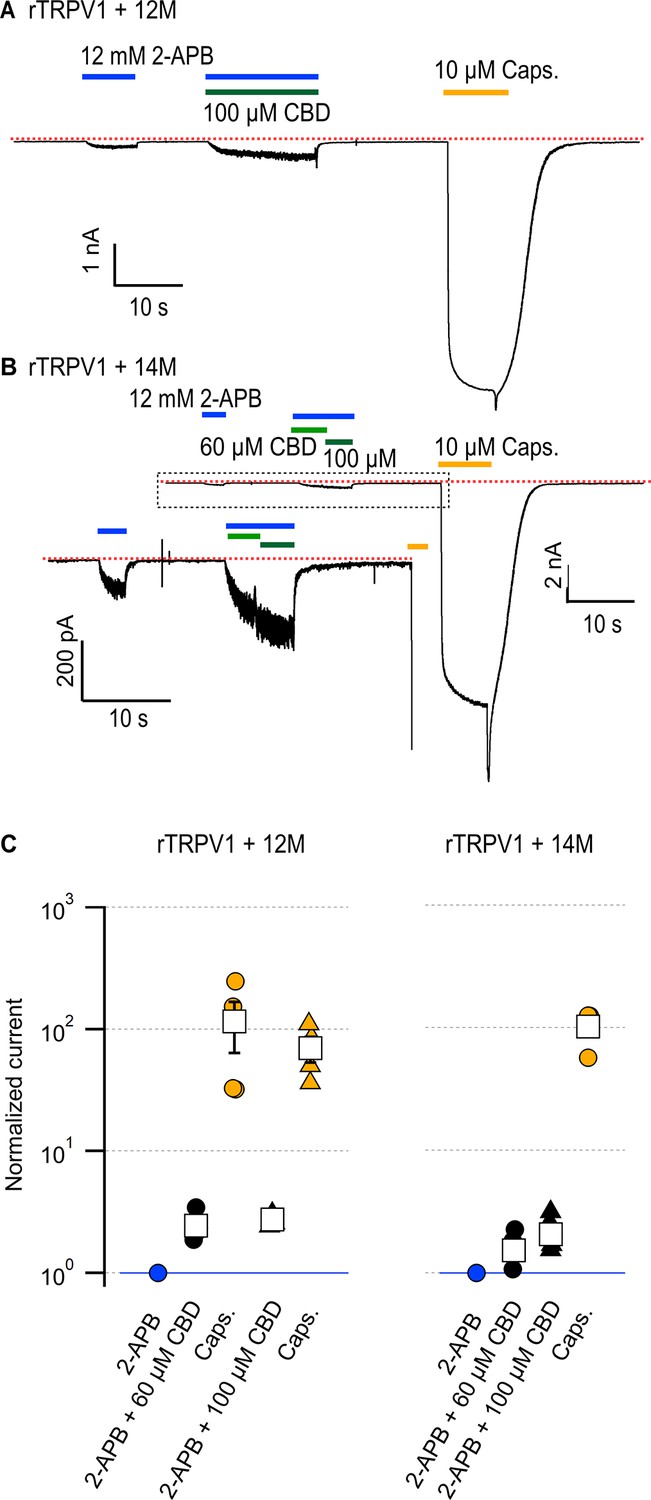
Cumulative substitutions at non-conserved positions in the rTRPV1 pore do not enhance sensitization.
Representative time courses for (A) rTRPV1-12M channels (E570Q + M572V + C578L + M581L + S592A + T593V + V595L + T597S + S632D + T633A + T650Q + I660L) or (B) rTRPV1-14M channels (E570Q + M572V + C578L + M581L + S592A + T593V + V595L + T597S + S632D + T633A + Y653L + D654R + T650Q + I660L) displaying sensitization by cannabidiol (CBD) of the response to 12 mM 2-aminoethoxydiphenyl borate (2-APB). The red dotted line indicates the zero-current level. The inset in (B) is a magnification of the region within the dotted rectangle. Concentrations of 60 or 100 µM CBD were tested in separate experiments for rTRPV1-12M and in the same experiment for rTRPV1-14M. (C) Group data for the experiments in (A) and (B), showing leak-subtracted current responses to each of the stimuli, normalized to the current magnitude in the presence of 12 mM 2-APB, denoted by the horizontal blue line. Data points from individual experiments are shown as circles. Data are shown as mean ± SEM (n = 4 for rTRPV1-12M and 60 or 100 µM CBD; n = 5 for rTRPV1-14M).
-
Figure 7—source data 1
Excel file with group data from electrophysiological recordings of cannabidiol (CBD)-dependent sensitization shown in Figure 7.
- https://cdn.elifesciences.org/articles/86166/elife-86166-fig7-data1-v1.xlsx
Tables
Table 1
Cryo-EM data collection, refinement, and validation statistics.
| Conformation A | Conformation B | |
|---|---|---|
| Magnification | 105,000 | 105,000 |
| Voltage (kV) | 300 | 300 |
| Electron exposure (e-/Å2) | 52 | 52 |
| Defocus range (µm) | –0.5 to –1.5 | –0.5 to –1.5 |
| Pixel size (Å) | 0.415 | 0.415 |
| Symmetry imposed | C4 | C4 |
| Initial particle images (no.) | 1,665,271 | 1,665,271 |
| Final particle images (no.) | 321,717 | 43,071 |
| Map resolution (Å) | 3.23 | 3.32 |
| FSC threshold | 0.143 | 0.143 |
| Refinement | ||
| Initial model used (PDB code) | 6U84 | 6U84 |
| Model resolution (Å) | 3.4 | 3.5 |
| FSC threshold | 0.5 | 0.5 |
| Map sharpening B-factor (Å2) | –50 | –50 |
| Model composition | ||
| Non-hydrogen atoms | 17,901 | 18,313 |
| Protein residues | 2380 | 2376 |
| Ligands | 9 | 17 |
| R.m.s deviations | ||
| Bond lengths (Å) | 0.002 | 0.004 |
| Bond angles (°) | 0.455 | 0.566 |
| B factor(Å2) | ||
| Protein | 93.49 | 78.75 |
| Ligand | 94.58 | 41.01 |
| Validation | ||
| MolProbity score | 1.29 | 1.34 |
| Clashscore | 5.45 | 6.18 |
| Poor rotamers (%) | 0 | 0 |
| Ramachandran Plot | ||
| Favored (%) | 98.84 | 98.11 |
| Allowed (%) | 1.16 | 1.89 |
| Disallowed (%) | 0 | 0 |
-
FSC: Fourier shell correlation.
Additional files
Download links
A two-part list of links to download the article, or parts of the article, in various formats.
Downloads (link to download the article as PDF)
Open citations (links to open the citations from this article in various online reference manager services)
Cite this article (links to download the citations from this article in formats compatible with various reference manager tools)
Cannabidiol sensitizes TRPV2 channels to activation by 2-APB
eLife 12:e86166.
https://doi.org/10.7554/eLife.86166


