Self-formation of concentric zones of telencephalic and ocular tissues and directional retinal ganglion cell axons
- Department of Ophthalmology and Visual Sciences, Albert Einstein College of Medicine, United States
- Department of Genetics, Albert Einstein College of Medicine, United States
- The Ruth L. and David S. Gottesman Institute for Stem Cell Biology and Regenerative Medicine, Albert Einstein College of Medicine, United States
- Dominick P Purpura Department of Neuroscience, Albert Einstein College of Medicine, United States
Figures
Figure 1 with 3 supplements
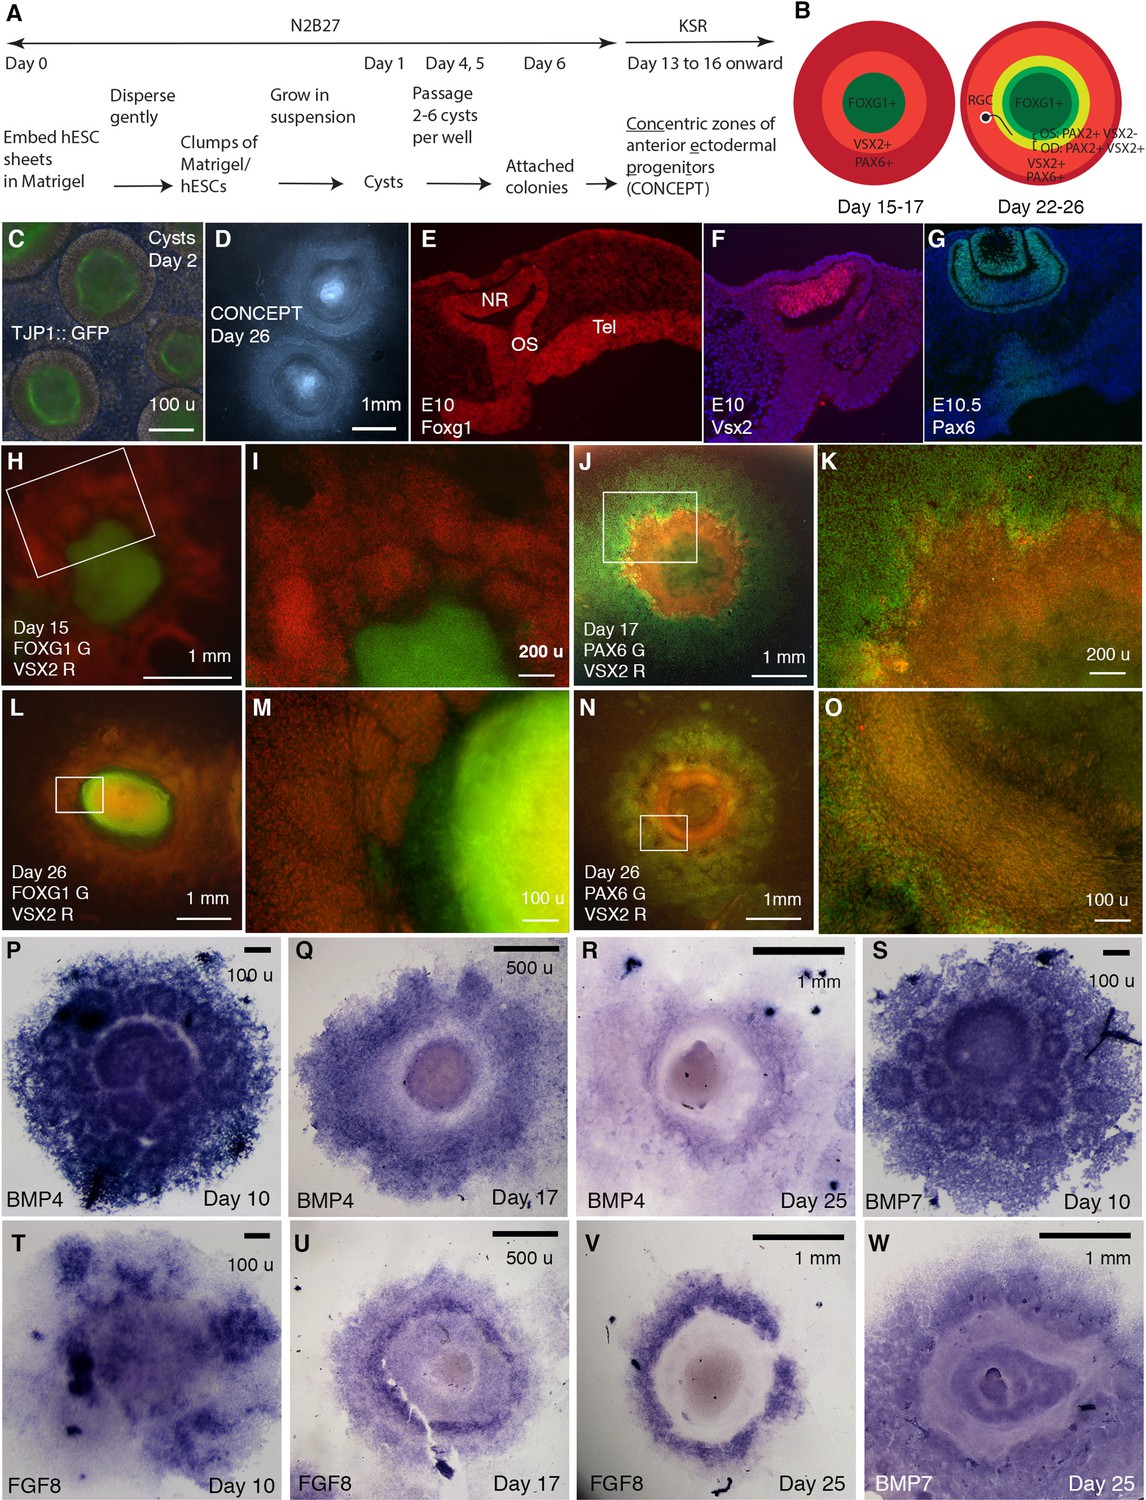
Generation of telencephalon-eye organoids comprising concentric zones of anterior ectodermal progenitors (CONCEPT).
(A) A scheme of the procedure. (B) Diagrams of developing CONCEPT organoids showing concentric zones of the anterior ectodermal progenitors. A summary of Figures 1, 2 and 7, Figure 1—figure supplements 1–3. (C) Morphology of cysts at day 2 showing the epithelial structure indicated by apical localization of the reporter TJ::GFP at the lumen. (D) Morphology of CONCEPT organoids at day 26. (E–G) Expression of telencephalon (Tel) marker Foxg1, neuroretinal (NR) markers Vsx2 and Pax6 in mouse eyes at E10-10.5. Rostral optic stalk (OS) connected the telencephalic vesicle to the optic cup. (H–O) FOXG1+ telencephalic progenitors, VSX2+ and/or PAX6+ retinal progenitors formed concentric zones in CONCEPT organoids. N>5 experiments. (P–W) In CONCEPT organoids, morphogens FGF8, BMP4, and BMP7 mRNA expression started at early stages and subsequently formed circular gradients. N>5 experiments. Scale bars, 100 µm (C, E, M, O, P, S, T), 200 µm (I, K), 500 µm (Q, U), 1 mm (D, H, J, L, N, R, V, W).
Figure 1—figure supplement 1
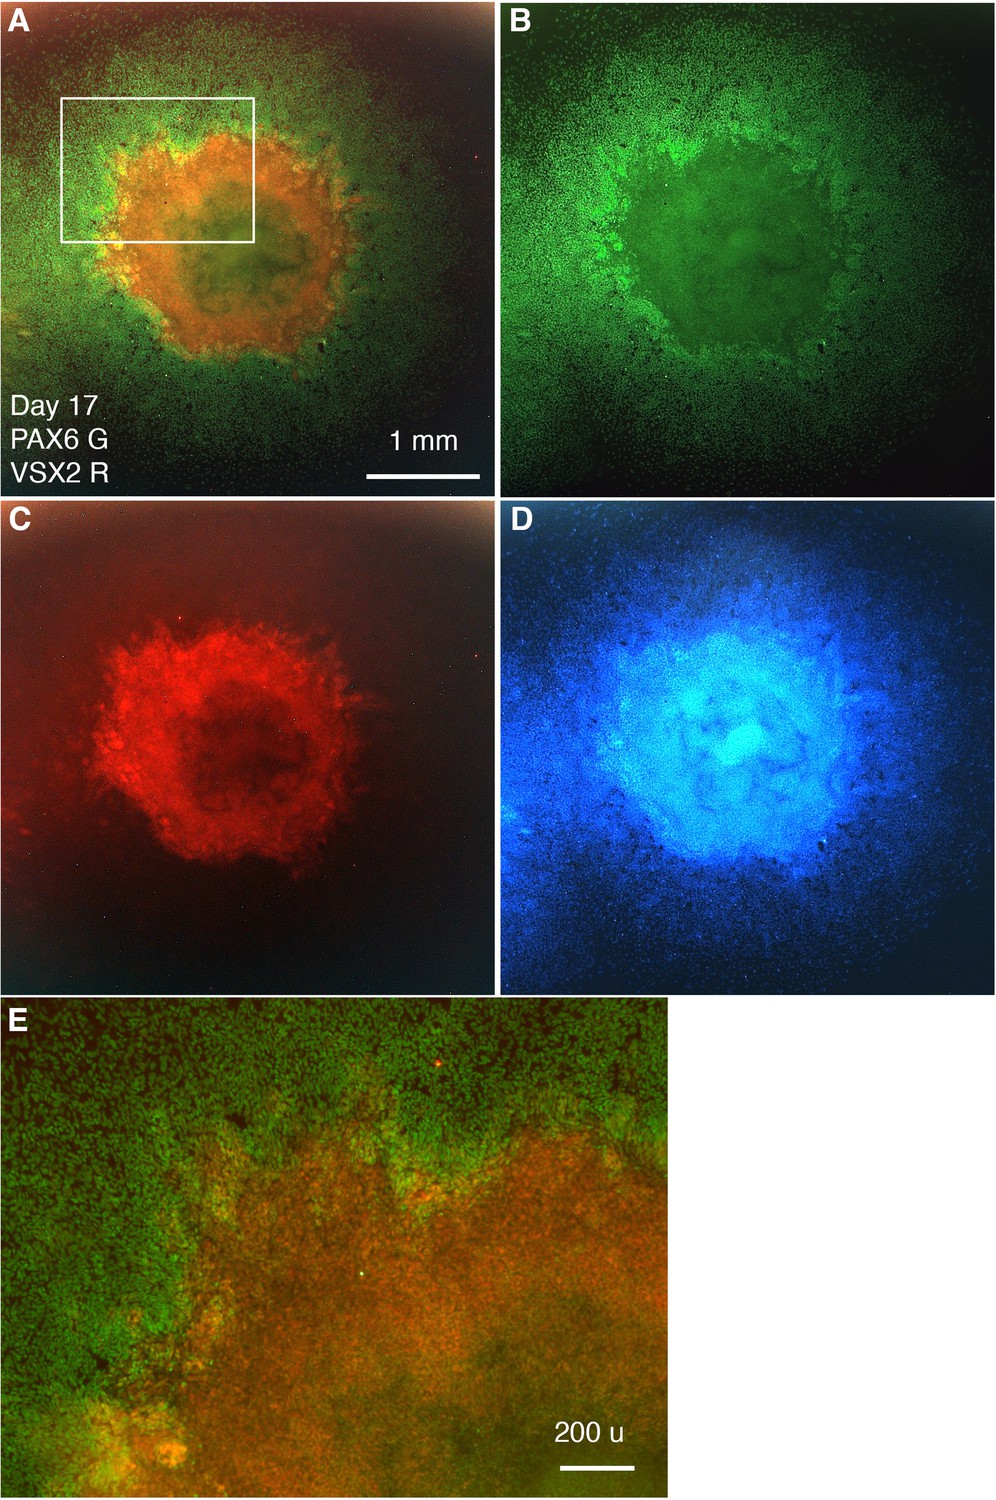
Separate-channel images showing VSX2 and PAX6 expression in CONCEPT organoids at day 17.
(A–E) Images of VSX2 and PAX6 expression (A), PAX6 (B), VSX2 (C), DAPI (D), and an image at a higher magnification (E) are shown. Scale bars, 1 mm (A), 200 µm (E).
Figure 1—figure supplement 2
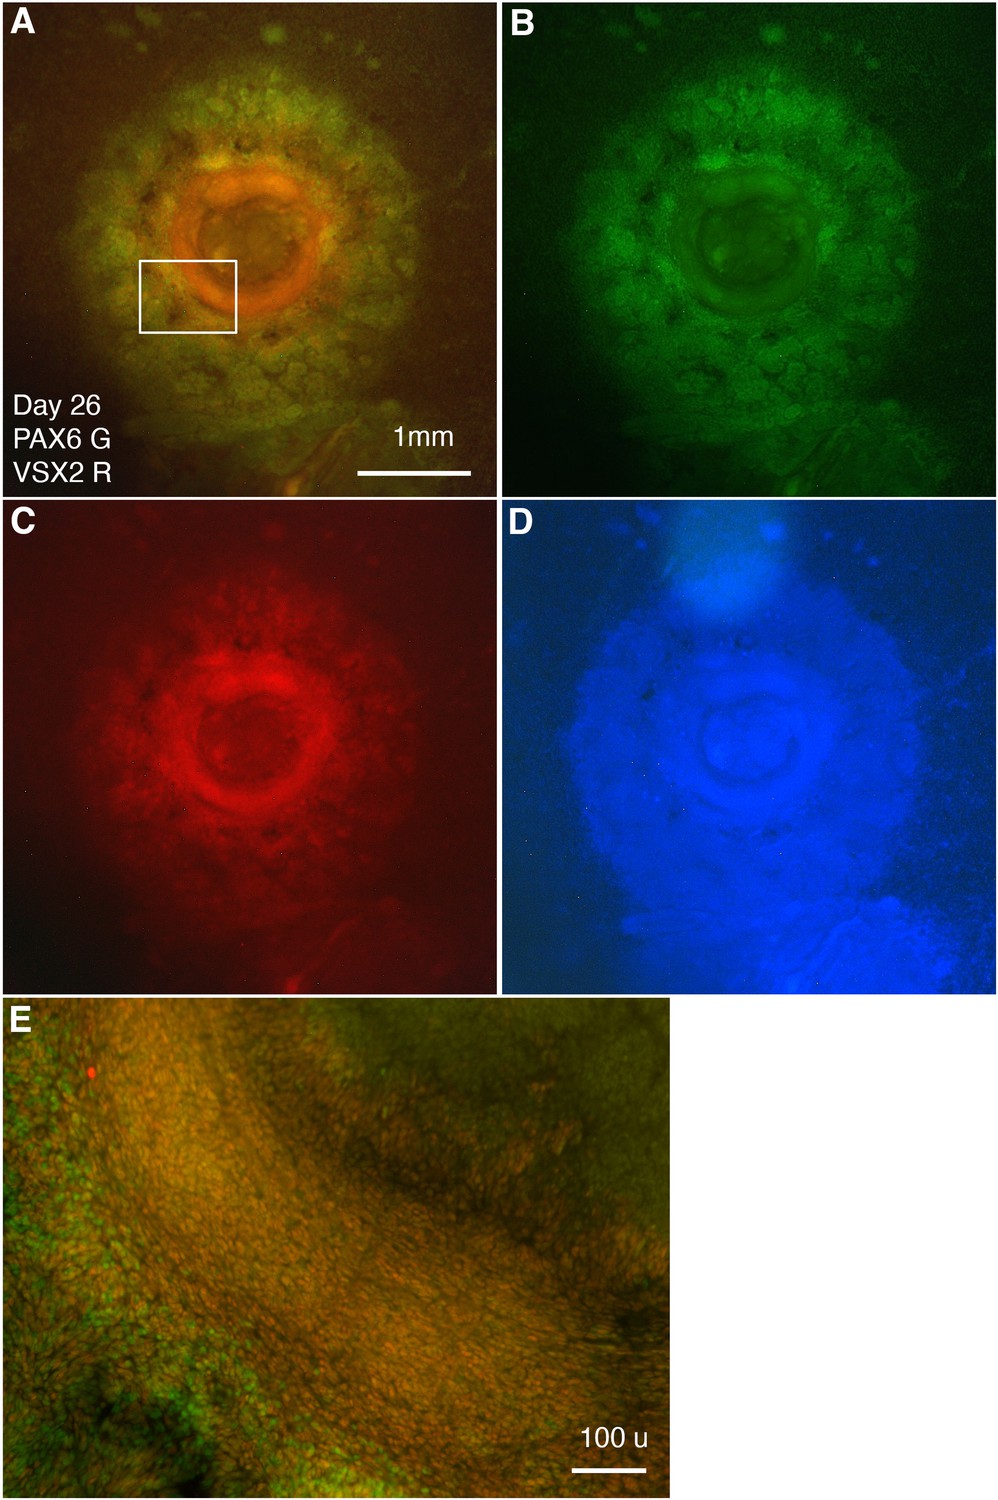
Separate-channel images showing VSX2 and PAX6 expression in CONCEPT organoids at day 26.
(A–E) Images of VSX2 and PAX6 expression (A), PAX6 (B), VSX2 (C), DAPI (D), and an image at a higher magnification (E) are shown. Scale bars, 1 mm (A), 100 µm (E).
Figure 1—figure supplement 3
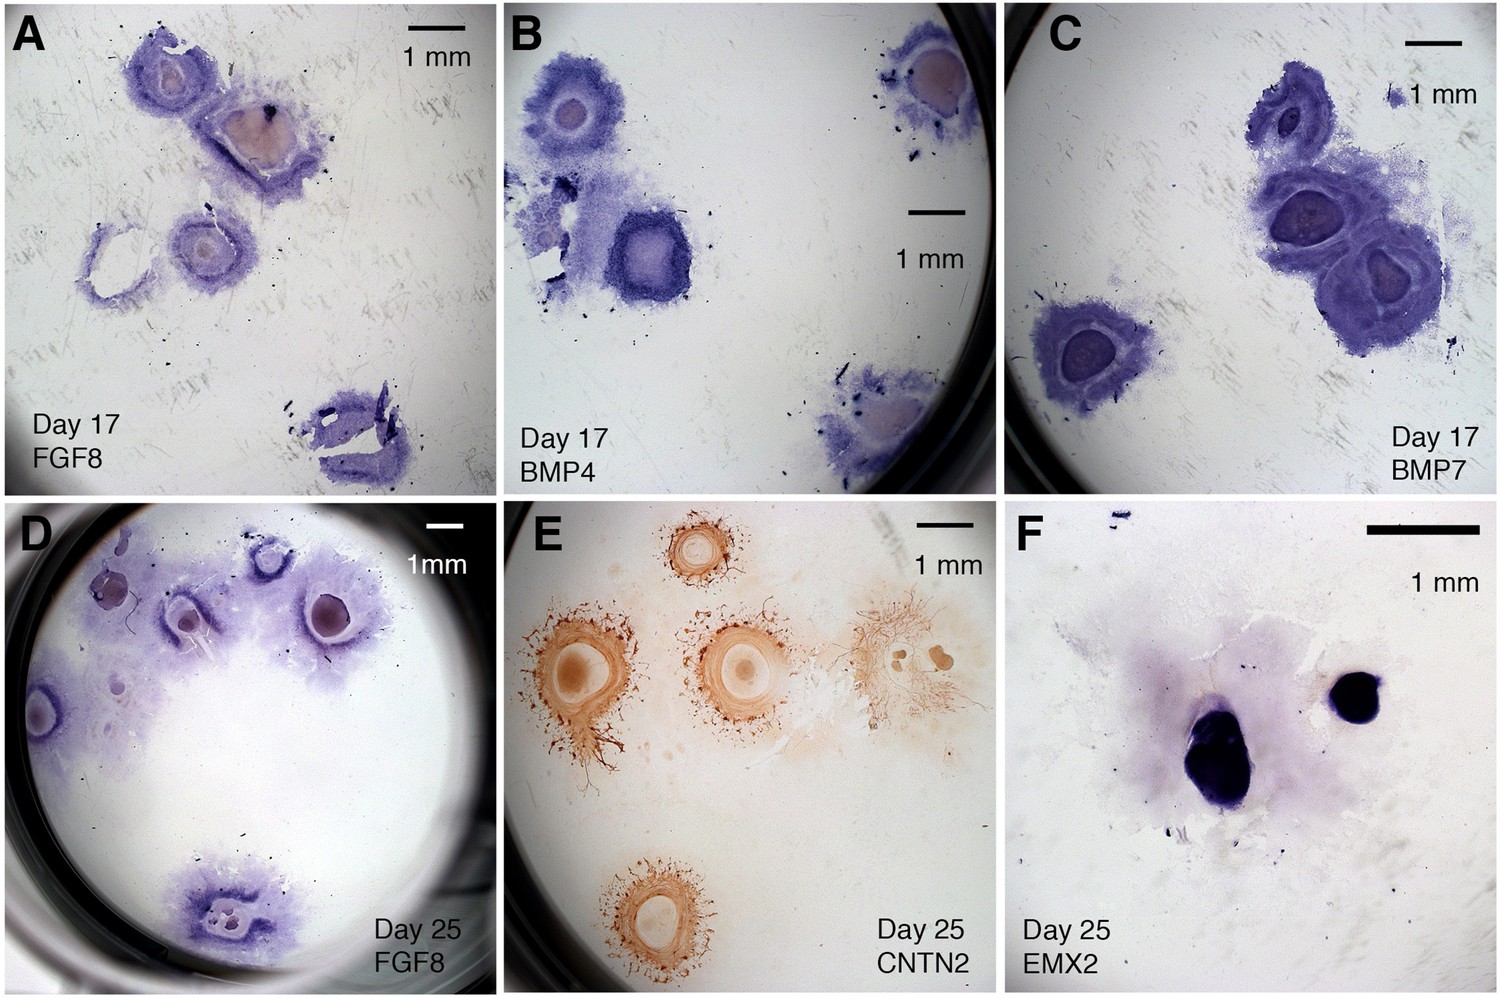
Reproducibility of CONCEPT telencephalon-eye organoids is demonstrated by consistent gene expression profiles of multiple organoids in whole culture wells.
Related also to Figure 7. (A–C) CONCEPT organoids on day 17 expressed FGF8 (A, n=5/5), BMP4 (B, n=4/4; the broken colony was not counted since its morphology is not quite clear), and BMP7 (C, n=4/4) in concentric zones. (D–F) CONCEPT organoids on day 25 expressed FGF8 (D, n=5/8), RGC marker CNTN2 (E, n=5/6), and telencephalon marker EMX2 (F, n=2/2) in concentric zones. Scale bars, 1 mm (A–F).
Figure 2
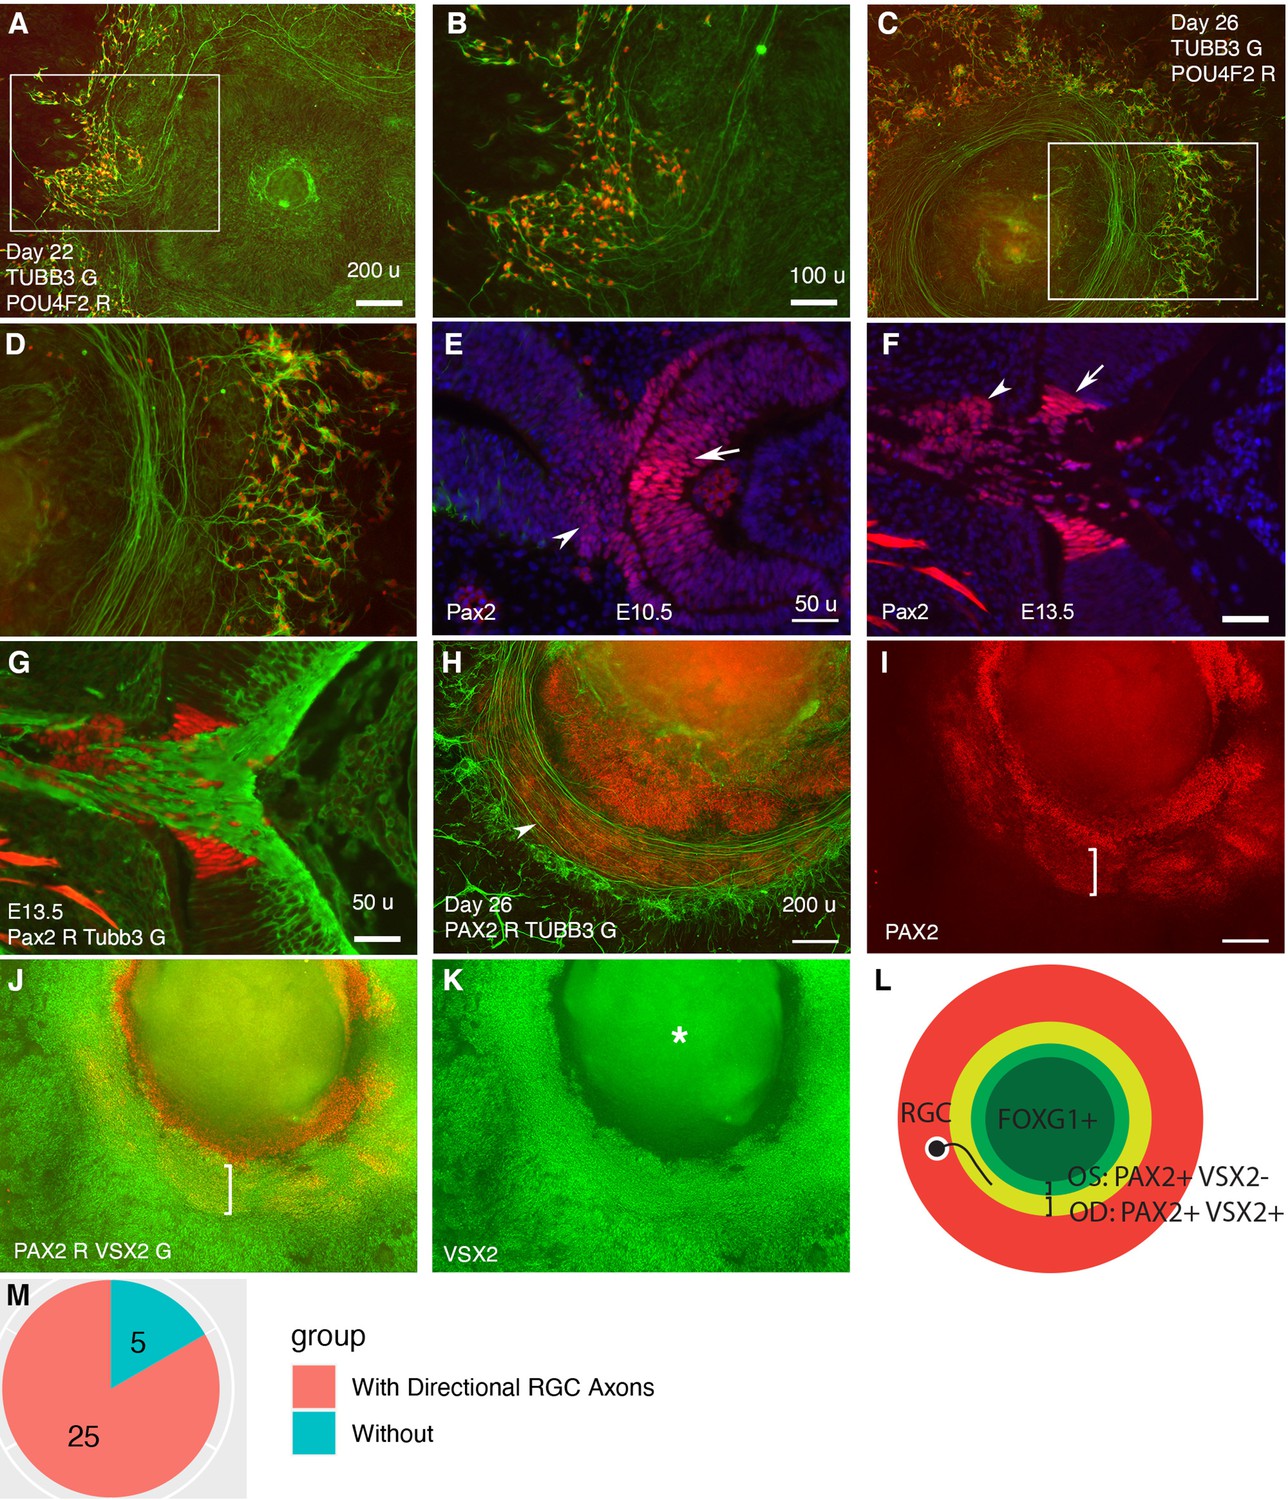
Retinal ganglion cells (RGCs) grow axons toward and then along a path defined by PAX2+ VSX2+ cells in CONCEPT telencephalon-eye organoids.
N>5 experiments. (A–D) POU4F2+ RGCs grew TUBB3+ axons toward and then along a path with a circular or a portion of circular shape. (E, F) In mice, Pax2 was expressed in central regions of the retina and optic stalk at E10.5 (E) and in the optic disc and optic stalk at E13.5 (F). Tubb3+ axons from the initial RGCs grew toward the optic disc, exited the eye, and navigated within the optic stalk (G). (H–L) In CONCEPT organoids at day 26, TUBB3+ RGC axons grew toward and then along a path defined by an adjacent PAX2+ VSX2+ cell population (arrowhead in H, brackets in I, J); the PAX2+ VSX2- cell population set up an inner boundary of RGC axon growth. (L) A diagram summarizing RGC axon growth, PAX2+ VSX2+ optic disc (OD), and PAX2+ VSX2- optic stalk (OS) in CONCEPT organoids. The area labeled by the asterisk may appear as false signals in a low-resolution printout but it is clearly a background in digital display. (M) A count of CONCEPT organoids showing directional retinal ganglion cell axons. Scale bars, 50 µm (E, F, G), 100 µm (B), 200 µm (A, H, I).
Figure 3
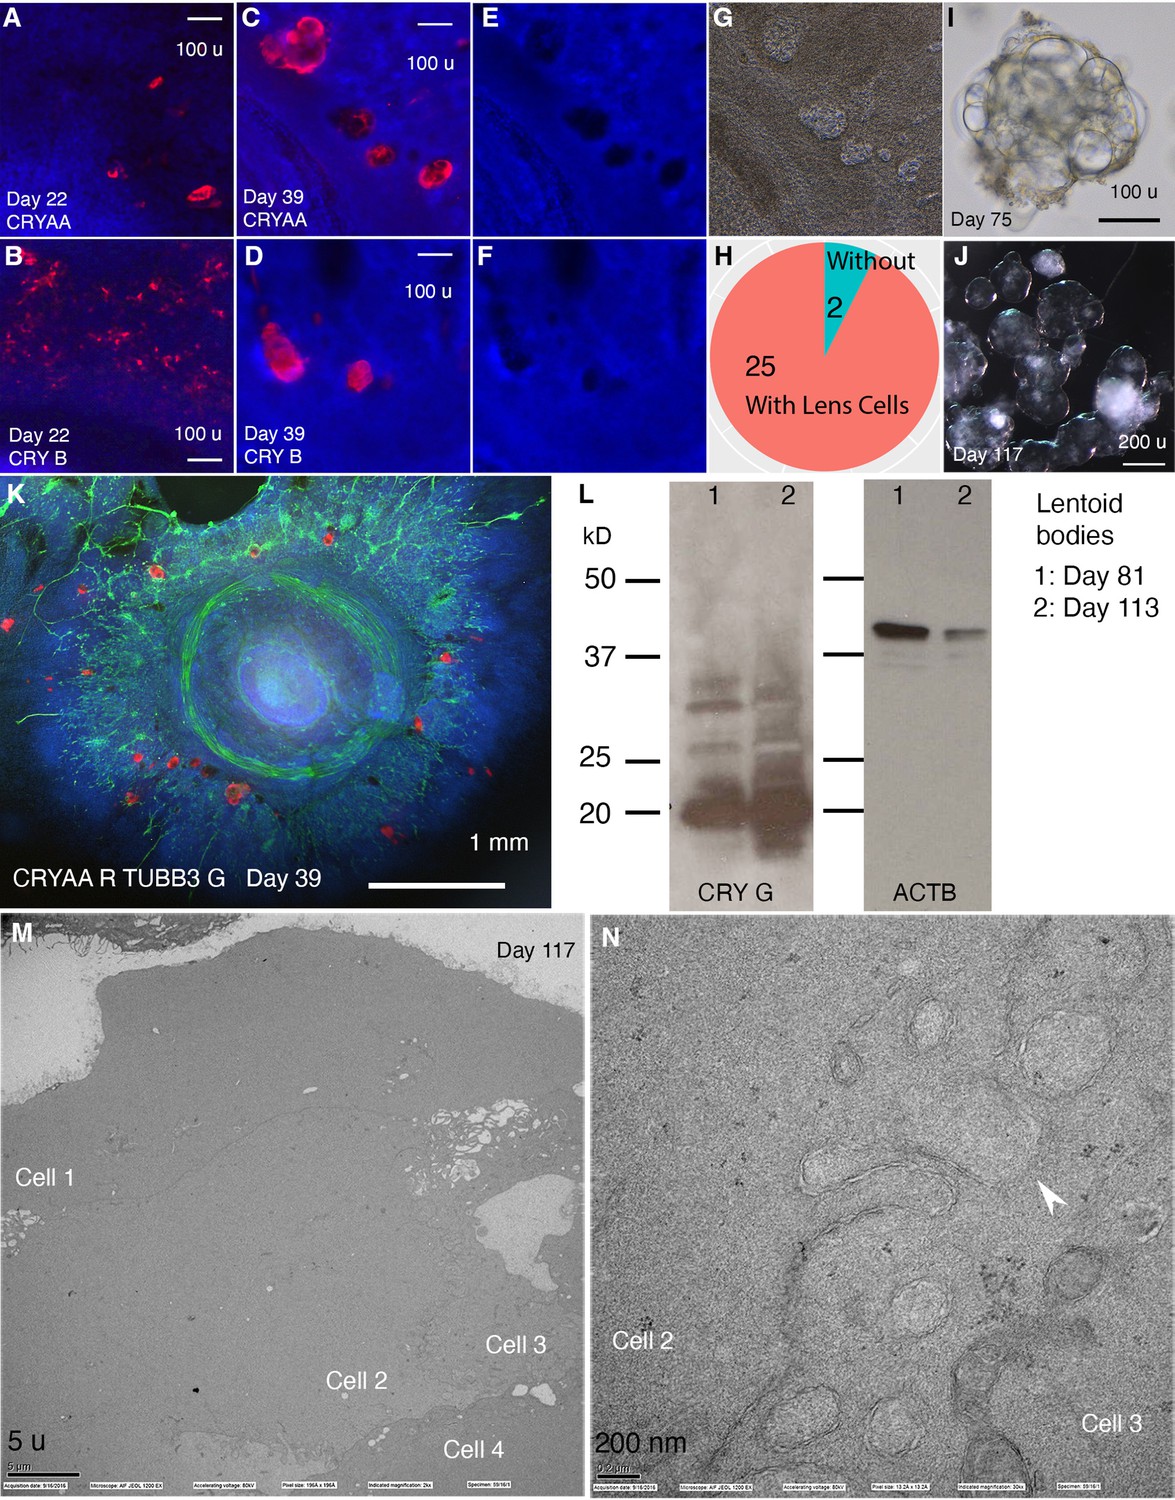
CONCEPT telencephalon-eye organoids contain lens cells that undergo terminal differentiation.
N>5 experiments. (A–L) In CONCEPT organoids, lens markers CRYAA and beta crystallin (CRY B) were expressed at day 22 (A, B) and day 39 (C, D, K; a count in H). Lens cells were not stained by DAPI (E, F); they exhibited a crystal-like shape (G). When CONCEPT organoids were detached using Dispase at around day 28 and grown in suspension, crystal-like clusters, named as lentoid bodies, were found (I) and survived for months (J). These lentoid bodies highly expressed gamma crystallin (CRY G), as revealed by Western blot (L). (M–N) These lentoid bodies were free of organelles and exhibited ball-and-socket structures (K, L), as revealed by electron microscopy. Scale bars, 100 µm (A, B, C, D, I), 200 µm (J), 5 µm (K), 200 nm (L).
Figure 4 with 11 supplements
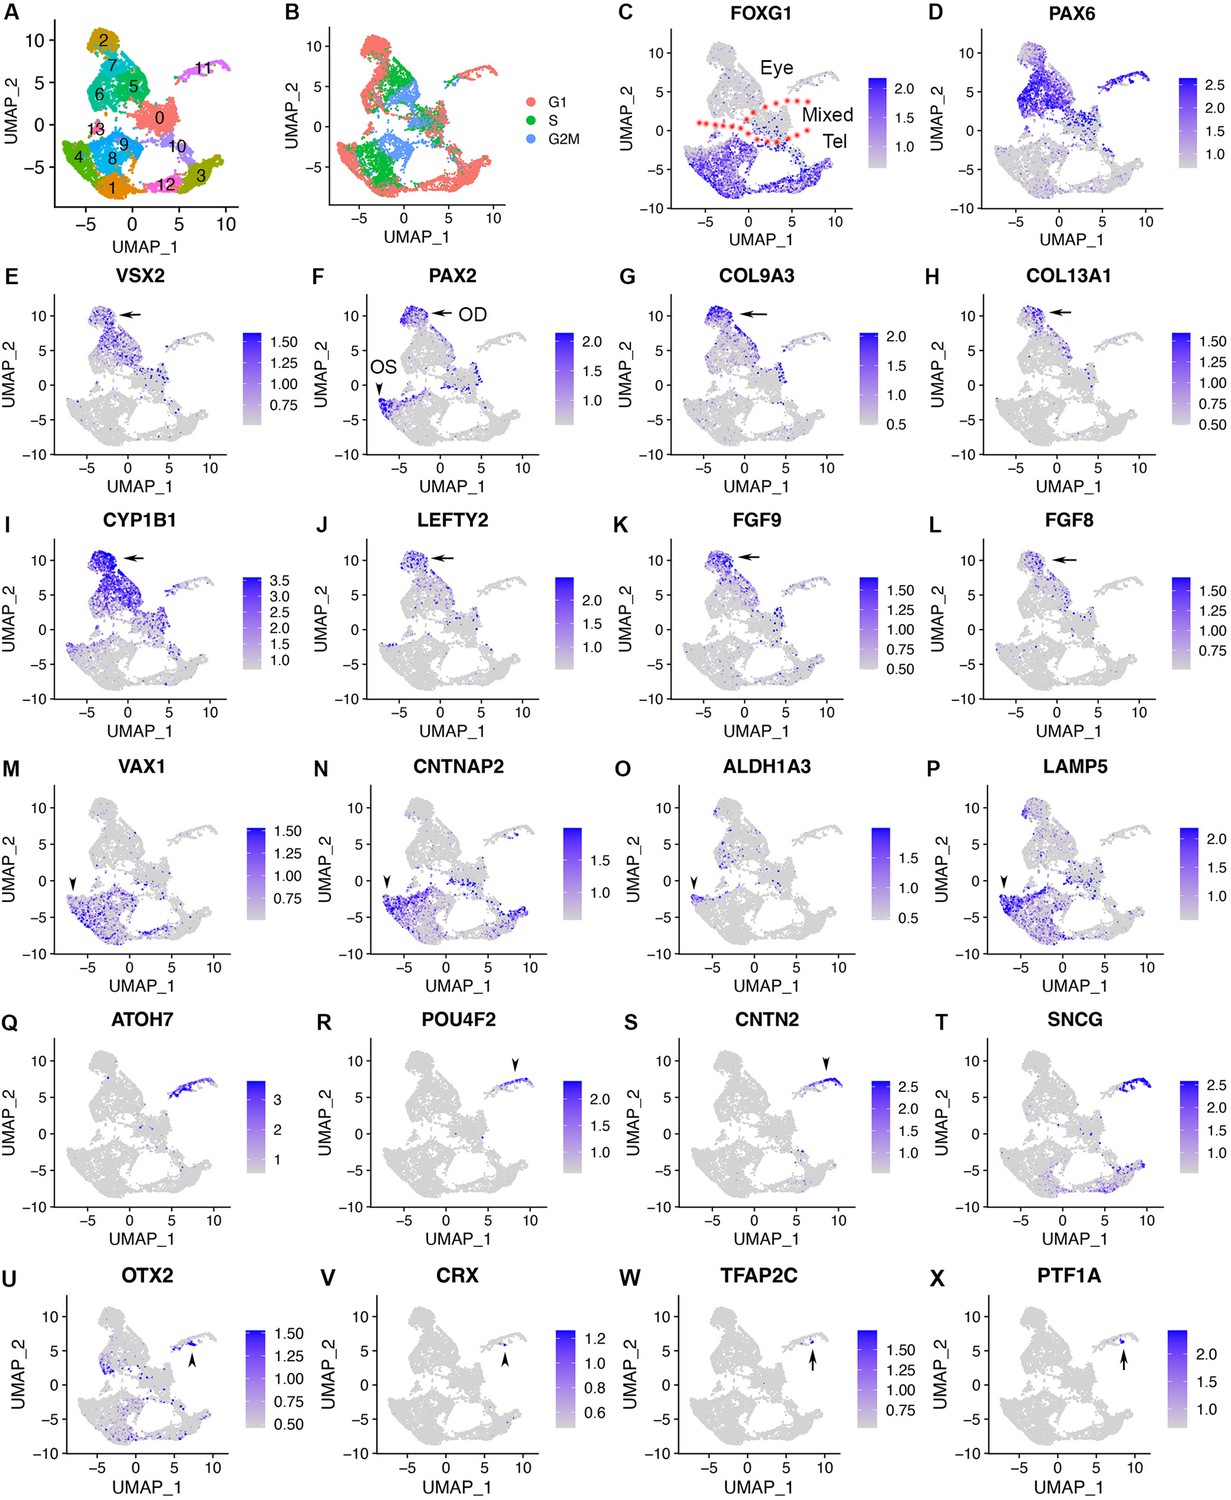
scRNA-seq of CONCEPT organoids identifies telencephalic and ocular cells, including PAX2+ VSX2+ optic disc cells, PAX2+ VSX2- optic stalk cells, and CNTN2+ RGCs.
CONCEPT organoids at day 24 were used for profiling. (A) Identification of 14 cell clusters. (B) Cell cycle phases revealed by cell cycle scores. (C) FOXG1 expression marked telencephalic cells. (D, E) The expression of PAX6 and/or VSX2 marked retinal cells. (F) PAX2+ cells were found in two major cell populations: PAX2+ VSX2+ cells were assigned as the optic disc (OD), whereas PAX2+ VSX2- FOXG1+ cells were assigned as the optic stalk (OS). (G–L) The expression of major DEGs in cluster 2, the major cell population that mimics the optic disc. (M–P) The expression of major gene markers for PAX2+ VSX2- optic stalk cells. (Q–T) Identification of CNTN2 as a specific marker for early human RGCs. A large portion of cluster 11 differentially expressed neurogenic retinal progenitor marker ATOH7 and RGC markers POU4F2 and SNCG. The expression of CNTN2 and POU4F2 largely overlapped. (U–X) Two small portions of cluster 11 differentially expressed early photoreceptor cell markers (OTX2 and CRX, U, V) and amacrine/horizontal cell markers (TFAP2C and PTF1A, W, X), respectively.
Figure 4—figure supplement 1
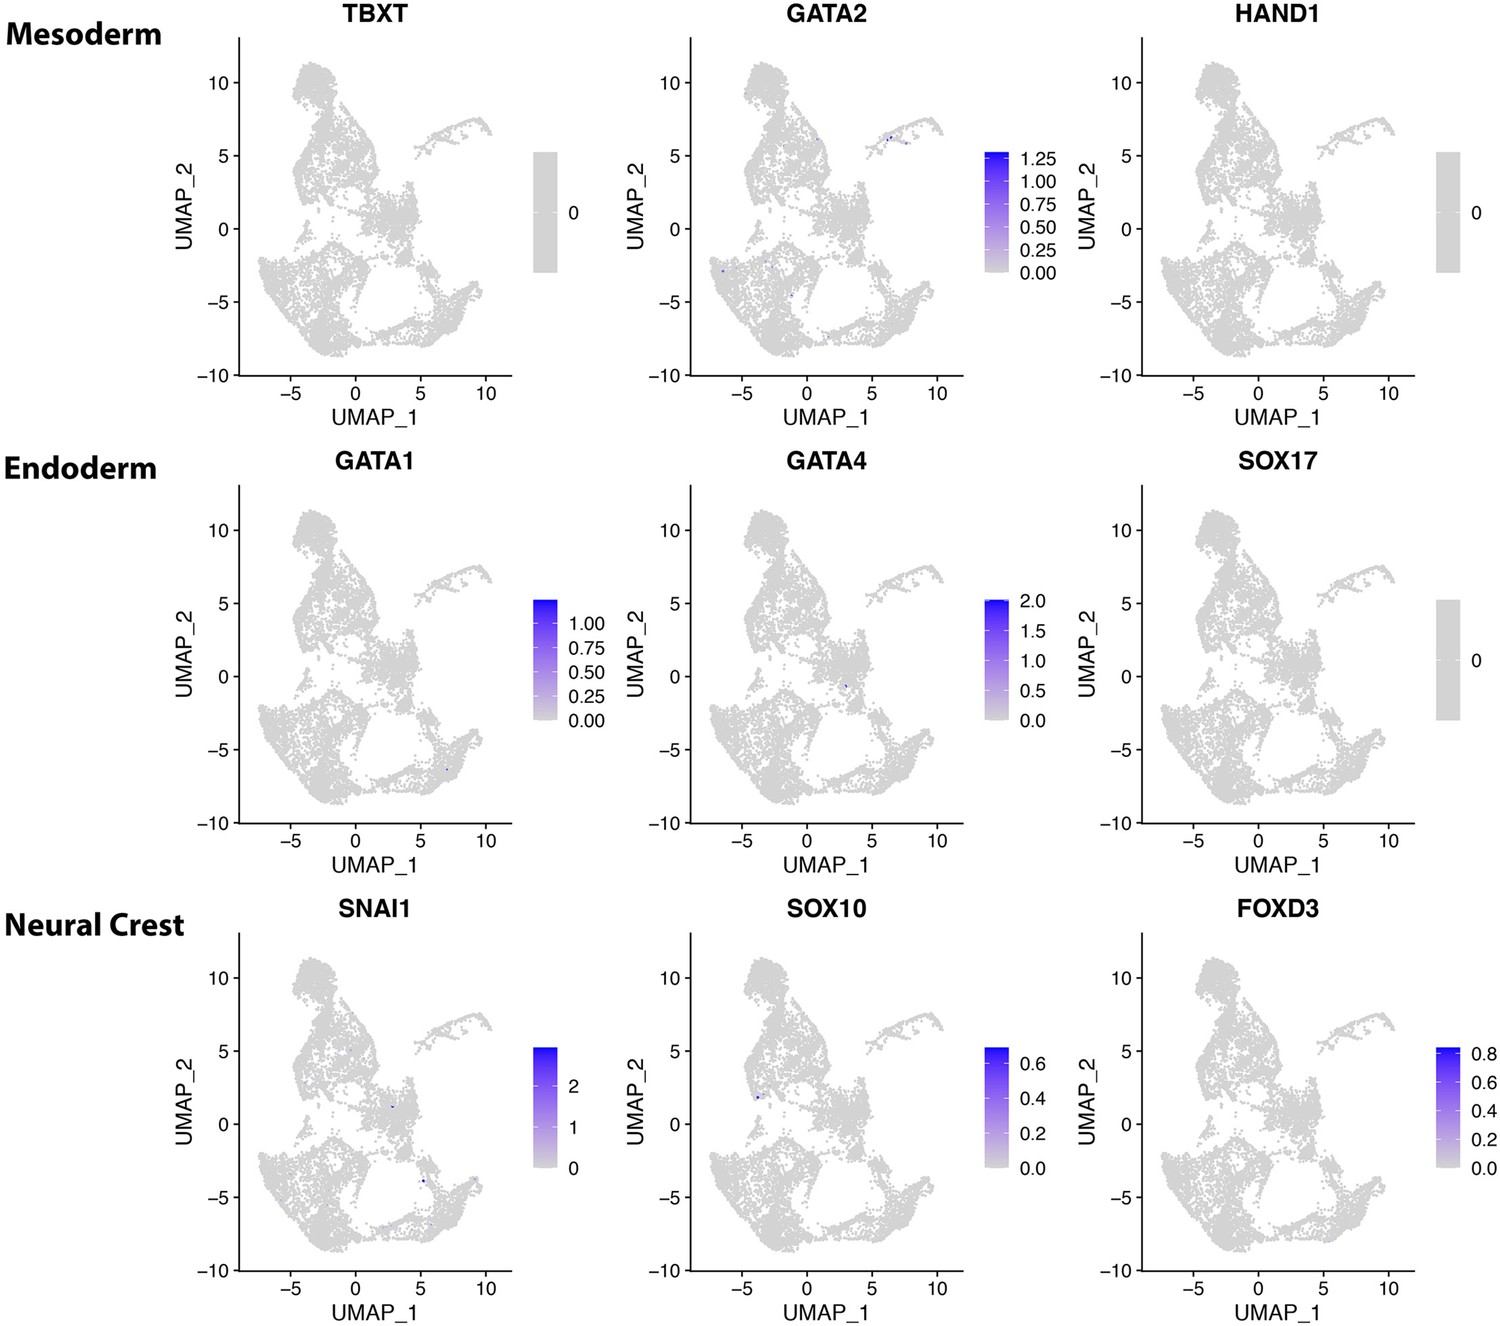
Mesoderm, endoderm, and neural crest markers are not expressed in CONCEPT telencephalon-eye organoids at 24.
Expression profiles of mesoderm markers TBXT, GATA2, and HAND1, endoderm markers GATA1, GATA4, and SOX17, neural crest markers SNAI1, SOX10, and FOXD3 are shown.
Figure 4—figure supplement 2
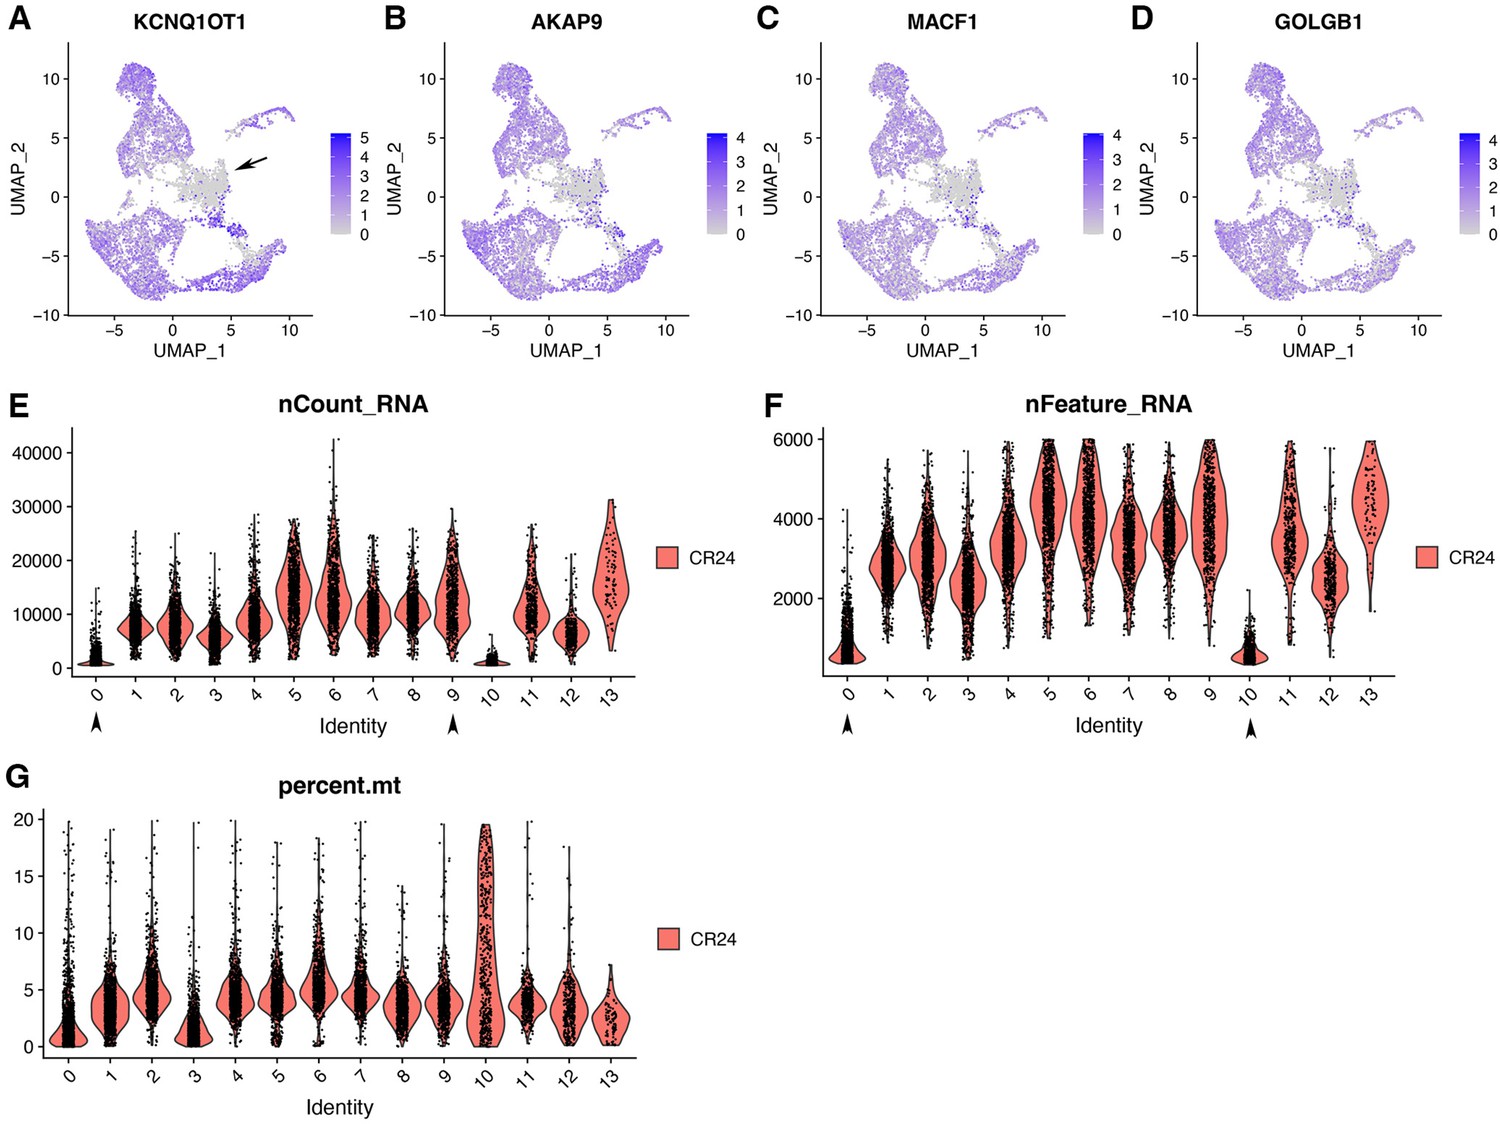
Cluster 0 is marked by negative gene markers.
(A–D) Cluster 0 was marked by DEGs that were lowly expressed, which was indicated by its top four DEGs. (E–G) Clusters 0 and 10 had low numbers of nCount_RNA and nFeature_RNA. Additionally, cluster 10 had a higher number of percent.mt.
Figure 4—figure supplement 3
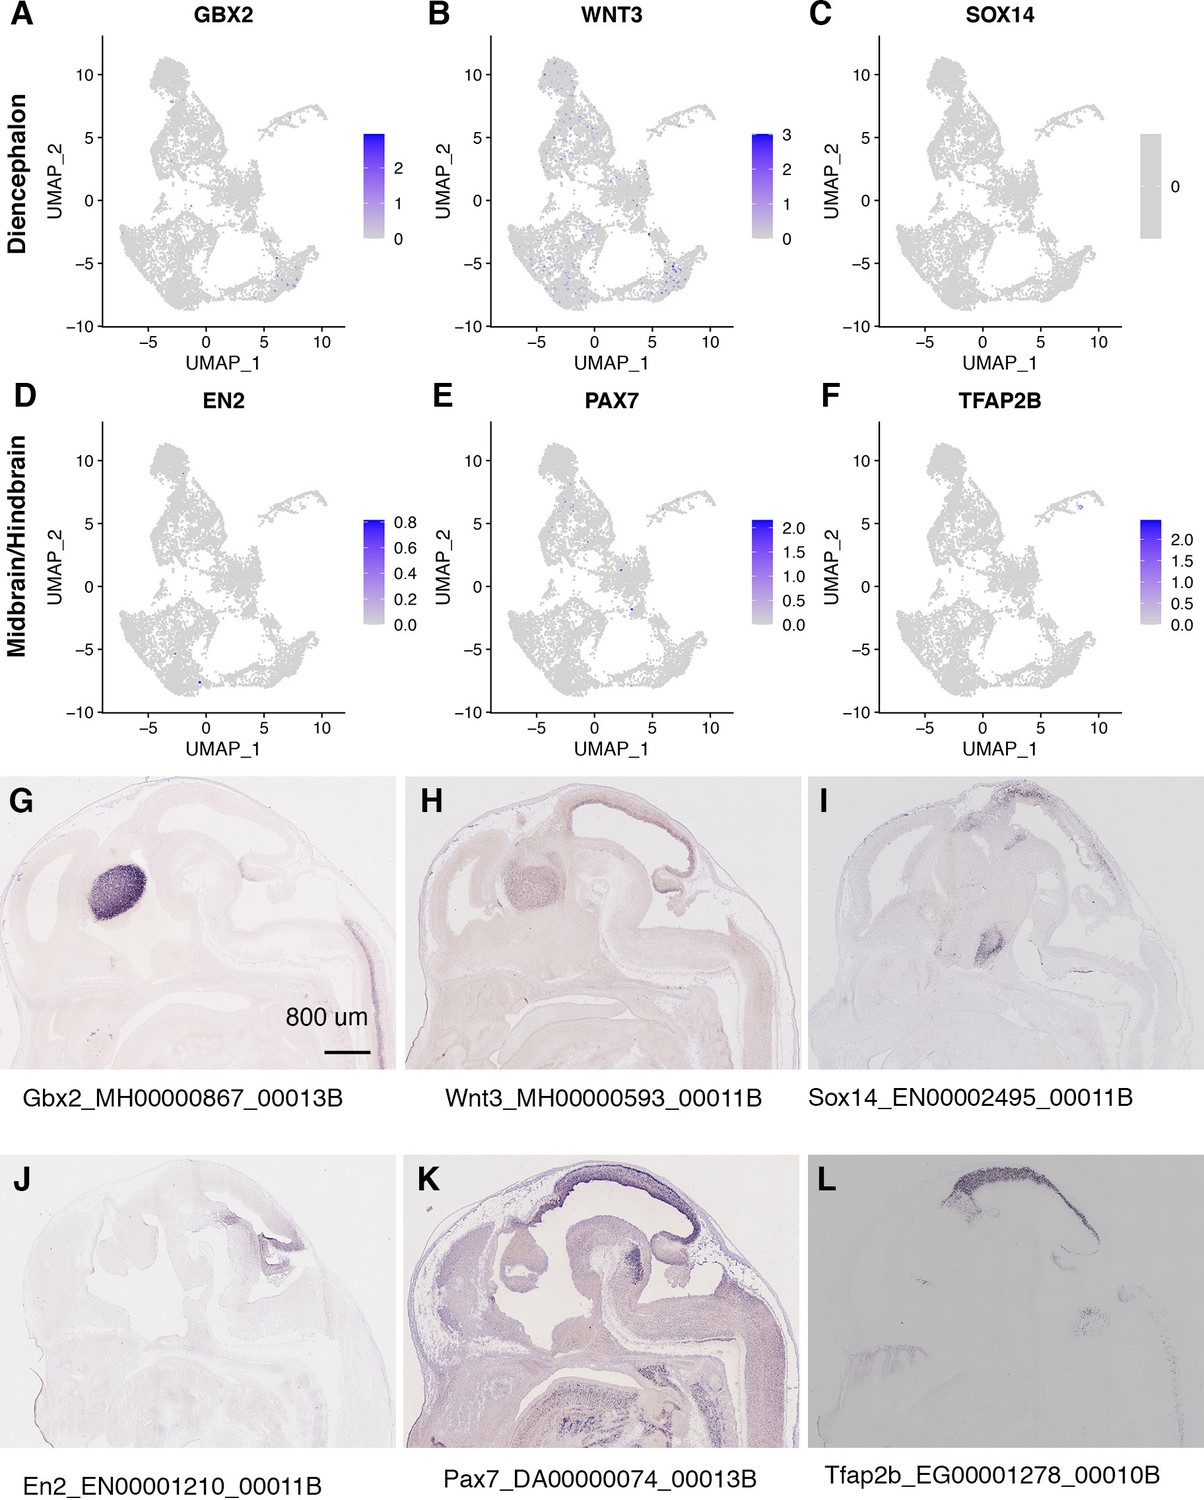
Diencephalon markers and midbrain/hindbrain markers are rarely expressed in CONCEPT telencephalon-eye organoids at day 24.
(A–F) Diencephalon markers GBX2, WNT3, and SOX14, and midbrain/hindbrain markers EN2, PAX7, and TFAP2B were rarely expressed. (G–L) Expression of the diencephalon markers and midbrain/hindbrain markers in the E14.5 mouse brain. The images were downloaded from a public database (https://gp3.mpg.de/) with permission. Image IDs were shown following gene symbols.
Figure 4—figure supplement 4
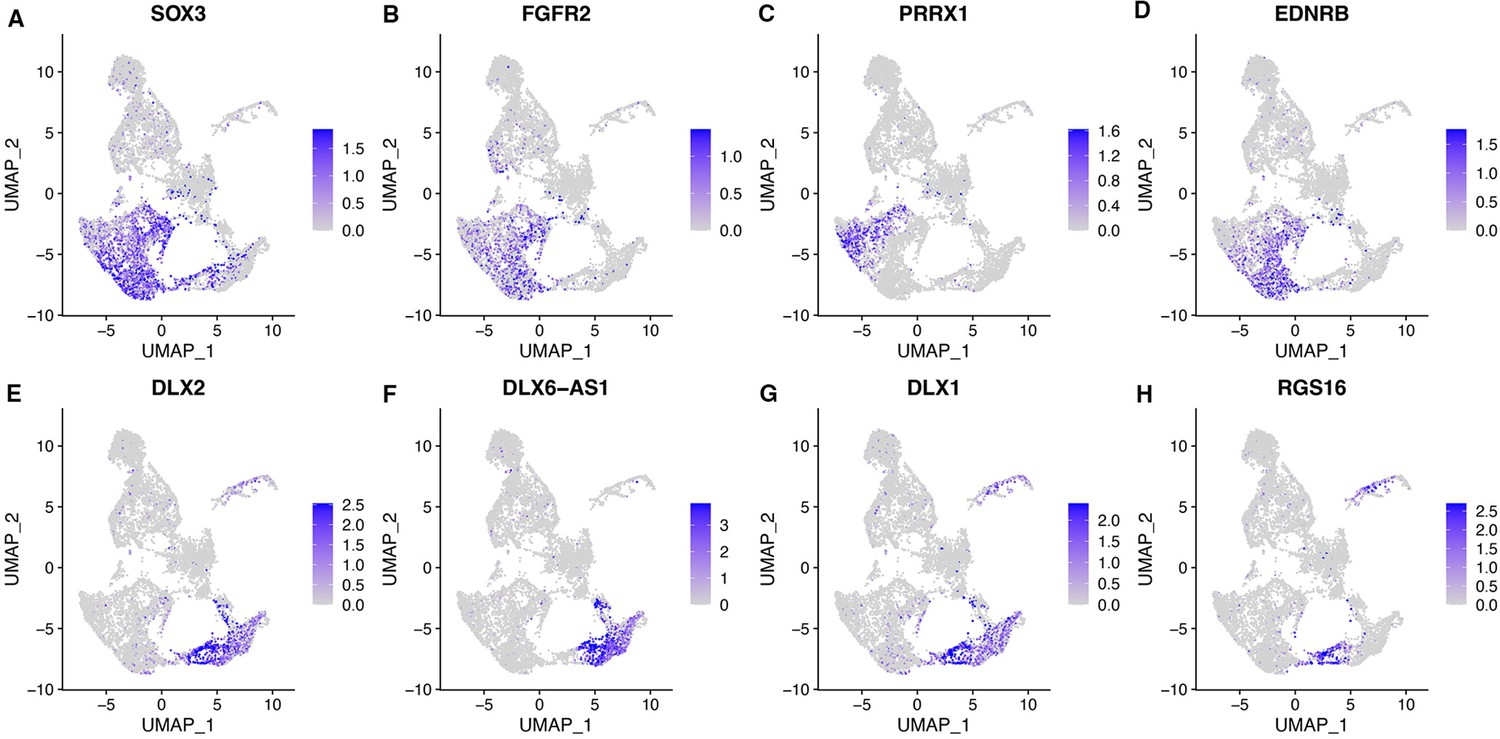
DEGs for telencephalic clusters in CONCEPT telencephalon-eye organoids include both dorsal and ventral telencephalic markers.
Related also to Figure 4—figure supplement 5. DEGs for telencephalic clusters were used for feature plotting, and the expression of their mouse orthologs are shown in Figure 4—figure supplement 5. (A–D) Expression of DEGs SOX3, FGFR2, PRRX1, and EDNRB, which mouse orthologs are specifically expressed in the dorsal telencephalon (see also Figure 4—figure supplement 5B–E). (E–H) Expression of DEGs DLX2, DLX6-AS1, DLX1, and RGS16, which mouse orthologs are specifically expressed in the ventral telencephalon (see also Figure 4—figure supplement 5F–I).
Figure 4—figure supplement 5
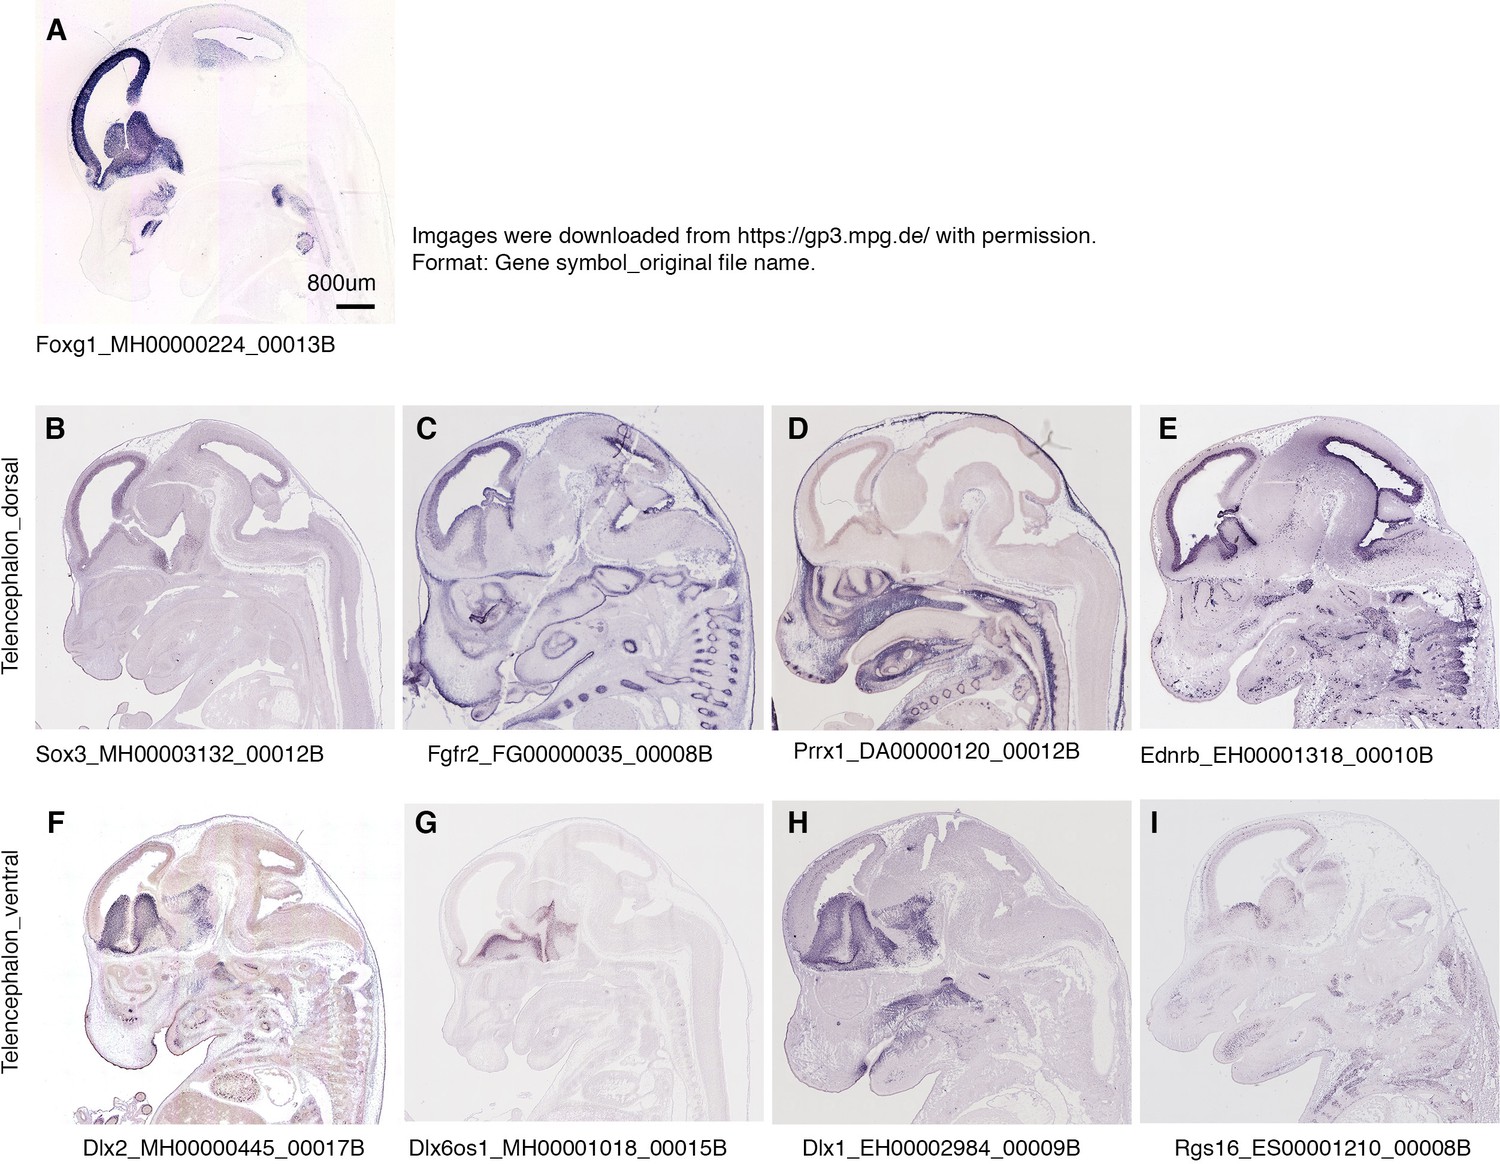
Mouse orthologs of telencephalic DEGs are specifically expressed in dorsal and ventral telencephalon of E14.5 mouse embryos.
Related also to Figure 4—figure supplement 4. The images were downloaded from a public database (https://gp3.mpg.de/) with permission. Image IDs were shown following gene symbols. (A) Foxg1 is specifically expressed in the telencephalon. (B–E) DEGs Sox3, Fgfr2, Prrx1, and Ednrb are specifically expressed in the dorsal telencephalon of E14.5 mouse embryos. (F–I) DEGs Dlx2, Dlx6os1, Dlx1, and Rgs16 are specifically expressed in the ventral telencephalon of E14.5 mouse embryos.
Figure 4—figure supplement 6
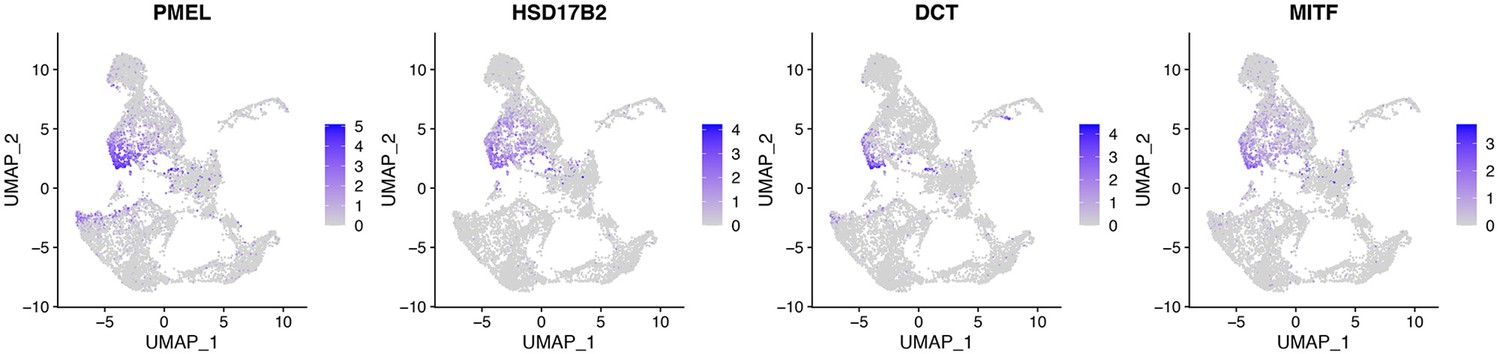
DEGs in cluster 6 include RPE markers.
Top DEGs in cluster 6 include RPE markers PMEL, HSD17B2, DCT, and MITF.
Figure 4—figure supplement 7
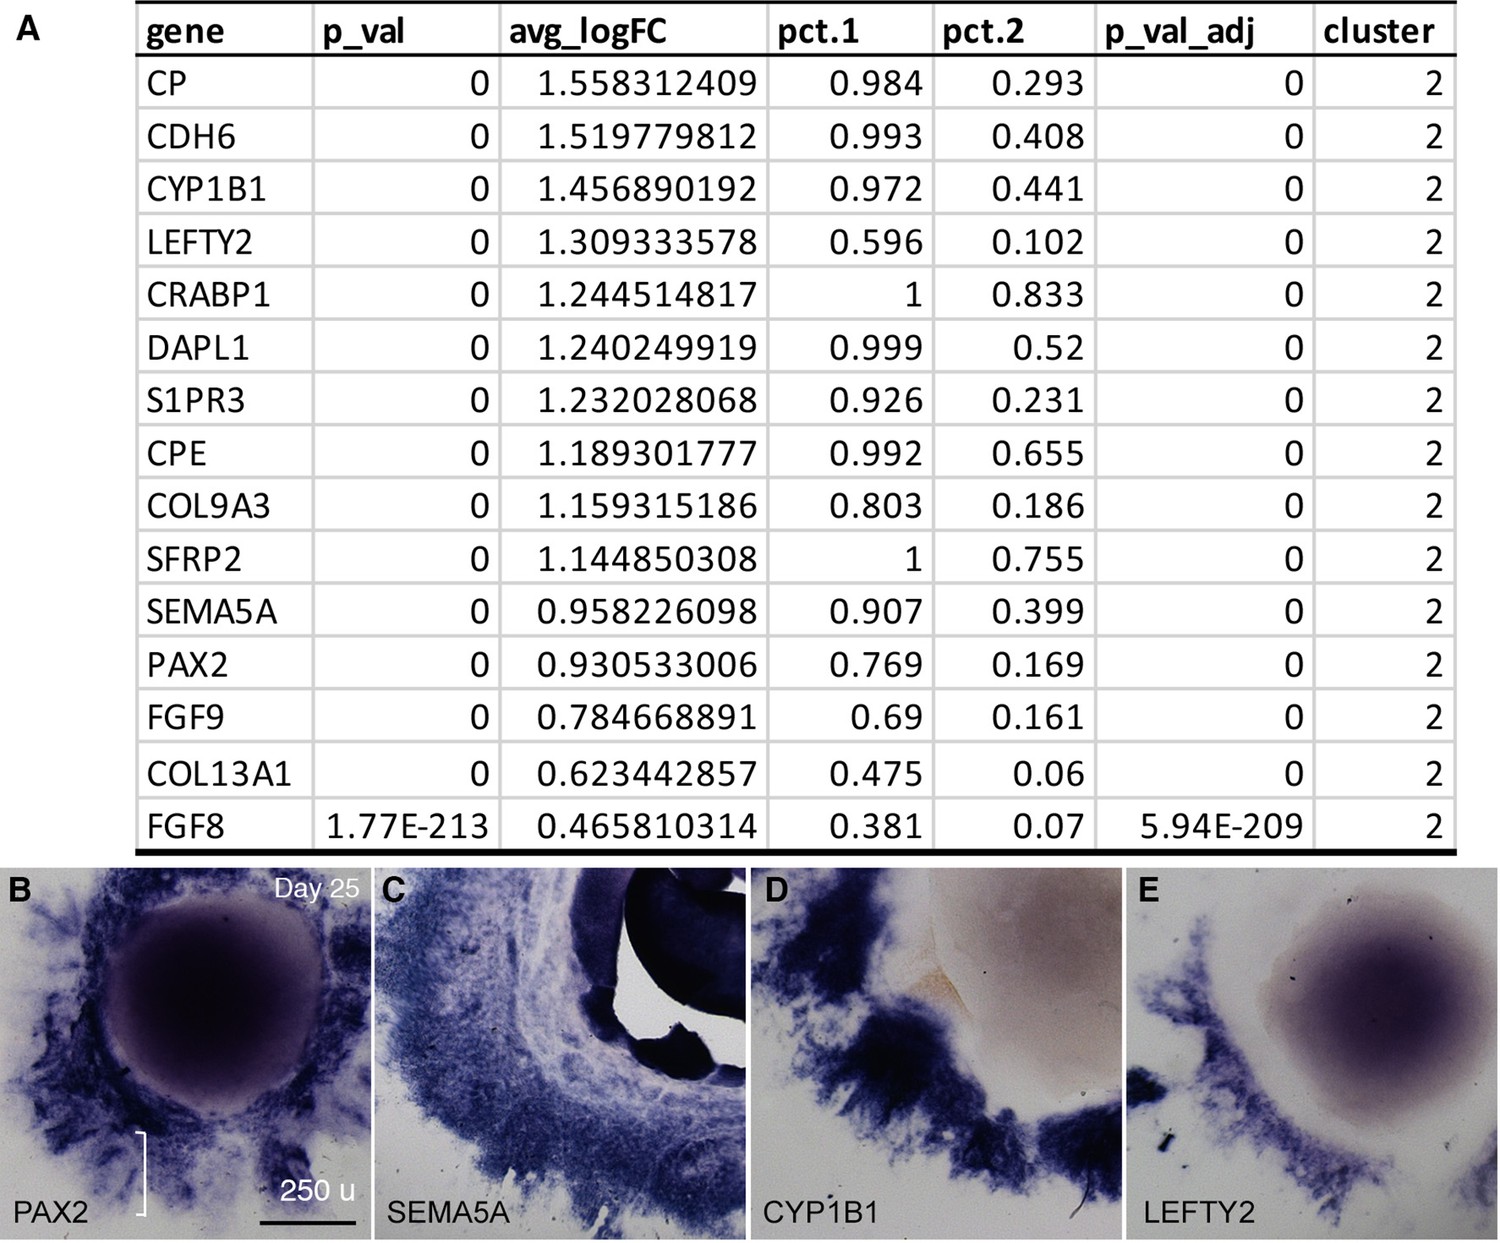
Expression signatures of cell cluster 2 in CONCEPT organoids.
(A) A list of top 10 DEGs and additional DEG markers SEMA5A, PAX2, COL13A1, FGF9, and FGF8 in cluster 2 were identified using Seurat analysis. (B–E) Expression of PAX2, SEMA5A, CYP1B1, and LEFTY2 in CONCEPT organoids at day 25 was revealed by in situ hybridization. The PAX2+ optic disc at the outer zone was marked (bracket in B).
Figure 4—figure supplement 8
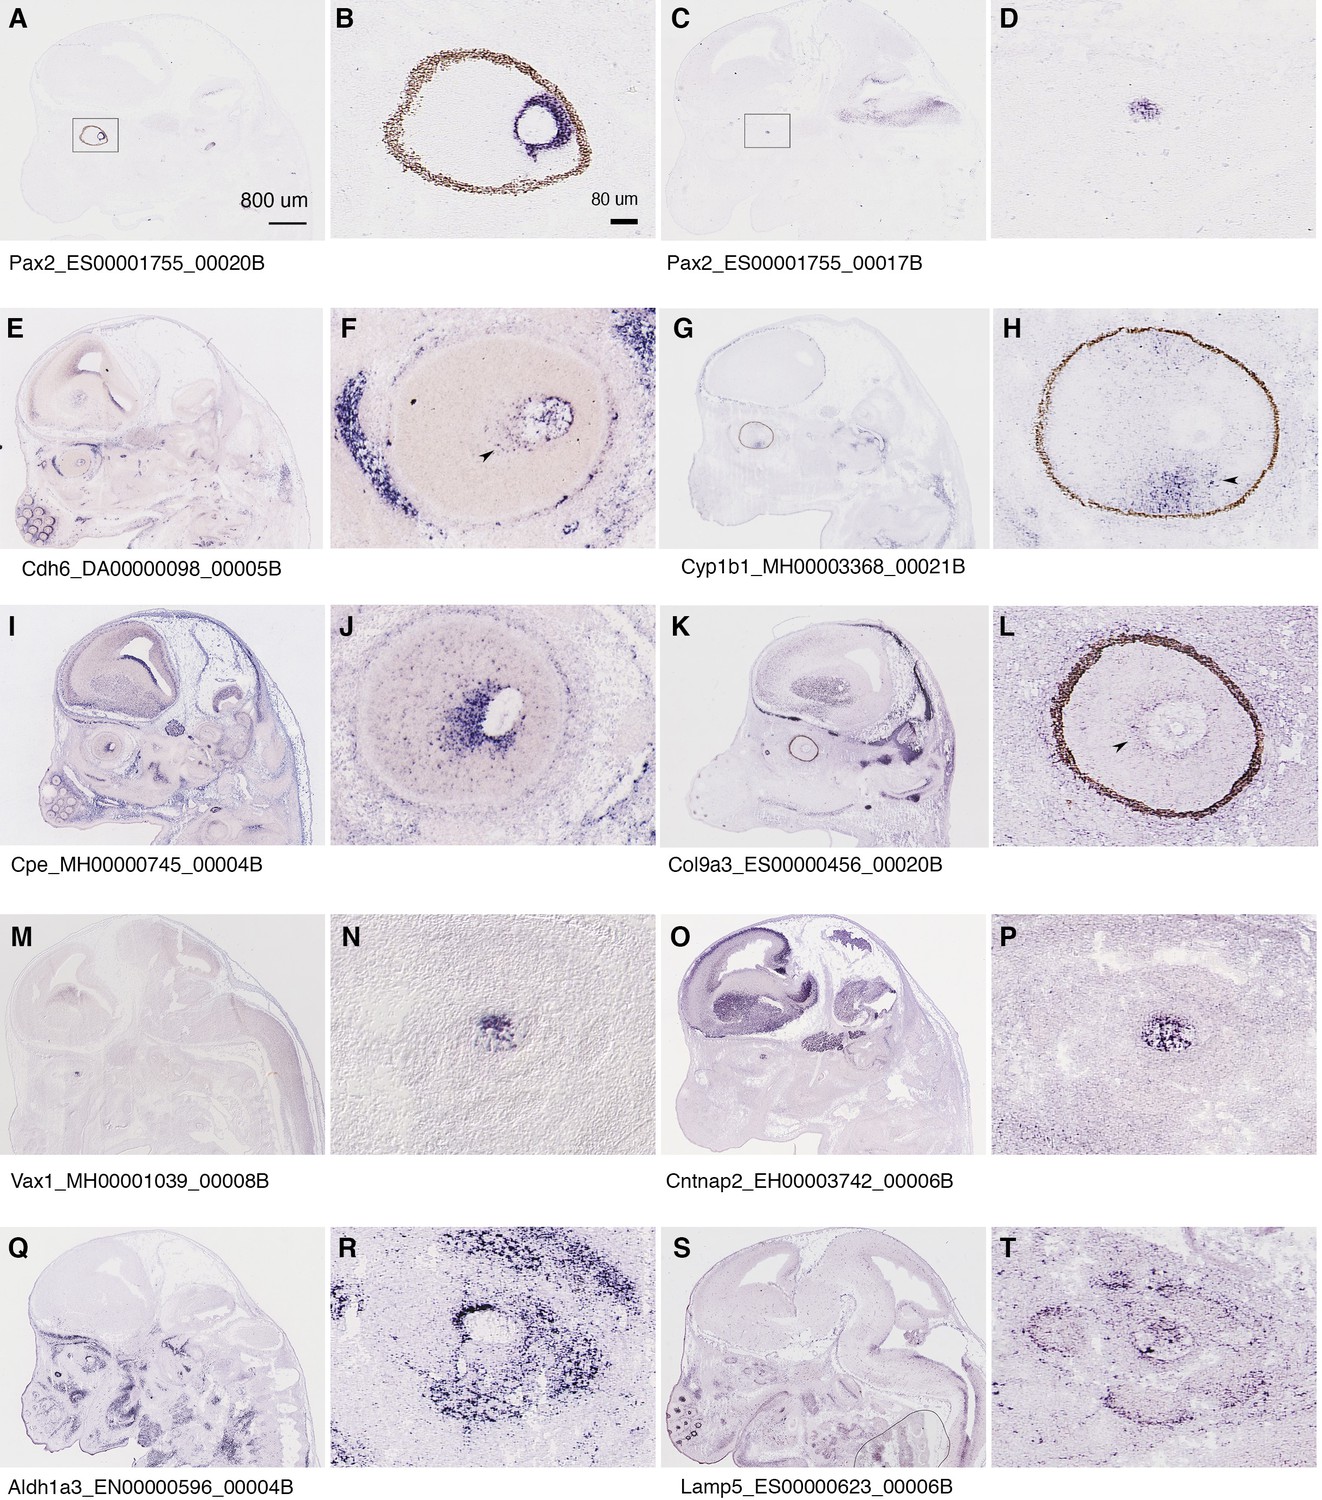
Mouse orthologs of the markers for assigned optic disc and optic stalk cells in CONCEPT organoids are indeed expressed in the optic disc and optic stalk/nerve in E14.5 mouse embryos.
Related also to Figure 4—figure supplement 7. In situ hybridization images of E14.5 mouse brains were downloaded from a public database (https://gp3.mpg.de/) with permission. Image IDs were shown following gene symbols. (A–D) Pax2 is expressed in both the optic disc (B) and stalk/nerve (D) of E14.5 mouse embryos. (E–L) Expression of mouse orthologs of top DEGs in cluster 2 (assigned optic disc cells) of CONCEPT organoids. (M–T) Expression of mouse orthologs for markers of assigned optic stalk cells in CONCEPT organoids.
Figure 4—figure supplement 9
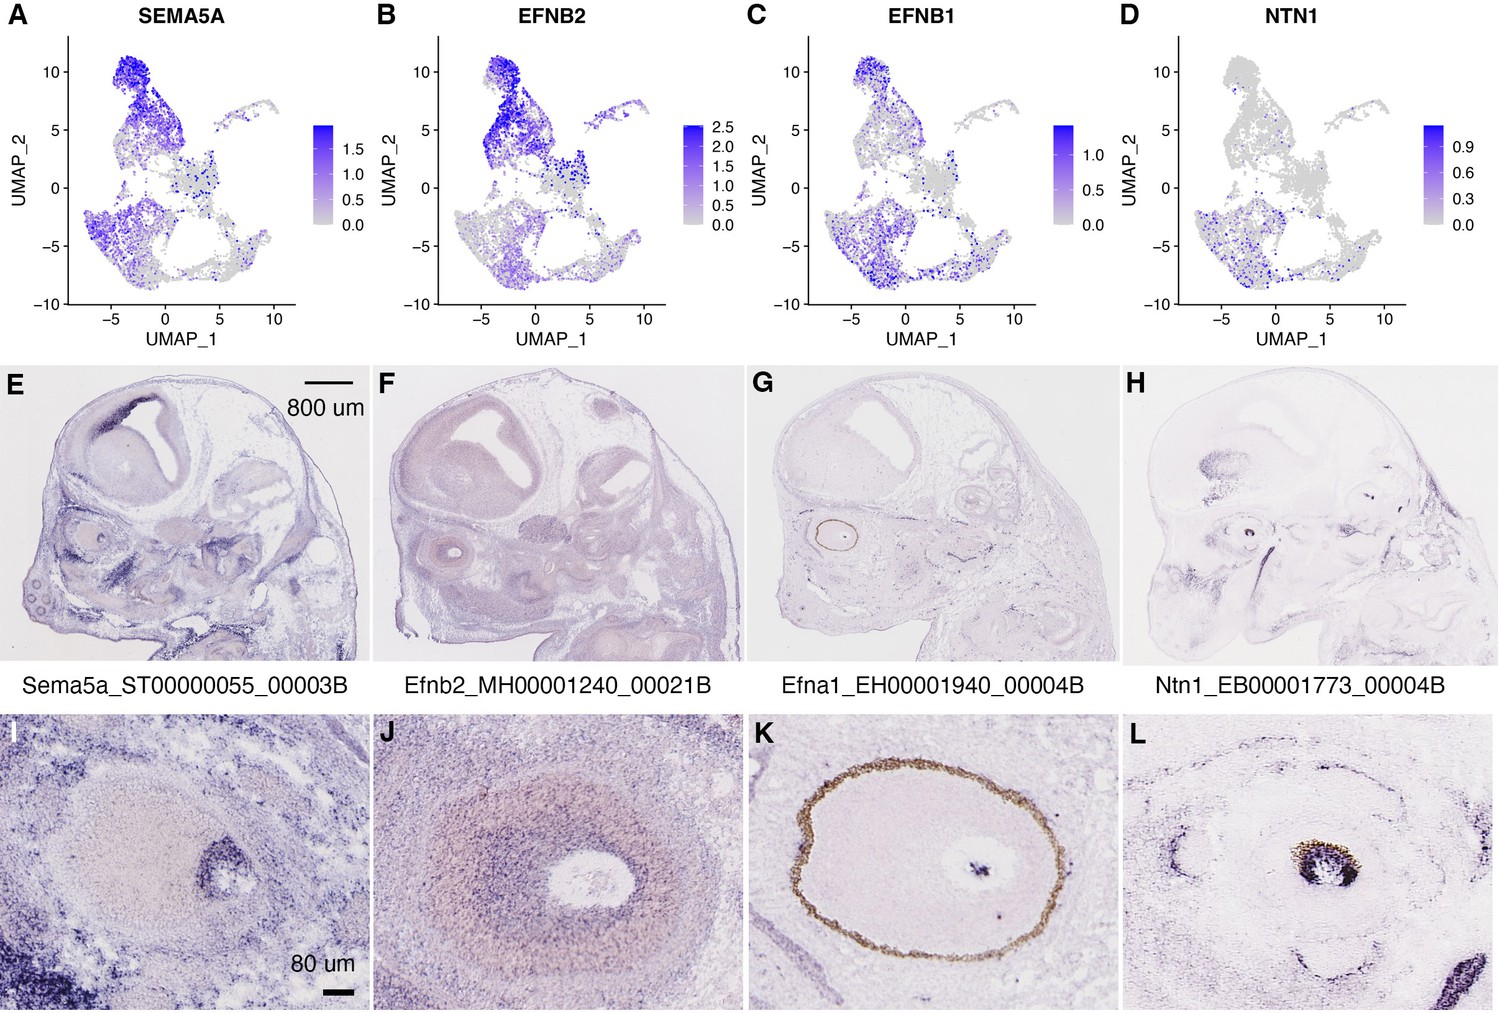
Expression of known axon guidance genes SEMA5A, EFNB2, EFNB1, and NTN1 in CONCEPT organoids and at optic disc/stalk areas of E14.5 mice.
(A–D) Expression of SEMA5A, EFNB2, EFNB1, and NTN1 in CONCEPT organoids. (E–L) Expression of Sema5a, Efnb2, Efnb1, and Ntn1 at optic disc/stalk areas of E14.5 mice. In situ hybridization images of E14.5 mouse brains were downloaded from a public database (https://gp3.mpg.de/) with permission.
Figure 4—figure supplement 10
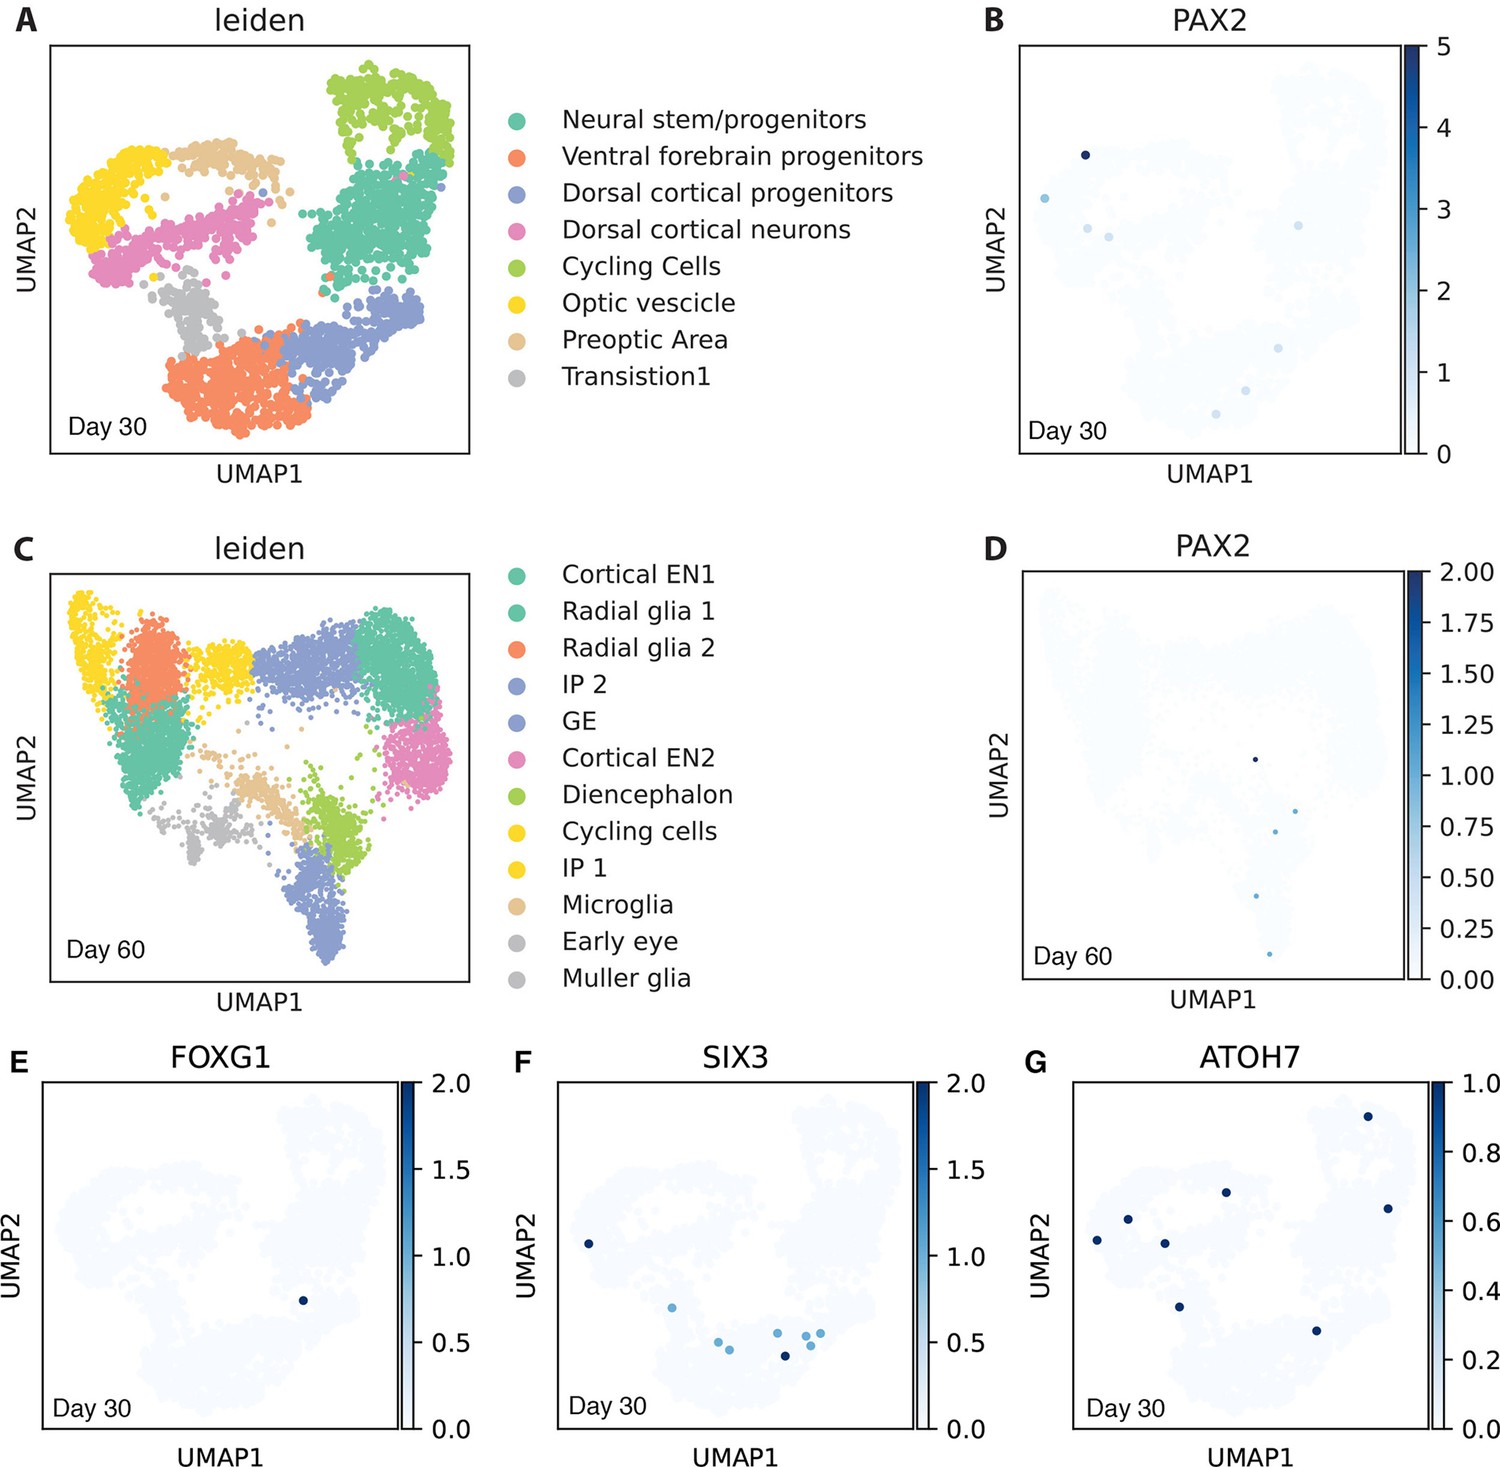
PAX2+ cells, FOXG1+ cells, SIX3+ cells, and ATOH7+ cells are extremely rare in Gabriel et al.’s organoids.
Related also to Figure 5. The dataset deposited by Gabriel et al. (Pasquini, 2021) was used for plotting. (A–D) Cell clustering was reproduced (A, C). In Gabriel et al.’s organoids on days 30 and 60, PAX2+ cells were extremely rare (B, D). Instead of forming cell clusters, a few PAX2+ cells were scattered across datasets. (E–G) In Gabriel et al.’s organoids on day 30, FOXG1+ telencephalic progenitors, SIX3+ retinal progenitors, and ATOH7+ neurogenic retinal progenitors were extremely rare; a few positive cells were scattered across the dataset. VSX2 was not found in the dataset of Gabriel et al.’s organoids on day 30; it was filtered out probably due to its extremely low expression.
Figure 4—figure supplement 11
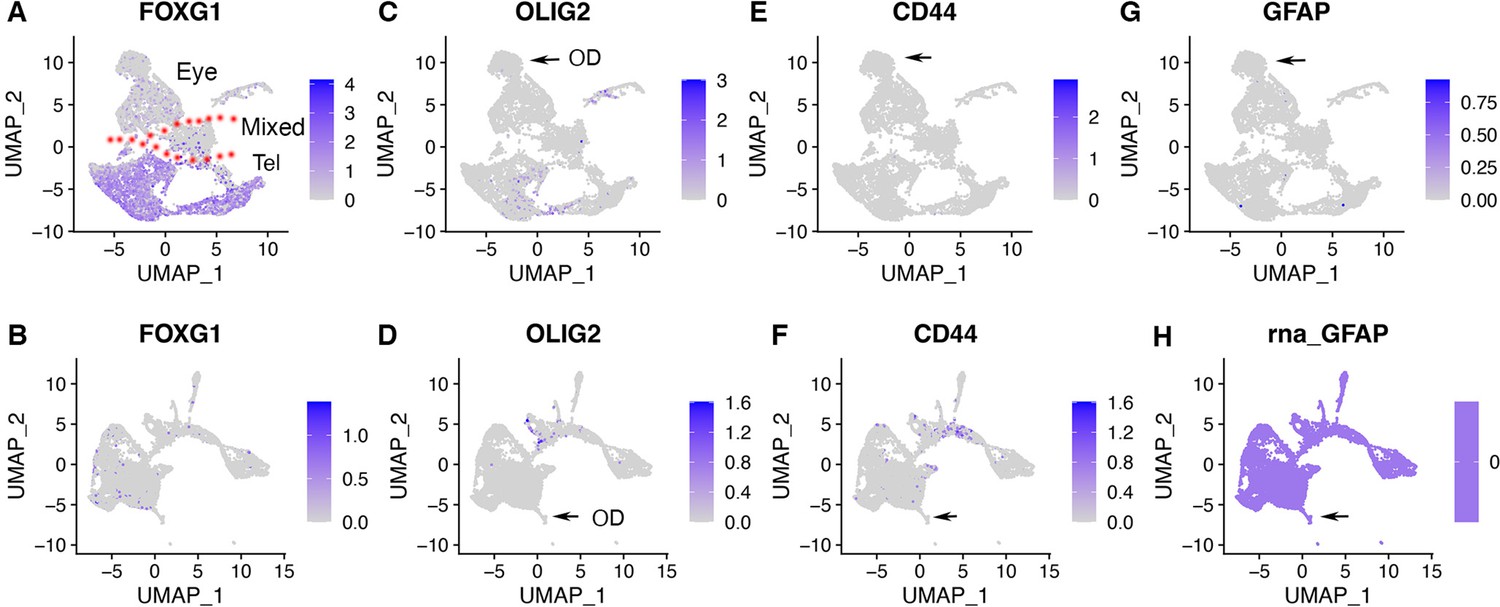
Expression of telencephalic gene marker FOXG1 and astrocyte markers OLIG2, CD44, and GFAP in CONCEPT organoids and human fetal retinas HGW9.
Related also to Figure 5. (A, B) Telencephalic gene marker FOXG1 was expressed in a portion of CONCEPT organoids but not in human fetal retinas HGW9, further indicating that the FOXG1+ cell population in CONCEPT organoids were non-retinal cells. (C–H) Astrocyte markers OLIG2, CD44, and GFAP were not expressed in either CONCEPT organoids or human fetal retinas HGW9.
Figure 5
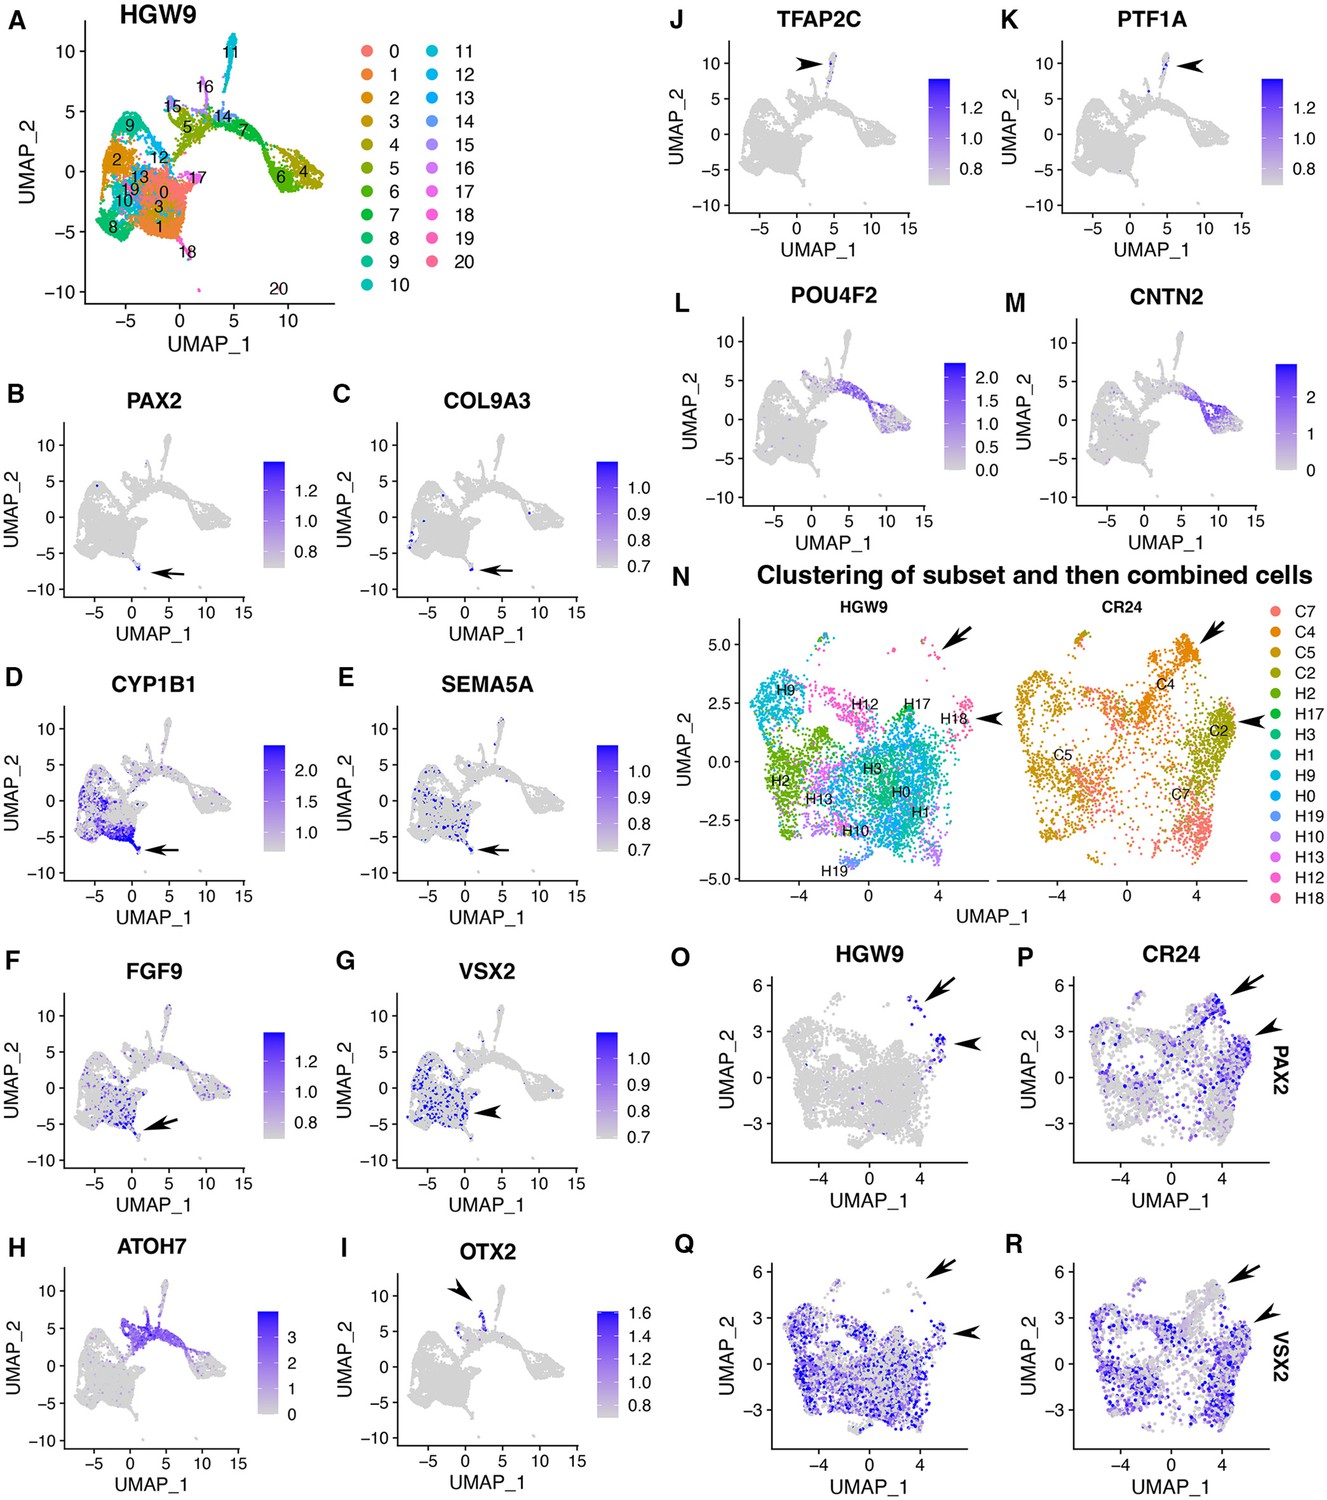
Expression signatures of human fetal retinas HGW9 are similar to those of CONCEPT organoids.
(A) Cell clustering of human fetal retinas HGW9 (GSE138002) identified 21 clusters. (B–F) Cluster 18 differentially expressed PAX2, COL9A3, CYP1B1, SEMA5A, and FGF9, which were top DEGs of cluster 2 in CONCEPT organoids. (G) VSX2 expression marked retinal progenitor cells. (H–M) Identification of neurogenic retinal progenitor cells (H), early photoreceptor cells (I), amacrine/horizontal cells (J, K), and early RGCs (L, M). POU4F2 and CNTN2 were largely co-expressed in early RGCs, consistent with their expression profiles in CONCEPT organoids. (N–R) When cells in cluster 18 and retinal progenitors from HGW9 were combined with cells in clusters 2, 4, 5, 7 from CONCEPT organoids (CR24) for Seurat anchor-based clustering, cells in cluster 18 from HGW9 (H18) were grouped with cluster 2 from CONCEPT organoids (C2, assigned optic disc; N), and these cells expressed both PAX2 and VSX2 (arrowheads in N-R). A small portion of H18 cells were grouped with C4 cells (assigned optic stalk; N), and these cells expressed PAX2 but not VSX2 (arrows in N-R).
Figure 6
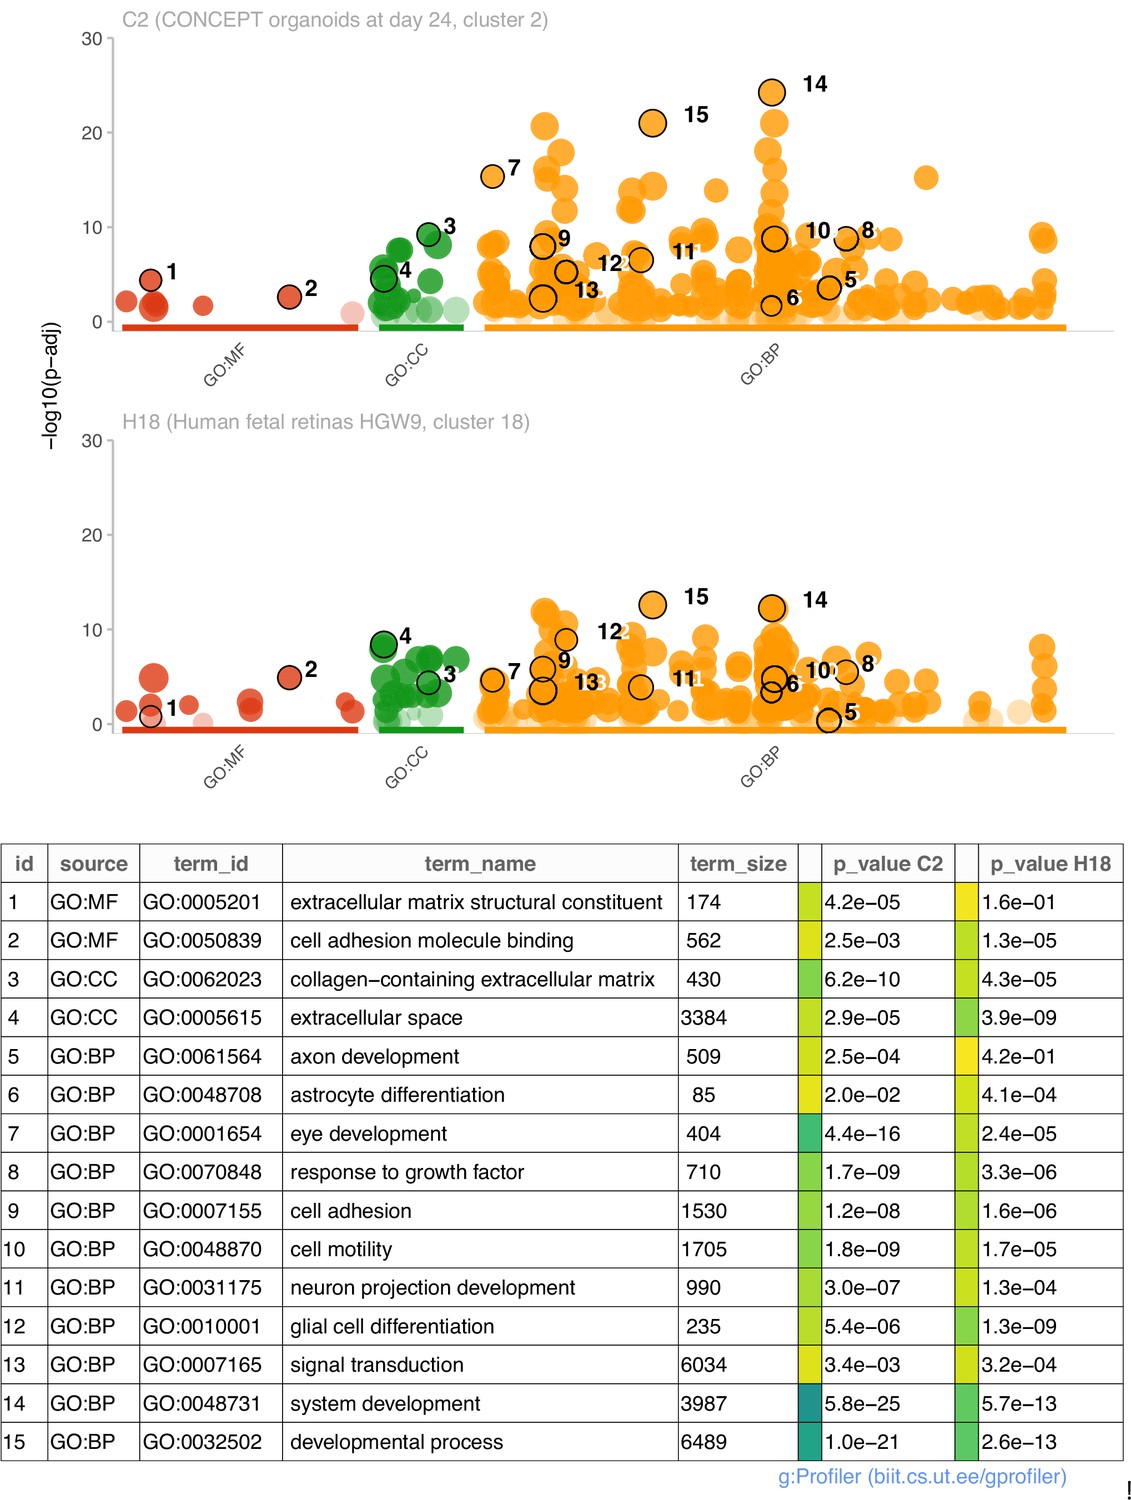
Comparisons of enriched GO terms in DEGs (top 200 genes) of cluster 2 in CONCEPT organoids and DEGs (113 genes) of cluster 18 in human fetal retinas HGW9.
A large number of GO terms were enriched in both samples.
Figure 7 with 1 supplement
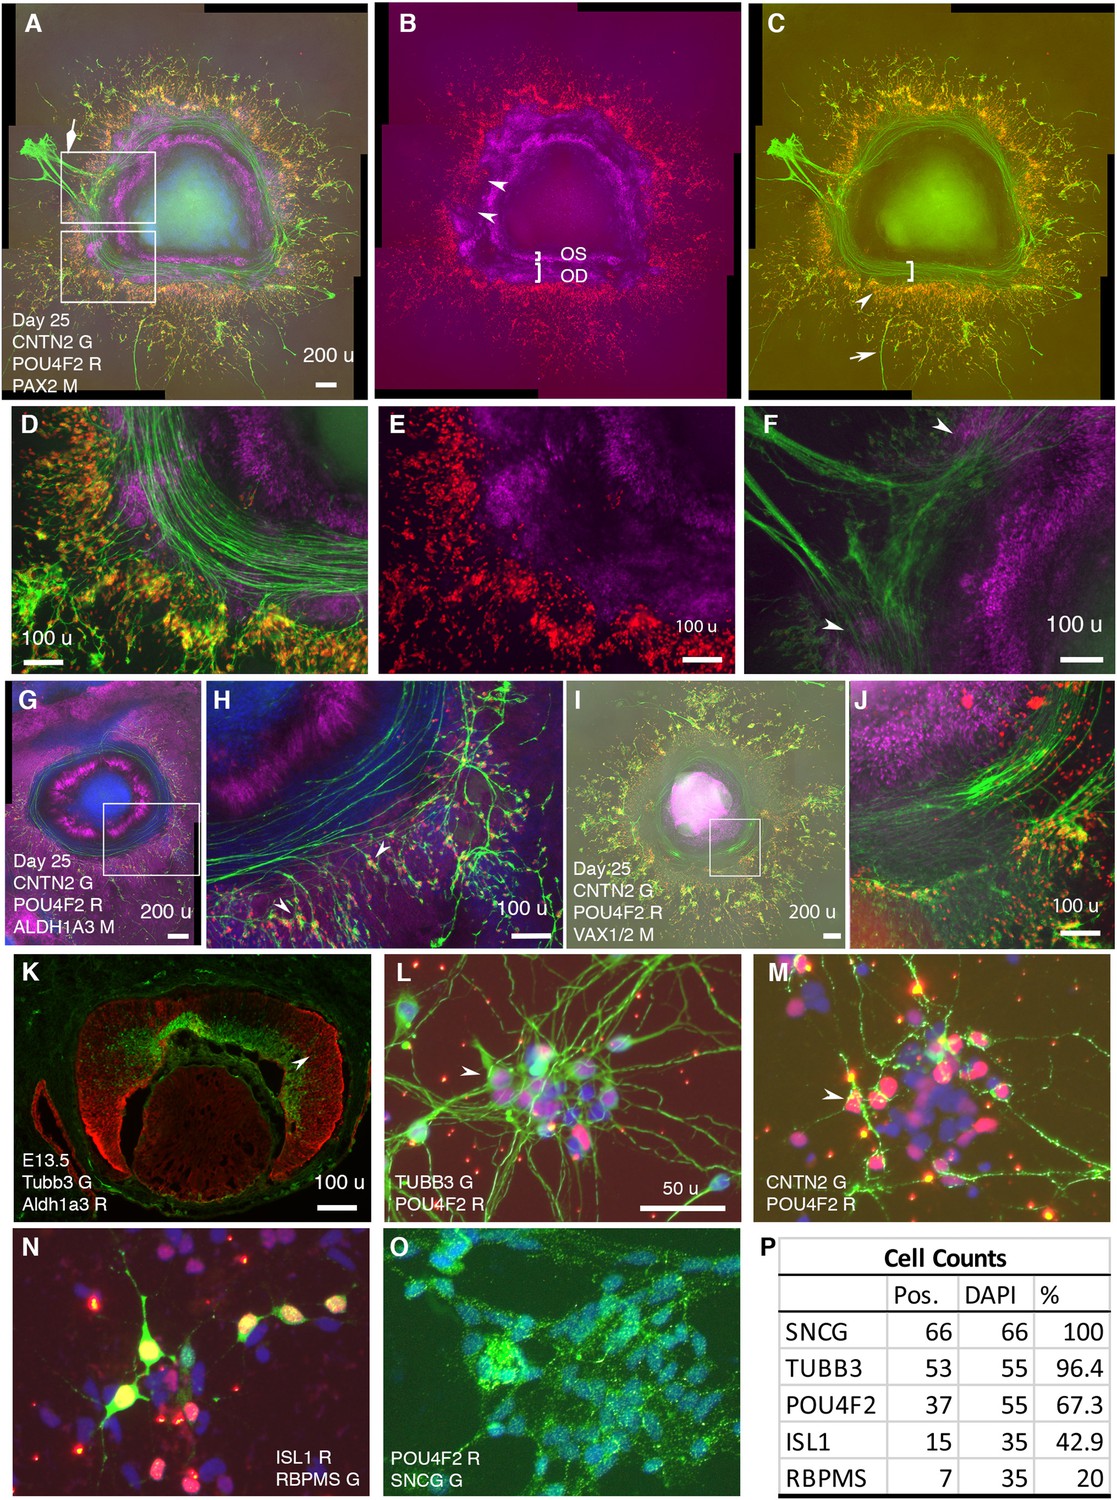
RGCs grow CNTN2+ axons toward and then along a defined path in CONCEPT telencephalon-eye organoids and can be isolated in one step via CNTN2 in a native condition.
N>5 experiments. (A–F) PAX2+ cells formed two concentric zones mimicking the optic stalk (OS) and optic disc (OD), respectively (A-C; high magnifications in D, E). POU4F2+ RGCs grew CNTN2+ axons toward and then along a path defined by adjacent PAX2+ optic disc cells (A–E). RGCs at a few hundreds of micrometers away from PAX2+ optic disc cells grew axons centrifugally (arrow in C). At regions where there was a gap in PAX2+ optic disc cells, CNTN2+ RGC axons exited the circular path and grew centrifugally (diamond arrowhead in A, double arrowheads in B and F). PAX2+ optic-stalk cells set up an inner boundary for RGC axon growth. (G, H) PAX2+ optic disc cells did not express ALDH1A3; the cells that set up the boundaries of the path highly expressed ALDH1A3. (I, J) Cells that set up the inner boundary for RGC axon growth expressed VAX1/VAX2 (the antibody recognizes both VAX1 and VAX2). (K) In E13.5 mouse eye, Aldh1a3 expression was high in the peripheral retina and was low or nearly absent in the central retina. (L–P) One-step isolation of RGCs. RGCs from floating retinal organoids at day 41 (L, M) and day 70 (N–O) were dissociated into single cells using Accutase and then isolated using MACS via CNTN2 for 10 day growth. Isolated RGCs expressed POU4F2 and grew TUBB3+ neurites in random directions (L). RGCs also expressed CNTN2 (M), ISL1 (N), RBPMS (N), and SNCG (O); positive cells were counted (P). Scale bars, 200 µm (A,G,I), 100 µm (D–F,H,J,K), 50 µm (L).
Figure 7—figure supplement 1
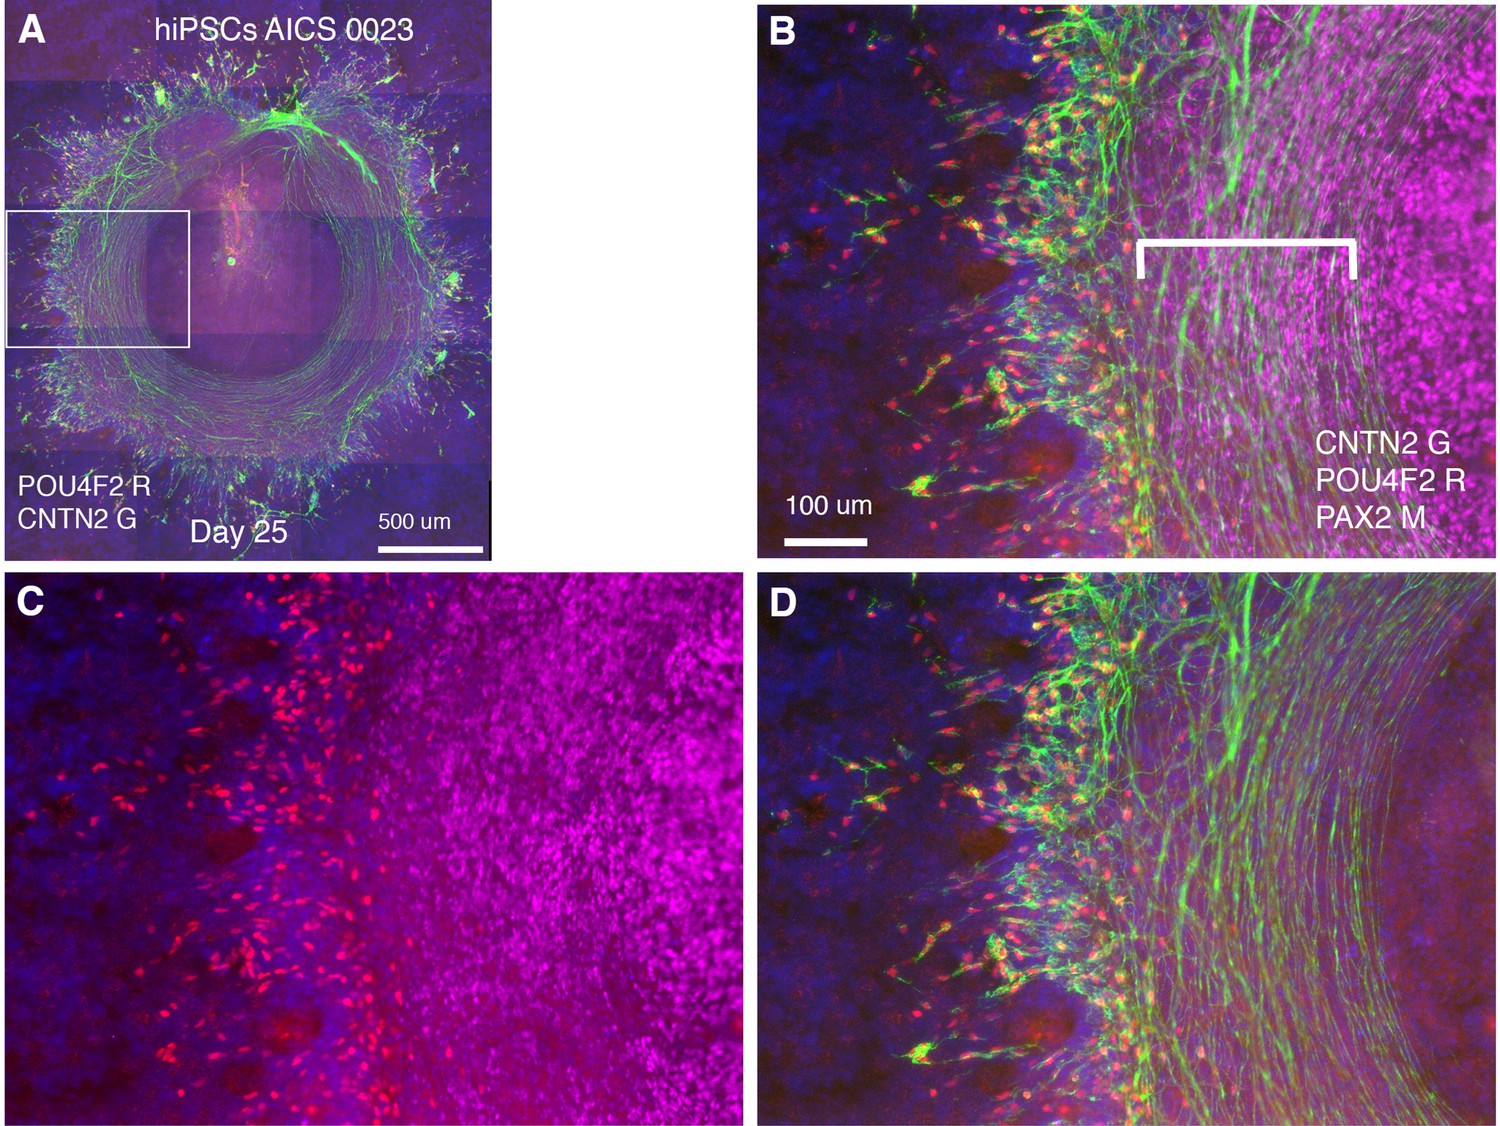
CONCEPT telencephalon-eye organoids are generated using hiPSC line AICS 0023.
hiPSCs (AICS 0023) were used for the generation of CONCEPT telencephalon-eye organoids. (A–D) POU4F2+ RGCs grew CNTN2+ axons toward and then along a circular path defined by PAX2+ optic disc cells. Scale bar, 500 µm (A), 100 µm (B).
Figure 8
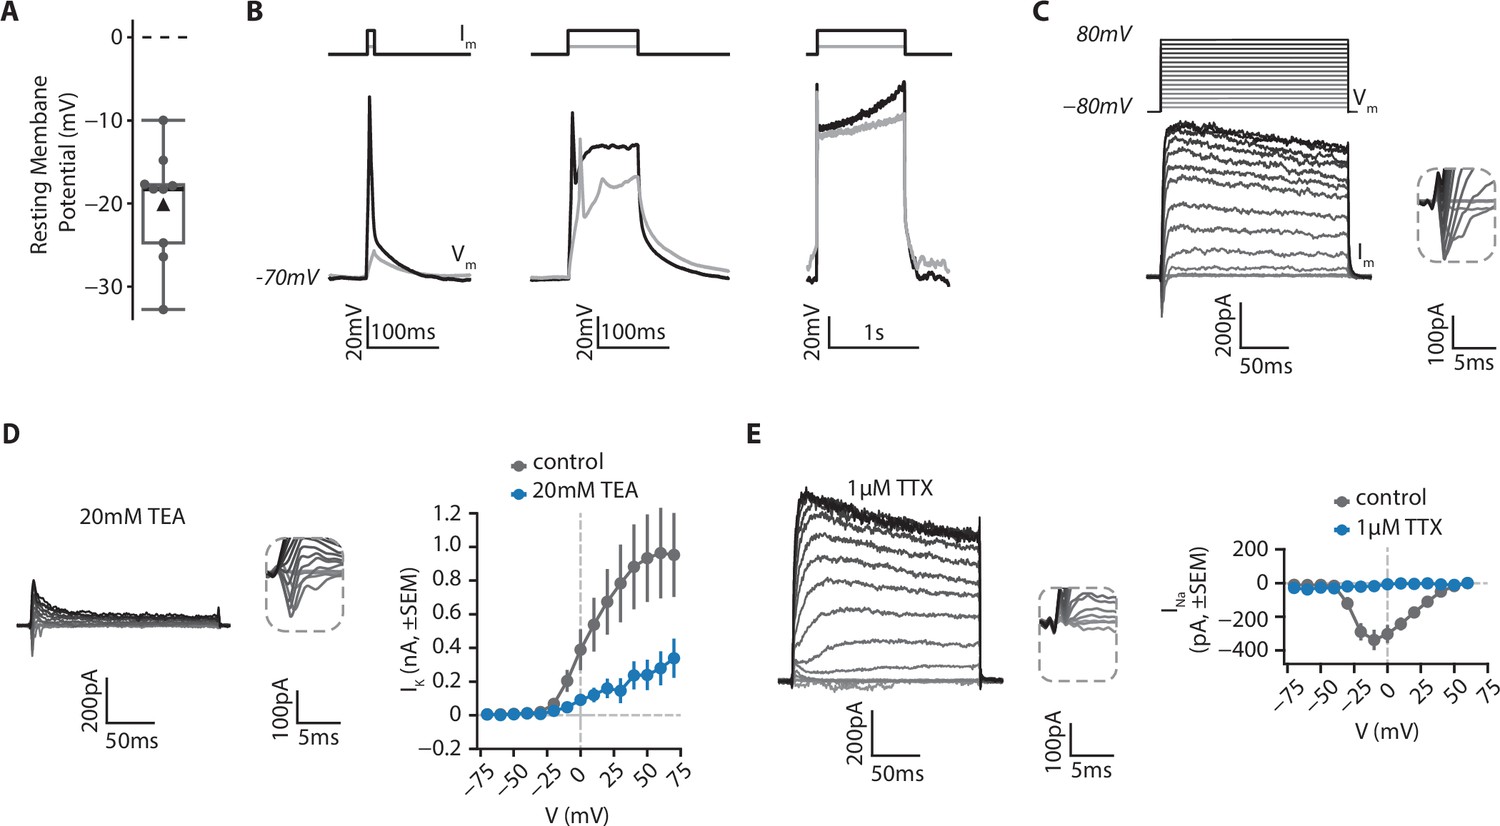
Electrophysiological features of RGCs.
RGCs from retinal organoids on day 48 were isolated using MACS via a CNTN2 antibody and then grown on polymer coverslips in a chamber slide for 20–25 days before whole-cell patch clamp recordings. (A) Resting membrane potential of RGCs. Black triangle: average; black line: median; box: interquartile range, n=9. (B) RGCs can fire action potentials. Cells were patched in current-clamp mode. A steady current (Im) was injected to maintain the membrane potential at –70 mV and depolarizing current steps of 10ms (left), 100ms (middle) or 1 s (right) were injected to elicit action potentials (Vm). (C) RGCs show functional voltage-gated currents. Cells were recorded in voltage-clamp (holding=-80mV) and depolarizing voltage steps (200ms, +10 mV steps up to 80 mV, Vm) were applied to record inward and outward voltage-gated currents (Im). Inset: zoom on inward currents. (D) Outward currents are primarily due to voltage-gated potassium channels. Left, representative example of a current-voltage experiment performed in presence of 20 mM Tetraethylammonium (TEA), a blocker of voltage-gated potassium channels. Inset: zoom on inward currents. Right, amplitude of potassium current as a function of membrane potential (mean ± SEM; ncontrol = 5, nTEA = 5). (E) Inward currents result from activity of voltage-gated sodium channels. Left, representative example of a current-voltage experiment performed in presence of 1 µM Tetrodotoxin (TTX), a blocker of voltage-gated sodium channels. Inset: zoom on inward currents. Right, amplitude of sodium current as a function of membrane potential (mean ± SEM; ncontrol = 5, nTTX = 3).
Figure 9 with 1 supplement
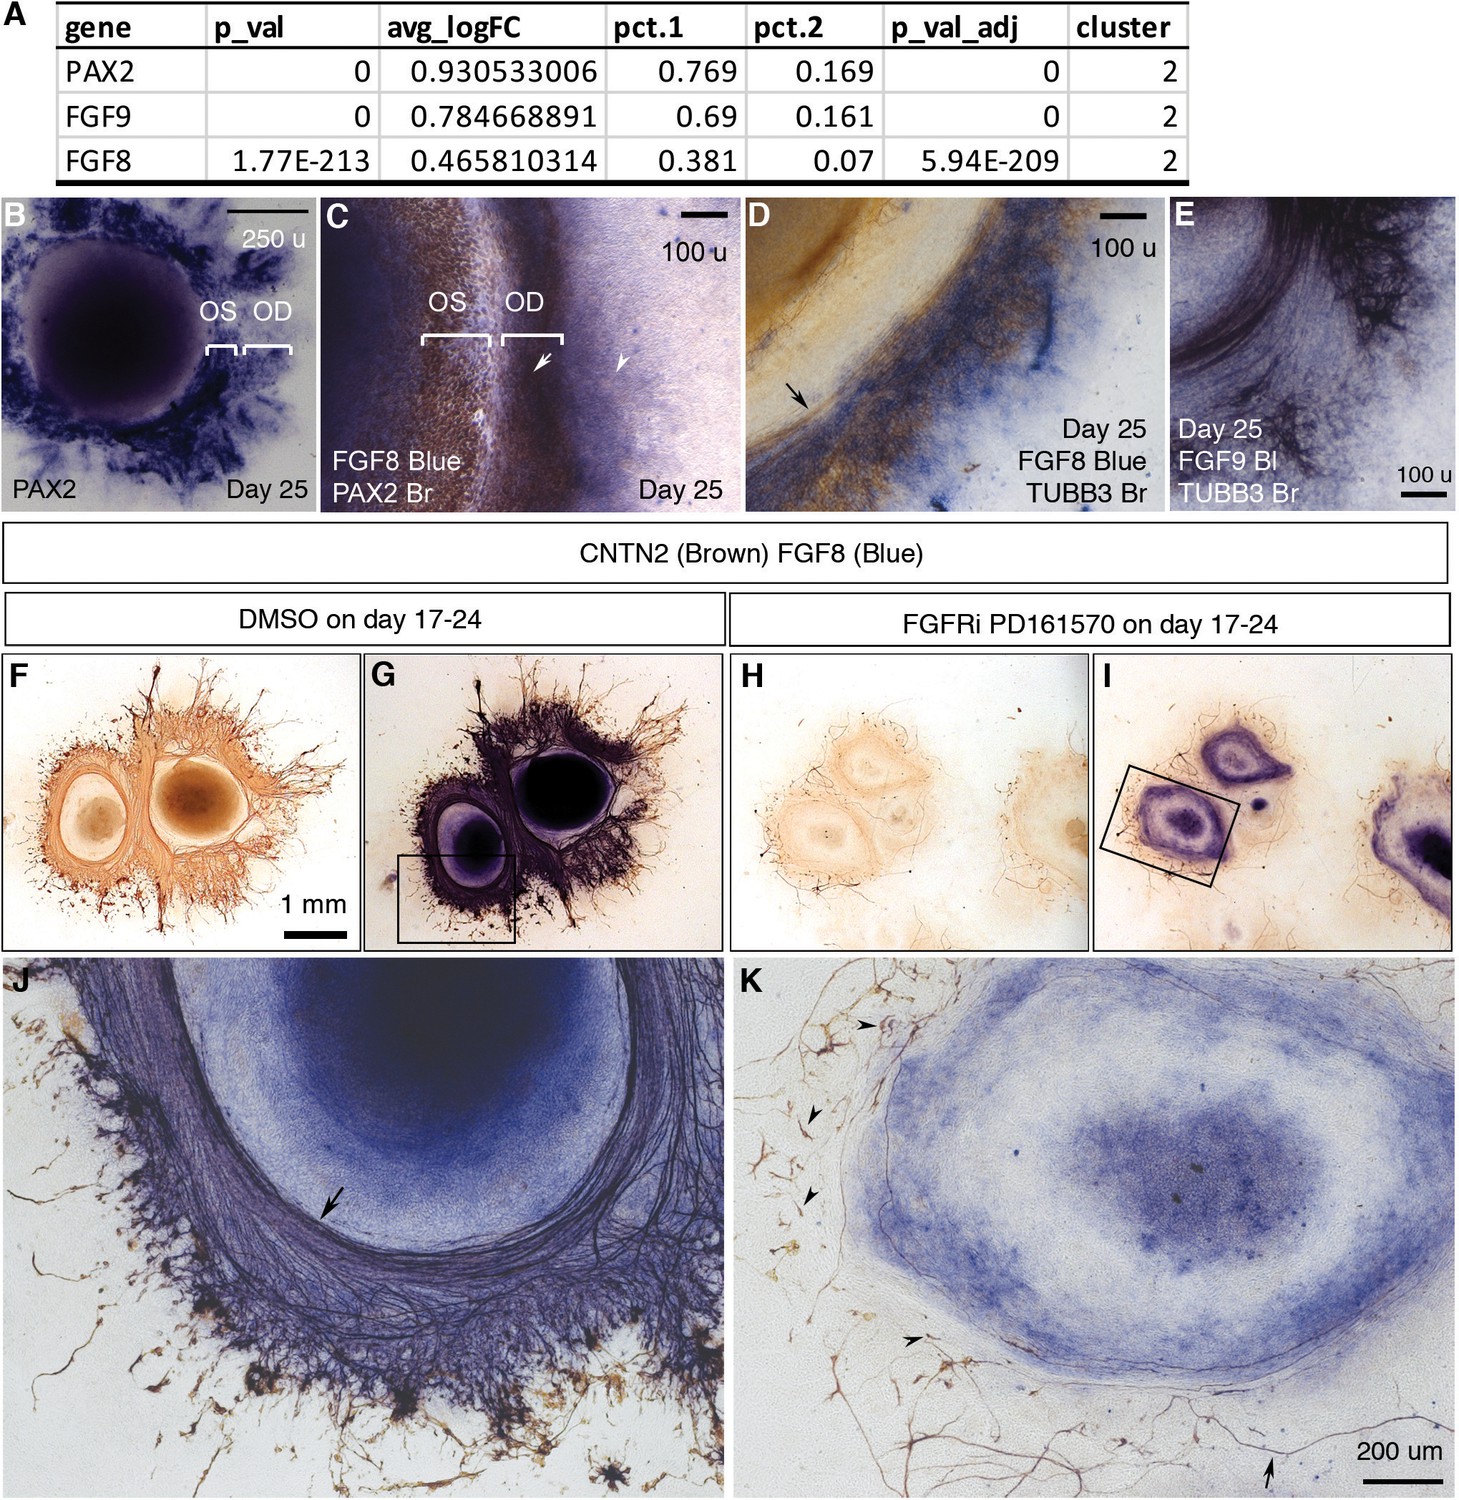
FGF signaling mediated by FGFRs is required for early RGC differentiation and directional axon growth.
(A) PAX2, FGF9, and FGF8 were differentially expressed in cluster 2, the major component of PAX2+ optic disc cells. (B) PAX2 mRNA expression in CONCEPT organoids on day 25. Two PAX2+ concentric zones corresponding to the optic stalk (OS) and optic disc (OD) are labeled. (C) Dual-color immunocytochemistry indicates the co-localization of FGF8 and PAX2 in the optic-disc zone of CONCEPT organoids on day 25. (D–E) TUBB3+ axons grew towards and then along the cells that expressed high levels of FGF8 (D) and FGF9 mRNA (E) in CONCEPT organoids on day 25. Immunocytochemistry of TUBB3 was performed after in situ hybridization. (F–K) After the inhibition of FGF signaling with FGFR inhibitor PD 161570 during days 17–24, FGF8 expression still largely remained, but the number of RGC somas drastically reduced (J, K). Notably, remaining RGCs nearly did not grow directional axons (arrowheads in K), and a few remaining axons wandered around (arrow in K). CNTN2 immunocytochemistry before (F, H) and after FGF8 immunocytochemistry (G, I, J, K) are shown. N=3/3 experiments. Scale bar, 250 µm (B), 100 µm (C–E), 1 mm (F), 200 µm (K).
Figure 9—figure supplement 1
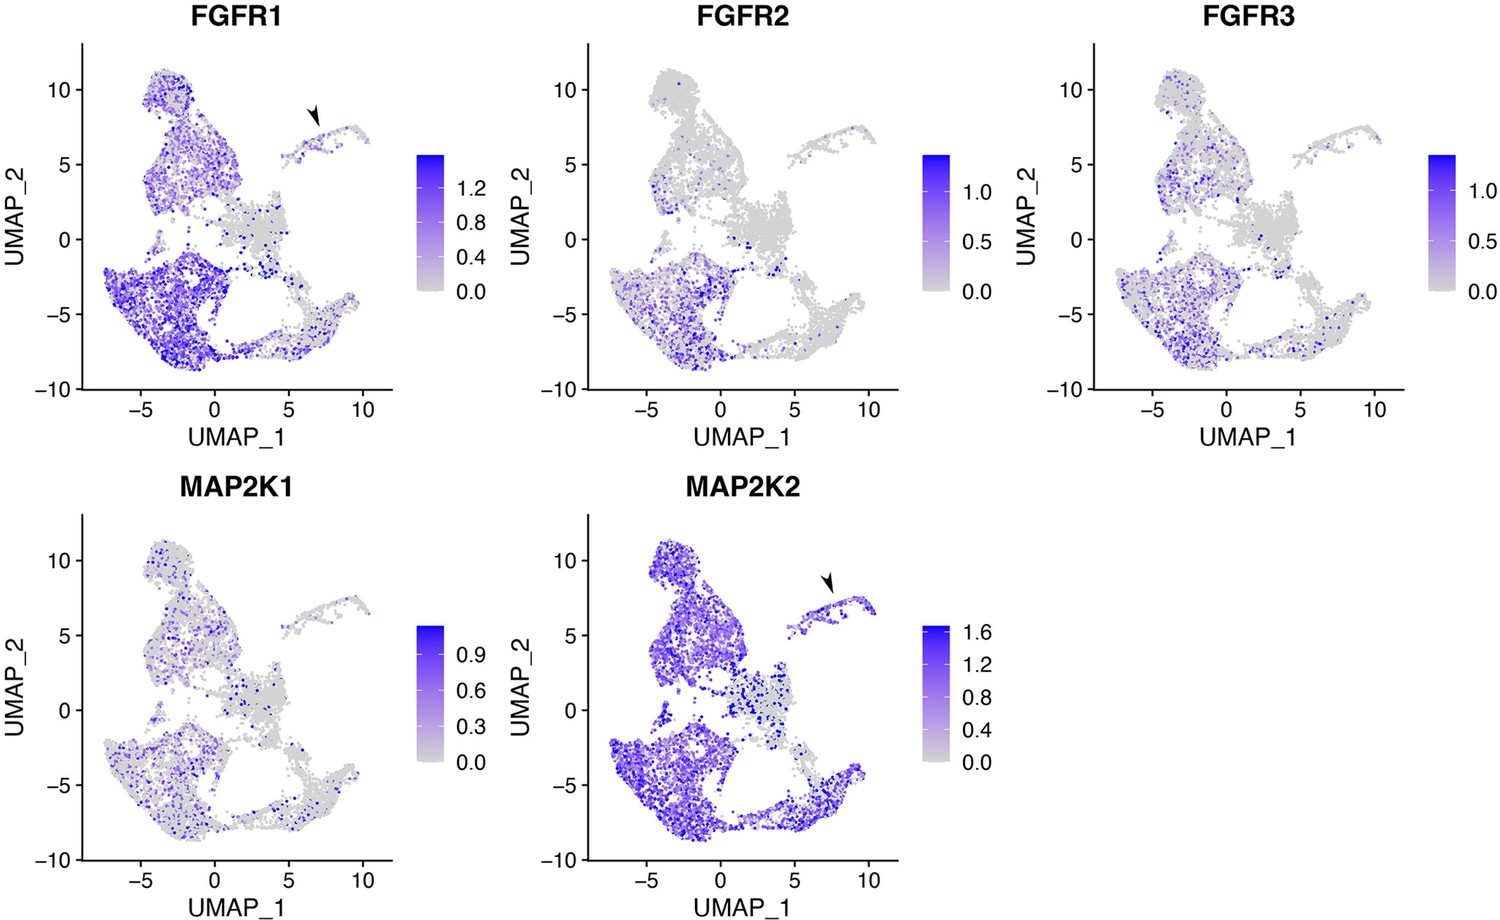
FGFR1, FGFR2, FGFR3, MAP2K1, and MAP2K2 are expressed in multiple types of cells, including RGCs, in CONCEPT organoids.
Related also to Figure 4. In RGCs, FGFR1 and MAP2K2 were expressed.
Tables
Table 1
Cell counts for clusters in the scRNA-seq dataset of CONCEPT organoids at day 24.
| Clusters | 0 | 1 | 2 | 3 | 4 | 5 | 6 | 7 | 8 | 9 | 10 | 11 | 12 | 13 |
|---|---|---|---|---|---|---|---|---|---|---|---|---|---|---|
| Idents | Mixed(lower counts) | dTel | OD | vTel | dTel/OS | NR | RPE | NR | dTel/ OS | dTel/ OS | vTel | RGC/PR/AC/HC | vTel | UD |
| # Cells | 1295 | 1158 | 964 | 931 | 921 | 871 | 747 | 743 | 729 | 603 | 450 | 393 | 333 | 80 |
| percent | 0.127 | 0.113 | 0.094 | 0.091 | 0.09 | 0.085 | 0.073 | 0.073 | 0.071 | 0.059 | 0.044 | 0.038 | 0.033 | 0.008 |
-
Abbreviations: Idents, assigned cell identities; # Cells, cell number; Tel, telencephalon; NR, neural retina; OD, optic disc; OS, optic stalk; RPE, retinal pigment epithelial cells; RGC, retinal ganglion cells; PR, photoreceptor cells; AC, amacrine cells; HC, horizontal cells; UD, undetermined.
Key resources table
| Reagent type (species) or resource | Designation | Source or reference | Identifiers | Additional information |
|---|---|---|---|---|
| Cell line (Homo-sapiens) | H1 hESCs | WiCell | WA01 | |
| Cell line (Homo-sapiens) | hiPSCs | Corriell Institute | AICS 0023 | |
| Antibody | anti-FOXG1 (Rabbit polyclonal) | Abcam | Cat# ab18259 | IF (1:500) |
| Antibody | Anti-TUBB3 (mouse monoclonal) | Covance | Cat# MMS-435P | IF (1:1000) |
| Antibody | Anti-FGF8 (mouse monoclonal) | R&D | Cat# MAB323 | ICC (1:500) |
| Antibody | Anti-RBPMS (rabbit polyclonal) | PhosphoSolution | Cat# 1830-RBPMS | IF (1:200) |
| Antibody | Anti-ISL1 (mouse monoclonal) | DSHB | 40.2D6 | IF (1:500) |
| Antibody | Anti-SNCG (rabbit polyclonal) | Abcam | Cat# ab55424 | IF (1:200) |
| Antibody | Anti-PAX2 (rabbit polyclonal) | Invitrogen | Cat# 716000 | IF (1:200) |
| Antibody | Anti-alpha A crystallin (rabbit polyclonal) | Santa Cruz sc | Cat# sc-22743 | IF (1:500) |
| Antibody | Anti-beta crystallin (rabbit polyclonal) | Santa Cruz | Cat# sc-22745 | IF (1:100) |
| Antibody | Anti-gamma crystallin (rabbit polyclonal) | Santa Cruz | Cat# sc-22746 | Western (1:1000) |
| Antibody | Anti-CNTN2 (mouse monoclonal) | DSHB | Cat# 4D7 | IF (1:100) |
| Antibody | Anti- ALDH1A3 (rabbit polyclonal) | Invitrogen | Cat# PA529188 | IF (1:500) |
| Antibody | Anti-VAX1/2 (rabbit polyclonal) | Santa Cruz | Cat# sc-98613 | IF (1:200) |
| Antibody | Anti-PAX6 (rabbit polyclonal) | Covance | Cat# PRB-278P | IF (1:500) |
| Antibody | Anti- POU4F2 (goat polyclonal) | Santa Cruz | Cat# SC-6026 | IF (1:200) |
| Antibody | Anti-VSX2 (sheep polyclonal) | Millipore | Cat# AB9016 | IF (1:500) |
| Commercial assay or kit | DIG RNA Labeling Mix | Millipore Sigma | Cat# 11277073910 | |
| Commercial assay or kit | MagnaBind goat anti-mouse IgG beads | ThermoScientific | Cat# 21354 | |
| Sequence-based reagent | BMP4, forward | This paper | PCR primers | CGGAAGCTAGGTGAGTGTGG |
| Sequence-based reagent | BMP4, reverse | This paper | PCR primers | GAGtaatacgactcactatagggG GAAGCCCCTTTCCCAATCA |
| Sequence-based reagent | BMP7, forward | This paper | PCR primers | gaggtccctctccattccct |
| Sequence-based reagent | BMP7, reverse | This paper | PCR primers | GAGtaatacgactcactatag ggtgcacccatcagacctccta |
| Sequence-based reagent | FGF8, forward | This paper | PCR primers | GTTGCACTTGCTGGTCCTCT |
| Sequence-based reagent | FGF8, reverse | This paper | PCR primers | GAGtaatacgactcactatagggT TGAGTTTTGGGTGCCCTAC |
| Sequence-based reagent | PAX2, forward | This paper | PCR primers | gctgtctgtgctgtgagagt |
| Sequence-based reagent | PAX2, reverse | This paper | PCR primers | GAGtaatacgactcactatag ggccggggacatttagcaggtt |
| Sequence-based reagent | SEMA5A, forward | This paper | PCR primers | CAGAGGCTCAGGCACAATGA |
| Sequence-based reagent | SEMA5A, reverse | This paper | PCR primers | GAGtaatacgactcactatagggT CCGTGTCTACCCAGGACTT |
| Sequence-based reagent | CYP1B1, forward | This paper | PCR primers | cccagcggttcttcatgagt |
| Sequence-based reagent | CYP1B1, reverse | This paper | PCR primers | GAGtaatacgactcactata ggggcacacttggttgcgttagt |
| Sequence-based reagent | LEFTY2, forward | This paper | PCR primers | agccctctaactgaacgtgtg |
| Sequence-based reagent | LEFTY2, reverse | This paper | PCR primers | GAGtaatacgactcactataggg tcttctgagtatctacattcaattgct |
| Sequence-based reagent | EMX2, forward | This paper | PCR primers | ACCGAGAAAGGGAGAGGGAA |
| Sequence-based reagent | EMX2, reverse | This paper | PCR primers | GAGtaatacgactcactatagggT CGGCCAATTTCTCCAACCA |
| Sequence-based reagent | FGF9, forward | This paper | PCR primers | GTCCGCTATGAACCTGTGGT |
| Sequence-based reagent | FGF9, reverse | This paper | PCR primers | GAGtaatacgactcactatagggAT AGTCTCGCTTGCCCAAGG |
| Chemical compound, drug | PD 161570 | Tocris | Cat# 3724 | 1 µM |
| Software, algorithm | Seurat | Stuart et al., 2019. | Seurat v3.2.0 | |
| Software, algorithm | CellRanger | 10 x Genomics | CellRanger (3.1.0) |
Additional files
-
Supplementary file 1
DEGs of cell clusters in the scRNA-seq dataset of CONCEPT organoids at day 24.
- https://cdn.elifesciences.org/articles/87306/elife-87306-supp1-v1.xlsx
-
Supplementary file 2
DEGs of cell clusters in the scRNA-seq dataset of human fetal retinas HGW9 (GSE138002).
- https://cdn.elifesciences.org/articles/87306/elife-87306-supp2-v1.zip
-
MDAR checklist
- https://cdn.elifesciences.org/articles/87306/elife-87306-mdarchecklist1-v1.pdf
Download links
A two-part list of links to download the article, or parts of the article, in various formats.
Downloads (link to download the article as PDF)
Open citations (links to open the citations from this article in various online reference manager services)
Cite this article (links to download the citations from this article in formats compatible with various reference manager tools)
Self-formation of concentric zones of telencephalic and ocular tissues and directional retinal ganglion cell axons
eLife 12:RP87306.
https://doi.org/10.7554/eLife.87306.3


