A distributed brain response predicting the facial expression of acute nociceptive pain
- Department of Psychology, Université de Montréal, Canada
- Centre de recherche de l’institut universitaire de gériatrie de Montréal, Canada
- Department of medical psychology and sociology, Medical faculty, University of Augsburg, Germany
- School of Psychology, Université Laval, Canada
- Faculty of Dentistry, McGill University, Canada
- Department of Anesthesia, McGill University, Canada
- Alan Edwards Centre for Research on Pain, McGill University, Canada
- Department of Psychological and Brain Sciences, Dartmouth College, United States
- Stomatology Department, Faculté de médecine dentaire, Université de Montréal, Canada
Figures
Figure 1 with 3 supplements
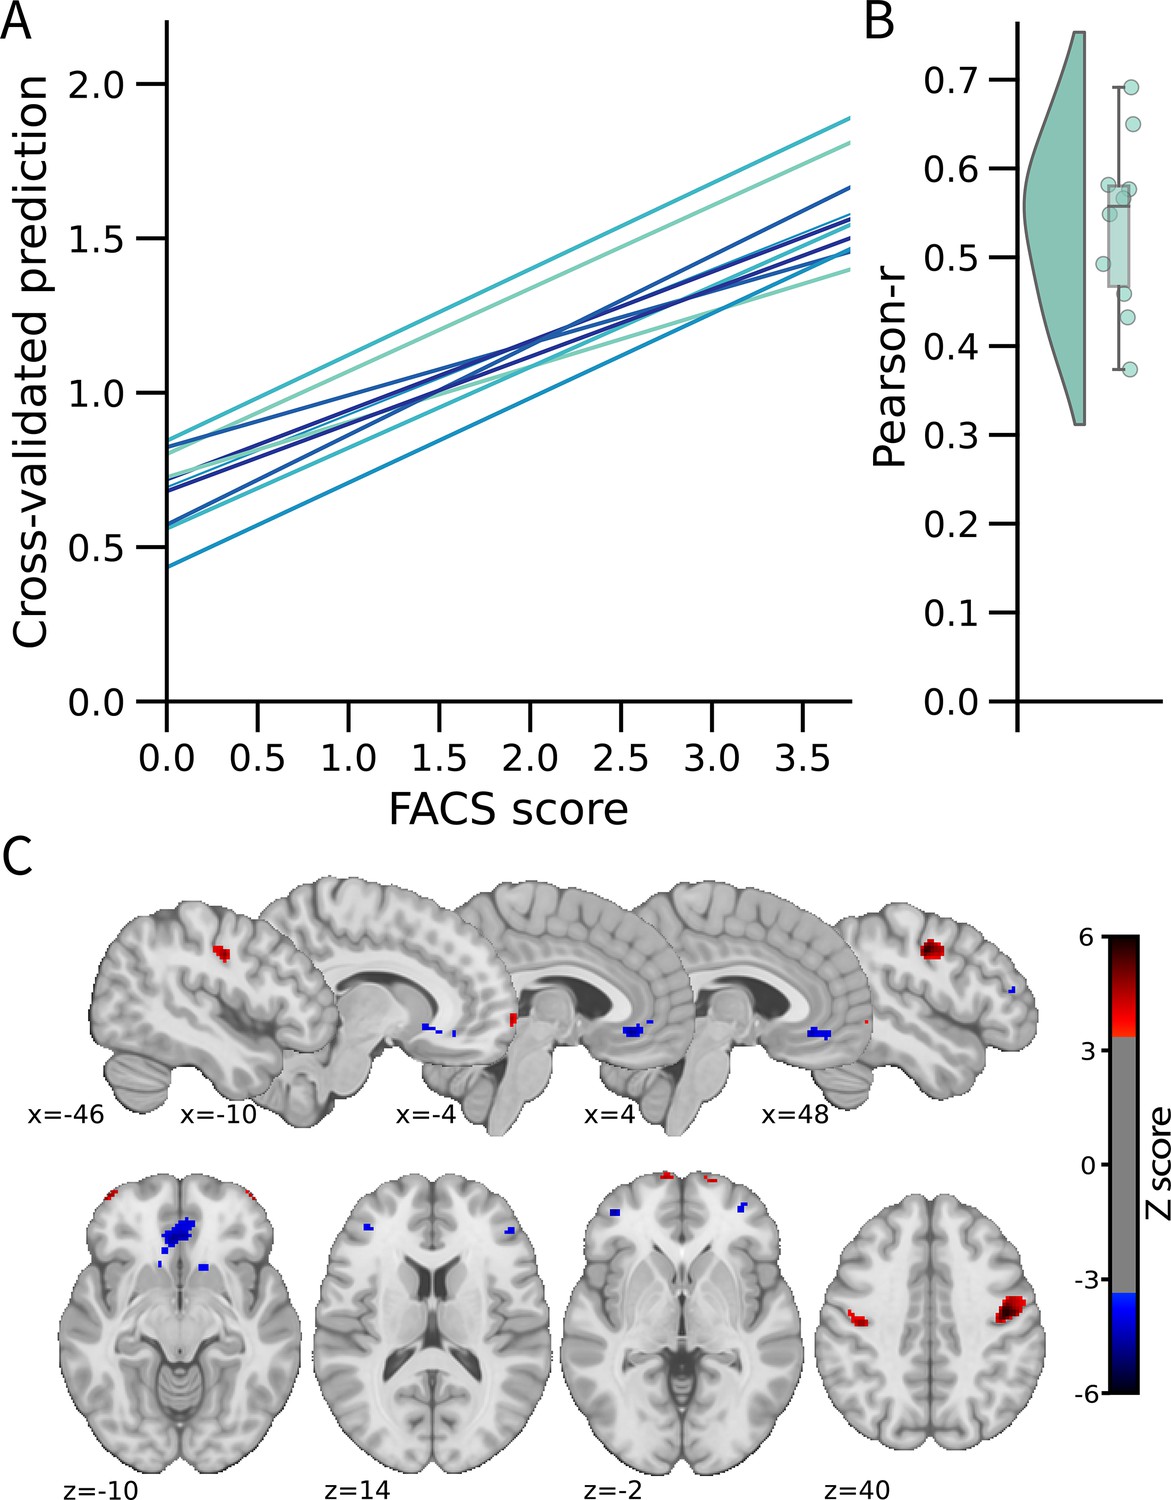
Facial expression of pain signature (FEPS): a brain signature of the facial expression of pain.
(A) Relationship between the actual and the predicted facial action coding system (FACS) composite scores for each cross-validation fold. (B) Distribution of the Pearson’s r scores across the cross-validation folds. (C) Predictive weight map of pain expression thresholded at FDR corrected q<0.05 using bootstrap tests performed with 5000 samples (with replacement). The thresholded map is shown for visualization and interpretation purposes only, although the prediction was made using voxel weights across the whole brain. MNI coordinates of the clusters with the related z-score can be found in Supplementary file 1A and B. The colour bar represents the z-scored regression weights reflecting the positive and negative association with the magnitude of the FACS composite score of pain expression.
Figure 1—figure supplement 1
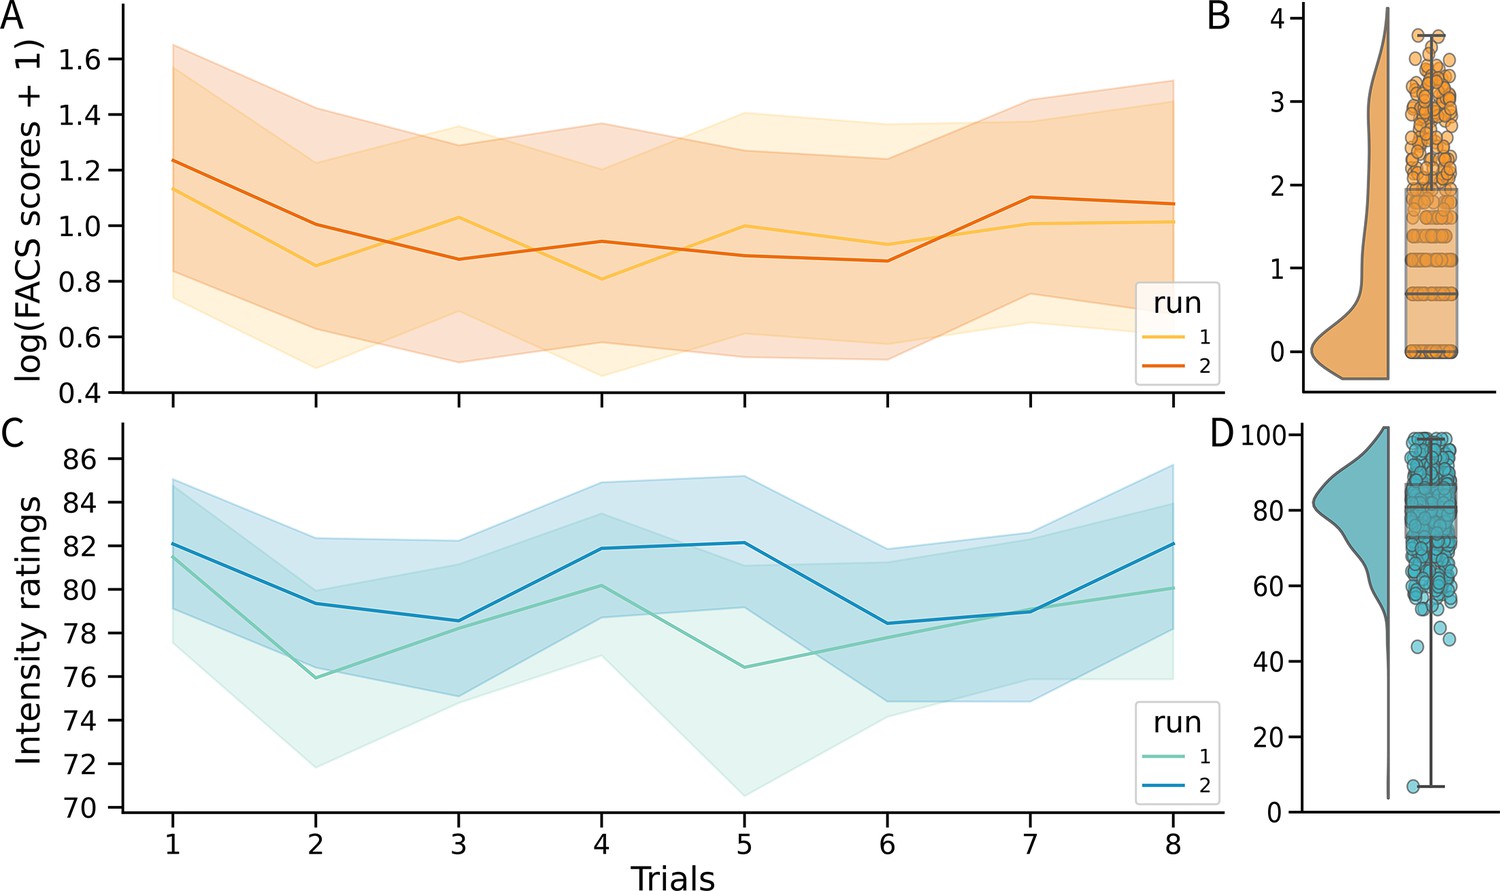
Behavioral scores across trials.
(A) Fluctuations in the log-transformed facial action coding system (FACS) composite scores across trials in the two runs (shaded areas represent the standard deviation). There was no significant effect of trials and runs (p’s>0.8; see Supplementary file 1D). (B) Distribution of the log-transformed FACS composite scores (each point represents one trial). (C) Fluctuations in the pain intensity ratings across trials between runs. There was no significant effect of trials and runs (p’s>0.15; see Supplementary file 1E). (D) Distribution of the pain intensity ratings.
Figure 1—figure supplement 2
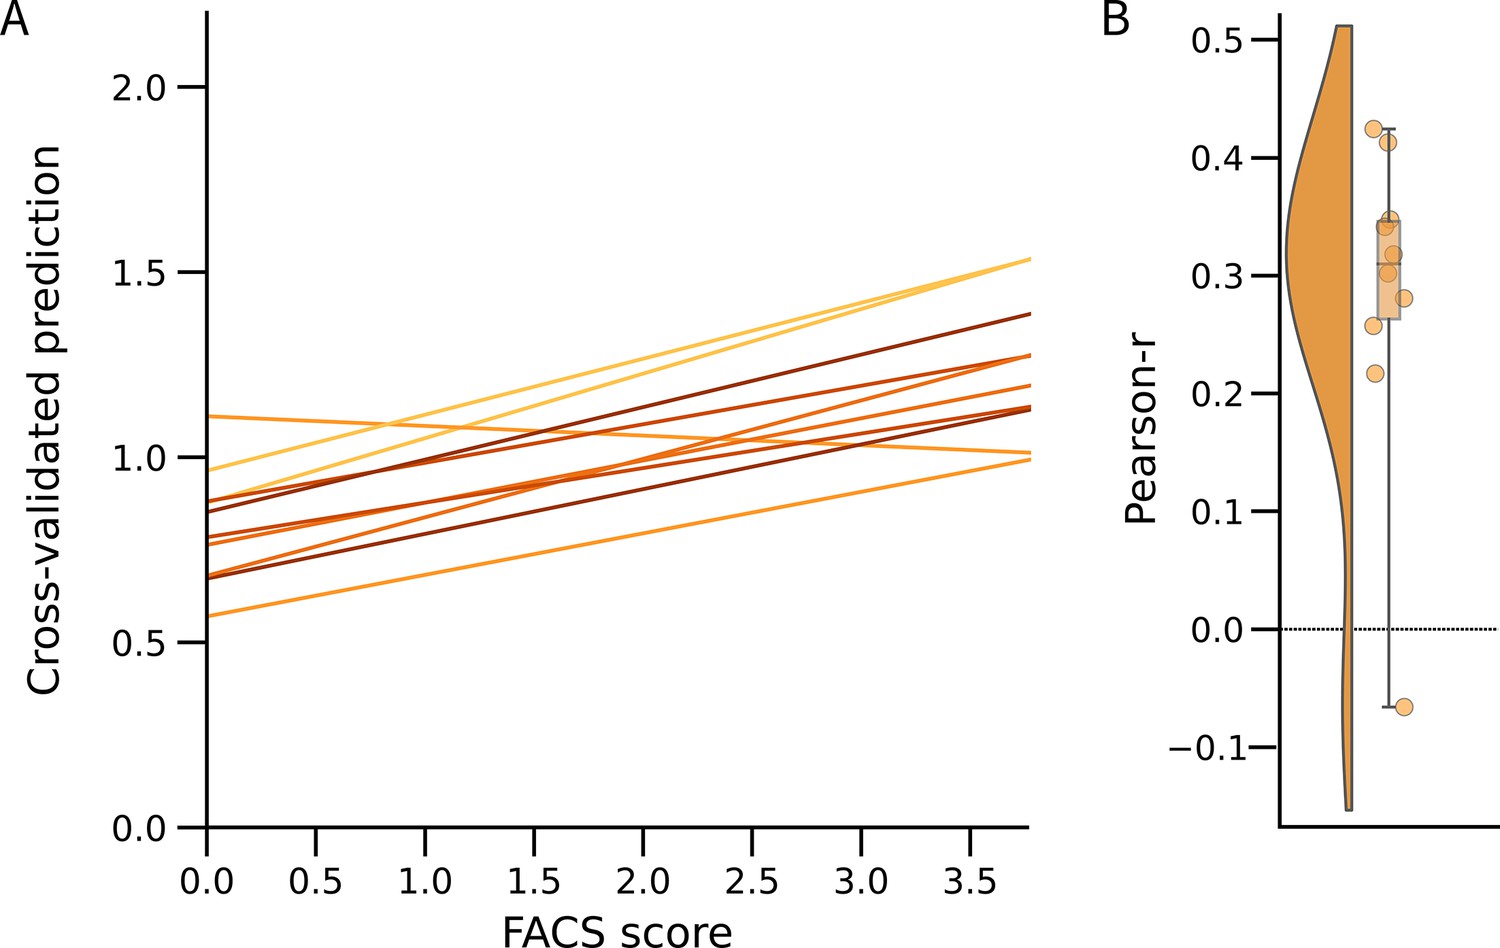
Predictive performance of the M1-based model.
(A) Relationship between the actual and the predicted facial action coding system (FACS) composite scores for each cross-validation fold (k=10) using only the activity from the primary motor cortex as defined by the Oxford-Harvard Cortical Atlas (Caviness et al., 1996). (B) Distribution of the Pearson-r scores across the 10 cross-validation folds (Pearson-r=0.28 ± 0.14 (95% CI = [0.17; 0.49]); R2=–0.02 ± 0.12 (95% CI = [–0.41; 0.16]); RMSE = 1.13 ± 0.11 (95% CI = [0.99; 1.23]); p=0.01).
Figure 1—figure supplement 3
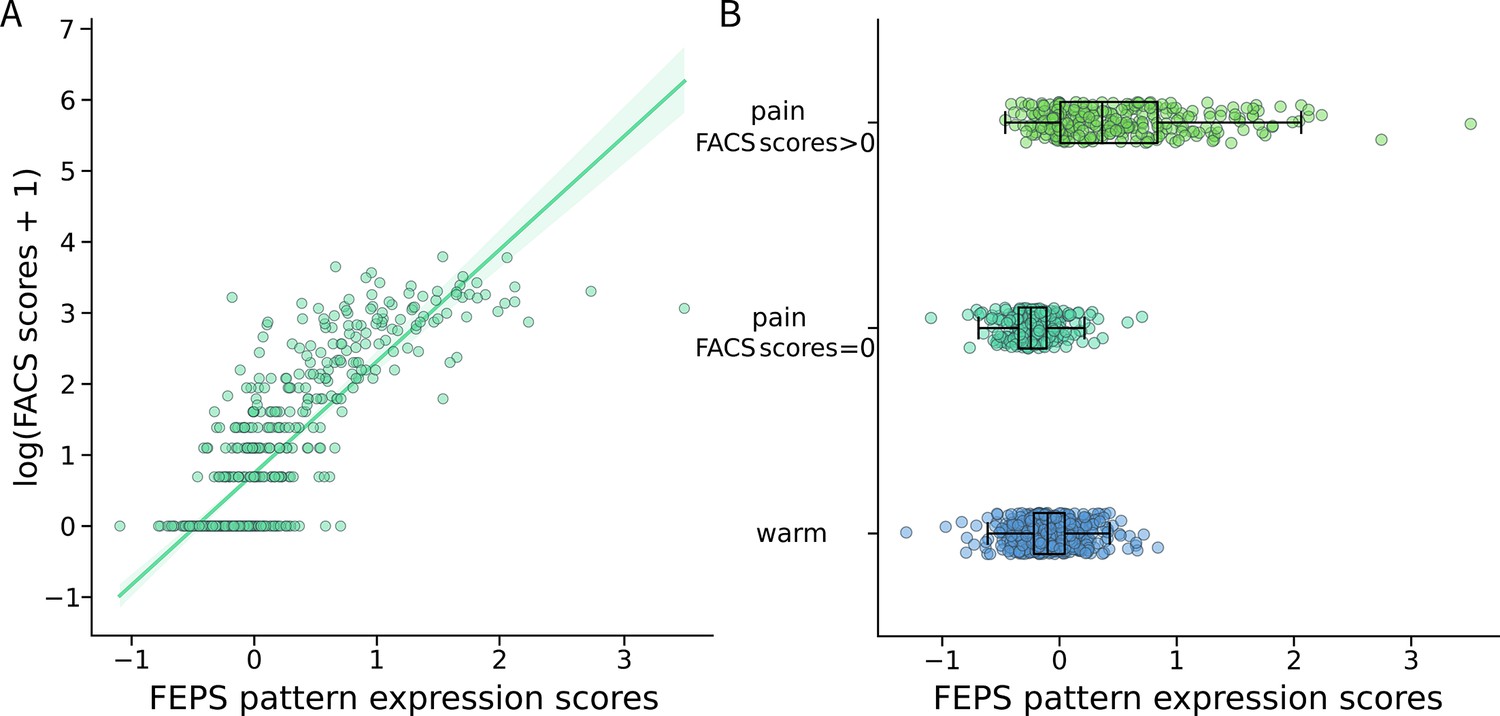
Facial expression of pain signature (FEPS) pattern expression and pain facial expression.
(A) FEPS pattern expression scores significantly predict the log-transformed facial action coding system (FACS) scores. Each point represents a trial in the pain condition (n=533). (B) Distribution of the FEPS pattern expression scores in the warm (nonpainful) condition and in the pain condition, separating the trials with and without pain facial expression. The FEPS pattern expression was computed using the dot product between the FEPS weights and the trial-by-trial activation maps (n=1069). The whiskers on the box plots extend to either 1.5 times the interquartile range or to the farthest point within that range. Statistical results are reported in the main text.
Figure 2
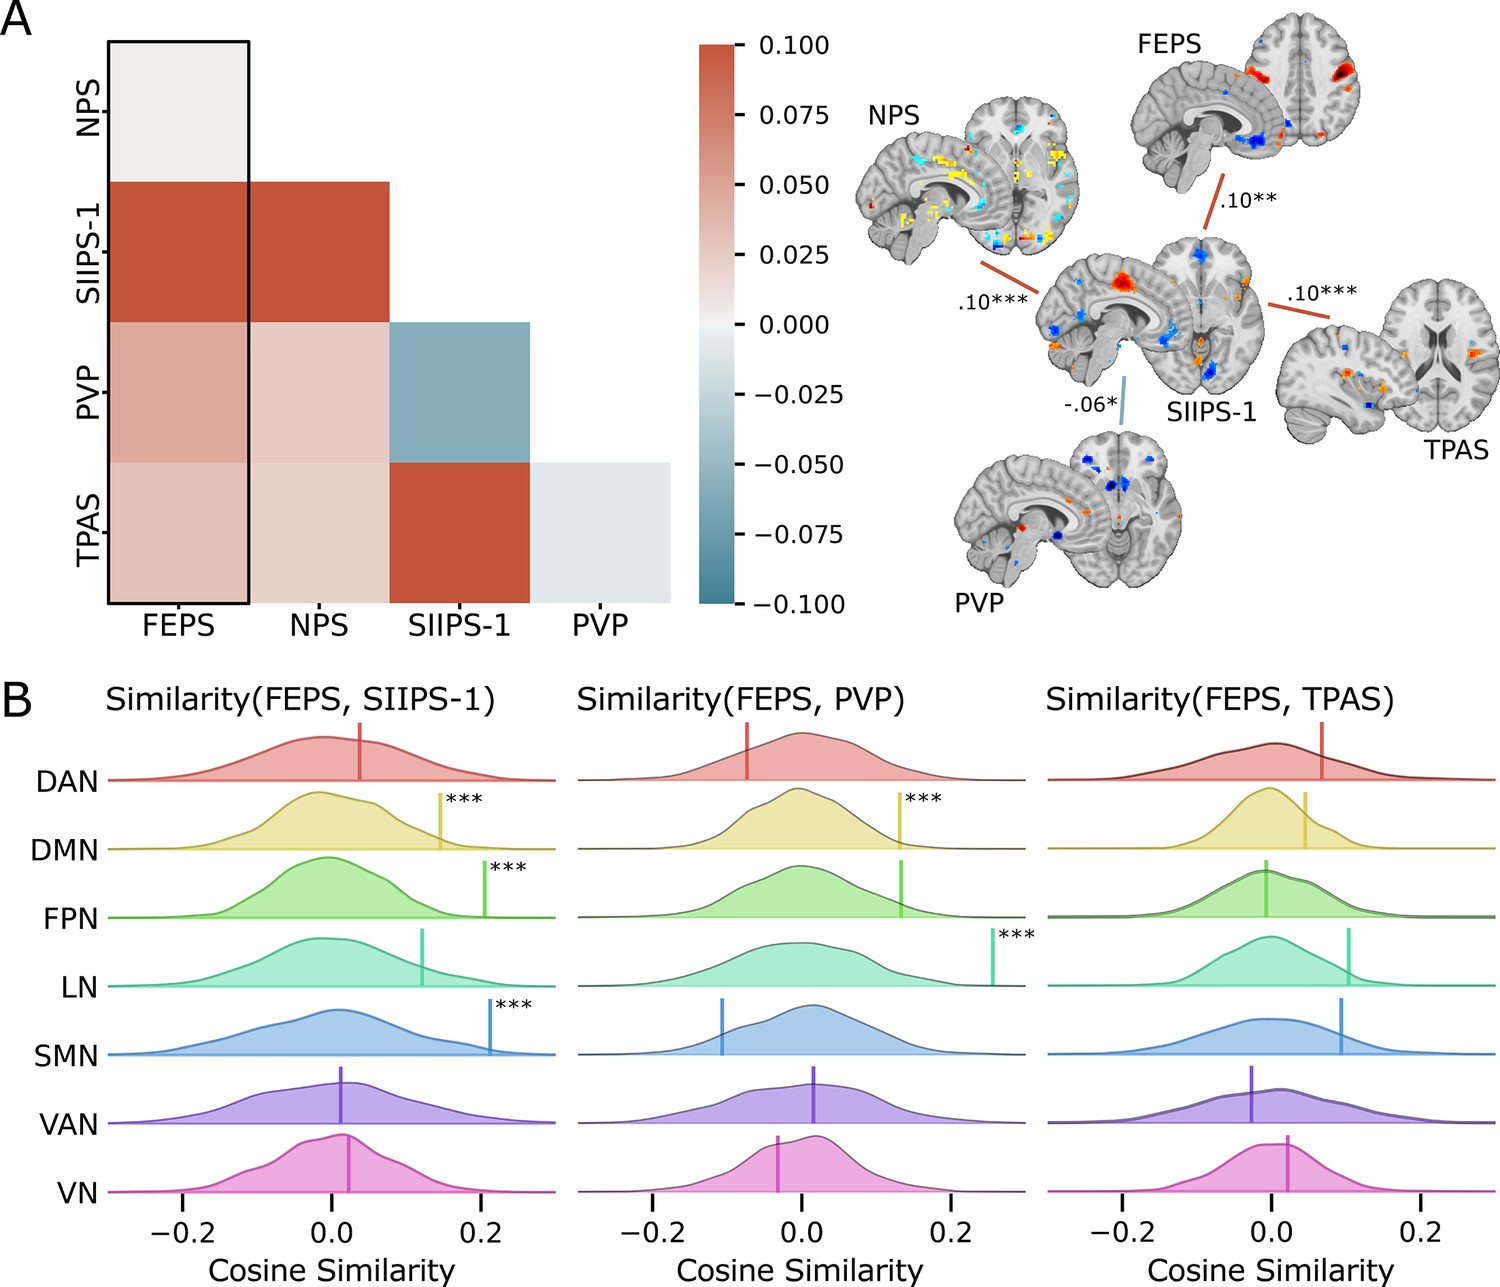
Spatial similarity between the facial expression of pain signature (FEPS) and other pain-related signatures.
(A) Pattern similarity between the FEPS and other pain-related brain signatures using the weights of the full brain patterns. Pattern similarities were computed at the voxel level using the cosine similarity; a value of 1 reflects proportional patterns; a value of 0 reflects orthogonal patterns; a value of –1 reflects patterns of opposite directions. The left panel shows the similarity matrix, and the right panel shows only the significant similarities between the pain-related signatures (*p<0.05; **p<0.01; ***p<0.001). (B) Deconstructing the pattern similarity with regards to seven cortical networks as defined in the Yeo atlas24: Visual Network (VN); Somatomotor Network (SMN); Dorsal Attention Network (DAN); Ventral Attention Network (VAN); Limbic Network (LN); Frontoparietal Network (FPN); Default Mode Network (DMN). Null distributions computed using permutation tests are shown, and the actual similarity values are represented by the vertical bar. Significant similarity values were found in the FPN (similarity = 0.20; p=0.002), the SMN (similarity = 0.21; p=0.02), and the DMN (similarity = 0.15; p=0.04) for the SIIPS-1, in the LN (similarity = 0.26; p=0.001), and DMN (similarity = 0.13; p=0.03) for the pain value pattern (PVP).
Additional files
-
Supplementary file 1
Supplementary tables.
(A) Peak regions with positive weights contributing to the prediction of the facial expression scores. (B) Peak regions with negative weights contributing to the prediction of the facial expression scores. (C) Mixed-effect model results for the effect of pain ratings on the logarithmic transformed facial action coding system (FACS) scores. (D) Mixed-effect model results for the effect of runs and trials on the logarithmic transformed FACS scores. (E) Mixed-effect model results for the effect of runs and trials on the pain ratings. (F) Mixed-effect model results for the effect of the facial expression of pain signature (FEPS) expression scores and the pain ratings on the logarithmic transformed FACS scores.
- https://cdn.elifesciences.org/articles/87962/elife-87962-supp1-v1.docx
-
MDAR checklist
- https://cdn.elifesciences.org/articles/87962/elife-87962-mdarchecklist1-v1.pdf
Download links
A two-part list of links to download the article, or parts of the article, in various formats.
Downloads (link to download the article as PDF)
Open citations (links to open the citations from this article in various online reference manager services)
Cite this article (links to download the citations from this article in formats compatible with various reference manager tools)
A distributed brain response predicting the facial expression of acute nociceptive pain
eLife 12:RP87962.
https://doi.org/10.7554/eLife.87962.3


