RAPSYN-mediated neddylation of BCR-ABL alternatively determines the fate of Philadelphia chromosome-positive leukemia
- Laboratory of Chemical Biology, School of Life Science and Technology, China Pharmaceutical University, China
- State Key Laboratory of Natural Medicines, China Pharmaceutical University, China
- Department of Hematology, The First Affiliated Hospital of Nanjing Medical University, Jiangsu Province Hospital, China
- Chongqing Innovation Institute of China Pharmaceutical University, China
Figures
Figure 1 with 1 supplement
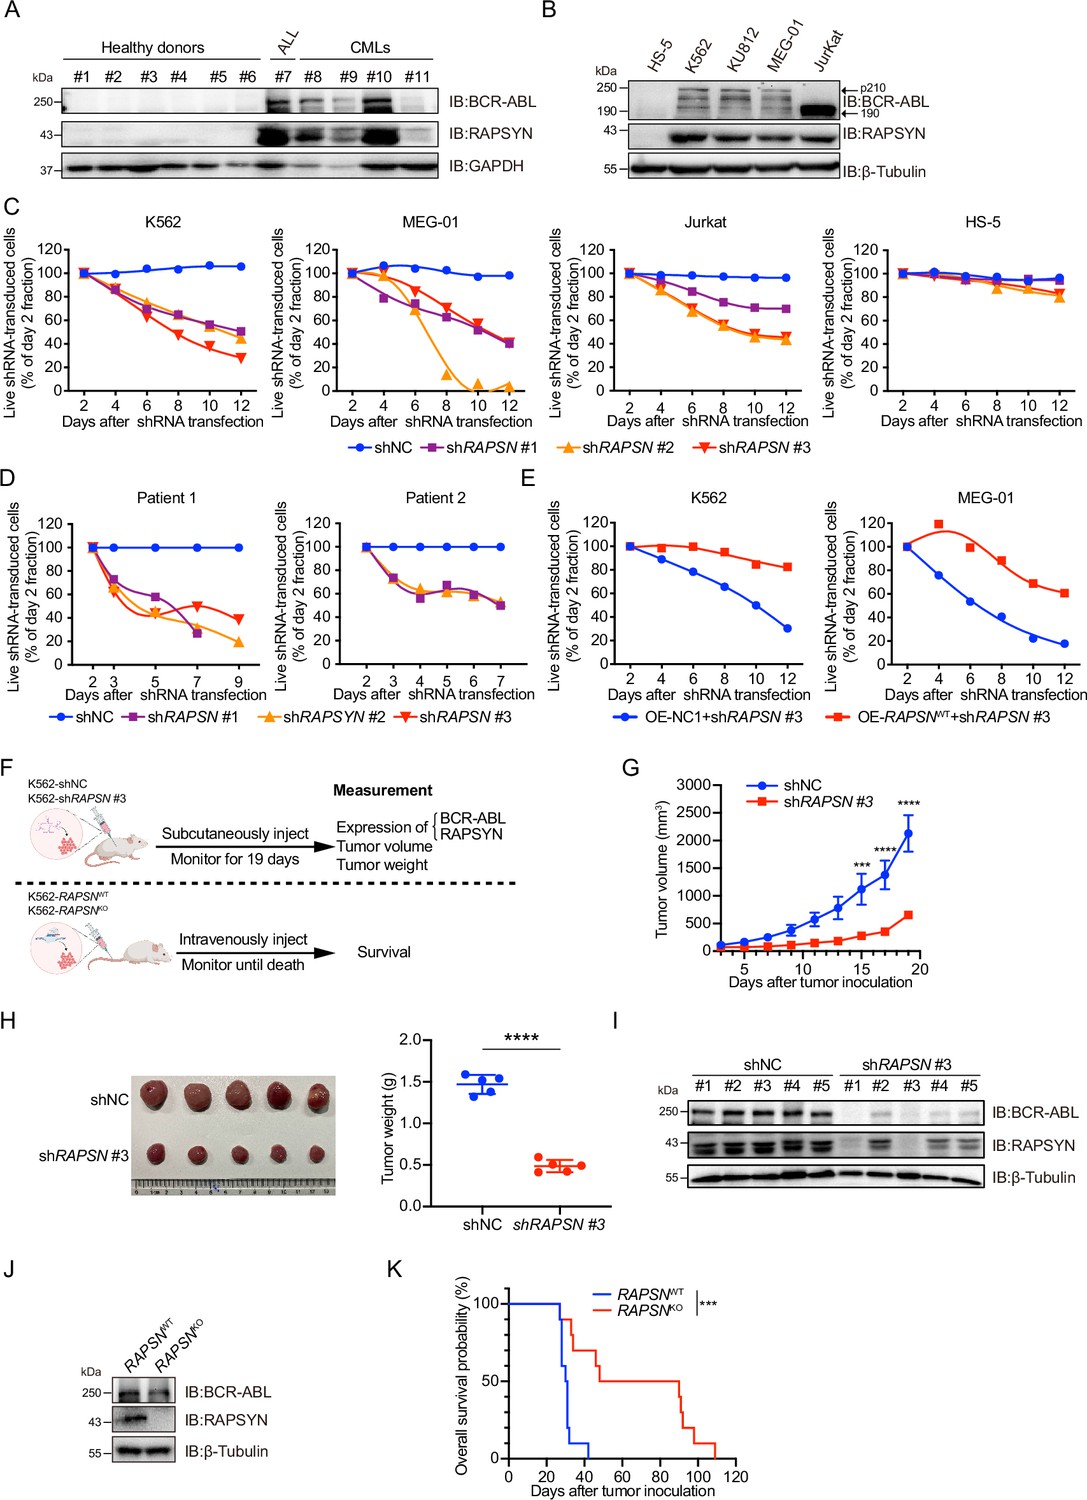
High protein levels of RAPSYN promotes Ph+ leukemia progression.
(A) Immunoblots of RAPSYN and BCR-ABL in the peripheral blood mononuclear cells (PBMCs) of clinical samples. (B) Immunoblots of RAPSYN and BCR-ABL in Ph+ leukemic cells and normal bone marrow stromal cells (HS-5). (C) Cytotoxicity induced by shRNA-mediated RAPSN knockdown in leukemic and HS-5 cells. (D) Cytotoxicity induced by shRNA-mediated RAPSN knockdown in the PBMCs of chronic myeloid leukemia (CML) patients. (E) Rescue of leukemic cells from shRAPSN #3-induced toxicity by exogenous expression of RAPSN cDNA or NC1. (F) An in vivo experimental design for testing the effects of RAPSYN on tumor growth and survival. (G) The growth curve of subcutaneous xenograft tumors was measured every 2 days from the third day after tumor inoculation for 19 days (five mice in each group). (H) Photograph and weight quantification of excised tumor xenografts from (I). (I) Immunoblots of RAPSYN and BCR-ABL in mouse xenograft tumor biopsies from K562 cells transduced with shRAPSN #3 or shNC. (J) Immunoblots of RAPSYN and BCR-ABL in K562-RAPSNWT and K562-RAPSNKO cells. (K) Kaplan–Meier survival curve of NCG mice following intravenous injection of K562-RAPSNWT or K562-RAPSNKO cells, as shown in (F) (10 mice in each group). All data represent mean ± standard deviation (SD) of at least three independent experiments. p values were calculated using unpaired Student’s t-test (G and H) or log-rank test (K). ***p < 0.001, ****p < 0.0001.
-
Figure 1—source data 1
Original file for the Western blot analysis in Figure 1A (anti-BCR-ABL, anti-RAPSYN, anti-GAPDH).
- https://cdn.elifesciences.org/articles/88375/elife-88375-fig1-data1-v1.zip
-
Figure 1—source data 2
PDF containing Figure 1A and original scan of the relevant Western blot analysis (anti-BCR-ABL, anti-RAPSYN, anti-GAPDH) with highlighted bands and sample labels.
- https://cdn.elifesciences.org/articles/88375/elife-88375-fig1-data2-v1.zip
-
Figure 1—source data 3
Original file for the Western blot analysis in Figure 1B (anti-BCR-ABL, anti-RAPSYN, anti-β-Tubulin).
- https://cdn.elifesciences.org/articles/88375/elife-88375-fig1-data3-v1.zip
-
Figure 1—source data 4
PDF containing Figure 1B and original scan of the relevant Western blot analysis (anti-BCR-ABL, anti-RAPSYN, anti-β-Tubulin) with highlighted bands and sample labels.
- https://cdn.elifesciences.org/articles/88375/elife-88375-fig1-data4-v1.zip
-
Figure 1—source data 5
Original file for the Western blot analysis in Figure 1I (anti-BCR-ABL, anti-RAPSYN, anti-β-Tubulin).
- https://cdn.elifesciences.org/articles/88375/elife-88375-fig1-data5-v1.zip
-
Figure 1—source data 6
PDF containing Figure 1I and original scan of the relevant Western blot analysis (anti-BCR-ABL, anti-RAPSYN, anti-β-Tubulin) with highlighted bands and sample labels.
- https://cdn.elifesciences.org/articles/88375/elife-88375-fig1-data6-v1.zip
-
Figure 1—source data 7
Original file for the Western blot analysis in Figure 1J (anti-BCR-ABL, anti-RAPSYN, anti-β-Tubulin).
- https://cdn.elifesciences.org/articles/88375/elife-88375-fig1-data7-v1.zip
-
Figure 1—source data 8
PDF containing Figure 1J and original scan of the relevant Western blot analysis (anti-BCR-ABL, anti-RAPSYN, anti-β-Tubulin) with highlighted bands and sample labels.
- https://cdn.elifesciences.org/articles/88375/elife-88375-fig1-data8-v1.zip
Figure 1—figure supplement 1
The mRNA levels of RAPSN are not changed by Ph+ leukemia, whereas inhibition of RAPSYN suppresses Ph+ leukemia progression.
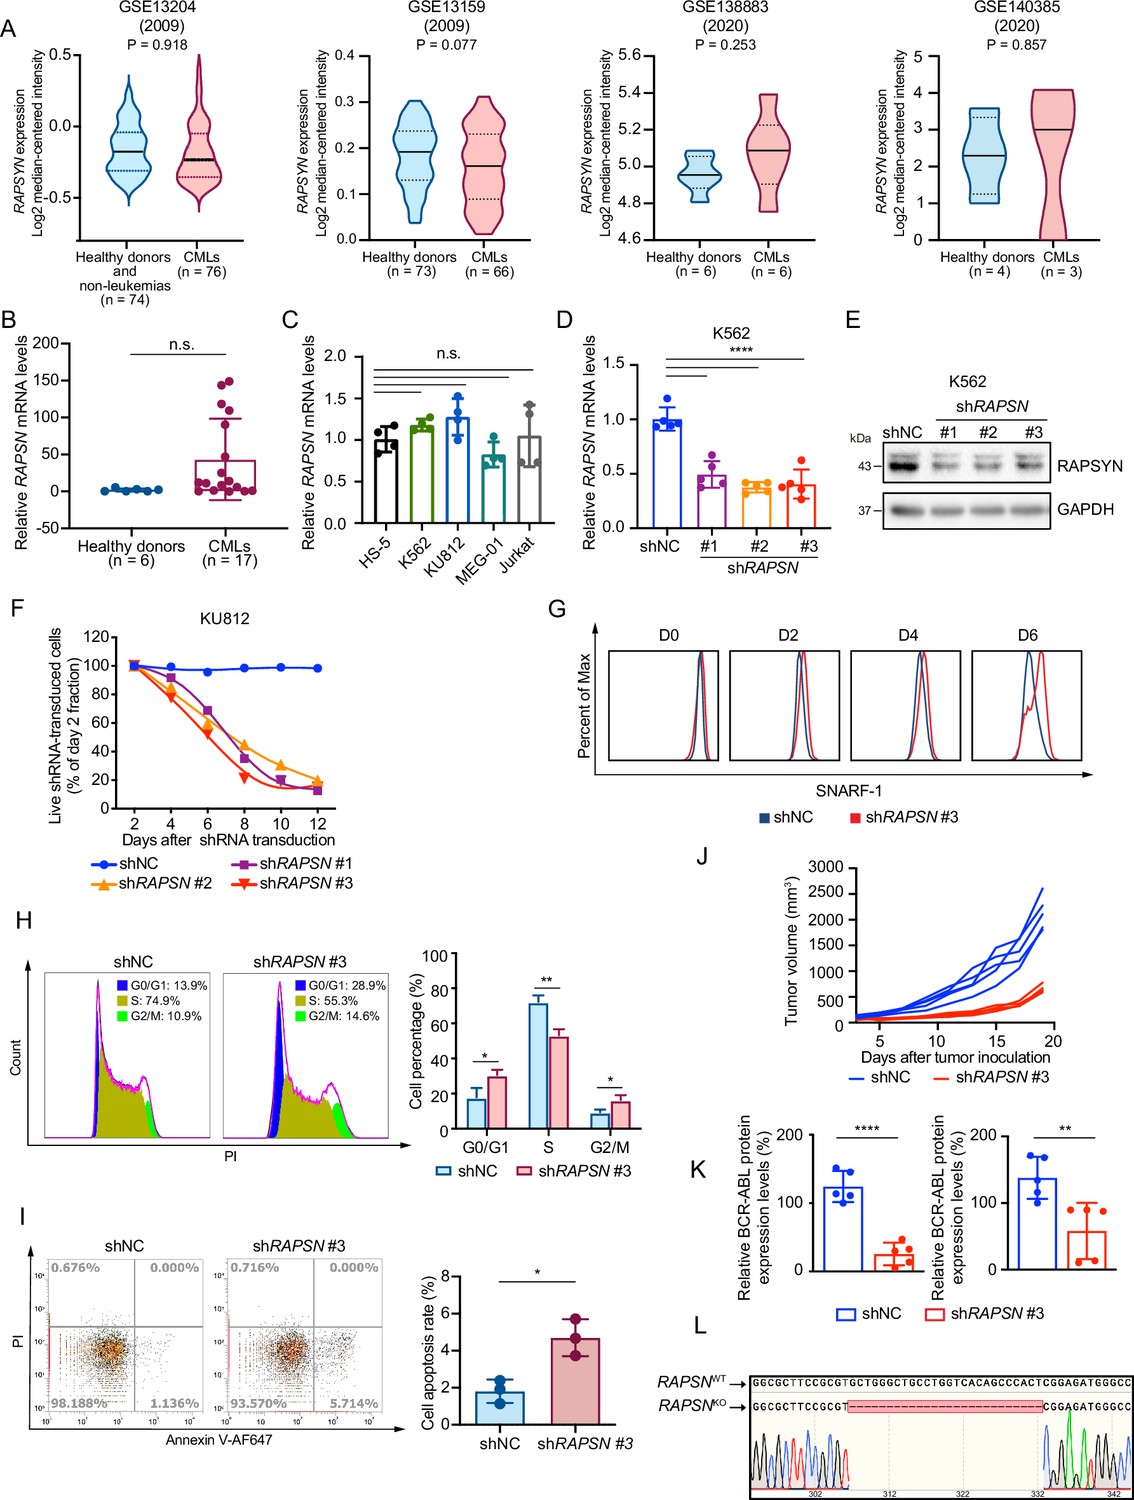
(A) Analyses of RAPSN mRNA levels in peripheral blood mononuclear cells (PBMCs) of healthy donors and non-leukemic patients compared to those of patients with chronic myeloid leukemia (CML) from GSE13204, GSE13159, GSE138883, and GSE140385 datasets. (B) Quantification of RAPSN mRNA levels in PBMCs of healthy donors and patients with Ph+ leukemia from the cohort of primary samples using reverse transcription-PCR (RT-PCR). (C) Quantification of RAPSN mRNA levels in Ph+ leukemia cells (K562, KU812, MEG-01, and Jurkat) compared to normal bone marrow stromal cells (HS-5) using RT-PCR (n=4). (D) Quantification of RAPSN mRNA levels in K562 cells transduced with shNC or three independent shRNAs targeting RAPSN using RT-PCR (n=5). (E) Immunoblotting of RAPSYN in K562 cells transduced with shNC or three different shRNAs targeting RAPSN. (F) Cytotoxicity induced by shRNA-mediated RAPSN knockdown in KU812 cells. Representative results from at least three independent experiments are shown. (G) Analysis of SNARF-1 labeling intensity in K562 cells transducted with shNC or shRAPSN #3. (H) Representative Fluorescence-activated cell sorting (FACS) cell cycle profiles of K562 cells transduced with shNC or shRAPSN #3 (n=3). (I) Representative FACS blots of apoptosis analysis of K562 cells transduced with shNC or shRAPSN #3 (n=3). (J) Individual growth curves of subcutaneous xenograft tumors were measured every 2 days from the third day after tumor inoculation for 19 days. (K) Quantification of RAPSYN and BCR-ABL expression in mouse xenograft tumor biopsies from K562 cells transduced with shRAPSN #3 or shNC (n=5). (L) Verification of RAPSNKO in K562 cells. The red dotted line indicates deleted sequences. RAPSN mRNA levels were normalized to that of ACTIN (B) or GAPDH (C, D); error bars, mean ± standard deviation (SD); *p < 0.05, **p < 0.01, ****p < 0.0001, n.s., not significant; unpaired Student’s t-test (A, B, J, K and I) or one-way ANOVA test (C, D).
-
Figure 1—figure supplement 1—source data 1
Original file for the Western blot analysis in Figure 1—figure supplement 1E (anti-RAPSYN, anti-GAPDH).
- https://cdn.elifesciences.org/articles/88375/elife-88375-fig1-figsupp1-data1-v1.zip
-
Figure 1—figure supplement 1—source data 2
PDF containing Figure 1—figure supplement 1E and original scan of the relevant Western blot analysis (anti-RAPSYN, anti-GAPDH) with highlighted bands and sample labels.
- https://cdn.elifesciences.org/articles/88375/elife-88375-fig1-figsupp1-data2-v1.zip
Figure 2 with 2 supplements
RAPSYN neddylates BCR-ABL.
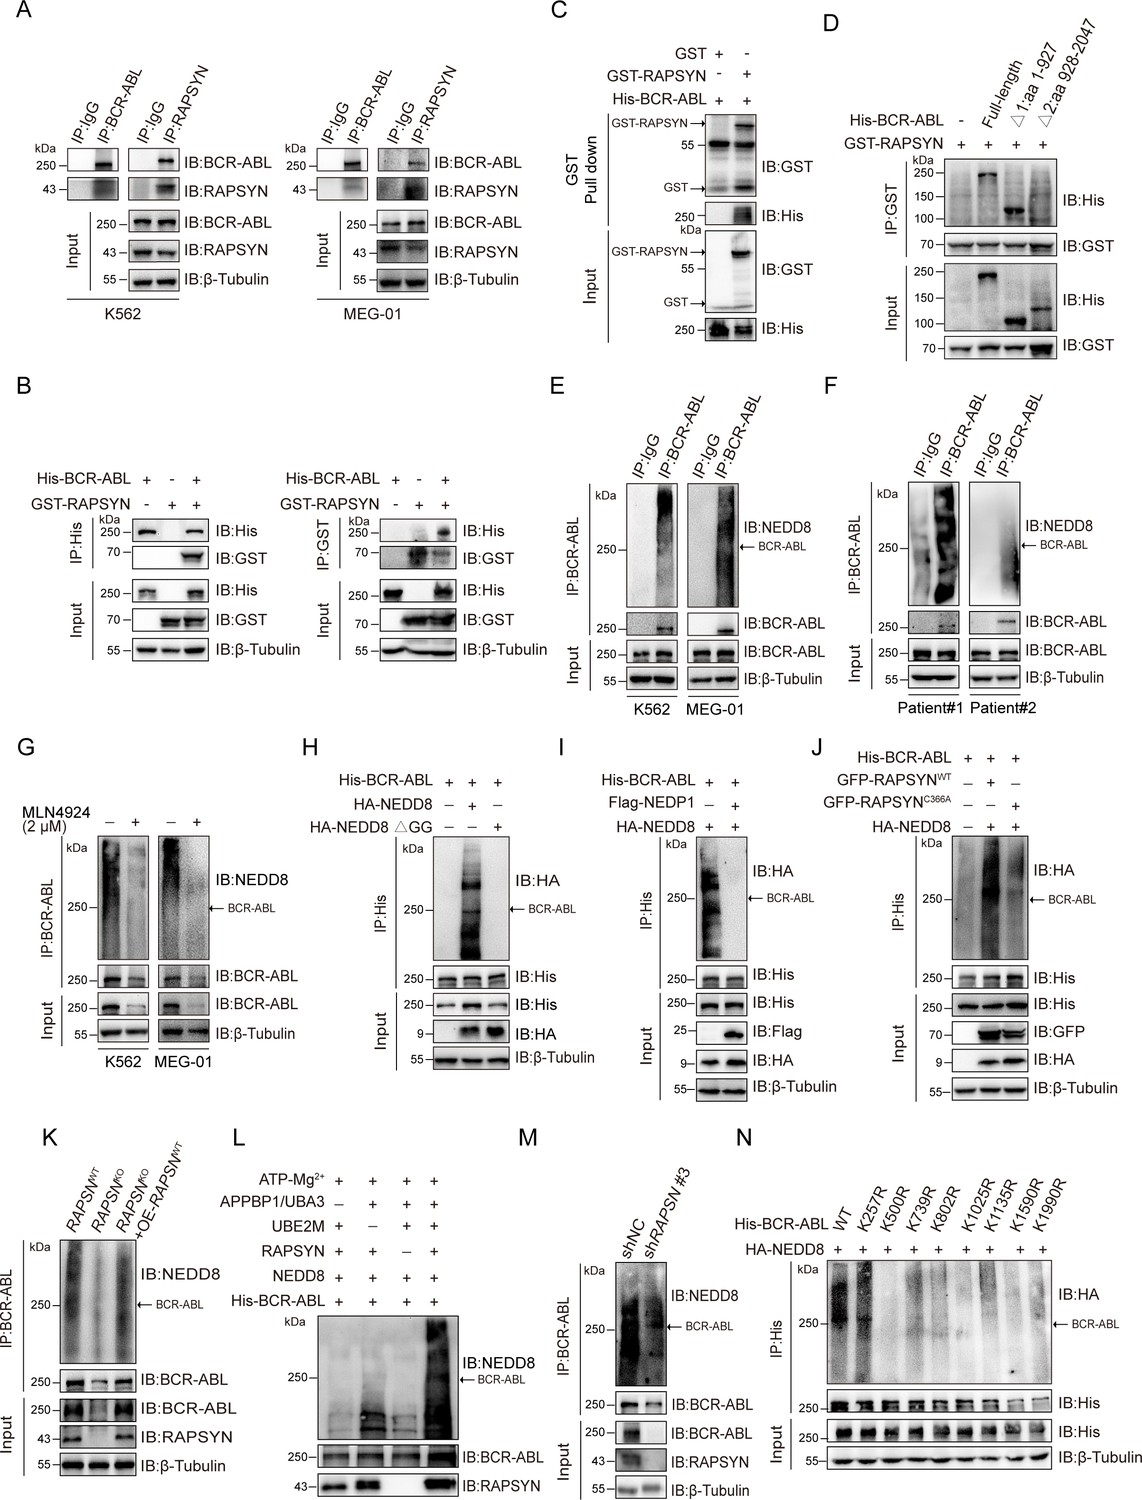
(A) Co-immunoprecipitation of BCR-ABL and RAPSYN in leukemic cells. (B) Immunoblots of GST and His after immunoprecipitation of His or GST in HEK293T cells transfected with His-tagged BCR-ABL and GST-tagged RAPSYN. (C) Immunoblots of GST and His following GST pull-down after in vitro incubation of purified His-tagged BCR-ABL and GST or GST-tagged RAPSYN. (D) His-immunoblots of GST immunoprecipitates from HEK293T cells transfected with GST-tagged RAPSYN alone or in combination with His-tagged full-length or truncated BCR-ABL (Δ1: aa 1–927, Δ2: aa 928–2047). (E) Analysis of BCR-ABL neddylation levels in leukemic cells. (F) Analysis of BCR-ABL neddylation levels in primary chronic myeloid leukemia (CML) peripheral blood mononuclear cells (PBMCs). (G) Analysis of BCR-ABL neddylation levels in leukemic cells treated with MLN4924 or dimethyl sulfoxide (DMSO) for 24 hr. (H) HA-immunoblots of His-immunoprecipitate from HEK293T cells transfected with His-tagged BCR-ABL and HA-tagged NEDD8 or NEDD8 ΔGG. (I) HA-immunoblots of His-immunoprecipitate from HEK293T cells transfected with indicated constructs. (J) HA-immunoblots after immunoprecipitation of His-antibody in HEK293T cells transfected with His-tagged BCR-ABL, HA-tagged NEDD8, GFP-tagged WT RAPSYN, or RAPSYN-C366A. (K) Analysis of BCR-ABL neddylation levels in K562 WT, RAPSN KO, and RAPSN KO with exogenous expression of a RAPSN cDNA cells. (L) Assessment of BCR-ABL neddylation by RAPSYN in vitro. Recombinantly expressed and purified RAPSYN and BCR-ABL were incubated with APPBP1/UBA3, UBE2M, or NEDD8 for in vitro neddylation assay. (M) Analysis of BCR-ABL neddylation levels in excised tumor xenografts from Figure 1H. (N) Verification of BCR-ABL neddylation sites in HEK293T cells transfected with indicated constructs.
-
Figure 2—source data 1
Original file for the Western blot analysis in Figure 2A.
- https://cdn.elifesciences.org/articles/88375/elife-88375-fig2-data1-v1.zip
-
Figure 2—source data 2
PDF containing Figure 2A and original scan of the relevant Western blot analysis with highlighted bands and sample labels.
- https://cdn.elifesciences.org/articles/88375/elife-88375-fig2-data2-v1.zip
-
Figure 2—source data 3
Original file for the Western blot analysis in Figure 2B.
- https://cdn.elifesciences.org/articles/88375/elife-88375-fig2-data3-v1.zip
-
Figure 2—source data 4
PDF containing Figure 2B and original scan of the relevant Western blot analysis with highlighted bands and sample labels.
- https://cdn.elifesciences.org/articles/88375/elife-88375-fig2-data4-v1.zip
-
Figure 2—source data 5
Original file for the Western blot analysis in Figure 2C.
- https://cdn.elifesciences.org/articles/88375/elife-88375-fig2-data5-v1.zip
-
Figure 2—source data 6
PDF containing Figure 2C and original scan of the relevant Western blot analysis with highlighted bands and sample labels.
- https://cdn.elifesciences.org/articles/88375/elife-88375-fig2-data6-v1.zip
-
Figure 2—source data 7
Original file for the Western blot analysis in Figure 2D.
- https://cdn.elifesciences.org/articles/88375/elife-88375-fig2-data7-v1.zip
-
Figure 2—source data 8
PDF containing Figure 2D and original scan of the relevant Western blot analysis with highlighted bands and sample labels.
- https://cdn.elifesciences.org/articles/88375/elife-88375-fig2-data8-v1.zip
-
Figure 2—source data 9
Original file for the Western blot analysis in Figure 2E.
- https://cdn.elifesciences.org/articles/88375/elife-88375-fig2-data9-v1.zip
-
Figure 2—source data 10
PDF containing Figure 2E and original scan of the relevant Western blot analysis with highlighted bands and sample labels.
- https://cdn.elifesciences.org/articles/88375/elife-88375-fig2-data10-v1.zip
-
Figure 2—source data 11
Original file for the Western blot analysis in Figure 2F.
- https://cdn.elifesciences.org/articles/88375/elife-88375-fig2-data11-v1.zip
-
Figure 2—source data 12
PDF containing Figure 2F and original scan of the relevant Western blot analysis with highlighted bands and sample labels.
- https://cdn.elifesciences.org/articles/88375/elife-88375-fig2-data12-v1.zip
-
Figure 2—source data 13
Original file for the Western blot analysis in Figure 2G.
- https://cdn.elifesciences.org/articles/88375/elife-88375-fig2-data13-v1.zip
-
Figure 2—source data 14
PDF containing Figure 2G and original scan of the relevant Western blot analysis with highlighted bands and sample labels.
- https://cdn.elifesciences.org/articles/88375/elife-88375-fig2-data14-v1.zip
-
Figure 2—source data 15
Original file for the Western blot analysis in Figure 2H.
- https://cdn.elifesciences.org/articles/88375/elife-88375-fig2-data15-v1.zip
-
Figure 2—source data 16
PDF containing Figure 2H and original scan of the relevant Western blot analysis with highlighted bands and sample labels.
- https://cdn.elifesciences.org/articles/88375/elife-88375-fig2-data16-v1.zip
-
Figure 2—source data 17
Original file for the Western blot analysis in Figure 2I.
- https://cdn.elifesciences.org/articles/88375/elife-88375-fig2-data17-v1.zip
-
Figure 2—source data 18
PDF containing Figure 2I and original scan of the relevant Western blot analysis with highlighted bands and sample labels.
- https://cdn.elifesciences.org/articles/88375/elife-88375-fig2-data18-v1.zip
-
Figure 2—source data 19
Original file for the Western blot analysis in Figure 2J.
- https://cdn.elifesciences.org/articles/88375/elife-88375-fig2-data19-v1.zip
-
Figure 2—source data 20
PDF containing Figure 2J and original scan of the relevant Western blot analysis with highlighted bands and sample labels.
- https://cdn.elifesciences.org/articles/88375/elife-88375-fig2-data20-v1.zip
-
Figure 2—source data 21
Original file for the Western blot analysis in Figure 2K.
- https://cdn.elifesciences.org/articles/88375/elife-88375-fig2-data21-v1.zip
-
Figure 2—source data 22
PDF containing Figure 2K and original scan of the relevant Western blot analysis with highlighted bands and sample labels.
- https://cdn.elifesciences.org/articles/88375/elife-88375-fig2-data22-v1.zip
-
Figure 2—source data 23
Original file for the Western blot analysis in Figure 2L.
- https://cdn.elifesciences.org/articles/88375/elife-88375-fig2-data23-v1.zip
-
Figure 2—source data 24
PDF containing Figure 2L and original scan of the relevant Western blot analysis with highlighted bands and sample labels.
- https://cdn.elifesciences.org/articles/88375/elife-88375-fig2-data24-v1.zip
-
Figure 2—source data 25
Original file for the Western blot analysis in Figure 2M.
- https://cdn.elifesciences.org/articles/88375/elife-88375-fig2-data25-v1.zip
-
Figure 2—source data 26
PDF containing Figure 2M and original scan of the relevant Western blot analysis with highlighted bands and sample labels.
- https://cdn.elifesciences.org/articles/88375/elife-88375-fig2-data26-v1.zip
-
Figure 2—source data 27
Original file for the Western blot analysis in Figure 2N.
- https://cdn.elifesciences.org/articles/88375/elife-88375-fig2-data27-v1.zip
-
Figure 2—source data 28
PDF containing Figure 2N and original scan of the relevant Western blot analysis with highlighted bands and sample labels.
- https://cdn.elifesciences.org/articles/88375/elife-88375-fig2-data28-v1.zip
Figure 2—figure supplement 1
RAPSYN is an E3 ligase to neddylate BCR-ABL.
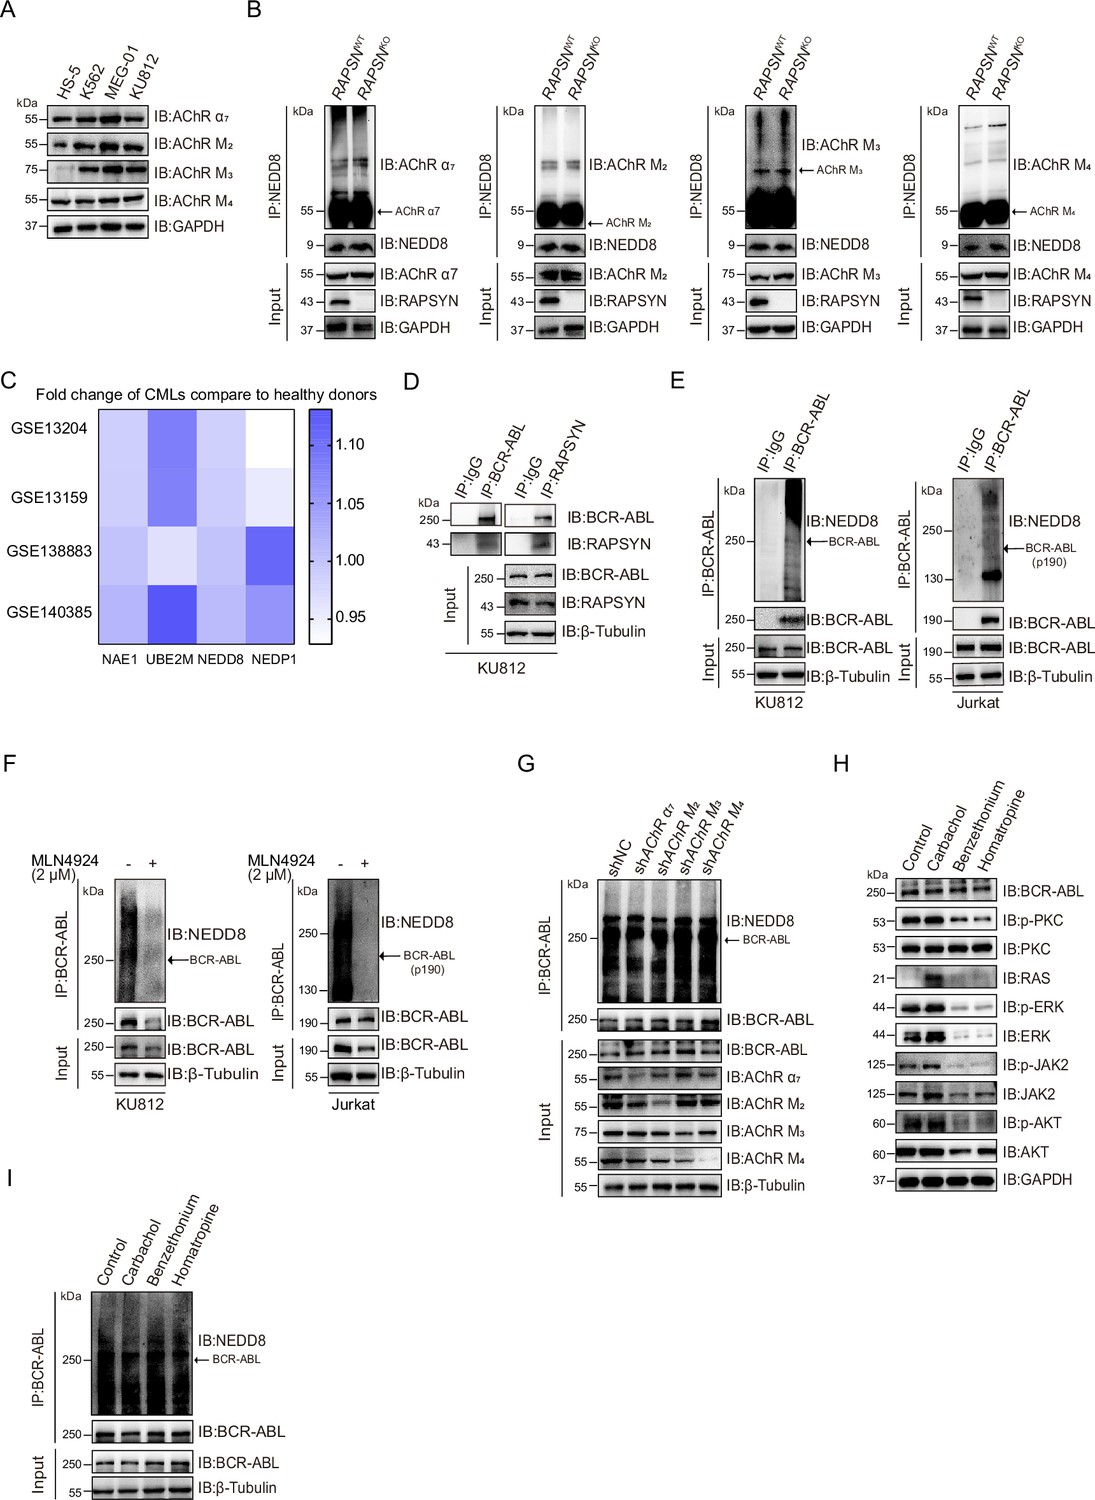
(A) Immunoblots of AChR subunits α7, M2, M3, and M4 in Ph+ leukemia cells (K562, KU812, and MEG-01) compared to normal bone marrow stromal cells (HS-5). (B) Immunoblotting analyses of AChR subunit α7, M2, M3, and M4 neddylation levels after immunoprecipitation of NEDD8 in WT and RAPSN KO K562 cells. (C) Heatmap showing the fold change in mRNA level of neddylation-related proteins in chronic myeloid leukemia (CML) patients compared to that in healthy donors. (D) Immunoblots of BCR-ABL and RAPSYN in KU812 cells after co-immunoprecipitation with RAPSYN and BCR-ABL antibodies, respectively. (E) Immunoblotting analyses of BCR-ABL neddylation after immunoprecipitation of BCR-ABL in KU812 and Jurkat cells. (F) Immunoblotting analyses of BCR-ABL neddylation after immunoprecipitation of BCR-ABL in KU812 and Jurkat cells treated with MLN4924 or DMSO for 24 hr. (G) Immunoblotting analyses of BCR-ABL neddylation after immunoprecipitation of BCR-ABL in K562 cells transduced with shAChRα7, shAChRM2, shAChRM3, shAChRM4, or shNC. (H) Immunoblotting analyses of PKC–RAS–ERK and JAK2–AKT changes in K562 cells treated with AChR agonist carbamylcholine chloride (carbachol, 100 μM) and antagonist benzethonium (5 μM) for nAChR or tomatropine bromide (homatropine, 5 μM) for mAChR for 24 hr. (I), Immunoblotting analyses of BCR-ABL neddylation after immunoprecipitation of BCR-ABL in K562 cells treated with AChR agonist carbamylcholine chloride (carbachol, 100 μM) and antagonist benzethonium (5 μM) for nAChR or tomatropine bromide (homatropine, 5 μM) for mAChR for 24 hr. See numerical source data in Figure 2—source data 2.
-
Figure 2—figure supplement 1—source data 1
Original file for the Western blot analysis in Figure 2—figure supplement 1A.
- https://cdn.elifesciences.org/articles/88375/elife-88375-fig2-figsupp1-data1-v1.zip
-
Figure 2—figure supplement 1—source data 2
PDF containing Figure 2—figure supplement 1A and original scan of the relevant Western blot analysis with highlighted bands and sample labels.
- https://cdn.elifesciences.org/articles/88375/elife-88375-fig2-figsupp1-data2-v1.zip
-
Figure 2—figure supplement 1—source data 3
Original file for the Western blot analysis in Figure 2—figure supplement 1B.
- https://cdn.elifesciences.org/articles/88375/elife-88375-fig2-figsupp1-data3-v1.zip
-
Figure 2—figure supplement 1—source data 4
PDF containing Figure 2—figure supplement 1B and original scan of the relevant Western blot analysis with highlighted bands and sample labels.
- https://cdn.elifesciences.org/articles/88375/elife-88375-fig2-figsupp1-data4-v1.zip
-
Figure 2—figure supplement 1—source data 5
Original file for the Western blot analysis in Figure 2—figure supplement 1D.
- https://cdn.elifesciences.org/articles/88375/elife-88375-fig2-figsupp1-data5-v1.zip
-
Figure 2—figure supplement 1—source data 6
PDF containing Figure 2—figure supplement 1D and original scan of the relevant Western blot analysis with highlighted bands and sample labels.
- https://cdn.elifesciences.org/articles/88375/elife-88375-fig2-figsupp1-data6-v1.zip
-
Figure 2—figure supplement 1—source data 7
Original file for the Western blot analysis in Figure 2—figure supplement 1E.
- https://cdn.elifesciences.org/articles/88375/elife-88375-fig2-figsupp1-data7-v1.zip
-
Figure 2—figure supplement 1—source data 8
PDF containing Figure 2—figure supplement 1E and original scan of the relevant Western blot analysis with highlighted bands and sample labels.
- https://cdn.elifesciences.org/articles/88375/elife-88375-fig2-figsupp1-data8-v1.zip
-
Figure 2—figure supplement 1—source data 9
Original file for the Western blot analysis in Figure 2—figure supplement 1F.
- https://cdn.elifesciences.org/articles/88375/elife-88375-fig2-figsupp1-data9-v1.zip
-
Figure 2—figure supplement 1—source data 10
PDF containing Figure 2—figure supplement 1F and original scan of the relevant Western blot analysis with highlighted bands and sample labels.
- https://cdn.elifesciences.org/articles/88375/elife-88375-fig2-figsupp1-data10-v1.zip
-
Figure 2—figure supplement 1—source data 11
Original file for the Western blot analysis in Figure 2—figure supplement 1G.
- https://cdn.elifesciences.org/articles/88375/elife-88375-fig2-figsupp1-data11-v1.zip
-
Figure 2—figure supplement 1—source data 12
PDF containing Figure 2—figure supplement 1G and original scan of the relevant Western blot analysis with highlighted bands and sample labels.
- https://cdn.elifesciences.org/articles/88375/elife-88375-fig2-figsupp1-data12-v1.zip
-
Figure 2—figure supplement 1—source data 13
Original file for the Western blot analysis in Figure 2—figure supplement 1H.
- https://cdn.elifesciences.org/articles/88375/elife-88375-fig2-figsupp1-data13-v1.zip
-
Figure 2—figure supplement 1—source data 14
PDF containing Figure 2—figure supplement 1H and original scan of the relevant Western blot analysis with highlighted bands and sample labels.
- https://cdn.elifesciences.org/articles/88375/elife-88375-fig2-figsupp1-data14-v1.zip
-
Figure 2—figure supplement 1—source data 15
Original file for the Western blot analysis in Figure 2—figure supplement 1I.
- https://cdn.elifesciences.org/articles/88375/elife-88375-fig2-figsupp1-data15-v1.zip
-
Figure 2—figure supplement 1—source data 16
PDF containing Figure 2—figure supplement 1I and original scan of the relevant Western blot analysis with highlighted bands and sample labels.
- https://cdn.elifesciences.org/articles/88375/elife-88375-fig2-figsupp1-data16-v1.zip
Figure 2—figure supplement 2
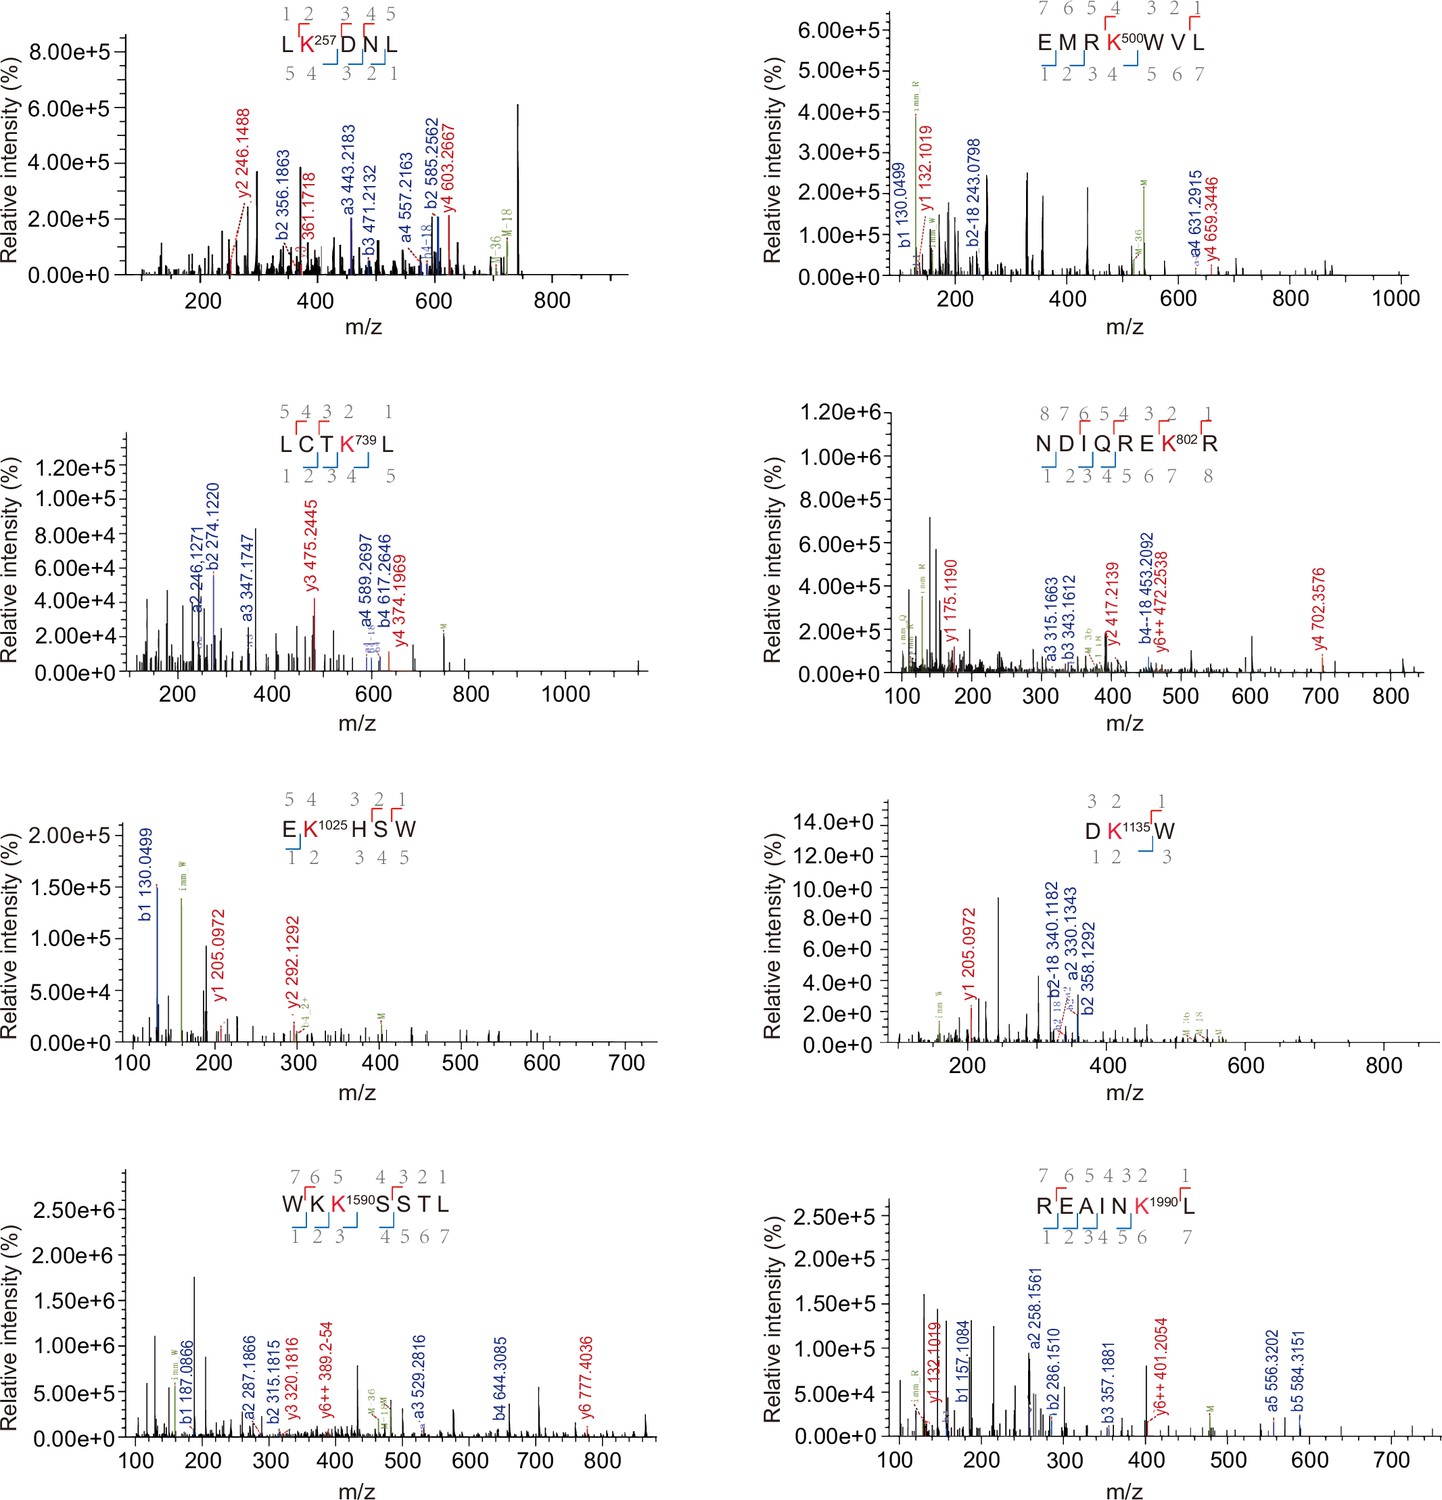
Liquid chromatography–mass spectrometry (LC–MS/MS) of trypsin-digested peptide fragments of neddylated BCR-ABL.
The neddylation at K257, K500, K739, K802, K1025, K1135, K1590, and K1990 is, respectively, presented with the numbering at Lys residue. Detected peptide sequences are indicated in blue (b ions) and red (y ions).
Figure 3 with 1 supplement
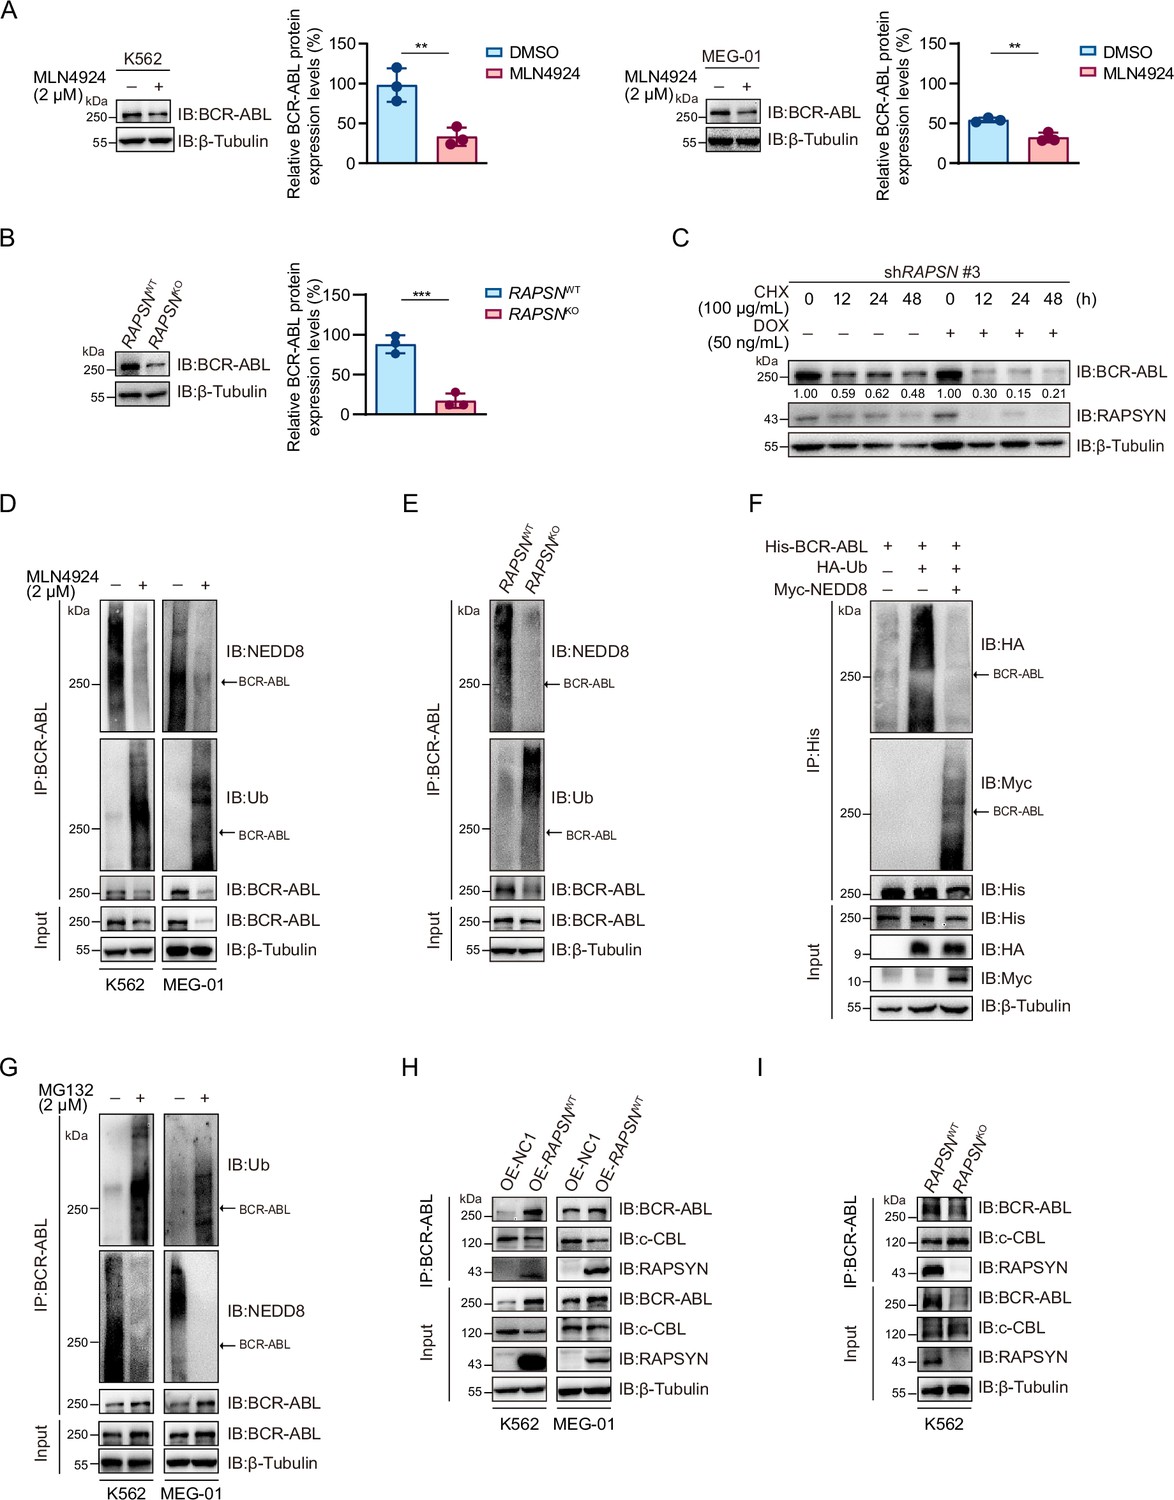
RAPSYN attenuates BCR-ABL ubiquitination and degradation.
(A) Immunoblots of BCR-ABL in leukemic cells treated with MLN4924 or DMSO for 24 hr and corresponding quantification of three independent replicates. (B) Immunoblots of BCR-ABL in K562 WT and RAPSN KO cells and corresponding quantification of three independent replicates. (C) Assessment of BCR-ABL protein stability in K562 cells expressing DOX-inducible shRAPSN #3 treated with CHX alone or in combination with DOX at indicated time points by immunoblotting. (D) Analysis of BCR-ABL neddylation and ubiquitination levels in leukemic cells treated with MLN4924 or DMSO for 24 hr. (E) Analysis of BCR-ABL neddylation and ubiquitination levels in K562 WT and RAPSN KO cells. (F) Immunoblots of HA and Myc after His-immunoprecipitation in HEK293T cells transfected with His-tagged BCR-ABL, HA-tagged Ub, or without Myc-tagged NEDD8. (G) Analysis of BCR-ABL ubiquitination and neddylation in leukemic cells treated with MG132 or DMSO for 12 hr. (H) Co-immunoprecipitation of BCR-ABL, c-CBL, and RAPSYN in leukemic cells expressing exogenous RAPSN cDNA or empty vector. (I) Co-immunoprecipitation of BCR-ABL, c-CBL, and RAPSYN in K562 WT and RAPSN KO cells. All data represent mean ± standard deviation (SD) of at least three independent experiments. p values were calculated using unpaired Student’s t-test. **p < 0.01, ***p < 0.001.
-
Figure 3—source data 1
Original file for the Western blot analysis in Figure 3A.
- https://cdn.elifesciences.org/articles/88375/elife-88375-fig3-data1-v1.zip
-
Figure 3—source data 2
PDF containing Figure 3A and original scan of the relevant Western blot analysis with highlighted bands and sample labels.
- https://cdn.elifesciences.org/articles/88375/elife-88375-fig3-data2-v1.zip
-
Figure 3—source data 3
Original file for the Western blot analysis in Figure 3B.
- https://cdn.elifesciences.org/articles/88375/elife-88375-fig3-data3-v1.zip
-
Figure 3—source data 4
PDF containing Figure 3B and original scan of the relevant Western blot analysis with highlighted bands and sample labels.
- https://cdn.elifesciences.org/articles/88375/elife-88375-fig3-data4-v1.zip
-
Figure 3—source data 5
Original file for the Western blot analysis in Figure 3C.
- https://cdn.elifesciences.org/articles/88375/elife-88375-fig3-data5-v1.zip
-
Figure 3—source data 6
PDF containing Figure 3C and original scan of the relevant Western blot analysis with highlighted bands and sample labels.
- https://cdn.elifesciences.org/articles/88375/elife-88375-fig3-data6-v1.zip
-
Figure 3—source data 7
Original file for the Western blot analysis in Figure 3D.
- https://cdn.elifesciences.org/articles/88375/elife-88375-fig3-data7-v1.zip
-
Figure 3—source data 8
PDF containing Figure 3D and original scan of the relevant Western blot analysis with highlighted bands and sample labels.
- https://cdn.elifesciences.org/articles/88375/elife-88375-fig3-data8-v1.zip
-
Figure 3—source data 9
Original file for the Western blot analysis in Figure 3E.
- https://cdn.elifesciences.org/articles/88375/elife-88375-fig3-data9-v1.zip
-
Figure 3—source data 10
PDF containing Figure 3E and original scan of the relevant Western blot analysis with highlighted bands and sample labels.
- https://cdn.elifesciences.org/articles/88375/elife-88375-fig3-data10-v1.zip
-
Figure 3—source data 11
Original file for the Western blot analysis in Figure 3F.
- https://cdn.elifesciences.org/articles/88375/elife-88375-fig3-data11-v1.zip
-
Figure 3—source data 12
PDF containing Figure 3F and original scan of the relevant Western blot analysis with highlighted bands and sample labels.
- https://cdn.elifesciences.org/articles/88375/elife-88375-fig3-data12-v1.zip
-
Figure 3—source data 13
Original file for the Western blot analysis in Figure 3G.
- https://cdn.elifesciences.org/articles/88375/elife-88375-fig3-data13-v1.zip
-
Figure 3—source data 14
PDF containing Figure 3G and original scan of the relevant Western blot analysis with highlighted bands and sample labels.
- https://cdn.elifesciences.org/articles/88375/elife-88375-fig3-data14-v1.zip
-
Figure 3—source data 15
Original file for the Western blot analysis in Figure 3H.
- https://cdn.elifesciences.org/articles/88375/elife-88375-fig3-data15-v1.zip
-
Figure 3—source data 16
PDF containing Figure 3H and original scan of the relevant Western blot analysis with highlighted bands and sample labels.
- https://cdn.elifesciences.org/articles/88375/elife-88375-fig3-data16-v1.zip
-
Figure 3—source data 17
Original file for the Western blot analysis in Figure 3I.
- https://cdn.elifesciences.org/articles/88375/elife-88375-fig3-data17-v1.zip
-
Figure 3—source data 18
PDF containing Figure 3I and original scan of the relevant Western blot analysis with highlighted bands and sample labels.
- https://cdn.elifesciences.org/articles/88375/elife-88375-fig3-data18-v1.zip
Figure 3—figure supplement 1

RAPSYN promotes BCR-ABL stabilization.
Immunoblotting analyses of BCR-ABL in KU812 and Jurkat cells treated with MLN4924 or DMSO for 24 hr (n=3). Error bars, mean ± standard deviation (SD); *p < 0.05; ***p < 0.001; Student’s t-test. See numerical source data Figure 4—figure supplement 1—source data 2.
-
Figure 3—figure supplement 1—source data 1
Original file for the Western blot analysis in Figure 3—figure supplement 1.
- https://cdn.elifesciences.org/articles/88375/elife-88375-fig3-figsupp1-data1-v1.zip
-
Figure 3—figure supplement 1—source data 2
PDF containing Figure 3—figure supplement 1 and original scan of the relevant Western blot analysis with highlighted bands and sample labels.
- https://cdn.elifesciences.org/articles/88375/elife-88375-fig3-figsupp1-data2-v1.zip
Figure 4 with 1 supplement
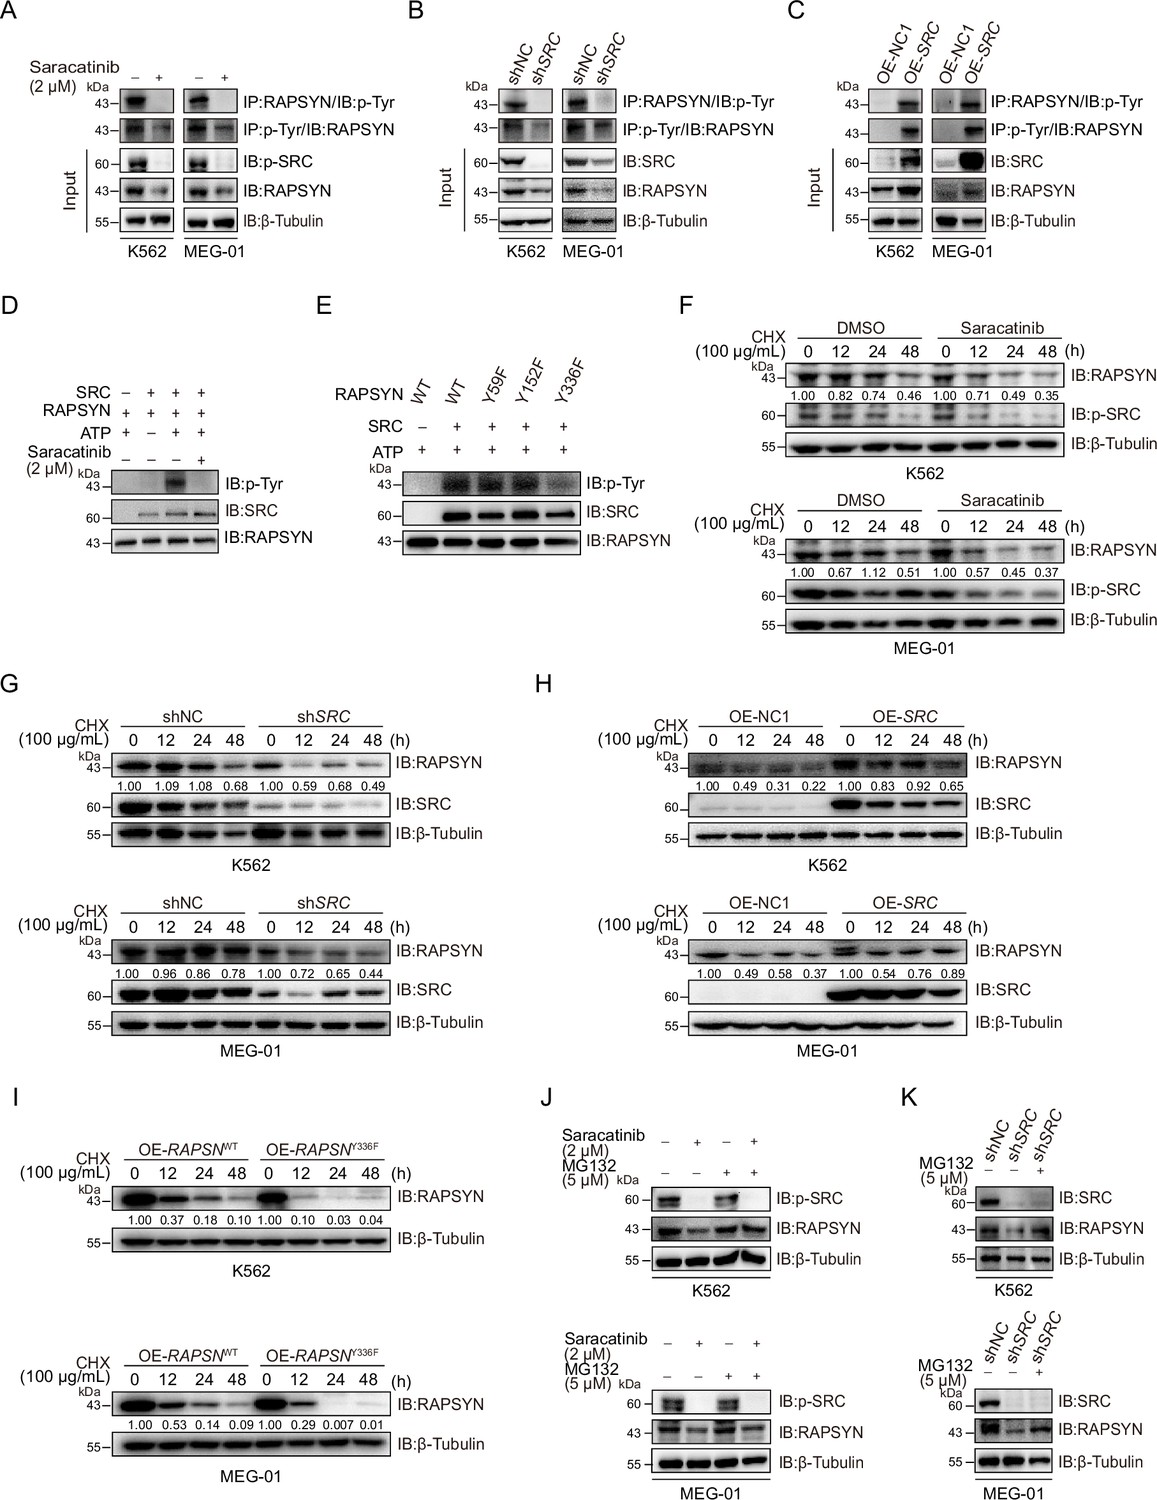
SRC-mediated phosphorylation at Y336 promotes RAPSYN stability by repressing its proteasomal degradation.
(A) Assessment of RAPSYN phosphorylation levels in leukemic cells treated with saracatinib or DMSO for 24 hr. (B) Assessment of RAPSYN phosphorylation levels in leukemic cells transduced with shSRC or shNC. (C) Assessment of RAPSYN phosphorylation levels in leukemic cells expressing exogenous SRC cDNA or empty vector. (D) Assessment of RAPSYN phosphorylation by SRC in vitro. Purified RAPSYN and SRC were incubated with ATP in the presence or absence of saracatinib for phosphorylation assay. (E) Verification of RAPSYN phosphorylation sites. Purified SRC and RAPSYN WT or indicated mutants were incubated with ATP for phosphorylation assay. (F) Assessment of RAPSYN protein stability in leukemic cells treated with CHX in combination with saracatinib or DMSO at indicated time points by immunoblotting. (G) Assessment of RAPSYN protein stability in leukemic cells transduced with shSRC or shNC by immunoblotting. (H) Assessment of RAPSYN protein stability in leukemic cells transduced with exogenous SRC cDNA or empty vector by immunoblotting. (I) Assessment of RAPSYN protein stability in leukemic cells transduced with exogenous RAPSN WT or Y336F cDNA by immunoblotting. (J) Immunoblots of RAPSYN in leukemic cells treated with saracatinib or DMSO for 12 hr, and subsequently with MG132 or DMSO for another 12 hr. (K) Immunoblots of RAPSYN in leukemic cells transduced with shNC or shSRC and treated with MG132 or DMSO for 12 hr.
-
Figure 4—source data 1
Original file for the Western blot analysis in Figure 4A.
- https://cdn.elifesciences.org/articles/88375/elife-88375-fig4-data1-v1.zip
-
Figure 4—source data 2
PDF containing Figure 4A and original scan of the relevant Western blot analysis with highlighted bands and sample labels.
- https://cdn.elifesciences.org/articles/88375/elife-88375-fig4-data2-v1.zip
-
Figure 4—source data 3
Original file for the Western blot analysis in Figure 4B.
- https://cdn.elifesciences.org/articles/88375/elife-88375-fig4-data3-v1.zip
-
Figure 4—source data 4
PDF containing Figure 4B and original scan of the relevant Western blot analysis with highlighted bands and sample labels.
- https://cdn.elifesciences.org/articles/88375/elife-88375-fig4-data4-v1.zip
-
Figure 4—source data 5
Original file for the Western blot analysis in Figure 4C.
- https://cdn.elifesciences.org/articles/88375/elife-88375-fig4-data5-v1.zip
-
Figure 4—source data 6
PDF containing Figure 4C and original scan of the relevant Western blot analysis with highlighted bands and sample labels.
- https://cdn.elifesciences.org/articles/88375/elife-88375-fig4-data6-v1.zip
-
Figure 4—source data 7
Original file for the Western blot analysis in Figure 4D.
- https://cdn.elifesciences.org/articles/88375/elife-88375-fig4-data7-v1.zip
-
Figure 4—source data 8
PDF containing Figure 4D and original scan of the relevant Western blot analysis with highlighted bands and sample labels.
- https://cdn.elifesciences.org/articles/88375/elife-88375-fig4-data8-v1.zip
-
Figure 4—source data 9
Original file for the Western blot analysis in Figure 4E.
- https://cdn.elifesciences.org/articles/88375/elife-88375-fig4-data9-v1.zip
-
Figure 4—source data 10
PDF containing Figure 4E and original scan of the relevant Western blot analysis with highlighted bands and sample labels.
- https://cdn.elifesciences.org/articles/88375/elife-88375-fig4-data10-v1.zip
-
Figure 4—source data 11
Original file for the Western blot analysis in Figure 4F.
- https://cdn.elifesciences.org/articles/88375/elife-88375-fig4-data11-v1.zip
-
Figure 4—source data 12
PDF containing Figure 4F and original scan of the relevant Western blot analysis with highlighted bands and sample labels.
- https://cdn.elifesciences.org/articles/88375/elife-88375-fig4-data12-v1.zip
-
Figure 4—source data 13
Original file for the Western blot analysis in Figure 4G.
- https://cdn.elifesciences.org/articles/88375/elife-88375-fig4-data13-v1.zip
-
Figure 4—source data 14
PDF containing Figure 4G and original scan of the relevant Western blot analysis with highlighted bands and sample labels.
- https://cdn.elifesciences.org/articles/88375/elife-88375-fig4-data14-v1.zip
-
Figure 4—source data 15
Original file for the Western blot analysis in Figure 4H.
- https://cdn.elifesciences.org/articles/88375/elife-88375-fig4-data15-v1.zip
-
Figure 4—source data 16
PDF containing Figure 4H and original scan of the relevant Western blot analysis with highlighted bands and sample labels.
- https://cdn.elifesciences.org/articles/88375/elife-88375-fig4-data16-v1.zip
-
Figure 4—source data 17
Original file for the Western blot analysis in Figure 4I.
- https://cdn.elifesciences.org/articles/88375/elife-88375-fig4-data17-v1.zip
-
Figure 4—source data 18
PDF containing Figure 4I and original scan of the relevant Western blot analysis with highlighted bands and sample labels.
- https://cdn.elifesciences.org/articles/88375/elife-88375-fig4-data18-v1.zip
-
Figure 4—source data 19
Original file for the Western blot analysis in Figure 4J.
- https://cdn.elifesciences.org/articles/88375/elife-88375-fig4-data19-v1.zip
-
Figure 4—source data 20
PDF containing Figure 4J and original scan of the relevant Western blot analysis with highlighted bands and sample labels.
- https://cdn.elifesciences.org/articles/88375/elife-88375-fig4-data20-v1.zip
-
Figure 4—source data 21
Original file for the Western blot analysis in Figure 4K.
- https://cdn.elifesciences.org/articles/88375/elife-88375-fig4-data21-v1.zip
-
Figure 4—source data 22
PDF containing Figure 4K and original scan of the relevant Western blot analysis with highlighted bands and sample labels.
- https://cdn.elifesciences.org/articles/88375/elife-88375-fig4-data22-v1.zip
Figure 4—figure supplement 1
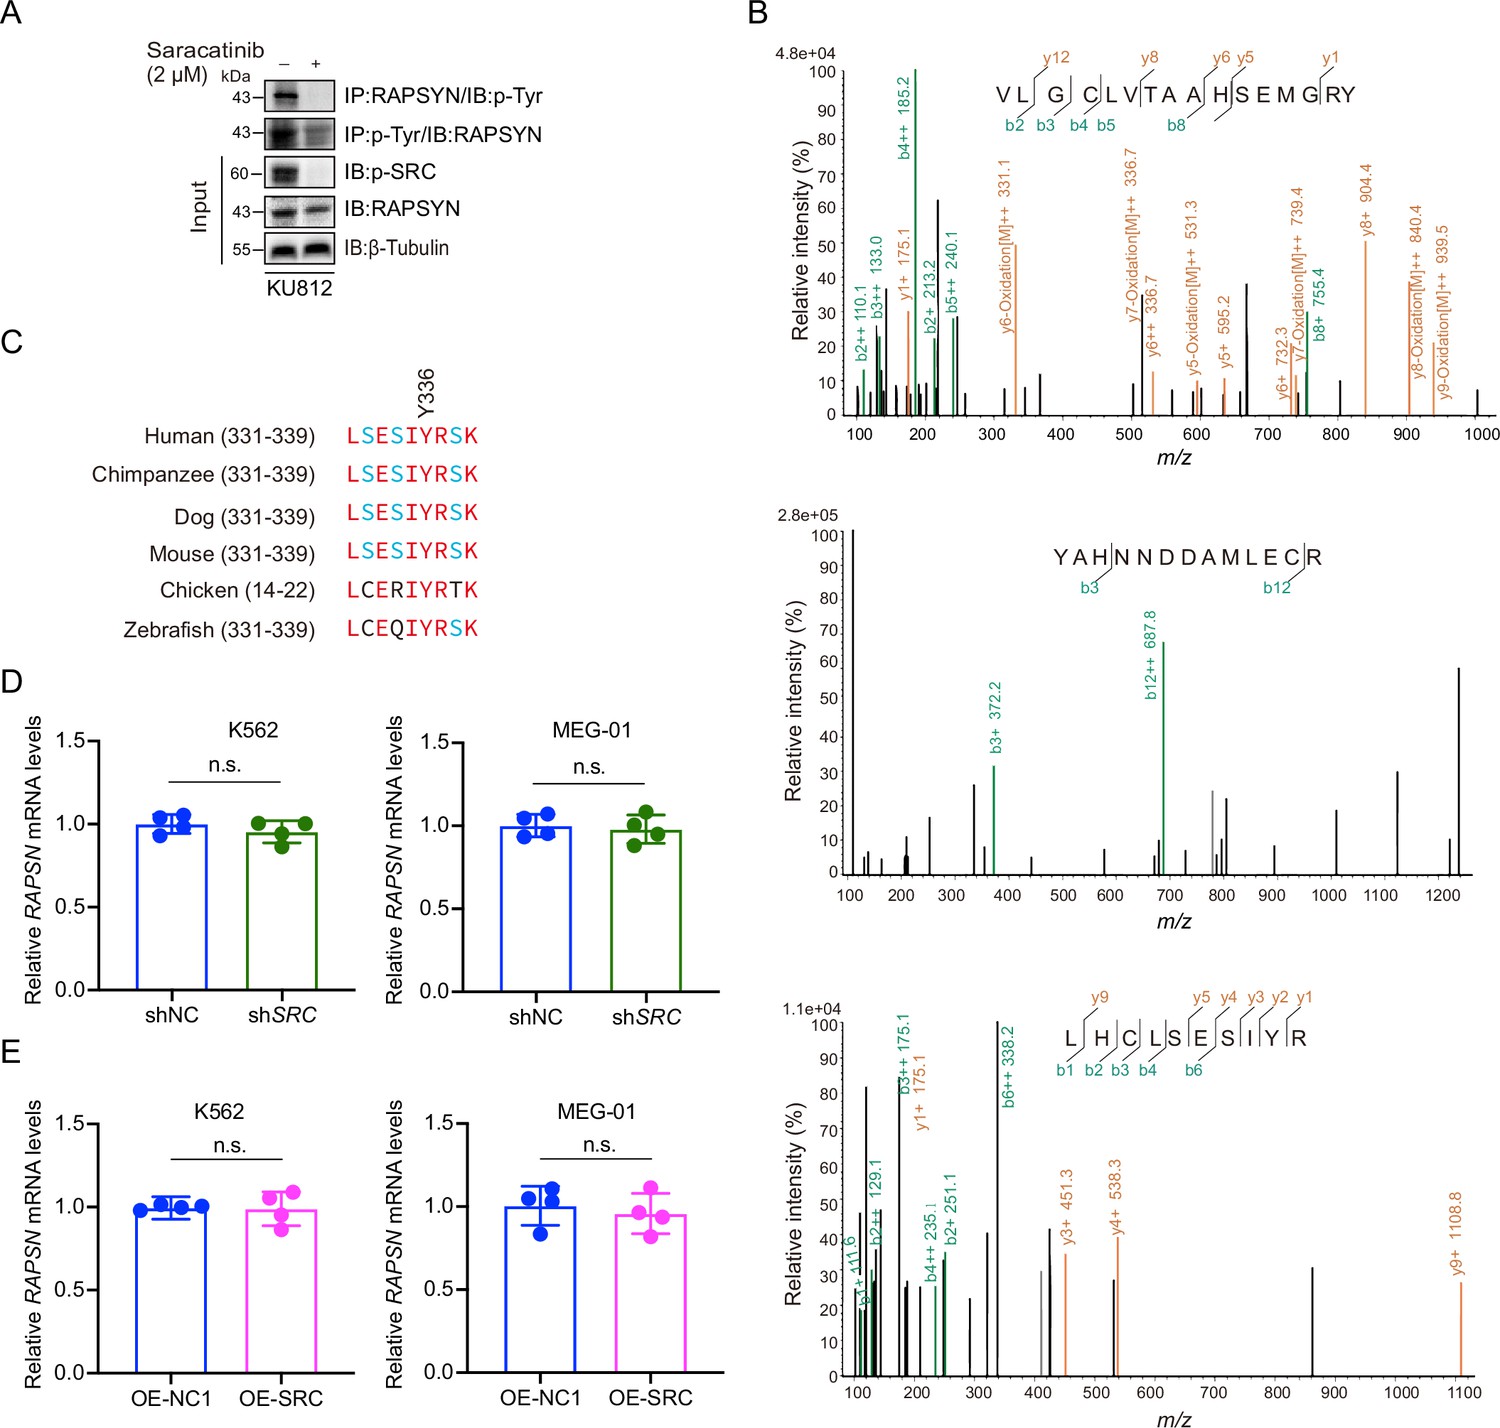
SRC-mediated phosphorylation at Y336 promotes RAPSYN stability.
(A) Assessment of RAPSYN phosphorylation in KU812 cells treated with saracatinib or DMSO for 24 hr. (B) Liquid chromatography–mass spectrometry (LC–MS/MS) spectra of trypsin-digested RAPSYN fragments (phosphorylated Y59, Y152, and Y336). The detected products are indicated by green (b ions) and orange (y ions). (C), Sequence alignment of putative phosphorylated site Y336 from indicated species. (D), Quantification of RAPSN mRNA levels in K562 and MEG-01 cells transduced with shSRC or shNC by reverse transcription-PCR (RT-PCR) (n=4). (E), Quantification of RAPSN mRNA levels in K562 and MEG-01 cells expressing exogenous SRC cDNA or corresponding empty vector by RT-PCR (n=4). RAPSN mRNA levels were normalized to that of GAPDH (D, E); error bars, mean ± standard deviation (SD); n.s., not significant; unpaired Student’s t-test. See numerical source data in Figure 5—source data 2.
-
Figure 4—figure supplement 1—source data 1
Original file for the Western blot analysis in Figure 4—figure supplement 1A.
- https://cdn.elifesciences.org/articles/88375/elife-88375-fig4-figsupp1-data1-v1.zip
-
Figure 4—figure supplement 1—source data 2
PDF containing Figure 4—figure supplement 1A and original scan of the relevant Western blot analysis with highlighted bands and sample labels.
- https://cdn.elifesciences.org/articles/88375/elife-88375-fig4-figsupp1-data2-v1.zip
Figure 5
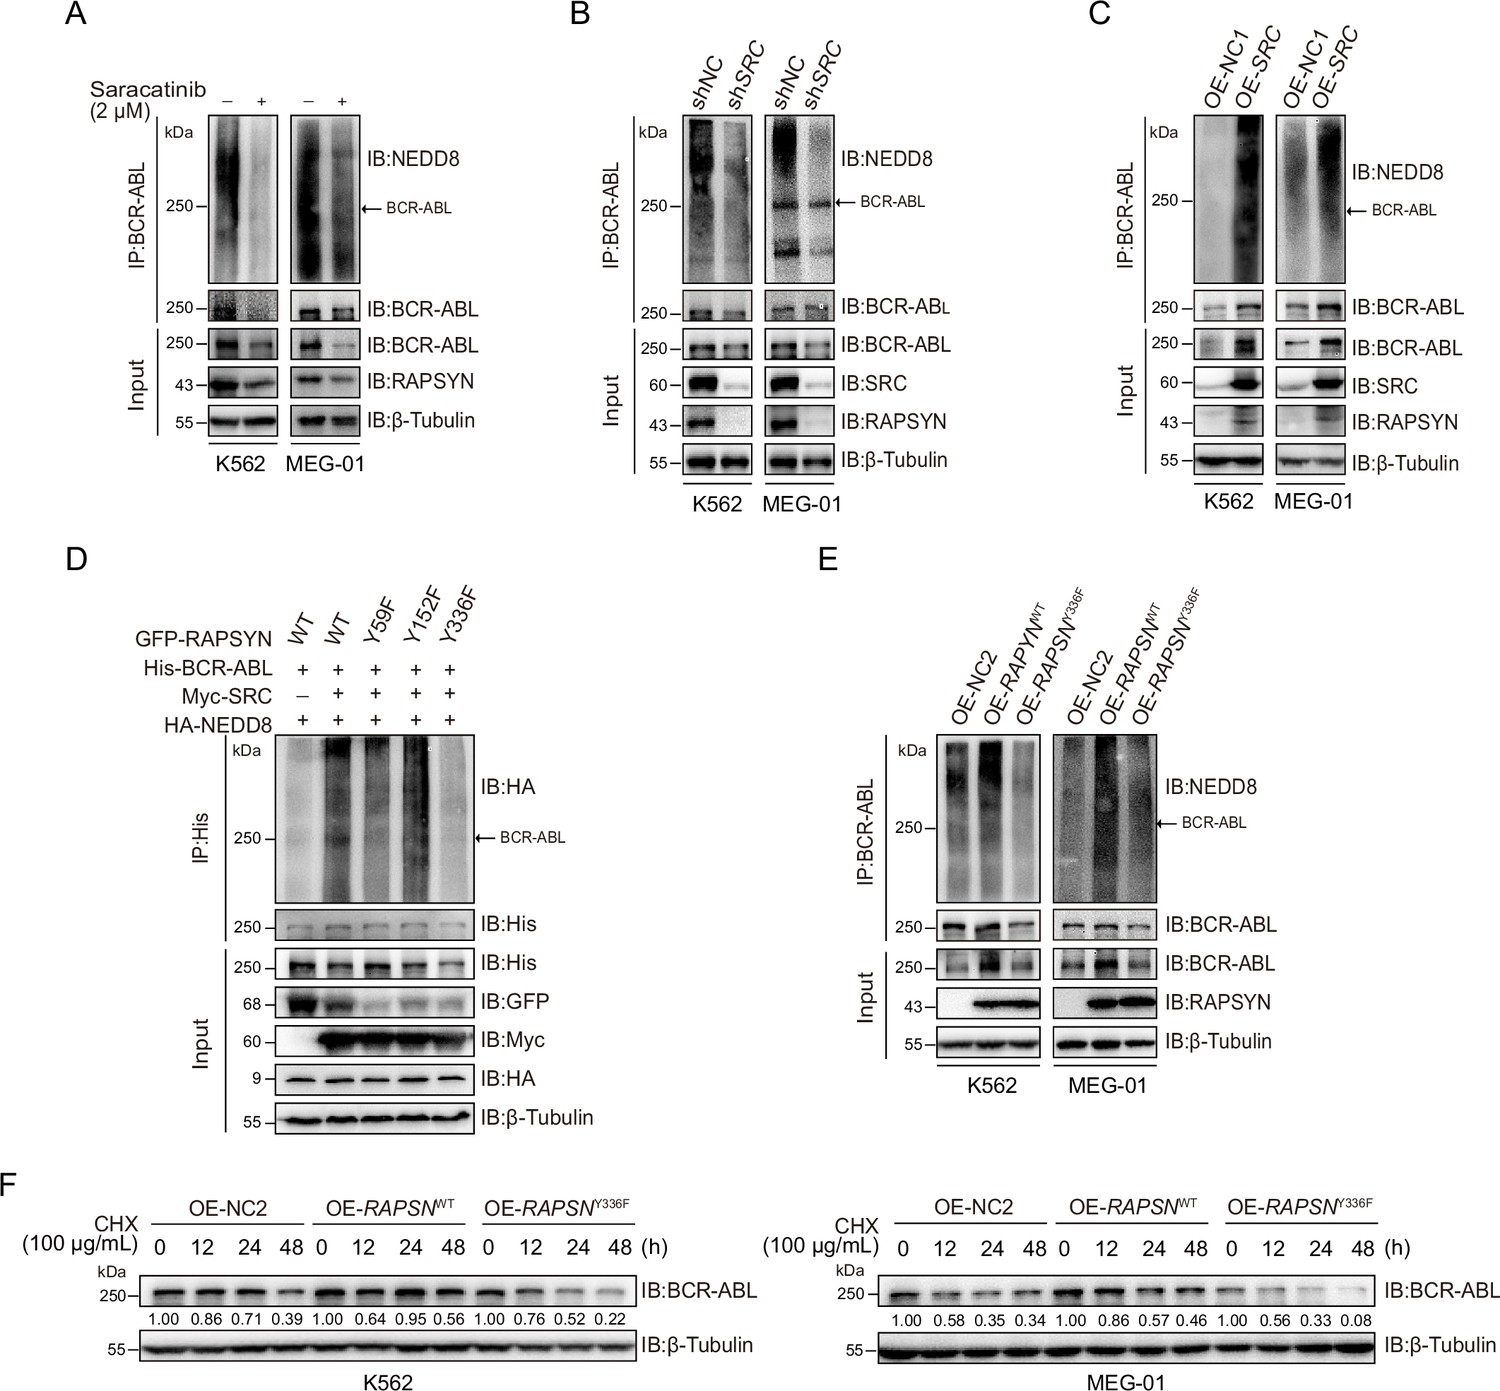
RAPSYN phosphorylation at Y336 potentiates its E3 ligase activity and promotes BCR-ABL stabilization.
(A) Immunoblots of BCR-ABL neddylation levels in leukemic cells treated with saracatinib or DMSO for 24 hr. (B) Immunoblots of BCR-ABL neddylation levels in leukemic cells transduced with shSRC or shNC. (C) Immunoblots of BCR-ABL neddylation levels in leukemic cells expressing exogenous SRC cDNA or empty vector. (D) Effects of RAPSYN phosphorylation on BCR-ABL neddylation levels in HEK293T cells transfected with indicated constructs. (E) Effects of RAPSYN phosphorylation at Y336 on BCR-ABL neddylation levels in leukemic cells expressing exogenous RAPSN WT, Y336F cDNA, or empty vector. (F) Assessment of BCR-ABL protein stability in leukemic cells transduced with exogenous cDNA for RAPSN-WT, Y336F mutant or empty vector by immunoblotting.
-
Figure 5—source data 1
Original file for the Western blot analysis in Figure 5A.
- https://cdn.elifesciences.org/articles/88375/elife-88375-fig5-data1-v1.zip
-
Figure 5—source data 2
PDF containing Figure 5A and original scan of the relevant Western blot analysis with highlighted bands and sample labels.
- https://cdn.elifesciences.org/articles/88375/elife-88375-fig5-data2-v1.zip
-
Figure 5—source data 3
Original file for the Western blot analysis in Figure 5B.
- https://cdn.elifesciences.org/articles/88375/elife-88375-fig5-data3-v1.zip
-
Figure 5—source data 4
PDF containing Figure 5B and original scan of the relevant Western blot analysis with highlighted bands and sample labels.
- https://cdn.elifesciences.org/articles/88375/elife-88375-fig5-data4-v1.zip
-
Figure 5—source data 5
Original file for the Western blot analysis in Figure 5C.
- https://cdn.elifesciences.org/articles/88375/elife-88375-fig5-data5-v1.zip
-
Figure 5—source data 6
PDF containing Figure 5C and original scan of the relevant Western blot analysis with highlighted bands and sample labels.
- https://cdn.elifesciences.org/articles/88375/elife-88375-fig5-data6-v1.zip
-
Figure 5—source data 7
Original file for the Western blot analysis in Figure 5D.
- https://cdn.elifesciences.org/articles/88375/elife-88375-fig5-data7-v1.zip
-
Figure 5—source data 8
PDF containing Figure 5D and original scan of the relevant Western blot analysis with highlighted bands and sample labels.
- https://cdn.elifesciences.org/articles/88375/elife-88375-fig5-data8-v1.zip
-
Figure 5—source data 9
Original file for the Western blot analysis in Figure 5E.
- https://cdn.elifesciences.org/articles/88375/elife-88375-fig5-data9-v1.zip
-
Figure 5—source data 10
PDF containing Figure 5E and original scan of the relevant Western blot analysis with highlighted bands and sample labels.
- https://cdn.elifesciences.org/articles/88375/elife-88375-fig5-data10-v1.zip
-
Figure 5—source data 11
Original file for the Western blot analysis in Figure 5F.
- https://cdn.elifesciences.org/articles/88375/elife-88375-fig5-data11-v1.zip
-
Figure 5—source data 12
PDF containing Figure 5F and original scan of the relevant Western blot analysis with highlighted bands and sample labels.
- https://cdn.elifesciences.org/articles/88375/elife-88375-fig5-data12-v1.zip
Figure 6 with 1 supplement
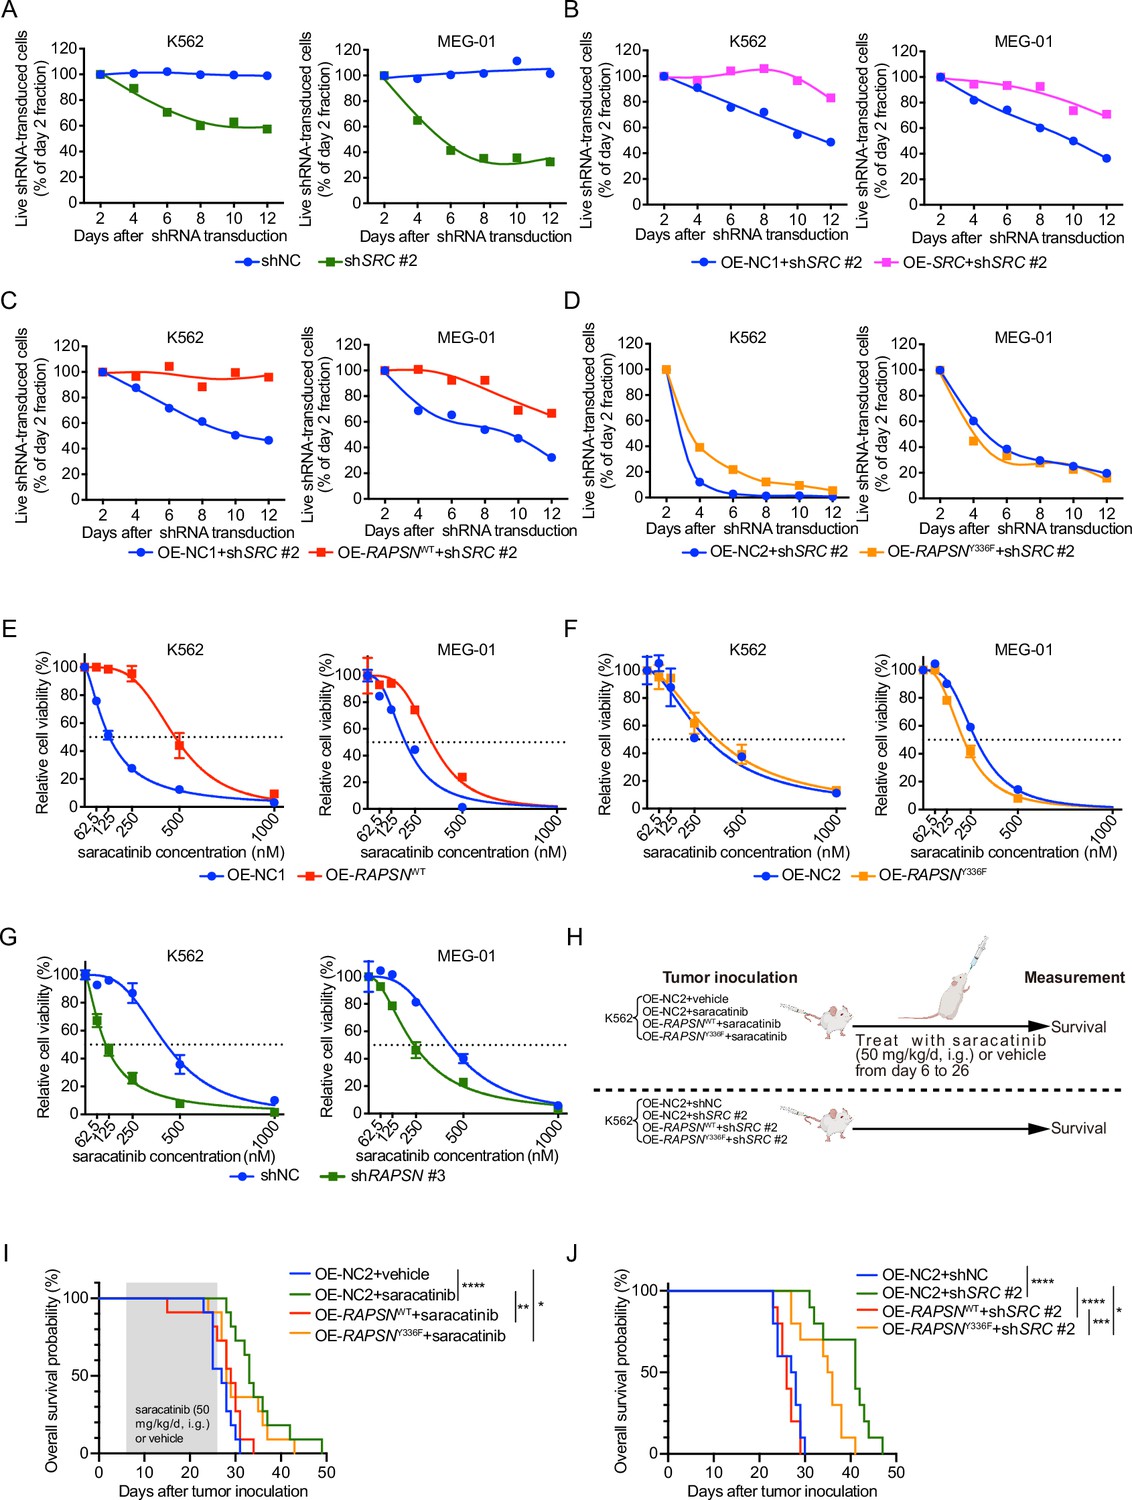
SRC-mediated phosphorylation of RAPSYN at Y336 promotes Ph+ leukemia progression.
(A) Cytotoxicity induced by shSRC #2-mediated SRC knockdown in leukemic cells. (B) Rescue of leukemic cells from shSRC #2-induced toxicity by exogenous expression of SRC cDNA. (C) Rescue of leukemic cells from shSRC #2-induced toxicity by exogenous expression of RAPSNWT cDNA. (D) Failed rescue of leukemic cells from shSRC #2-induced toxicity by exogenous expression of RAPSNY336F cDNA. (E) Viability of leukemic cells transduced with either RAPSNWT cDNA or corresponding empty vector after 72 hr of incubation with indicated concentrations of saracatinib. (F) Viability of leukemic cells transduced with either RAPSNY336F cDNA or corresponding empty vector after 72 hr of incubation with indicated concentrations of saracatinib. (G) Viability of leukemic cells transduced with either shNC or shRAPSN #3 after 72 hr of incubation with indicated concentrations of saracatinib. (H) Experimental design used to test in vivo effects of RAPSYN phosphorylation at Y336 on Ph+ leukemia progression and survival time. (I) Kaplan–Meier survival curve of NCG mice following intravenous injection of K562-RAPSNWT or K562-RAPSNY336F cells and intragastric administration of saracatinib or corresponding vehicle from days 6 to 26 as indicated (ten mice in each group). (J) Kaplan–Meier survival curve of NCG mice following intravenous injection of double-transfected K562 cells (ten mice in each group). Representative results from at least three independent experiments are shown (A–G); error bars, mean ± standard deviation (SD); *p < 0.05, **p < 0.01, ***p < 0.001, ****p < 0.0001; log-rank test (I–J).
Figure 6—figure supplement 1
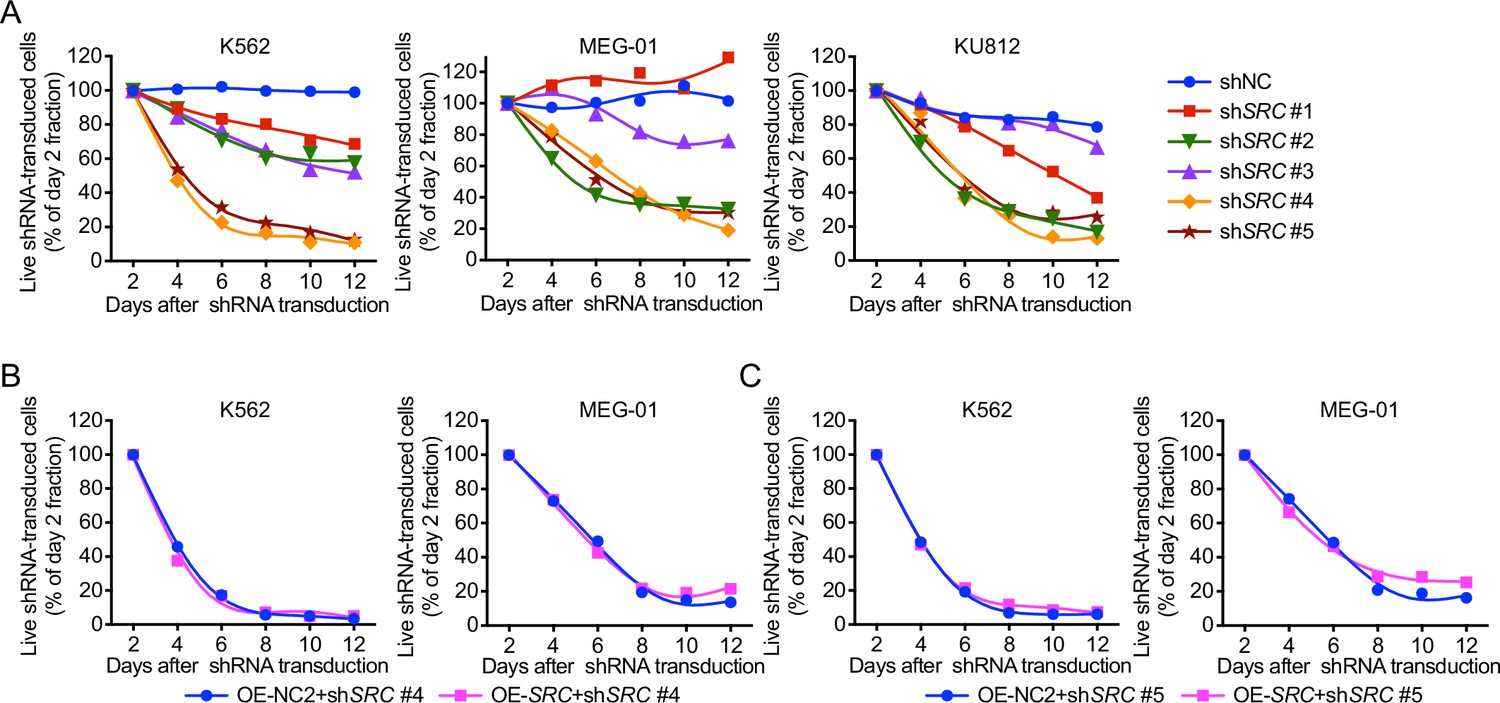
shSRC #2 is a specific shRNA targeting the 3′UTR of SRC.
(A) Toxicity tests of all shSRCs in Ph+ leukemia. Failed rescue of K562 and MEG-01 cells from shSRC #4 (B) and #5 (C)-induced toxicity by exogenous expression of an SRC cDNA. Representative results from at least three independent experiments are shown (A–C).
Tables
Key resources table
| Reagent type (species) or resource | Designation | Source or reference | Identifiers | Additional information |
|---|---|---|---|---|
| Strain, strain background (M. musculus) | Mouse: NOD/ShiLtJGpt-Prkdcem26Cd52Il2rgem26Cd22/Gpt | GemPharmatech | Cat# CB101 | |
| Cell line (Homo sapiens) | Human bone marrow stromal cell HS-5 (male) | ATCC | Cat# CRL11882; RRID:CVCL_3720 | |
| Cell line (Homo sapiens) | Human chronic myelogenous leukemia K562 (female) | COBIOER | Cat# CBP60529 | |
| Cell line (Homo sapiens) | Human chronic myelogenous leukemia MEG-01 (male) | COBIOER | Cat# CBP61104 | |
| Cell line (Homo sapiens) | Human chronic myelogenous leukemia KU812 (male) | COBIOER | Cat# CBP60732 | |
| Cell line (Homo sapiens) | HEK-293T | KeyGEN BioTECH | Cat# KG405 | |
| Antibody | Mouse monoclonal anti-RAPSYN (clone 1234) | Abcam | Cat# ab11423; RRID:AB_298028 | 1:1000 |
| Antibody | Rabbit polyclonal anti-RAPSYN (clone 118491) | Abcam | Cat# ab118491; RRID:AB_10899872 | 1:1000 |
| Antibody | Mouse monoclonal anti-6X His tag (clone HIS.H8) | Abcam | Cat# ab18184; RRID:AB_444306 | 1:1000 |
| Antibody | Mouse monoclonal anti-BCR-ABL (clone 7C6) | Abcam | Cat# ab187831 | 1:1000 |
| Antibody | Rabbit monoclonal anti-SRC Family (phosphoY418) | Abcam | Cat# ab40660 | 1:1000 |
| Antibody | Rabbit monoclonal anti-NEDD8 (clone 19E3) | Cell Signaling Technology | Cat# 2754; RRID:AB_659972 | 1:1000 |
| Antibody | Rabbit monoclonal anti-HA-Tag (clone C29F4) | Cell Signaling Technology | Cat# 3724; RRID:AB_1549585 | 1:1000 |
| Antibody | Rabbit monoclonal anti-GFP (clone D5.1) | Cell Signaling Technology | Cat# 2956; RRID:AB_1196615 | 1:1000 |
| Antibody | Rabbit monoclonal anti-GST (clone 91G1) | Cell Signaling Technology | Cat#2625 | 1:1000 |
| Antibody | Mouse monoclonal anti-Myc-Tag (clone 9B11) | Cell Signaling Technology | Cat#2276; RRID:AB_331783 | 1:1000 |
| Antibody | Rabbit monoclonal anti-SRC (clone 36D10) | Cell Signaling Technology | Cat# 2109; RRID:AB_2106059 | 1:1000 |
| Antibody | Rabbit monoclonal anti-Flag (DYKDDDDK) Tag (clone D6W5B) | Cell Signaling Technology | Cat# 14793; RRID:AB_2572291 | 1:1000 |
| Antibody | Rabbit monoclonal anti-GAPDH (clone 14C10) | Cell Signaling Technology | Cat# 2128; RRID:AB_823664 | 1:2000 |
| Antibody | Anti-mouse IgG, HRP-linked antibody | Cell Signaling Technology | Cat# 7076 S; RRID:AB_330924 | 1:5000 |
| Antibody | Anti-rabbit IgG, HRP-linked antibody | Cell Signaling Technology | Cat# 7074 S; RRID:AB_2099233 | 1:5000 |
| Antibody | Normal Mouse IgG | Santa Cruz Biotechnology | Cat# sc-2025; RRID:AB_737182 | 1:100 |
| Antibody | Mouse monoclonal anti-c-CBL (clone A-9) | Santa Cruz Biotechnology | Cat# SC-1651; RRID:AB_2244054 | 1:1000 |
| Antibody | Mouse monoclonal anti-Phosphotyrosine Antibody (clone 4G10) | Sigma-Aldrich | Cat# 05-321 X; RRID:AB_568858 | 1:1000 |
| Antibody | Rabbit monoclonal anti-AChRα7 | Santa Cruz Biotechnology | Cat# SC-58607; RRID:AB_784835 | 1:1000 |
| Antibody | Rabbit monoclonal anti-mAChR M2 | Santa Cruz Biotechnology | Cat# SC-33712; RRID:AB_673789 | 1:1000 |
| Antibody | Mouse monoclonal anti-mAChR M3 | Santa Cruz Biotechnology | Cat# SC-518107 | 1:1000 |
| Antibody | Rbbit polyclonal anti-mAChR M4 | HUABIO | Cat# ER1906-24; | 1:1000 |
| Strain, strain background (Escherichia coli) | DH5-alpha | TIANGEN | Cat# CB101 | |
| Strain, strain background (Escherichia coli) | ArcticExpress (DE3) pRARE2 | ANGYUBIO | Cat# AYBIO-G6023 | |
| Transfected construct (human) | Plasmid: pcDNA 3.1(+) mammalian expression vector | Invitrogen | Cat# V79020 | |
| Strain, strain background (human) | Plasmid: pd1-EGFP-N1 mammalian expression vector | Clontech | Cat# 6073-1 | |
| Transfected construct (Escherichia coli) | pGEX-4T-1 bacterial expression vector | Addgene | 27-4580-01 |
Additional files
-
Supplementary file 1
Sequences of shRNA and primer pairs used for real-time PCR to determine the mRNA levels.
- https://cdn.elifesciences.org/articles/88375/elife-88375-supp1-v1.docx
-
MDAR checklist
- https://cdn.elifesciences.org/articles/88375/elife-88375-mdarchecklist1-v1.docx
Download links
A two-part list of links to download the article, or parts of the article, in various formats.
Downloads (link to download the article as PDF)
Open citations (links to open the citations from this article in various online reference manager services)
Cite this article (links to download the citations from this article in formats compatible with various reference manager tools)
RAPSYN-mediated neddylation of BCR-ABL alternatively determines the fate of Philadelphia chromosome-positive leukemia
eLife 12:RP88375.
https://doi.org/10.7554/eLife.88375.3


