Figures
Figure 1 with 1 supplement

Effects of C-type natriuretic peptide (CNP) supplementation on the oocyte quality and female fertility in aged mice.
(A) A timeline diagram of CNP administration and superovulation. (B) Representative images of young, aged, and CNP administration aged (Aged + CNP) mice as well as their ovaries. (C) Body weights of young, aged, and aged + CNP aged mice. (D) Ovarian weights of young, aged, and aged + CNP mice. (E) Ratios of ovarian weight to body weight for each group of mice. (F) Serum CNP concentrations were measured in young, aged, and aged + CNP mice. (G) Representative images of the oocyte polar body extrusion in young, aged, and aged + CNP mice. Scale bar: 100 μm. (H) Ovulated oocytes were counted in young, aged, and aged + CNP mice. (I) Rate of polar body extrusion in young, aged, and aged + CNP mice. (J) The rate of fragmented oocytes was recorded in young, aged, and aged + CNP mice. (K) Representative images of ovarian sections from young, aged, and aged + CNP mice. Scale bars: 100 μm. (L) Follicles at different developmental stages were counted in young, aged, and aged + CNP ovaries. (M) Average litter size of mated mice was assessed by mating with 2-month-old male mice.
Figure 1—figure supplement 1
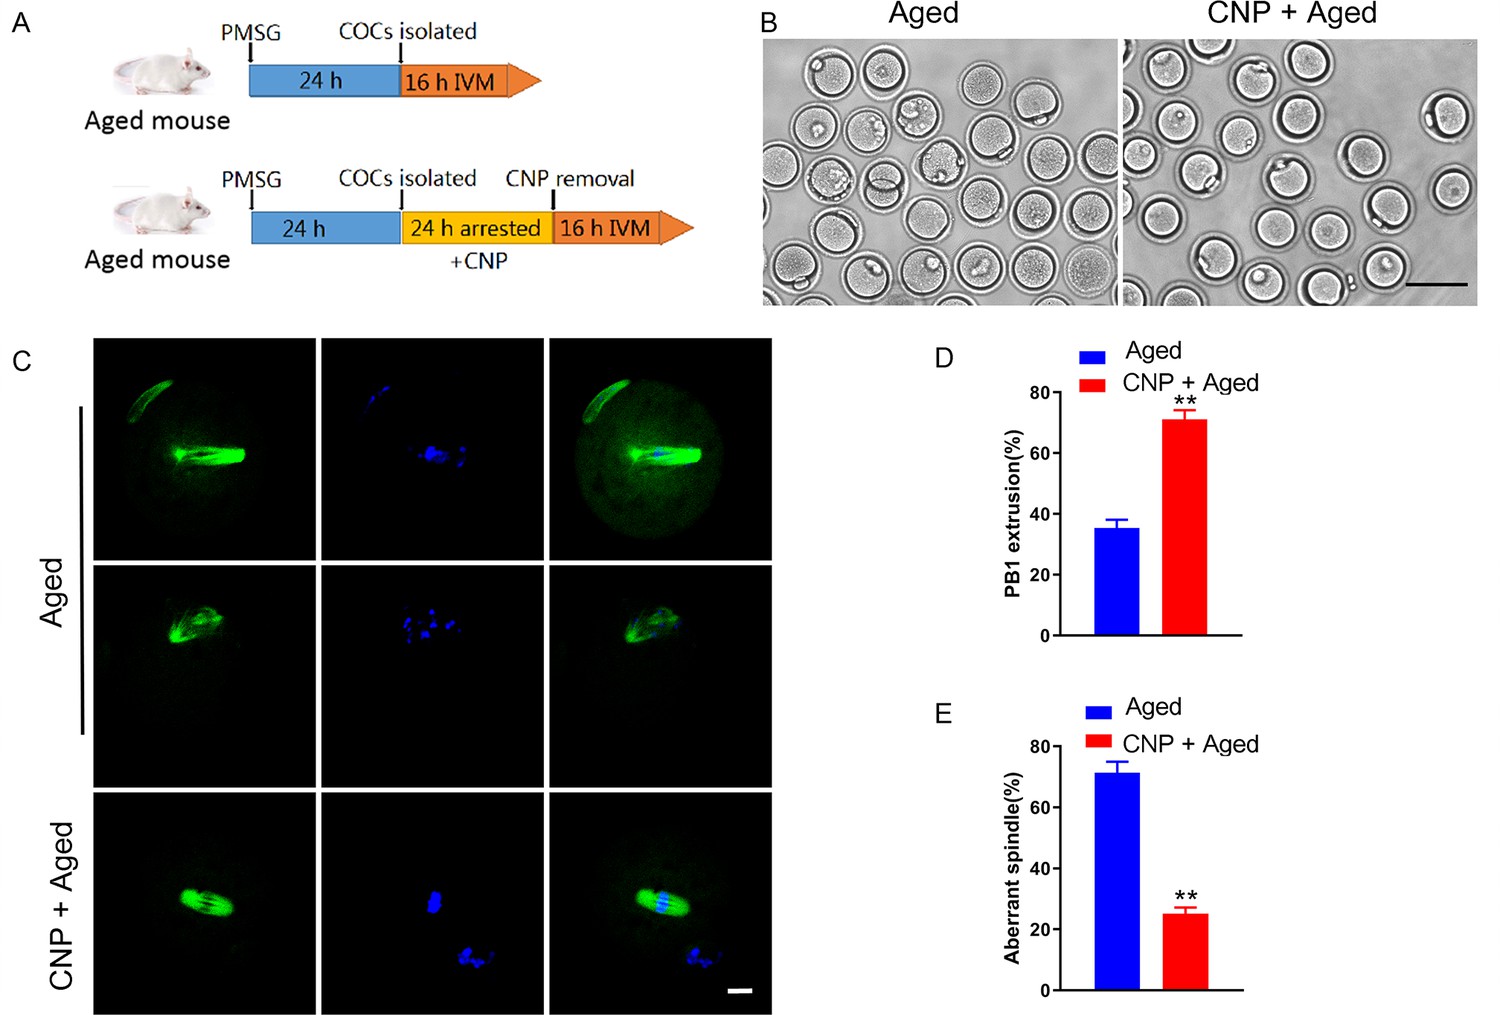
Effects of C-type natriuretic peptide (CNP) on the maturation and spindle/chromosome structure in aged oocytes.
(A) A timeline diagram of experimental design. (B) Representative images of the oocyte polar body extrusion in aged control and CNP treatment groups. Scale bar, 100 μm. (C) Rate of polar body extrusion in aged control and CNP treatment groups. ** Significant difference (p<0.01). (D) Representative images of the spindle morphology and chromosome alignment at metaphase II in aged control and CNP treatment oocytes. Scale bar, 10 μm. (E) The rate of aberrant spindles at metaphase II was recorded in aged control and CNP treatment oocytes. **Significant difference (p<0.01).
Figure 2 with 4 supplements
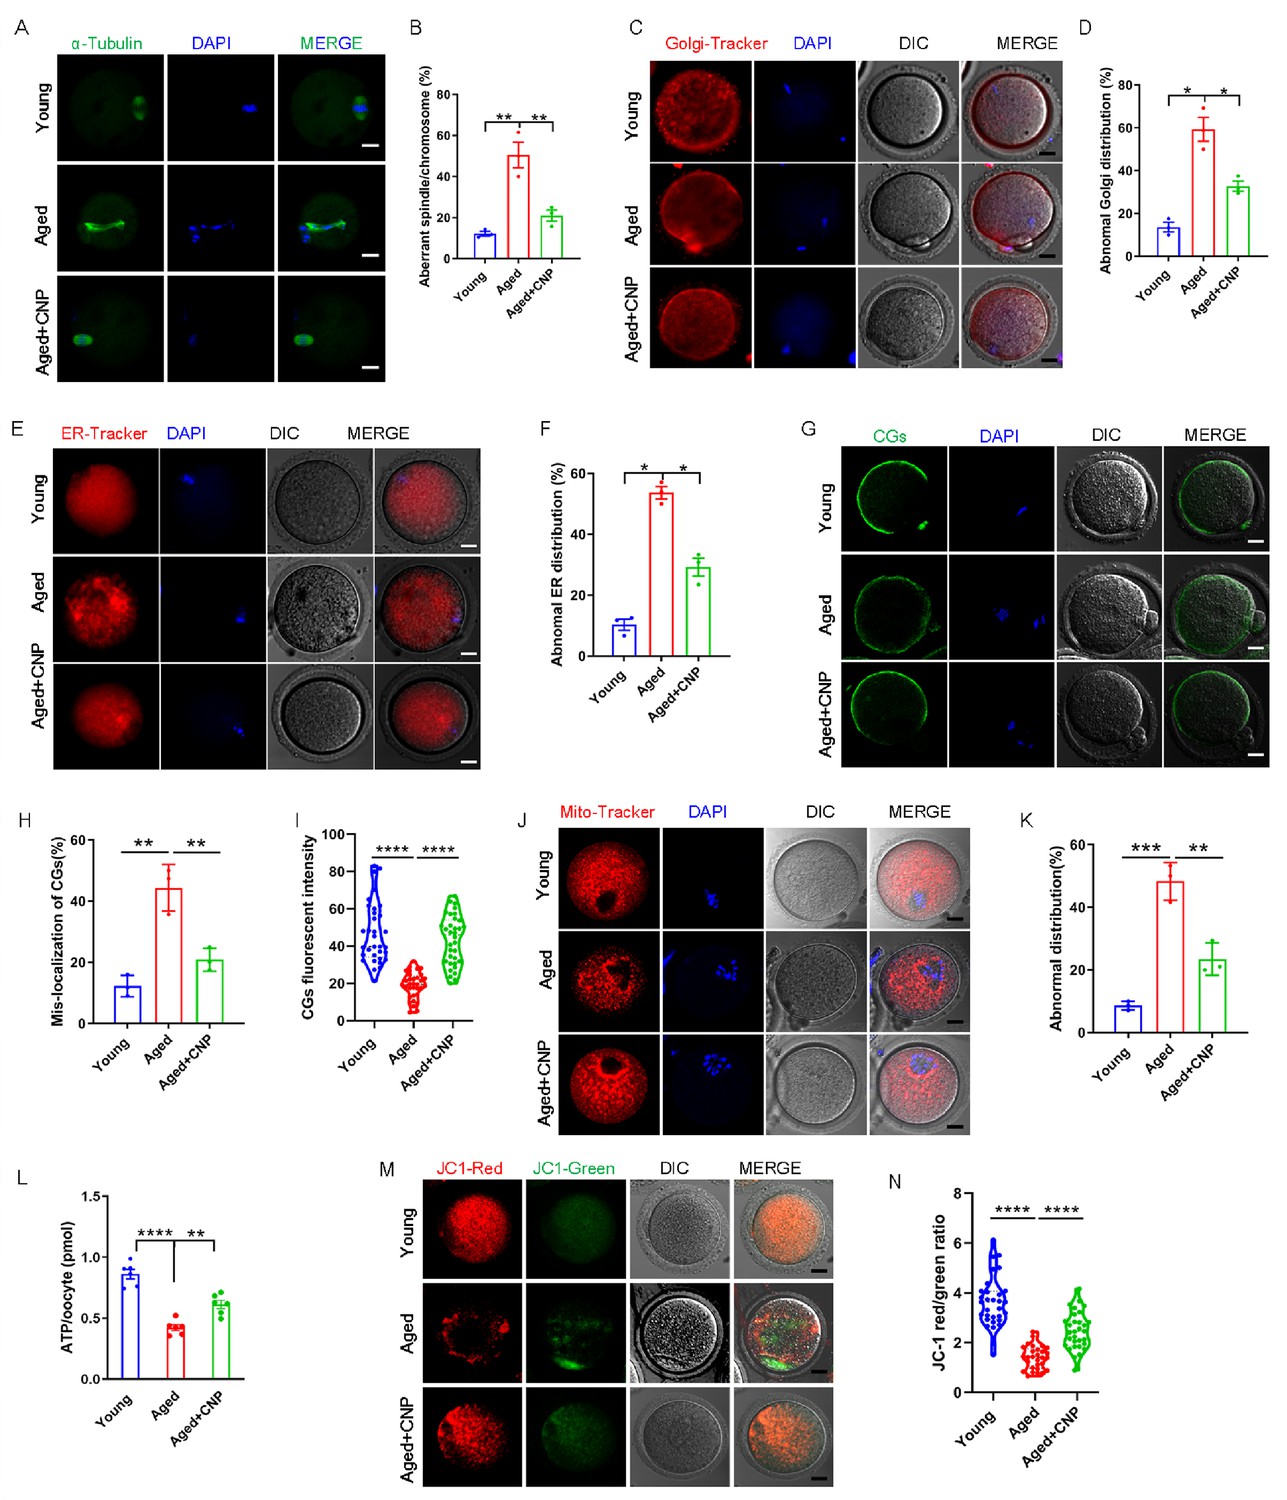
C-type natriuretic peptide (CNP) supplementation recovers cytoplasmic maturation events of maternally aged mouse oocytes.
(A) Representative images of the spindle morphology and chromosome alignment at metaphase II in young, aged, and aged + CNP mice. Scale bar, 10 μm. (B) The rate of aberrant spindles at metaphase II was recorded in young, aged, and aged + CNP mice. (C) Representative images of the Golgi apparatus distribution at metaphase II in young, aged, and aged + CNP mice. Scale bar, 10 μm. (D) The rate of aberrant Golgi apparatus distribution was recorded in young, aged, and aged + CNP mice. (E) Representative images of the endoplasmic reticulum distribution at metaphase II in young, aged, and aged + CNP mice. Scale bar, 10 μm. (F) The rate of aberrant endoplasmic reticulum distribution was recorded in young, aged, and aged + CNP mice. (G) Representative images of the cortical granules (CGs) distribution in young, aged, and aged + CNP mice. Scale bar, 10 μm. (H) The rate of mislocalized CGs was recorded in the young, aged, and aged + CNP mice. (I) The fluorescence intensity of CG signals was measured in the young, aged, and aged + CNP mice oocyte. (J) Representative images of mitochondrial distribution in the young, aged, and aged + CNP mice oocytes stained with MitoTracker Red. Scale bar, 10 μm. (K) The abnormal rate of mitochondrial distribution was recorded in the young, aged, and aged + CNP mice oocytes. (L) ATP levels were measured in the young, aged, and aged + CNP mice. (M) Mitochondrial membrane potential (ΔΨm) was detected by JC-1 staining in the young, aged, and aged + CNP mice oocytes. Scale bar, 10 μm. (N) The ratio of red to green fluorescence intensity was calculated in the young, aged, and aged + CNP mice oocytes.
Figure 2—figure supplement 1
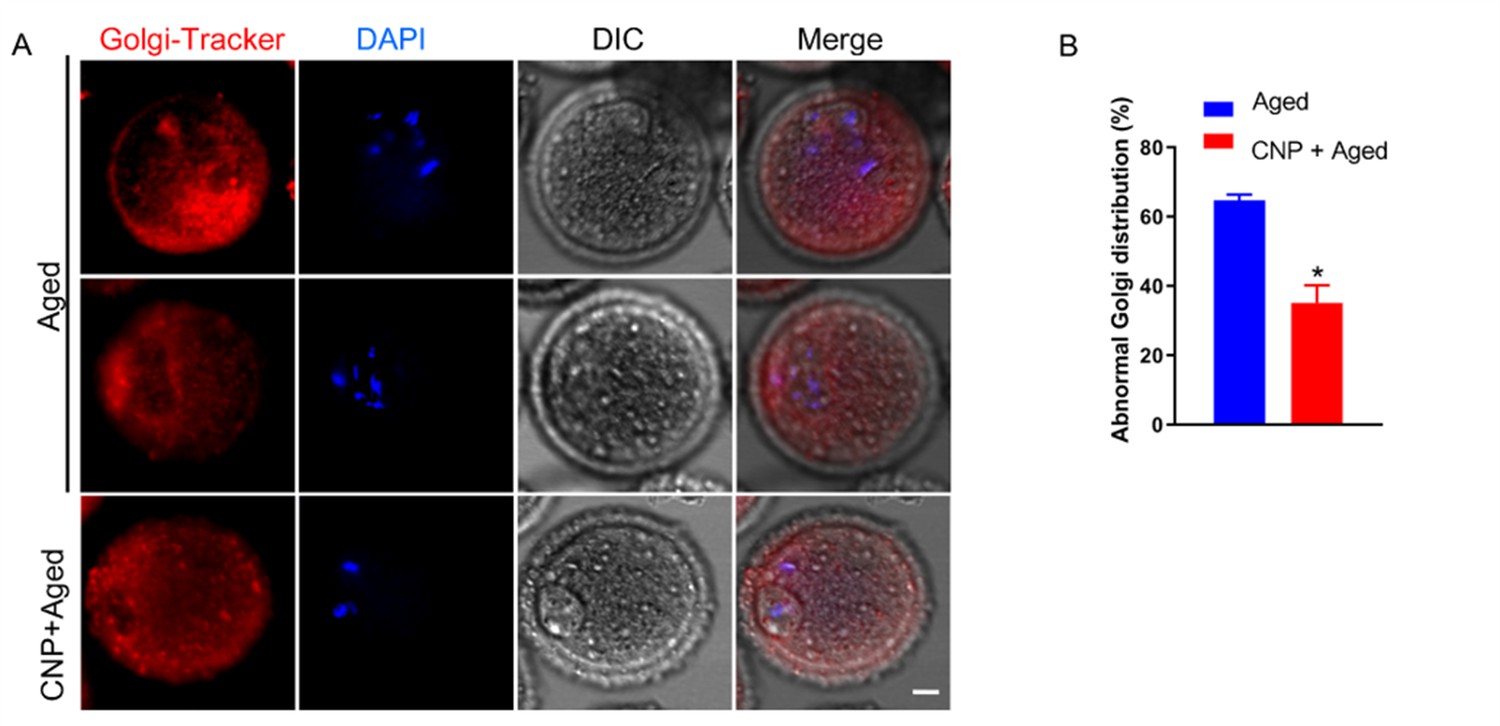
Effects of C-type natriuretic peptide (CNP) on Golgi apparatus distribution in aged oocytes.
Representative images of Golgi apparatus distribution in the aged control and CNP treatment oocytes stained with Golgi-Tracker Red. Scale bar, 10 μm. (B) Abnormal distribution of Golgi apparatus in the aged control and CNP treatment oocytes. *Significant difference (p<0.05).
Figure 2—figure supplement 2

Effects of C-type natriuretic peptide (CNP) on endoplasmic reticulum distribution and function in aged oocytes.
(A) Representative images of endoplasmic reticulum (ER) distribution in the aged control and CNP treatment oocytes stained with ER-Tracker Red. Scale bar, 10 μm. (B) Abnormal distribution of ER in the aged control and CNP treatment oocytes. *Significant difference (p<0.05).
Figure 2—figure supplement 3

Effects of C-type natriuretic peptide (CNP) on the dynamics of cortical granules (CGs) in aged oocytes.
Representative images of CGs distribution in the aged control and CNP treatment oocytes stained with LCA-FITC and imaged by confocal microscope. Scale bar, 10 μm. (B) The rate of mislocalized CGs was recorded in the aged control and CNP treatment oocytes. *Significant difference (p<0.05). (C) The fluorescence intensity of CG signals was measured in the aged control and CNP treatment oocytes. ****Significant difference (p<0.0001).
Figure 2—figure supplement 4
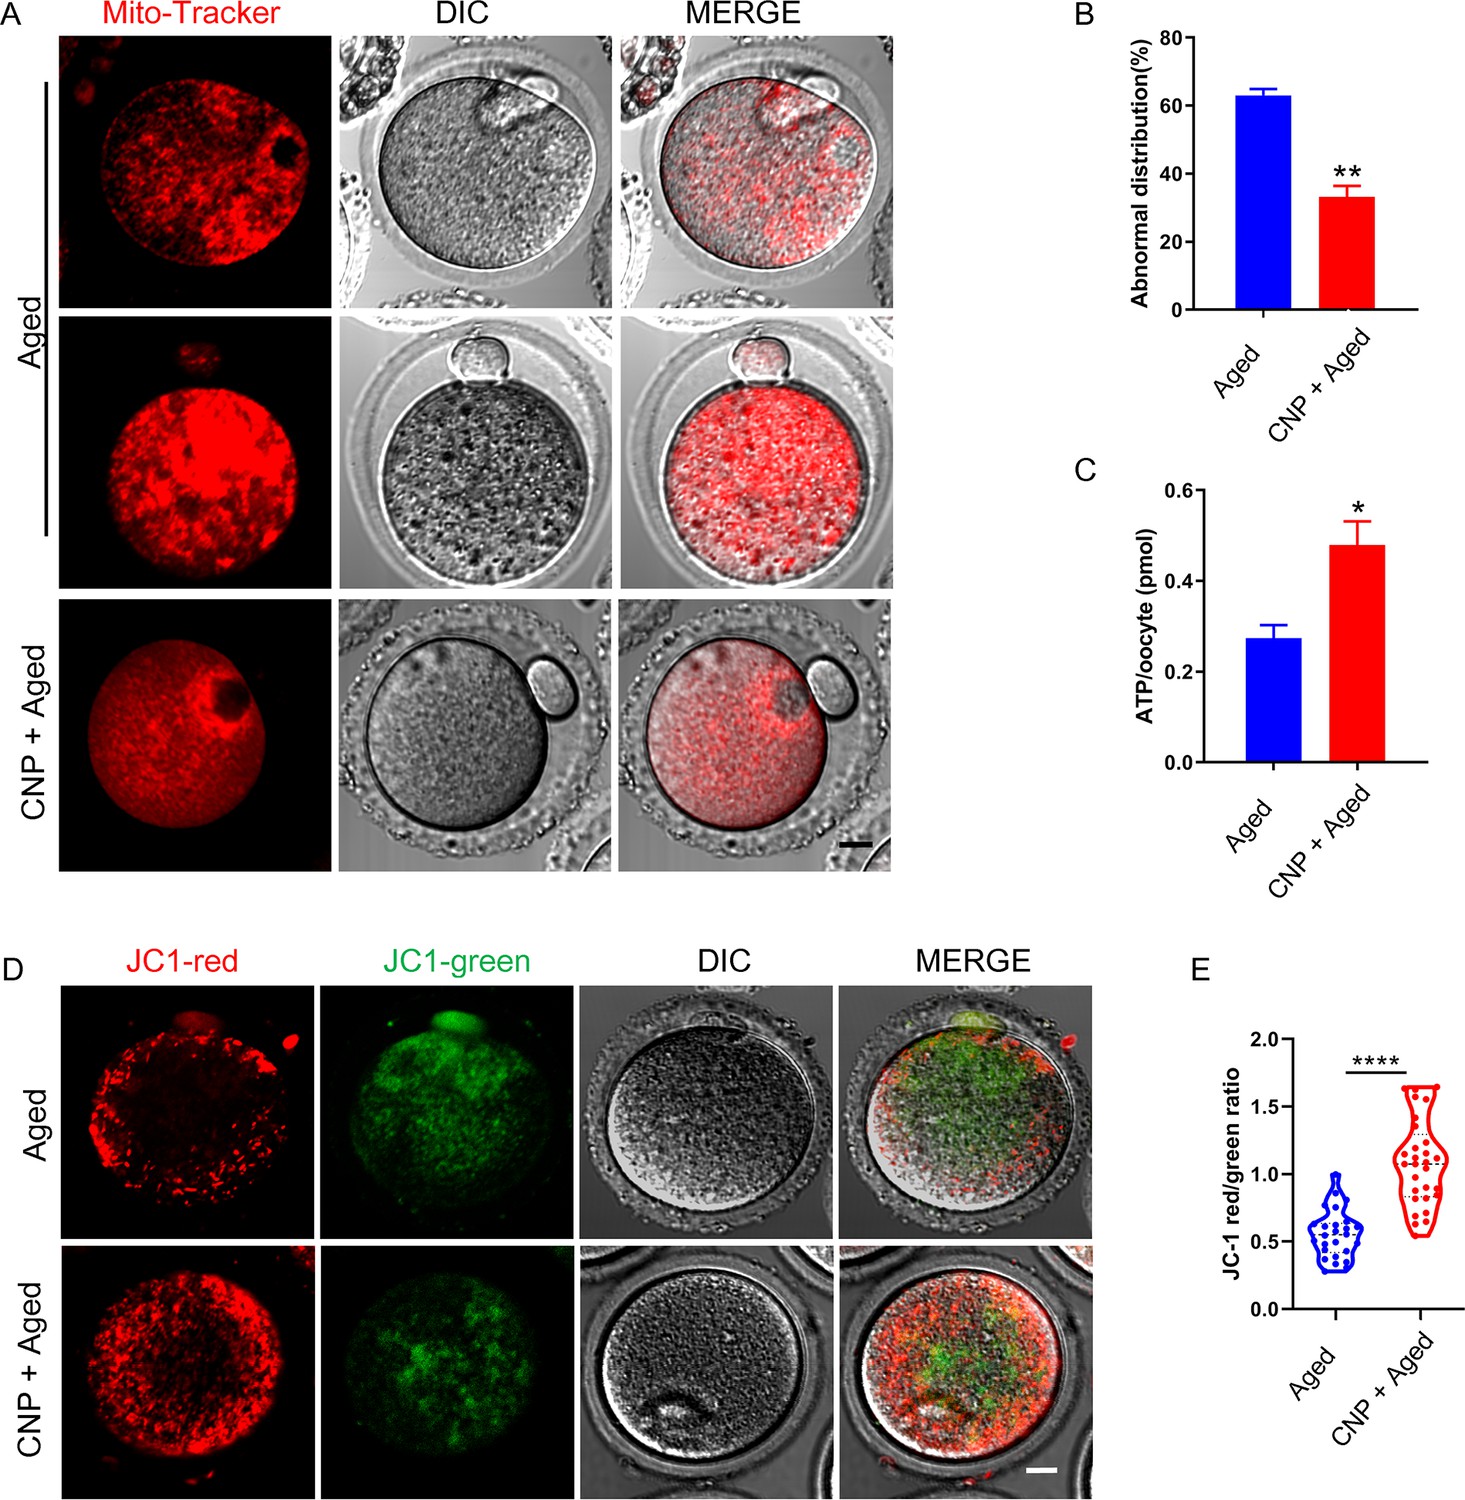
Effects of C-type natriuretic peptide (CNP) on the mitochondrial distribution and function in aged oocytes.
(A) Representative images of mitochondrial distribution in aged control and CNP treatment oocytes stained with MitoTracker Red. Scale bar, 10 μm. (B) The abnormal rate of mitochondrial distribution was recorded in aged control and CNP treatment oocytes. **Significant difference (p<0.01). (C) ATP levels were measured in aged control and CNP treatment oocytes. *Significant difference (p<0.05). (D) Mitochondrial membrane potential (ΔΨm) was detected by JC-1 staining in control and CNP treatment oocytes. Scale bar, 20 μm. (E) The ratio of red to green fluorescence intensity was calculated in aged control and CNP treatment oocytes. ****Significant difference (p<0.0001).
Figure 3 with 1 supplement
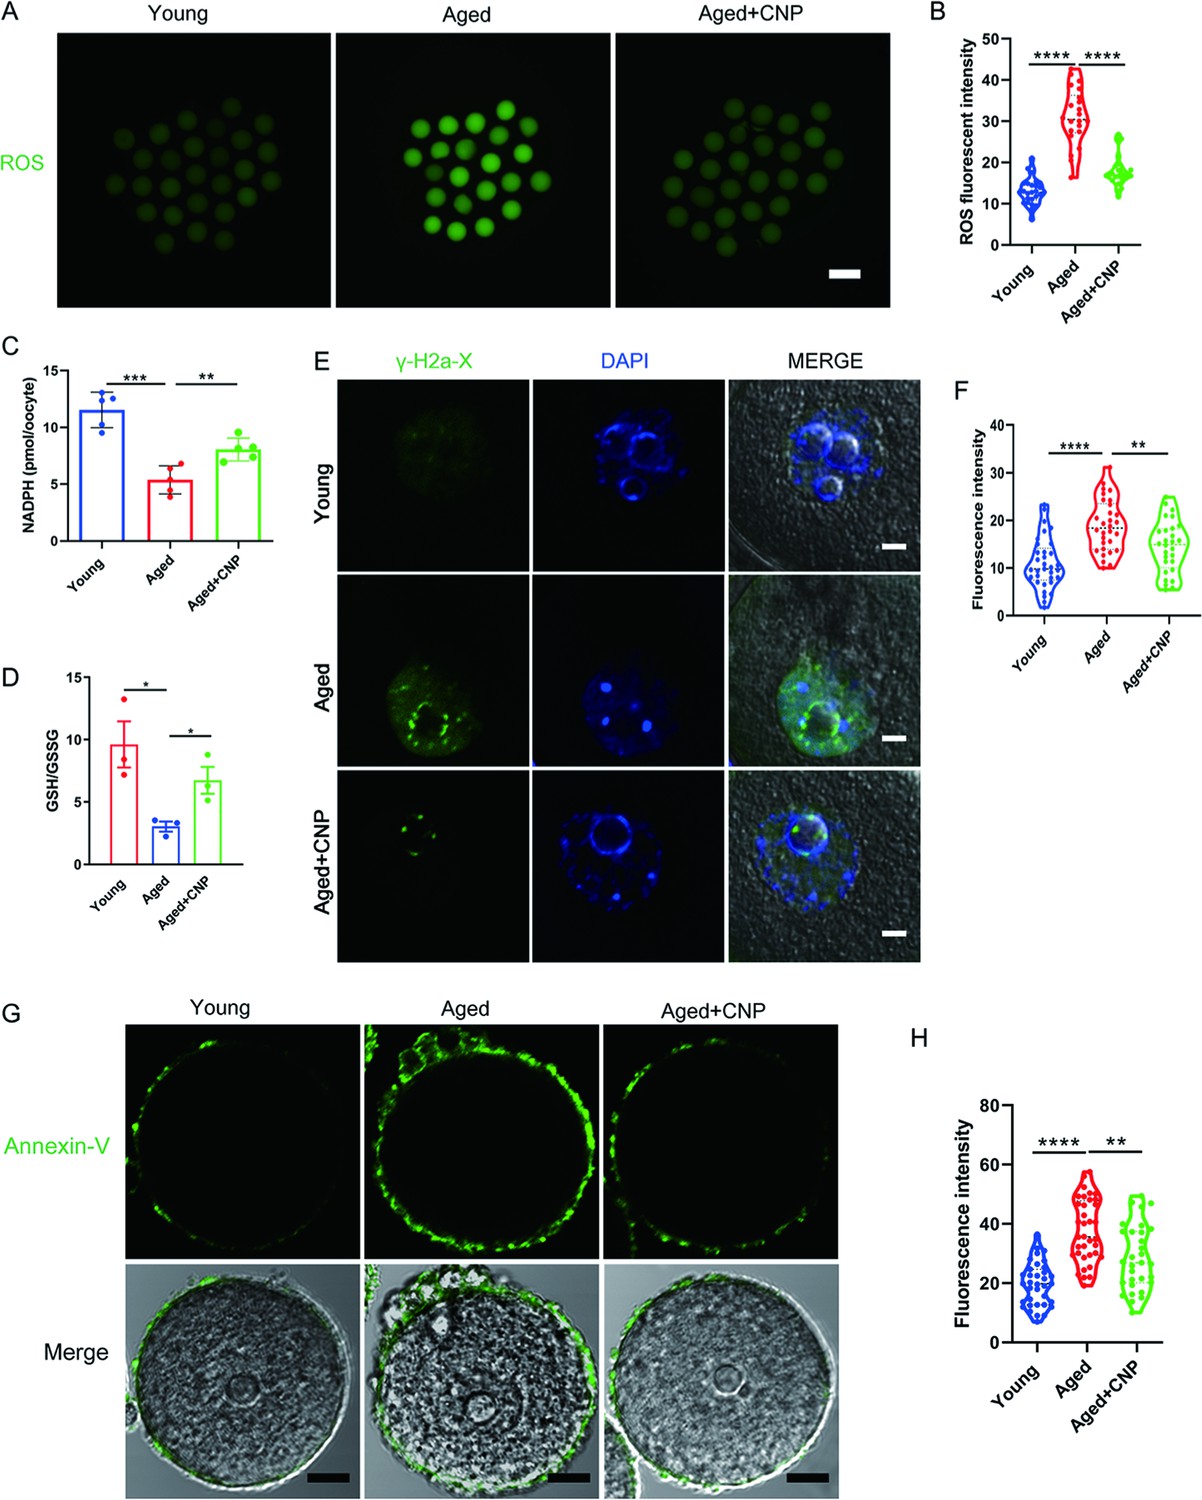
Effects of C-type natriuretic peptide (CNP) on the reactive oxygen species (ROS) content, DNA damage, and apoptosis in aged oocytes.
(A) Representative images of ROS levels detected by dichlorofluorescein (DCFH) staining in the young, aged, and aged + CNP mice oocytes. Scale bar, 100 μm. (B) The fluorescence intensity of ROS signals was measured in the young, aged, and aged + CNP mice oocytes. (C) Oocyte NADPH levels in the young, aged, and aged + CNP mice were measured. (D) The ratio of GSH/GSSG was measured in the young, aged, and aged + CNP mice oocytes. (E) Representative images of DNA damage stained. with the γ-H2AX antibody in young, aged, and aged + CNP oocytes. Scale bar, 10 μm. (F) γ-H2AX fluorescence intensity was counted in young, aged, and aged + CNP oocytes. (G) Representative images of apoptotic status, assessed by Annexin-V staining, in young, aged, and aged + CNP oocytes. Scale bar, 20 μm. (H) The fluorescence intensity of Annexin-V signals was measured in young, aged, and aged + CNP oocytes.
Figure 3—figure supplement 1

Effects of C-type natriuretic peptide (CNP) on the reactive oxygen species (ROS) content in aged oocytes.
(A) Representative images of ROS levels detected by dichlorofluorescein (DCFH) staining in the aged control and CNP treatment oocytes. Scale bar, 100 μm. (B) The fluorescence intensity of ROS signals was measured in the aged control and CNP treatment oocytes. ****Significant difference (p<0.0001).
Figure 4 with 1 supplement
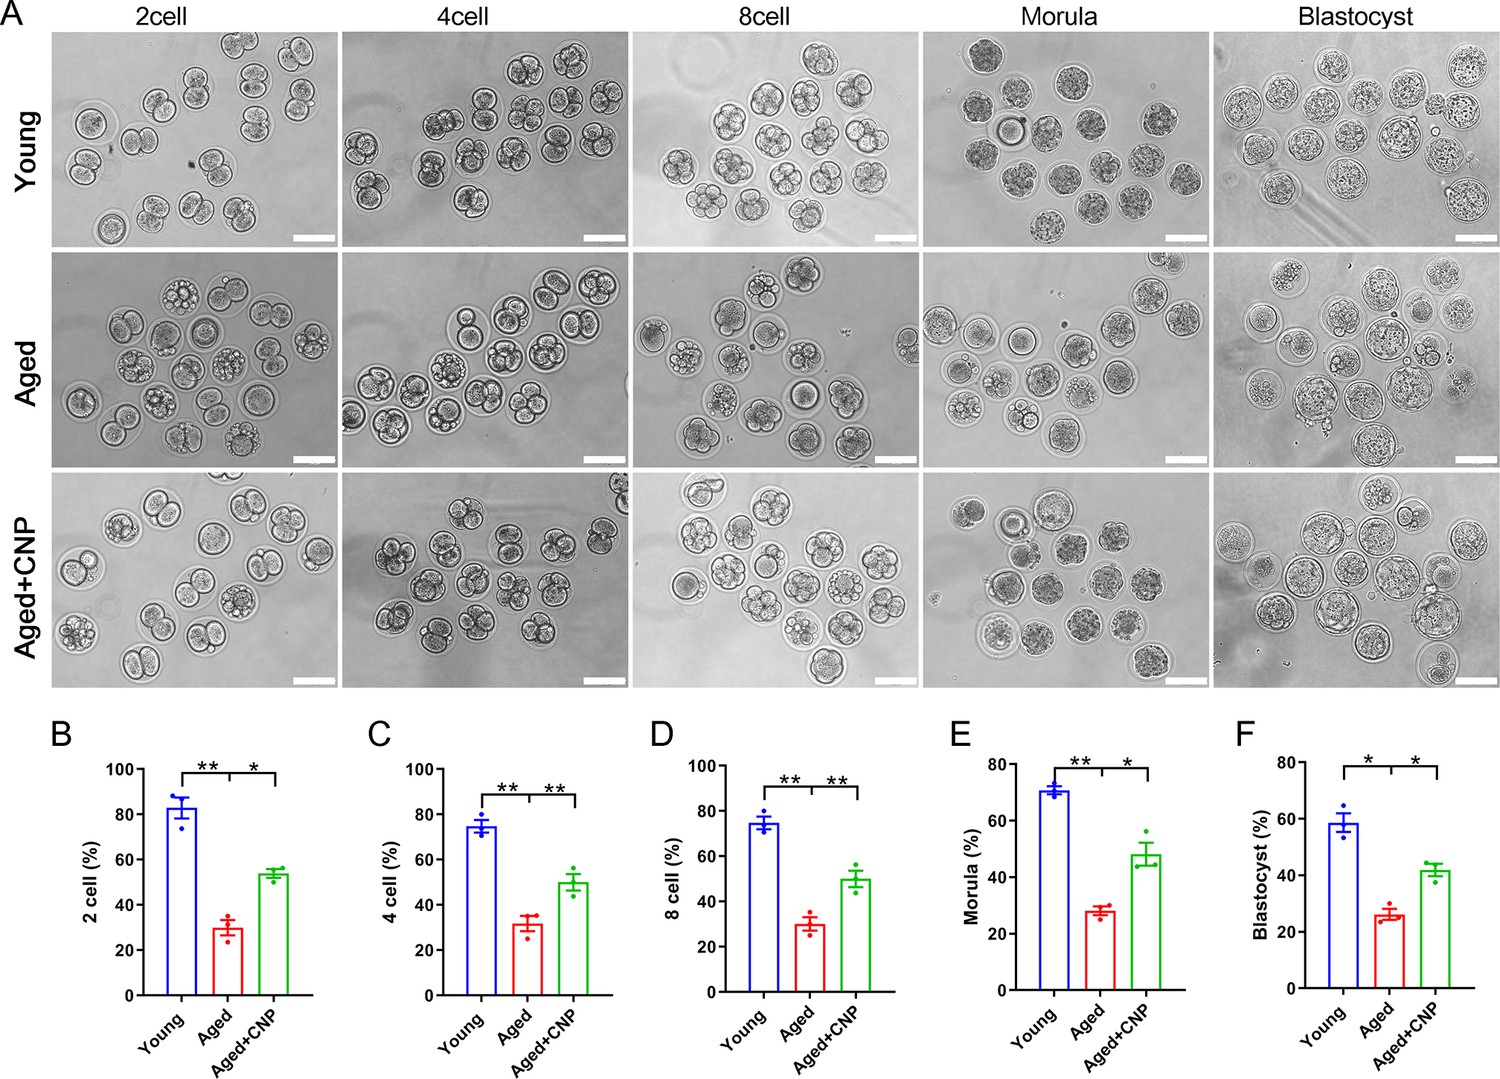
Effects of C-type natriuretic peptide (CNP) on the fertilization ability and embryonic development of aged oocytes.
(A) Representative images of early embryos developed from young, aged, and aged + CNP oocytes in vitro fertilization. Scale bar, 100 μm. (B) The fertilization rate (two-cell embryos rate), (C) four-cell embryos rate, (D) eight-cell embryos rate, (E) morula rate, and (F) blastocyst formation rates were recorded in the young, aged, and aged + CNP groups. Data in (B–F) are presented as mean percentage (mean ± SEM) of at least three independent experiments.
Figure 4—figure supplement 1

Effects of C-type natriuretic peptide (CNP) on the fertilization ability and embryonic development in vitro maturation oocytes.
Data are presented as mean percentage (mean ± SEM) of three independent experiments. *Significant difference (p<0.05), **significant difference (p<0.01).
Figure 5 with 1 supplement
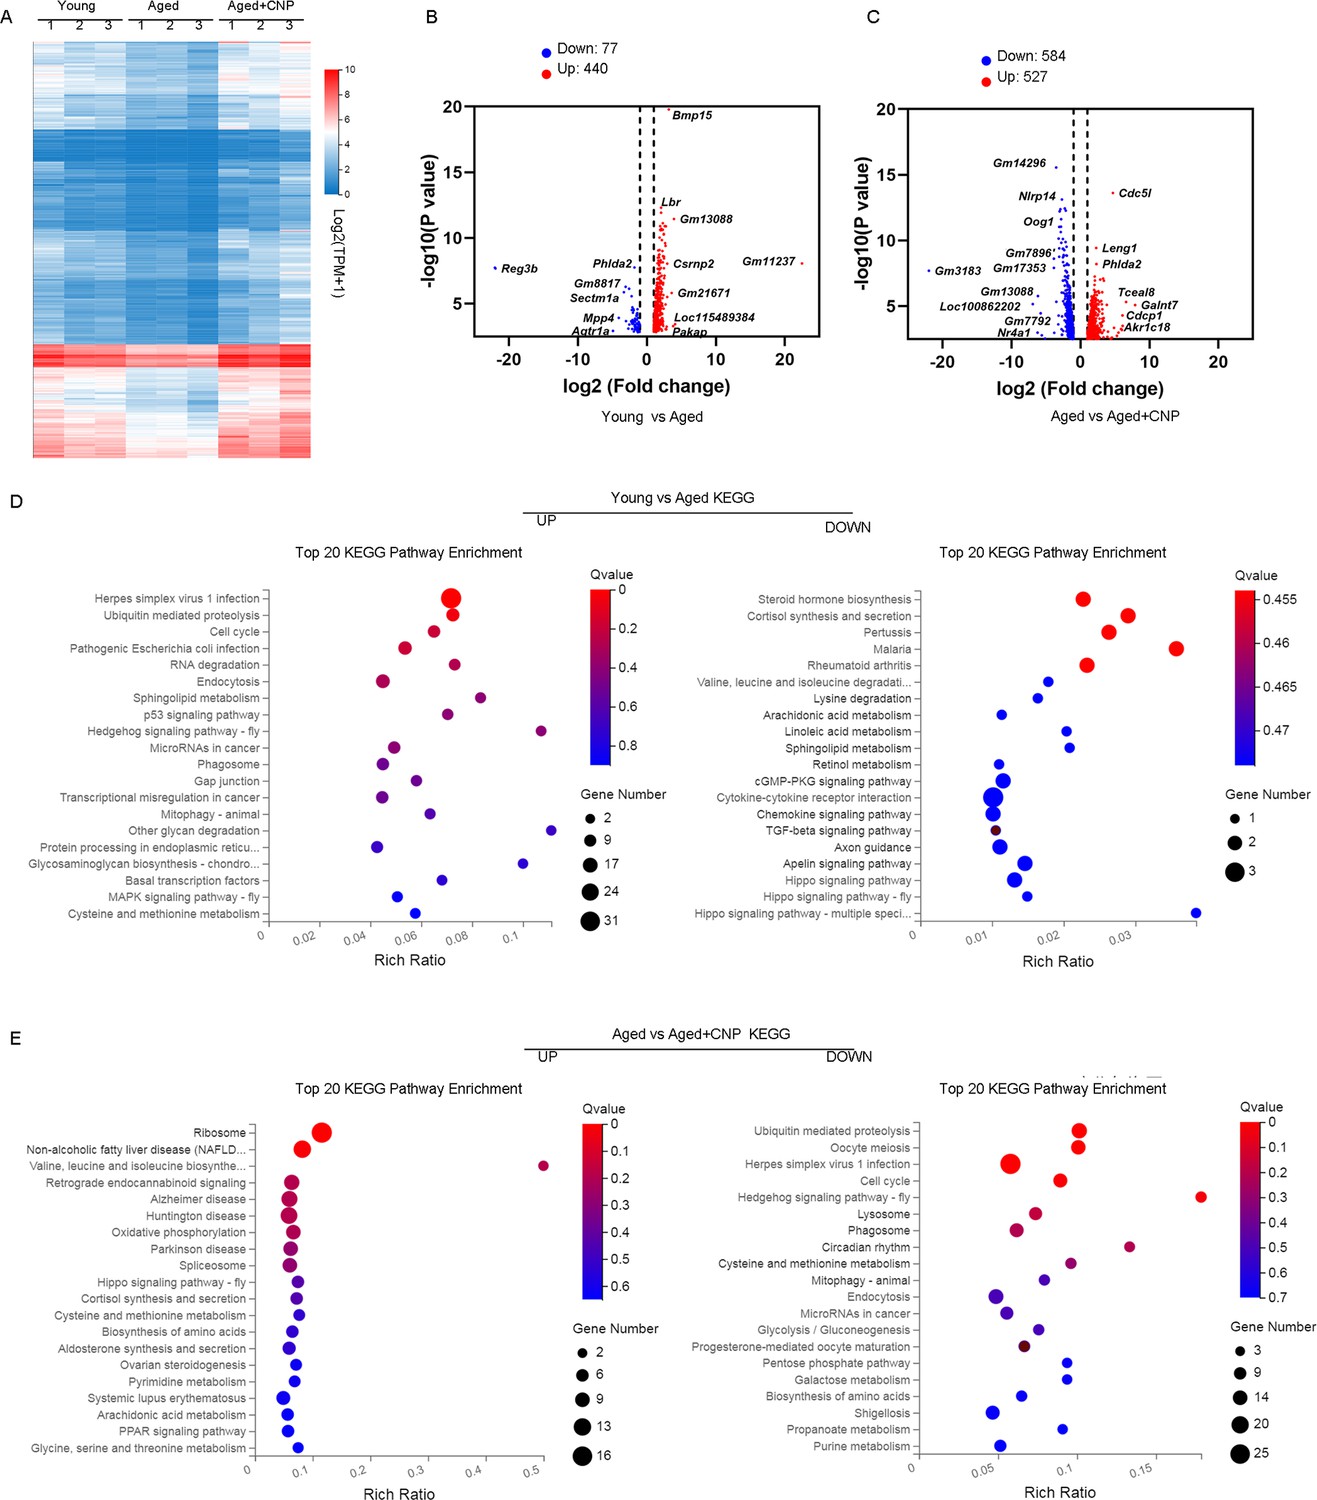
Effect of C-type natriuretic peptide (CNP) supplementation on transcriptome profiling of aged oocytes.
(A) Heatmap illustration displaying gene expression of young, aged, and aged + CNP oocytes. (B) Volcano plot showing differentially expressed genes (DEGs; downregulated, blue; upregulated, red) in young vs. aged oocytes. Some highly DEGs are listed. (C) Volcano plot showing DEGs in aged vs. aged + CNP oocytes. Some highly DEGs are listed. (D) Kyoto Encyclopedia of Genes and Genomes (KEGG) enrichment analysis of upregulated and downregulated DEGs in young vs. aged oocytes. (E) KEGG enrichment analysis of upregulated and downregulated DEGs in aged vs. aged + CNP oocytes.
-
Figure 5—source data 1
RNAseq dataset.
- https://cdn.elifesciences.org/articles/88523/elife-88523-fig5-data1-v1.xlsx
Figure 5—figure supplement 1

The relative expression of several randomly selected genes from each group was verified using quantitative real-time PCR.
(A) RNA-seq results of selected genes in oocyte from young, aged, and aged + C-type natriuretic peptide (CNP) mouse. (B) The relative expression of the randomly selected genes was verified by RT-qPCR in oocyte from young, aged, and aged + CNP mouse.
Figure 6
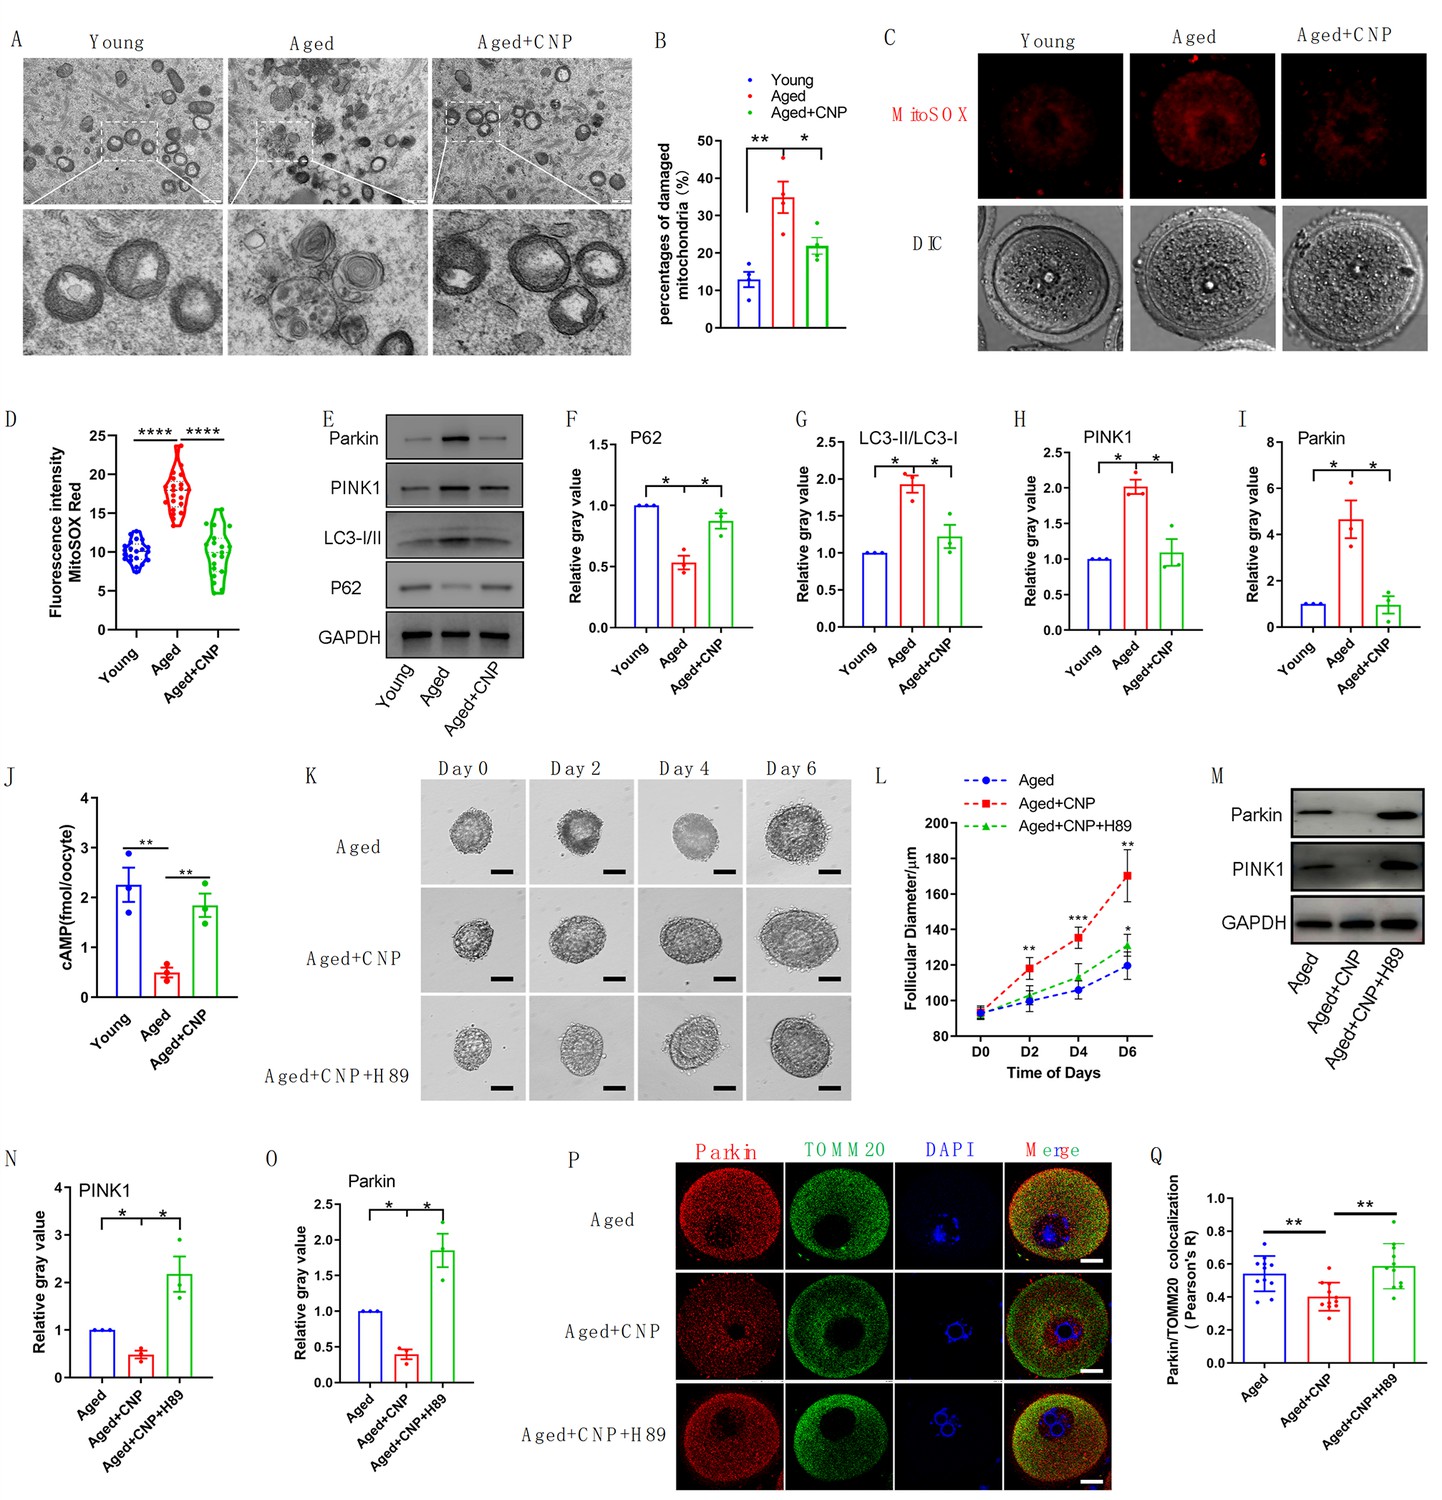
Evaluation of C-type natriuretic peptide (CNP) supplementation on mitophagy activity of aged oocytes.
(A) Representative images of mitochondria morphology and structure in young, aged, and aged + CNP oocytes by TEM. (B) Accumulation of mitochondria damage in young, aged, and aged + CNP oocytes. Under TEM images, percentages of damaged mitochondria per area (500 nm × 500 nm) were shown. At least four visions were chosen and mitochondria were counted by two individuals. (C) Representative images of mitochondria reactive oxygen species (ROS) stained with MitoSOX in young, aged, aged + CNP oocytes. Scale bar, 20 μm. (D) Fluorescence intensity of MitoSOX signals was measured in young aged, aged + CNP oocytes. (E) Western blots of P62(62 kDa), LC3-I/II (14-16 kDa), PINK1(60 kDa), and Parkin(50 kDa) in young, aged, and aged + CNP oocytes. GAPDH (37 kDa) was used as internal control. (F–I) Relative gray value of proteins detected with western blots compared with controls. (J) Oocyte cAMP concentrations were measured in young, aged, and aged + CNP mice. (K) Representative images at day 0, day 2, day 4, and day 6 of cultured preantral follicles with or without CNP or CNP + H89 treatment. Scale bar = 50 μm. (L) Diameters of preantral follicles with or without CNP or CNP + H89 treatment from day 0 to day 6. Six independent culture experiments were performed. (M) Western blots of PINK1 and Parkin in aged, aged + CNP, and aged + CNP + H89-treated oocytes. GAPDH was used as internal control. (N–O) Relative gray value of proteins detected with western blots compared with controls. (P) Double immunofluorescence staining of Parkin and TOMM20. The mitochondria outer membrane protein TOMM20 was performed to reveal the translocation of PRKN proteins on mitochondria. Red, PRKN; green, TOMM20; blue, DNA was labeled with Hoechst 33342. Bar: 20 μm. (Q) The colocalization of Parkin and TOMM20 in oocytes from aged, aged + CNP, and aged + CNP + H89-treated mice was compared. Pearson’s R shows the results of co-location analysis.
Additional files
-
Supplementary file 1
Primers sequences table.
- https://cdn.elifesciences.org/articles/88523/elife-88523-supp1-v1.docx
-
MDAR checklist
- https://cdn.elifesciences.org/articles/88523/elife-88523-mdarchecklist1-v1.docx
Download links
A two-part list of links to download the article, or parts of the article, in various formats.
Downloads (link to download the article as PDF)
Open citations (links to open the citations from this article in various online reference manager services)
Cite this article (links to download the citations from this article in formats compatible with various reference manager tools)
C-type natriuretic peptide improves maternally aged oocytes quality by inhibiting excessive PINK1/Parkin-mediated mitophagy
eLife 12:RP88523.
https://doi.org/10.7554/eLife.88523.3


