The infection-tolerant white-footed deermouse tempers interferon responses to endotoxin in comparison to the mouse and rat
- Department of Microbiology & Molecular Genetics, University of California, Irvine, United States
- Departments of Medicine, Microbiology & Molecular Genetics, and Ecology & Evolutionary Biology, University of California, Irvine, United States
Figures
Figure 1
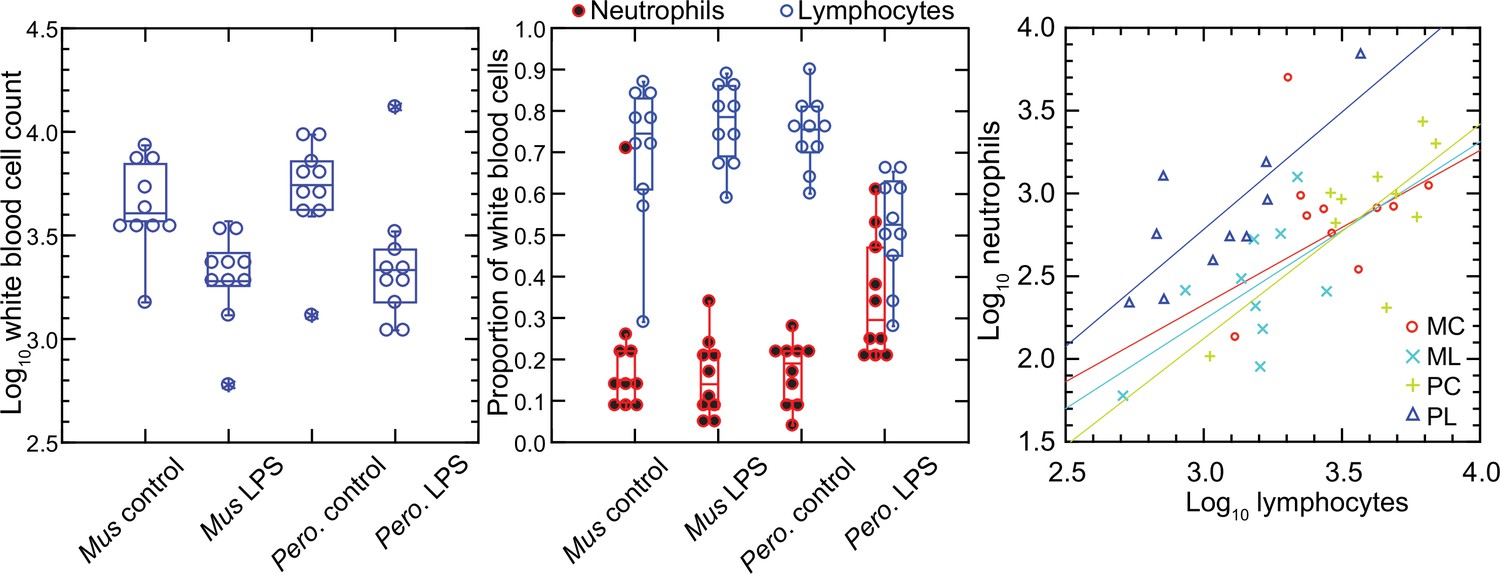
Total white blood cells, neutrophils, and lymphocytes of Mus musculus (M) and Peromyscus leucopus (P) with or without (control; C) treatment with 10 µg lipopolysaccharide (LPS; L) per g body mass 4 hr previous.
The data are from Table 1. The box plots of left and center panels show values of individual animals and compiled median, quartiles, and extreme values. The linear regressions of the right panel are color-coded according to the species and treatment designations. The outlier value for a M. musculus control (MM17) was excluded from the linear regression for that group.
Figure 2
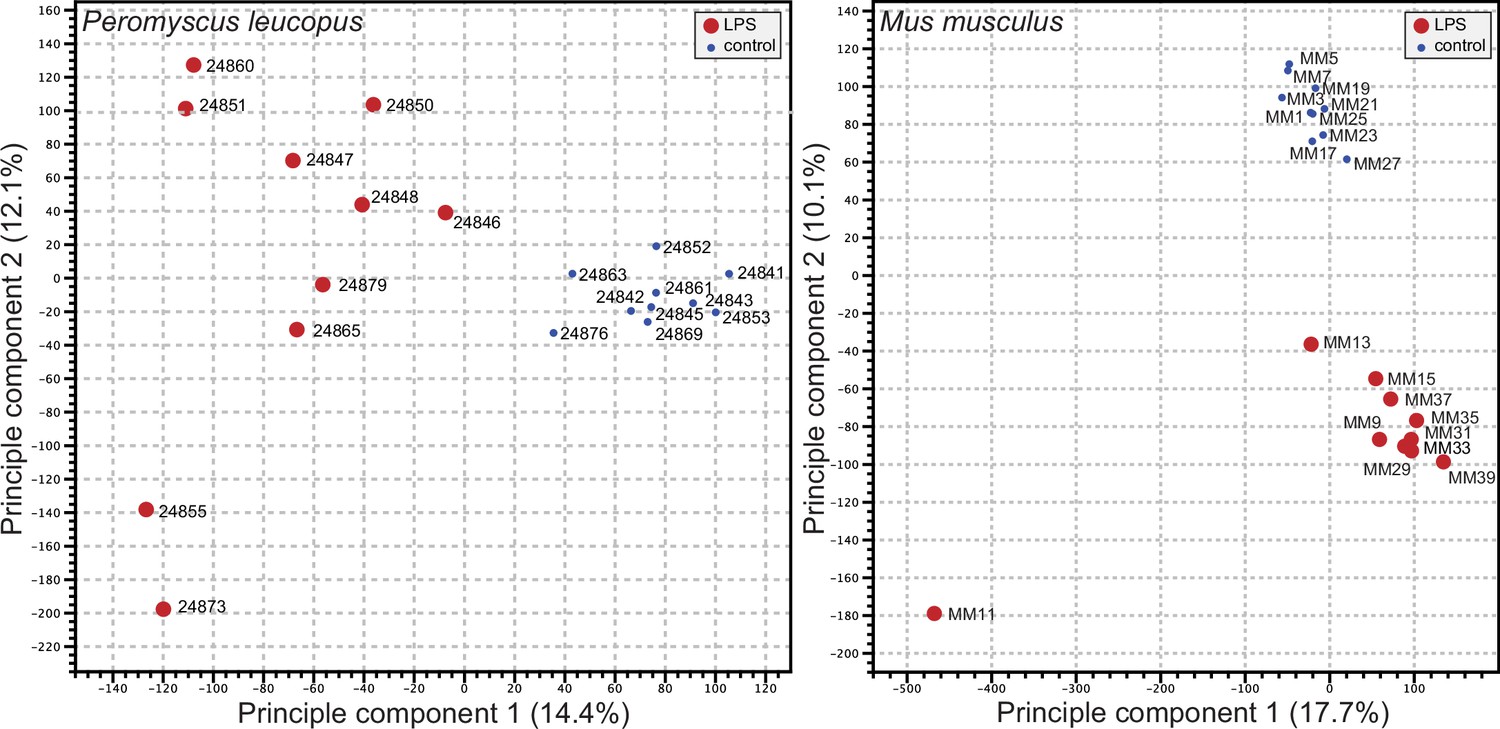
Principle component analysis of genome-wide RNA-seq data of Peromyscus leucopus or Mus musculus with or without (blue dot) treatment with LPS 4 hr previous (Figure 2—source data 1 and Figure 2—source data 2).
The individual animals listed in Table 1 are indicated on the graphs. The insets indicate the size and color of the symbol for the experimental condition (LPS-treated or control).
-
Figure 2—source data 1
Genome-wide RNA-seq data as TPM values for Peromyscus leucopus treated with lipopolysaccharide or saline alone.
- https://cdn.elifesciences.org/articles/90135/elife-90135-fig2-data1-v1.xlsx
-
Figure 2—source data 2
Genome-wide RNA-seq data as TPM values for Mus musculus treated with lipopolysaccharide or saline alone.
- https://cdn.elifesciences.org/articles/90135/elife-90135-fig2-data2-v1.xlsx
Figure 3
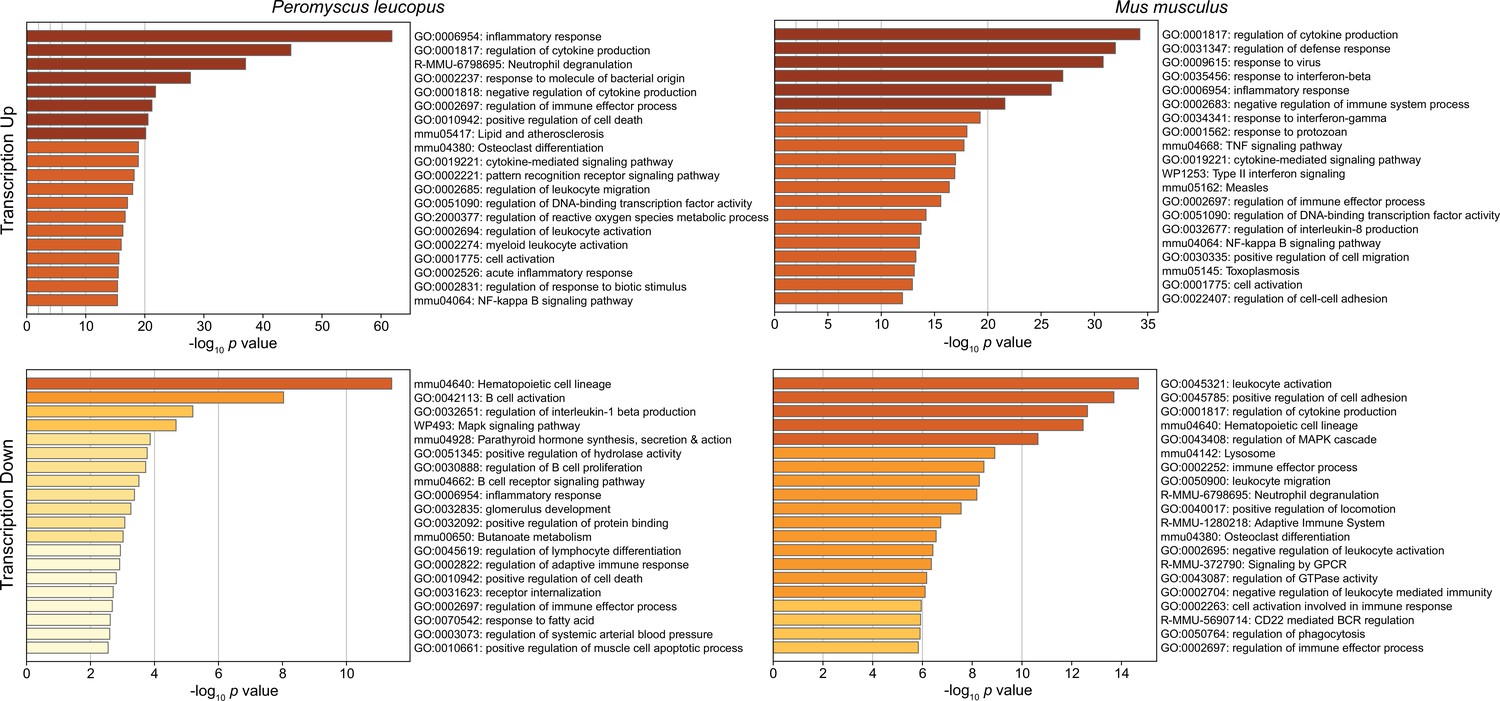
Gene Ontology (GO) term clusters associated with up-regulated genes (upper panels) and down-regulated genes (lower panels) of Peromyscus leucopus (left panels) and Mus musculus (right panels) treated with LPS in comparison with untreated controls of each species (Figure 3—source data 1 and Figure 3—source data 2).
The scale for the x-axes for the panels was determined by the highest -log10 p values in each of the four sets. The horizontal bar color, which ranges from white to dark brown through shades of yellow through orange in between, is a schematic representation of the -log10 p values.
-
Figure 3—source data 1
Differentially expressed gene analysis for Peromyscus leucopus.
- https://cdn.elifesciences.org/articles/90135/elife-90135-fig3-data1-v1.xlsx
-
Figure 3—source data 2
Differentially expressed gene analysis for Mus musculus.
- https://cdn.elifesciences.org/articles/90135/elife-90135-fig3-data2-v1.xlsx
-
Figure 3—source data 3
Comparison of differentially-expressed genes in genome-wide RNA-seq of blood of Peromyscus leucopus and Mus musculus with and without treatment with lipopolysaccharide.
- https://cdn.elifesciences.org/articles/90135/elife-90135-fig3-data3-v1.xlsx
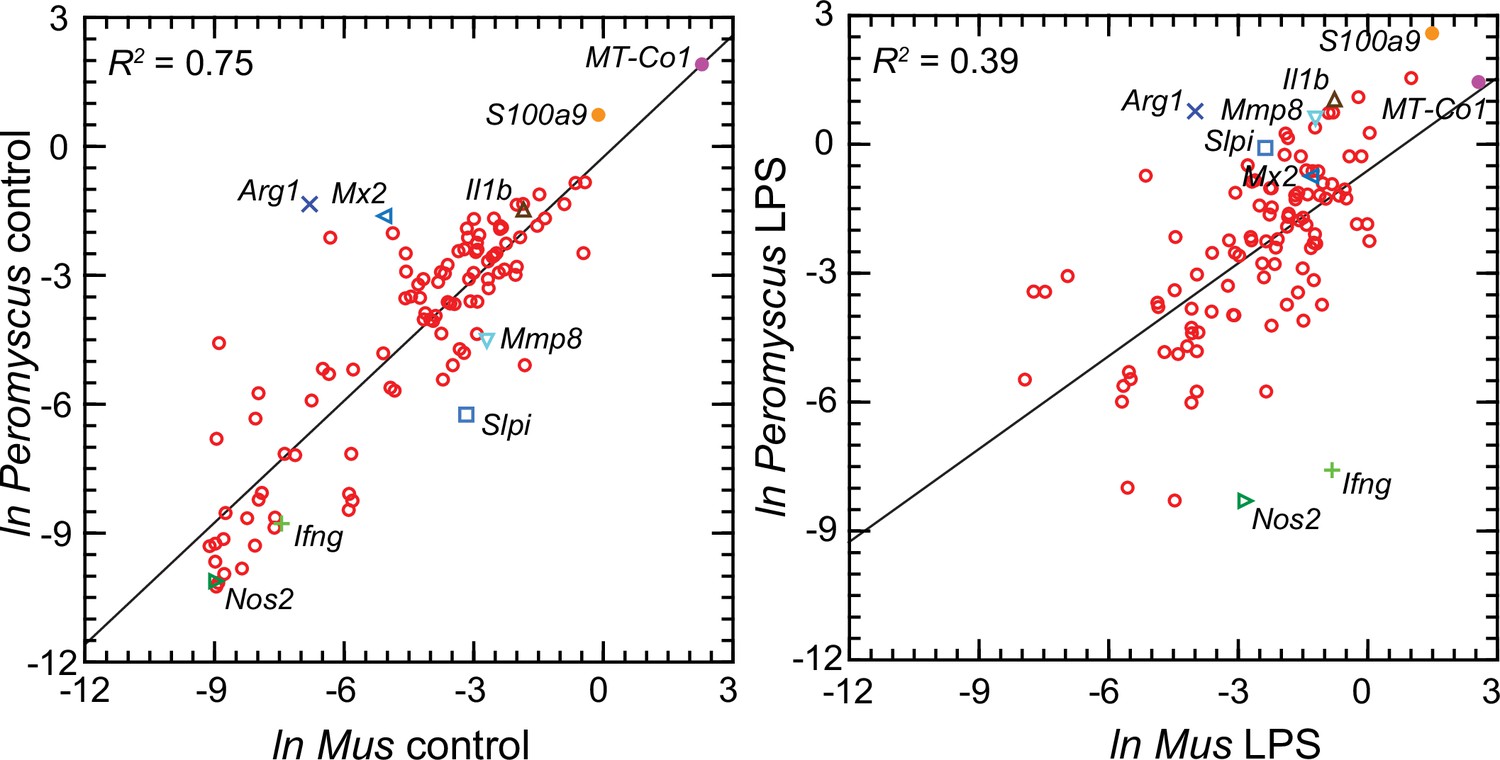
Figure 4
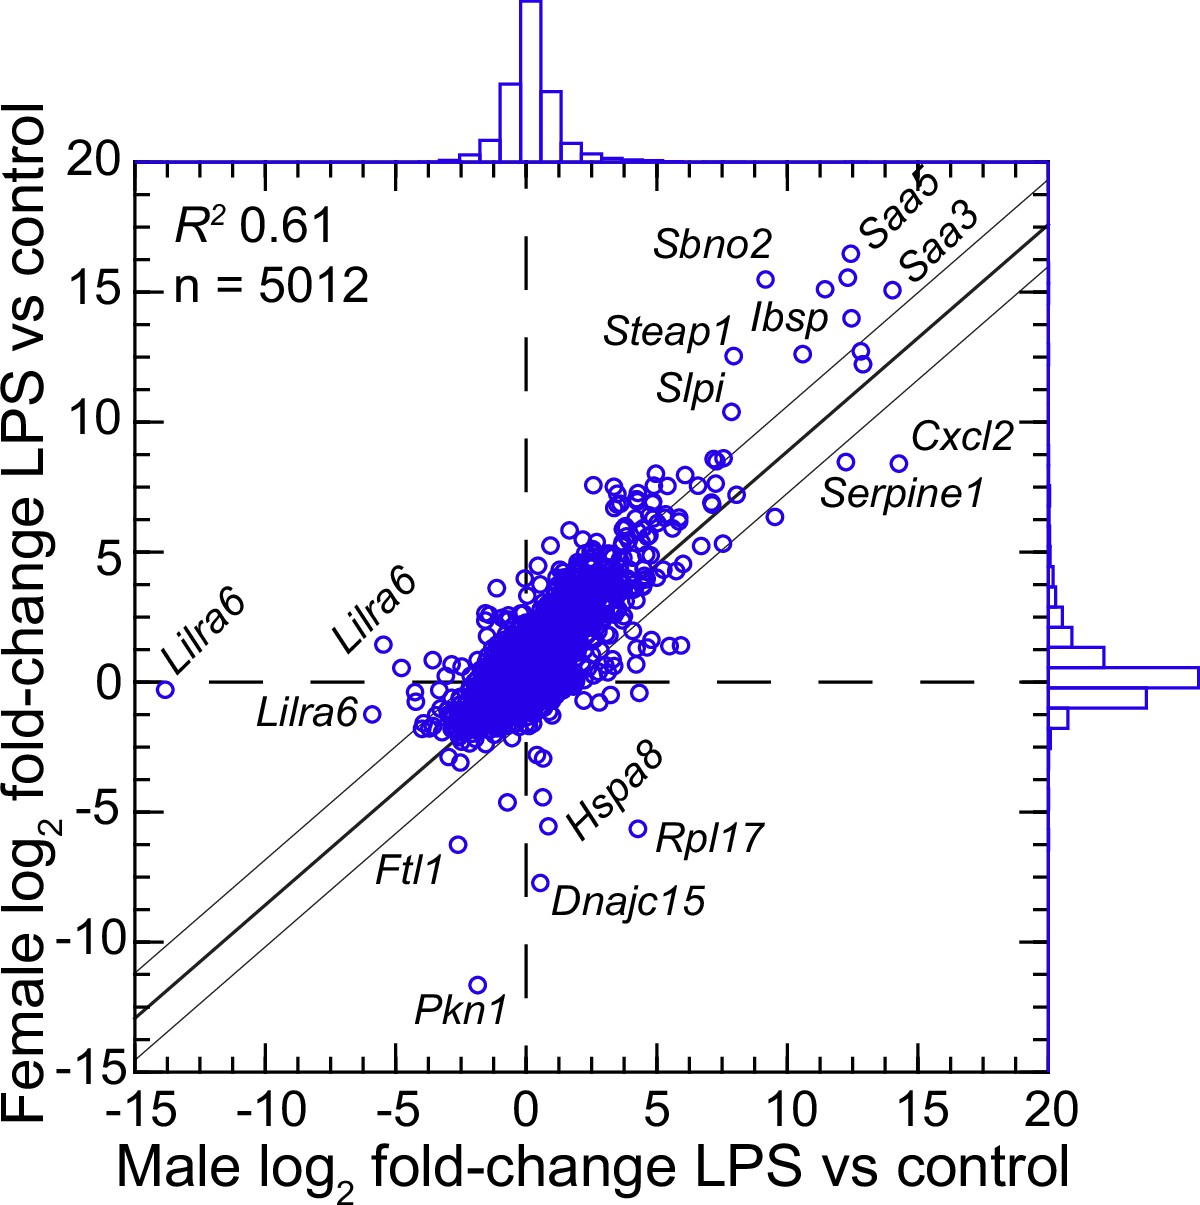
Scatter plot with linear regression of pairs of log2-transformed mean fold-changes between LPS-treated and control P.leucopus by male and female sex (Figure 4—source data 1 and Figure 4—source data 2).
The coefficient of determination (R2), the 95% upper and lower prediction limits for the regression line, and distributions of the values on the x- and y-axes are shown. Selected genes for which their x-y coordinates fall outside the limits of prediction are labeled. Cxcl2, Ibsp, Saa3, Saa5, Sbno2, Serpine1, Slpi, and Steap1 were noted as up-regulated DEGs for the groups with both sexes (Figure 3—source data 3).
-
Figure 4—source data 1
Differentially expressed gene analysis by genome-wide RNA-seq of 20 female and 20 male P. leucopus treated with lipopolysaccharide or saline.
- https://cdn.elifesciences.org/articles/90135/elife-90135-fig4-data1-v1.xlsx
-
Figure 4—source data 2
Comparison of female and male P. leucopus for mean fold-changes of LPS-treated to control animals for each of 5012 reference transcripts with a maximum TPM ≥10.
- https://cdn.elifesciences.org/articles/90135/elife-90135-fig4-data2-v1.xlsx
Figure 5
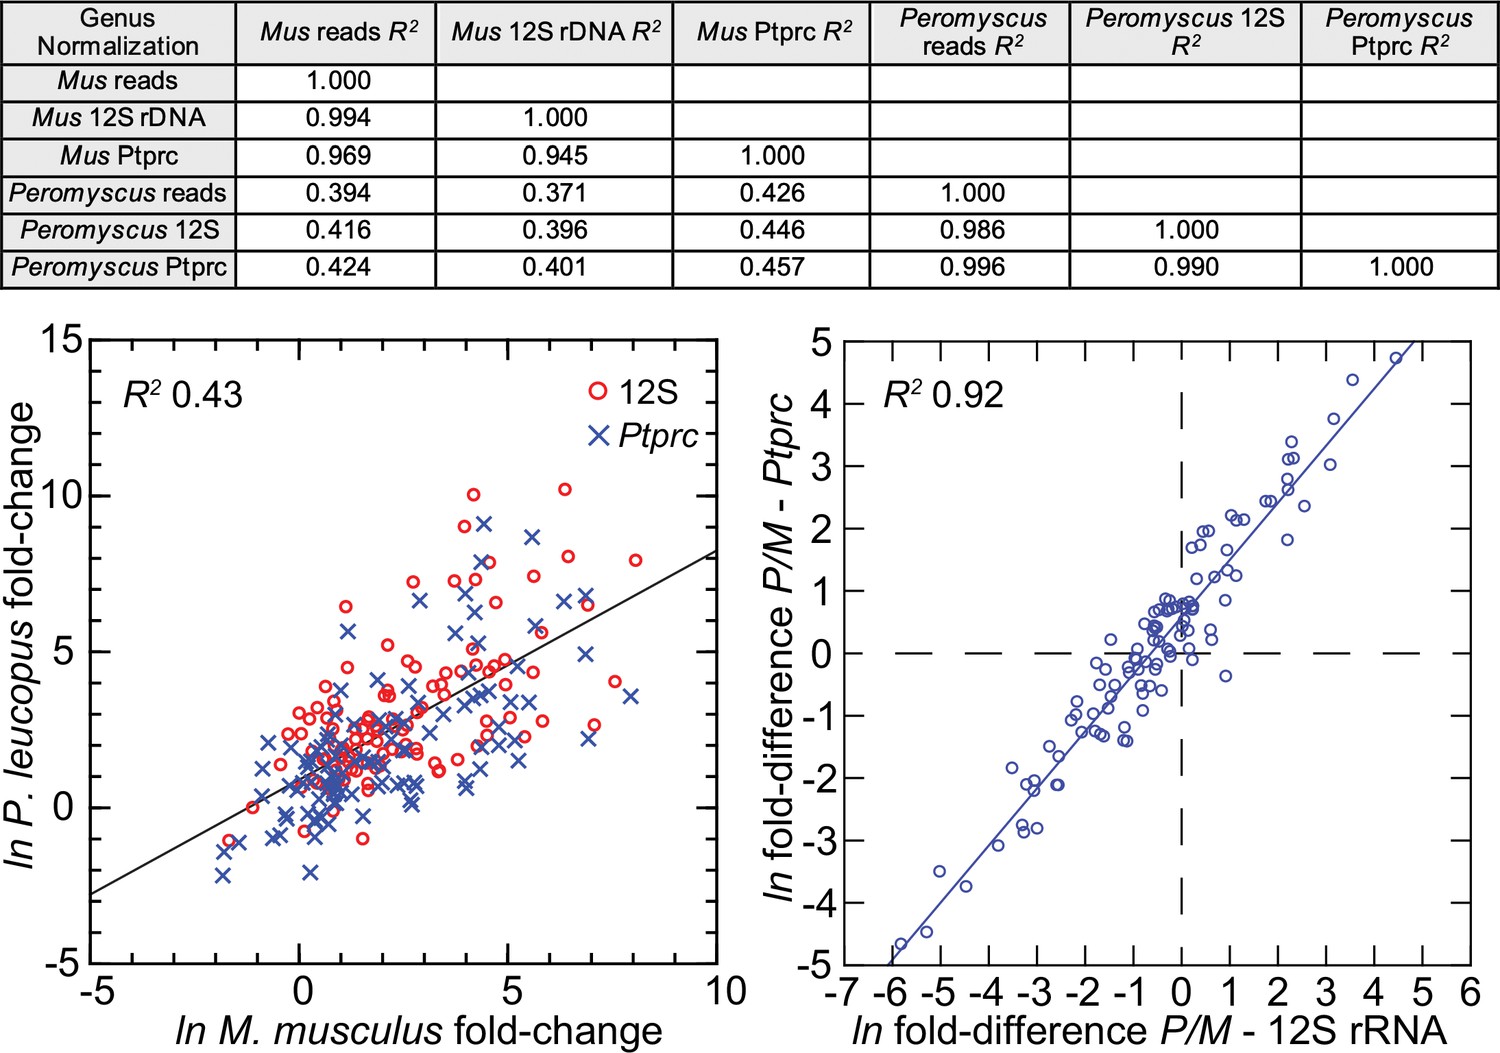
Comparison of three different methods for normalization for cross-species targeted RNA-seq.
The normalization options were total reads for the same sample, unique reads for the mitochondrial 12 S rDNA, and unique reads for the Ptprc transcript encoding CD45. The 109 targets and all values for the analysis are in Figure 5—source data 1. For the upper panel, the coefficients of determination (R2) were calculated for each of the pairs and for within each species and across species (columns C-G of Source data 1). The results of this analysis are in the matrix of the upper panel. The lower left panel compares in the same scatterplot the LPS to control fold-changes by either the 12 S or Ptprc normalization method, and the Peromyscus leucopus (P) result regressed on the Mus musculus (M) result for the same gene. The lower right panel of the figure is a scatterplot with linear regression and the R2 value (columns I and J of Source data 1).
-
Figure 5—source data 1
Comparison of different methods for normalization (total reads, 12S rRNA or Ptprc) for cross-species targeted RNA-seq.
- https://cdn.elifesciences.org/articles/90135/elife-90135-fig5-data1-v1.xlsx
Figure 6 with 1 supplement
Scatter plots with linear regression of pairs of log-transformed (ln) normalized RNA-seq reads for selected coding sequences for control Peromyscus leucopus and Mus musculus (left panel) and LPS-treated P. leucopus and M. musculus (right panel) (Figure 6—source data 1).
The R2 values and selected genes (each with a different symbol) are indicated in each graph. Box plots for a selected 54 of these targets organized by functional characteristics are provided in Figure 6—figure supplement 1.
-
Figure 6—source data 1
Natural logarithms of ratios of transcript reads of selected genes to Ptprc (Cd45) transcript reads in blood of P. leucopus or M. musculus with or without treatment with LPS by individual animal.
- https://cdn.elifesciences.org/articles/90135/elife-90135-fig6-data1-v1.xlsx
Figure 6—figure supplement 1
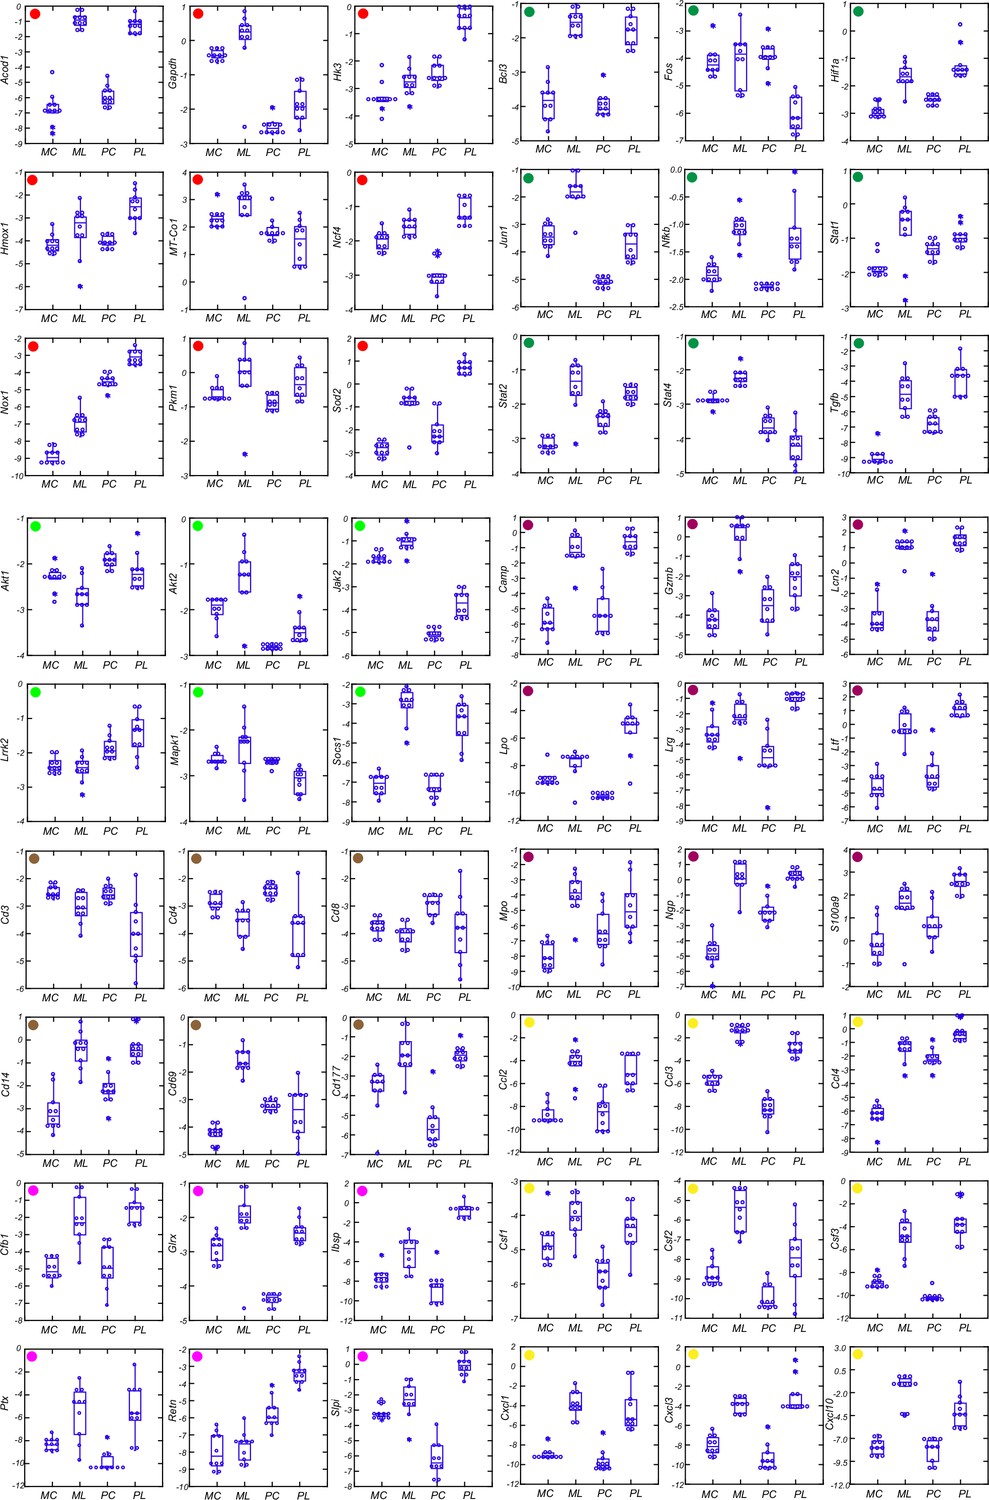
Box plots of log-transformed normalized transcripts in whole blood for 54 genes of Peromyscus leucopus (P) or Mus musculus (M) that have been treated with LPS (L) or were saline-alone controls (C).
There were 10 animals in each group and equally divided between females and males. Blood was obtained 4 hr after injection of LPS or saline alone, as described in Methods. Unique reads were normalized for reads of Ptprc for the same species for a given sample, and natural logarithm (ln) of the ratio calculated. The genes are categorized as to a major function: red, metabolism; light green, kinases and related enzymes; brown, leukocyte markers; light purple, proteins in plasma; dark green, transcription factors; dark purple, neutrophil-associated proteins; yellow, cytokines and chemokines.
Figure 7
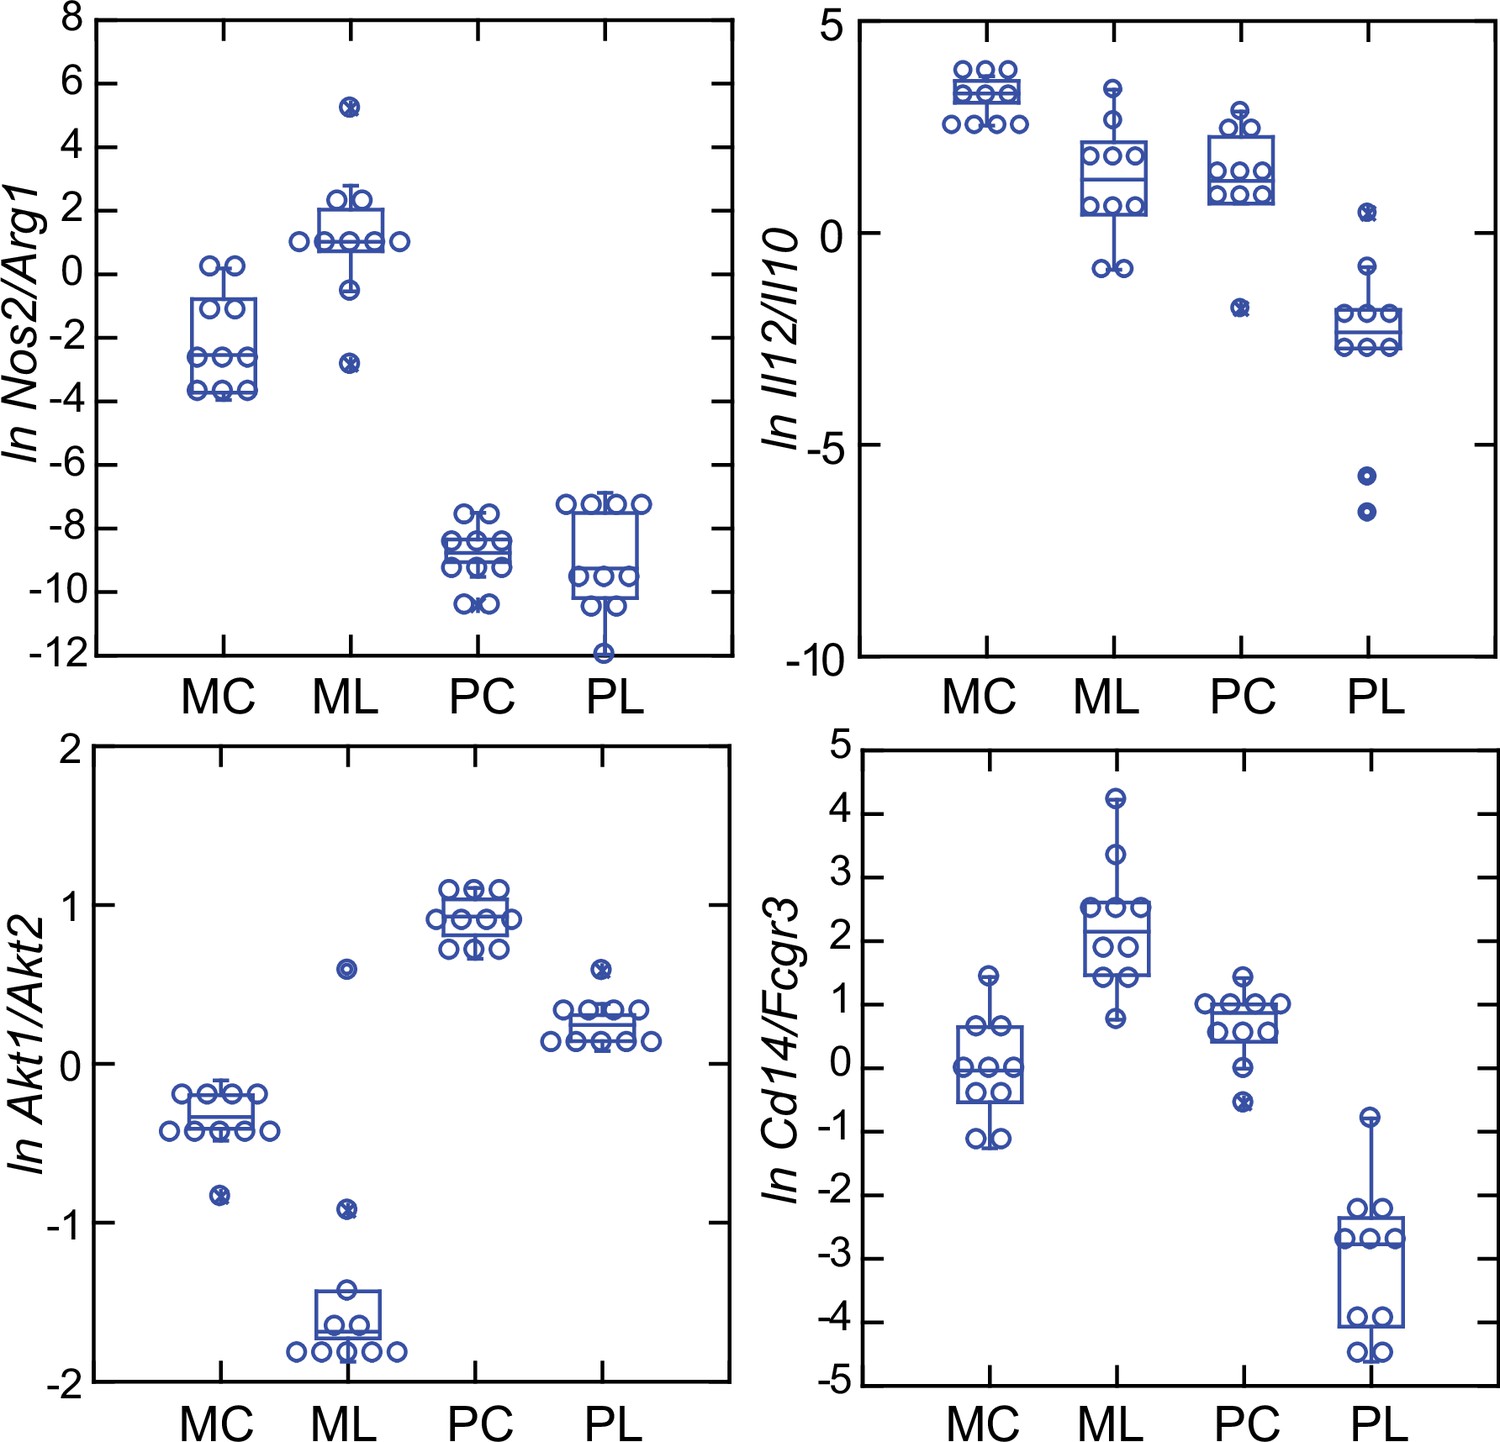
Box plots of natural log (ln)-transformed ratios of four pairs of gene transcripts from targeted RNA-seq analysis of blood of Peromyscus leucopus (P) or Mus musculus (M) with (L) or without (C) treatment with LPS.
The values are from Source data 1. Upper left, Nos2/Arg1; upper right, Il12/Il10; lower left, Akt1/Akt2; lower right, Cd14/Fcgr3.
Figure 8
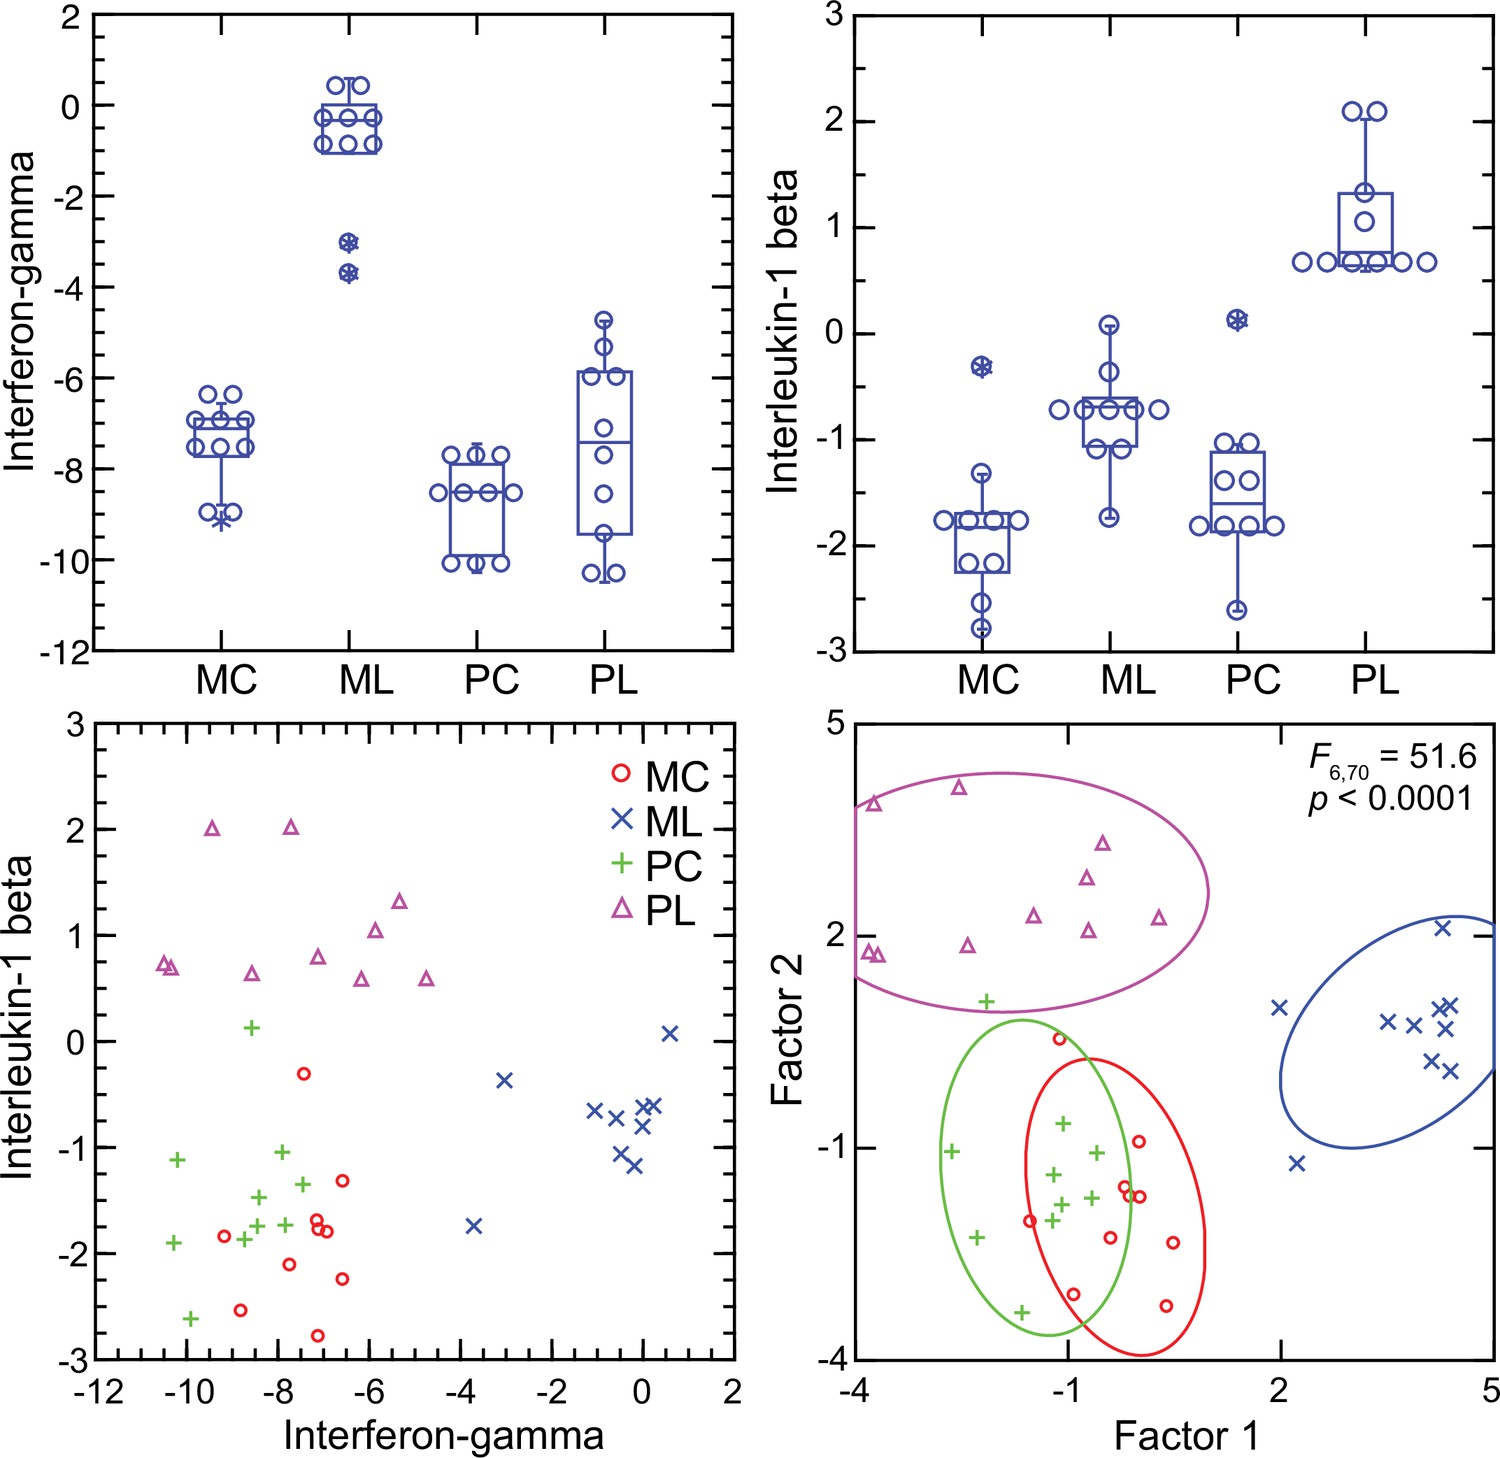
Transcripts of genes for interferon-gamma and interleukin-1 beta by targeted RNA-seq of the blood of Peromyscus leucopus (P) or Mus musculus (M) with (L) or without (C) treatment with LPS.
The top panels are box plots of the individual values. The lower left panel is a scatter plot of Il1b on Ifng transcription values. The lower right panel is a Discriminant Analysis of these pairs of values where Factor 1 corresponds to Ifng, and Factor 2 corresponds to Il1b. Values for analysis are from Source data 1.
Figure 9
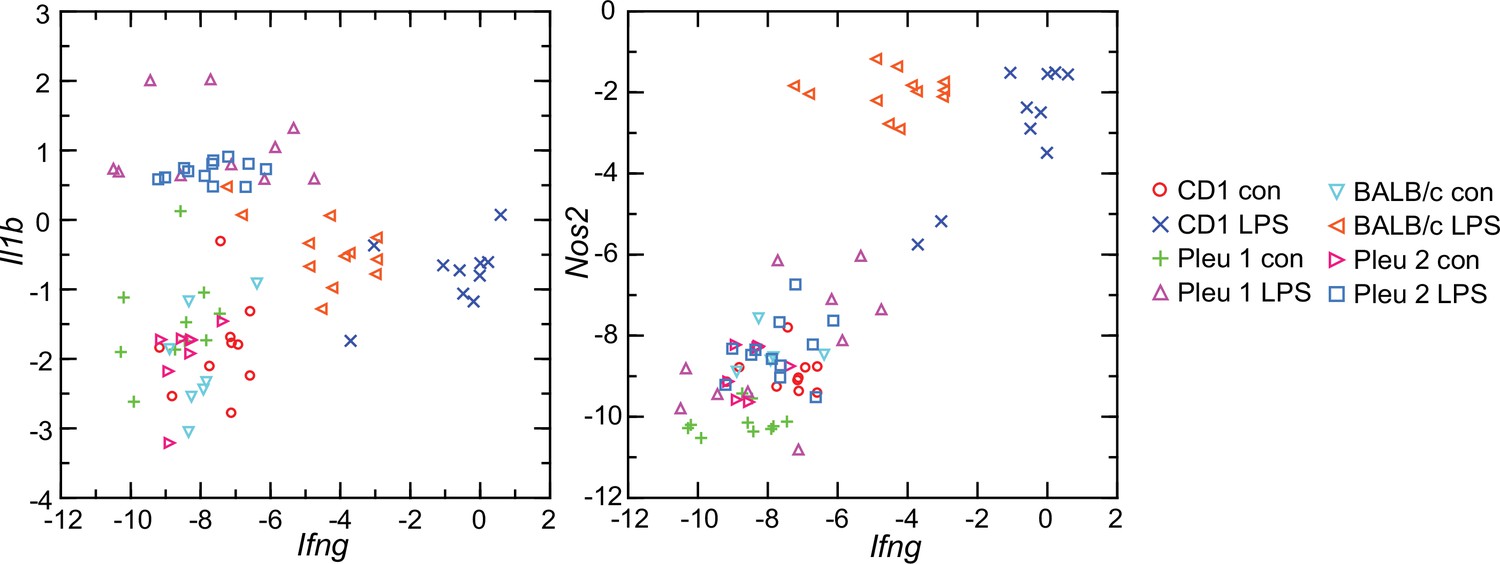
Scatter plots of log-transformed normalized transcripts of genes for interleukin-1 beta (Il1b; left panel) or nitric oxide synthase 2 (Nos2; right panel) on interferon-gamma (Ifng) of blood of Peromyscus leucopus (Pleu) or Mus musculus (outbred CD-1 and inbred BALB/c) with (LPS) or without (con) treatment with lipopolysaccharide 4 hr previously.
The data are from the present study (Pleu 2 and CD-1) (Source data 1) and from the study of Balderrama-Gutierrez et al., 2021 (Pleu 1 and BALB/c) (Figure 9—source data 1).
-
Figure 9—source data 1
Targeted RNA-seq of blood with normalization by Ptprc of LPS-treated and control P. leucopus and BALB/c M. musculus reported in Balderrama-Gutierrez et al.
- https://cdn.elifesciences.org/articles/90135/elife-90135-fig9-data1-v1.xlsx
Figure 10 with 1 supplement
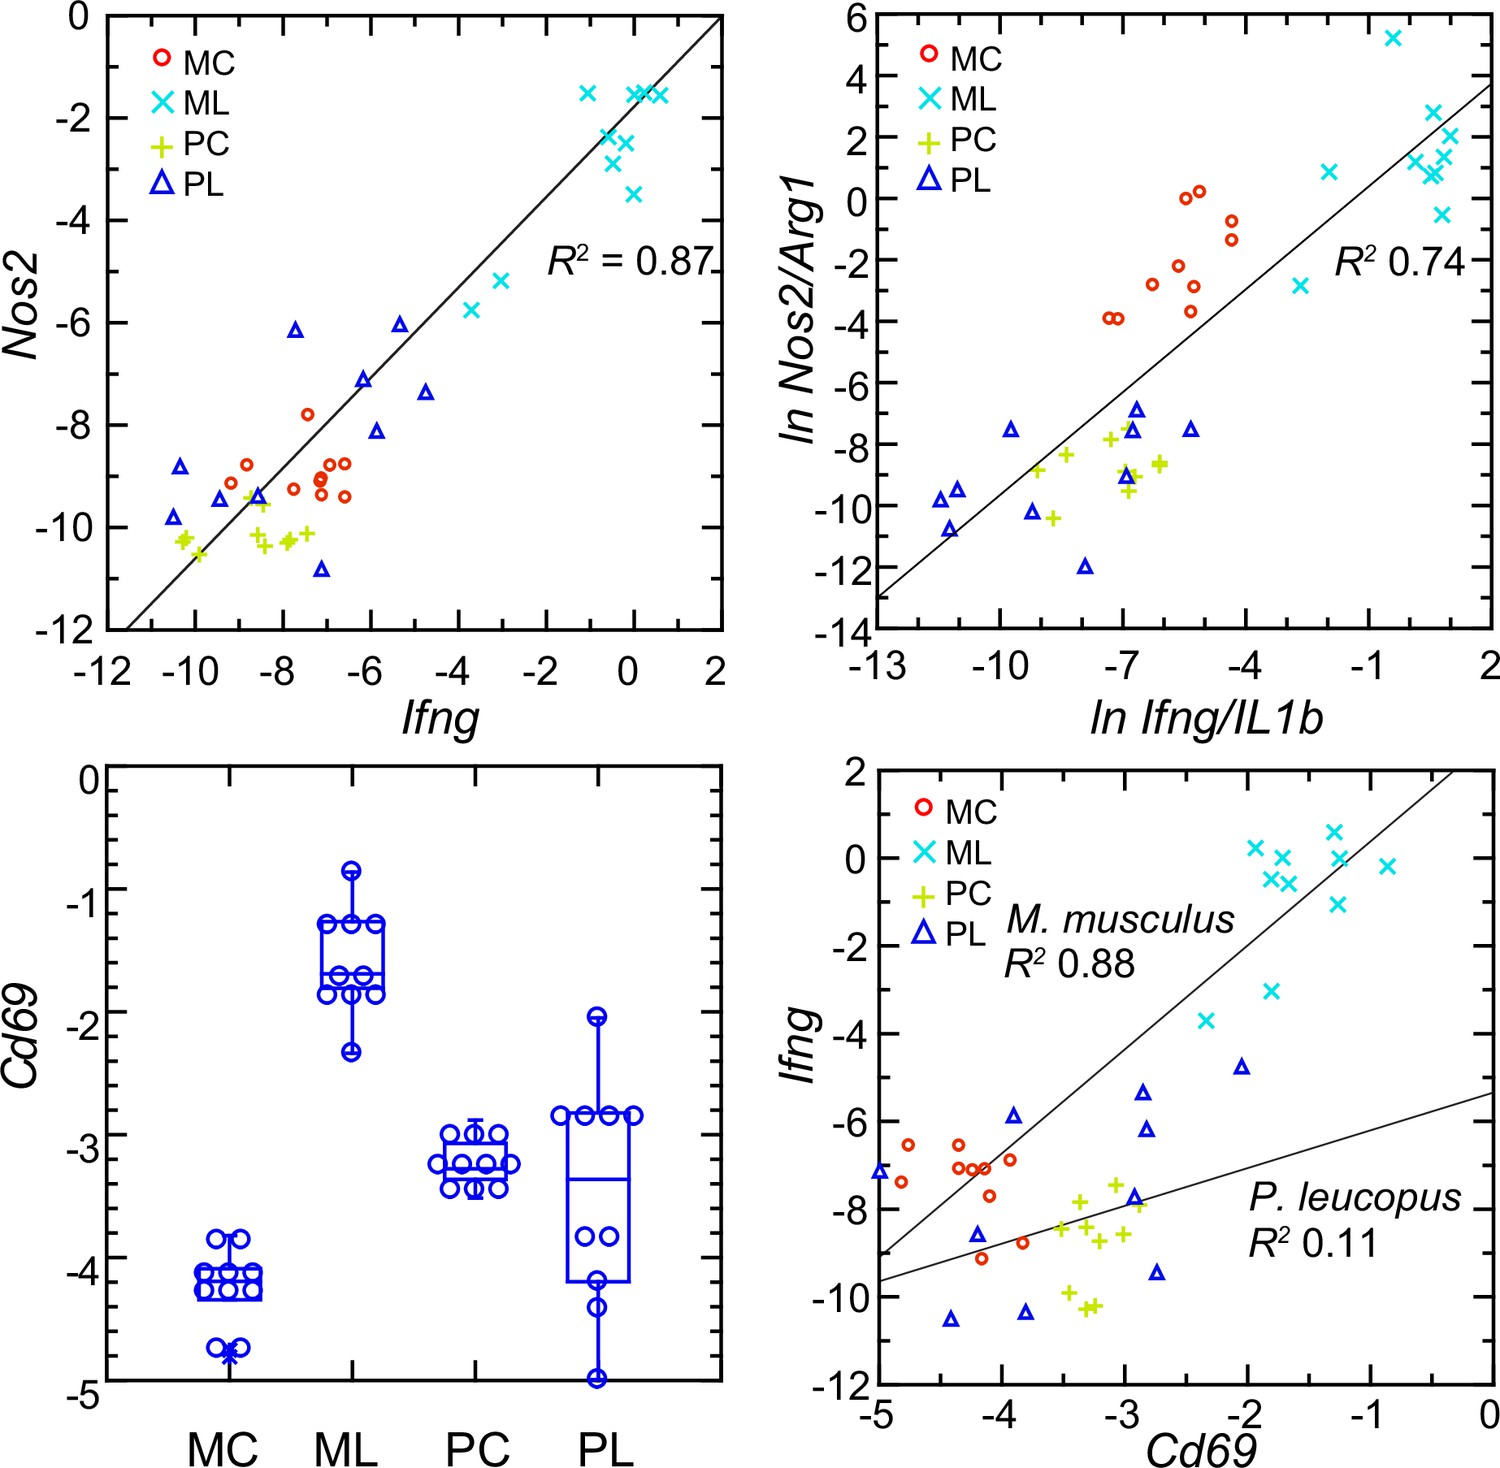
Normalized transcripts of Nos2, Ifng, and Cd69 in targeted RNA-seq analysis of blood of Peromyscus leucopus (P) or Mus musculus (M) with (L) or without (C) treatment with LPS.
Upper left: scatter plot of individual values for Nos2 on Ifng with linear regression curve and coefficient of determination (R2). Upper right: linear regression with R2 of natural logarithms (ln) of Nos2/Arg1 on Ifng/Il1b. Lower left: Box plots of individual values of normalized transcripts of Cd69. Lower right: Scatter plot of Ifng on Cd69 transcription with separate regression curves and R2 values for M. musculus and P. leucopus. Values for analysis are in Source data 1. Box plots for Nos2 and Arg1 are provided in Figure 10—figure supplement 1, and box plots for Ifng and Il1b are provided in Figure 8.
Figure 10—figure supplement 1
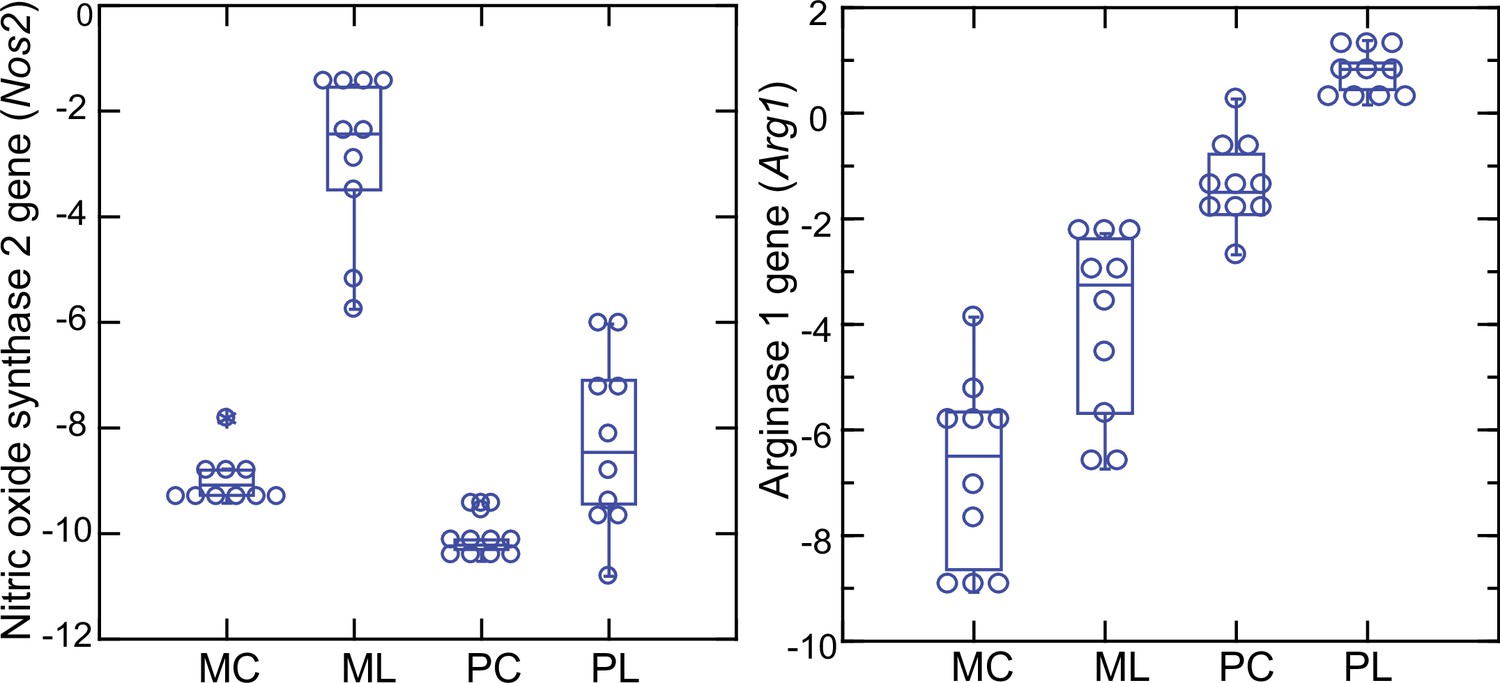
Box plots of log-transformed normalized transcripts of blood for nitric oxide synthase 2 (Nos2) and arginase 1 (Arg1) genes of Peromyscus leucopus (P) or Mus musculus (M) that have been treated with LPS (L) or were saline-alone controls (C).
There were 10 animals in each group and equally divided between females and males. Blood was obtained 4 hr after injection of LPS or saline alone, as described in Methods. Unique reads were normalized for reads of Ptprc transcripts for the same species for a given sample and the natural logarithm of the ratio was calculated.
Figure 11 with 1 supplement
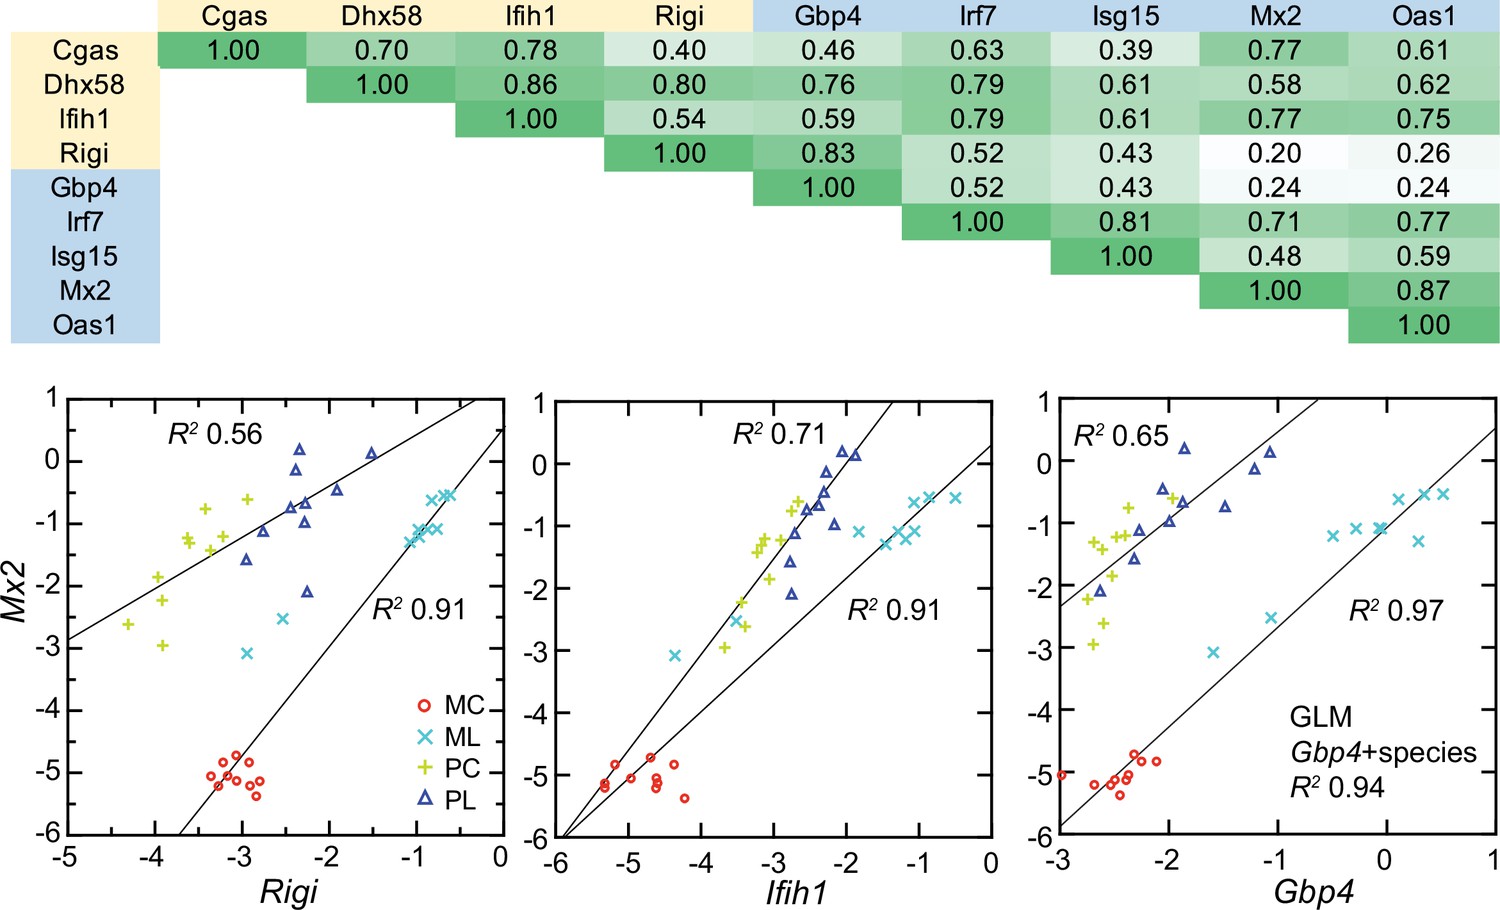
Co-variation between transcripts for selected PRRs and ISGs in the blood of Peromyscus leucopus (P) or Mus musculus (M) with (L) or without (C) LPS treatment.
Top panel: matrix of coefficients of determination (R2) for combined P. leucopus and M. musculus data. PRRs are indicated by yellow fill and ISGs by blue fill on horizontal and vertical axes. Shades of green of the matrix cells correspond to R2 values, where cells with values less than 0.30 have white fill and those of 0.90–1.00 have deepest green fill. Bottom panels: scatter plots of log-transformed normalized Mx2 transcripts on Rigi (left), Ifih1 (center), and Gbp4 (right). The linear regression curves are for each species. For the right-lower graph the result from the General Linear Model (GLM) estimate is also given. Values for analysis are in Source data 1; box plots for Gbp4, Irf7, Isg15, Mx2, and Oas1 are provided in Figure 11—figure supplement 1.
Figure 11—figure supplement 1

Box plots of log-transformed normalized transcripts for six interferon-stimulated genes of Peromyscus leucopus (P) or Mus musculus (M) that have been treated with LPS (L) or were saline-alone controls (C).
There were 10 animals in each group and equally divided between females and males. Blood was obtained 4 hr after injection of LPS or saline alone, as described in Methods. Unique reads were normalized for reads of Ptprc transcripts for the same species for a given sample and the natural logarithm of the ratio was calculated.
Figure 12 with 1 supplement
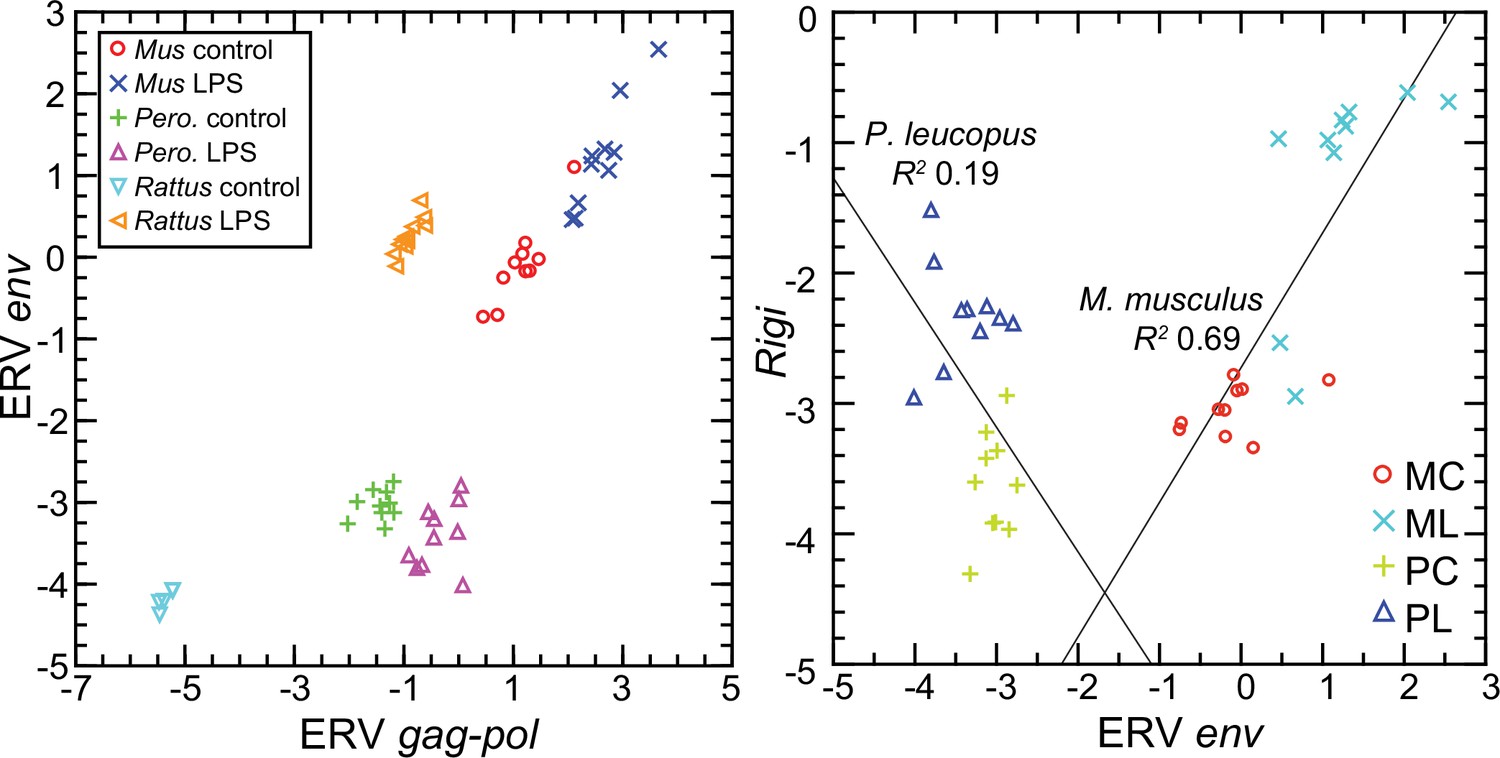
Scatter plots of endogenous retrovirus (ERV) env and gag-pol transcripts (left) and association of ERV env with Rigi transcription (right) in the blood of Peromyscus leucopus (Pero.; P), M musculus (Mus; M), or R. norvegicus (Rattus) with (L) or without (control; C) treatment with LPS.
In right panel, the linear regression curve and coefficients of determination (R2) for P. leucopus and M. musculus are shown. Values for analysis are in Source data 1; box plots for ERV env and ERV gag-pol transcripts are provided in Figure 12—figure supplement 1.
Figure 12—figure supplement 1
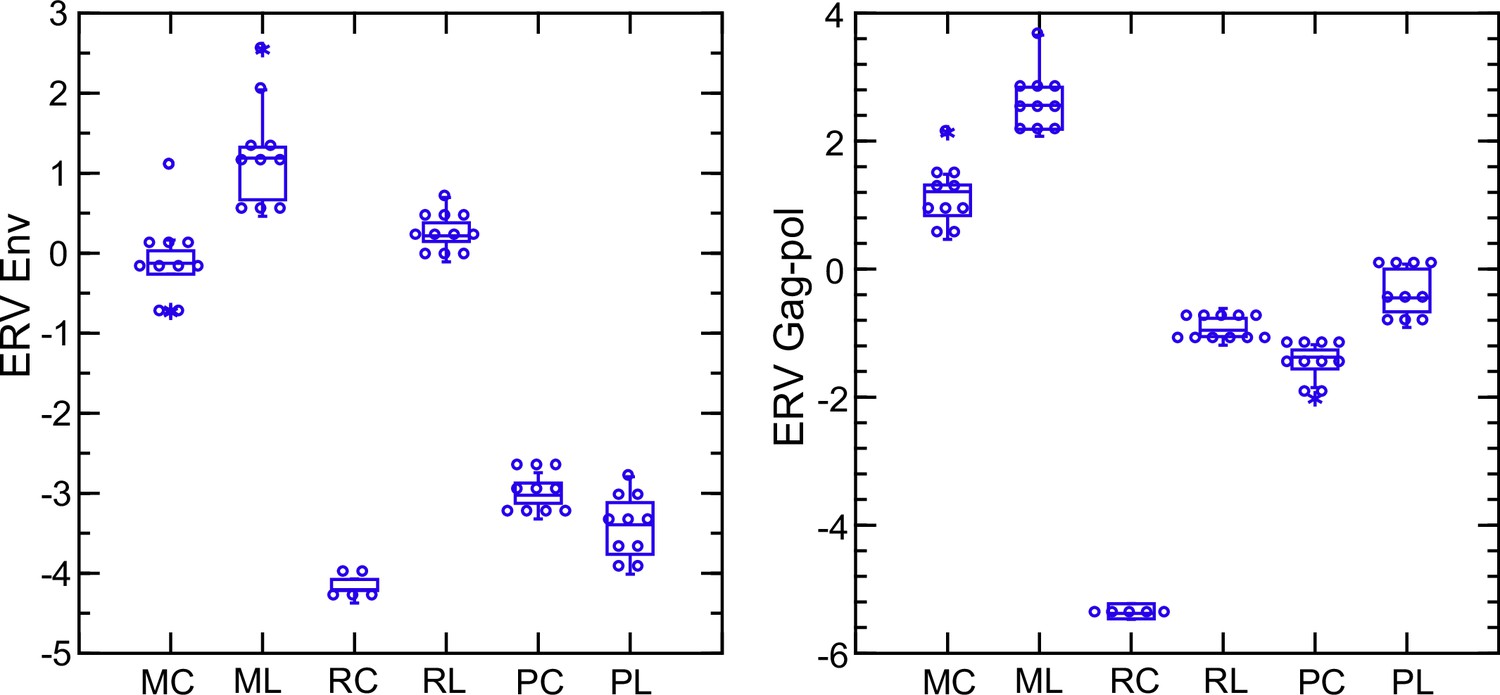
Box plots of log-transformed normalized transcripts in blood of an envelope protein protein gene (env) and an gag-pol gene of endogenous retroviruses (ERV) of Peromyscus leucopus (P), Mus musculus (M), or Rattus norvegicus (R) that have been treated with LPS (L) or were saline-alone controls (C).
Because of length differences for these coding sequences between three species, the unit used for cross-species analysis was reads per kilobase before normalization for Ptprc transcription.
Figure 13
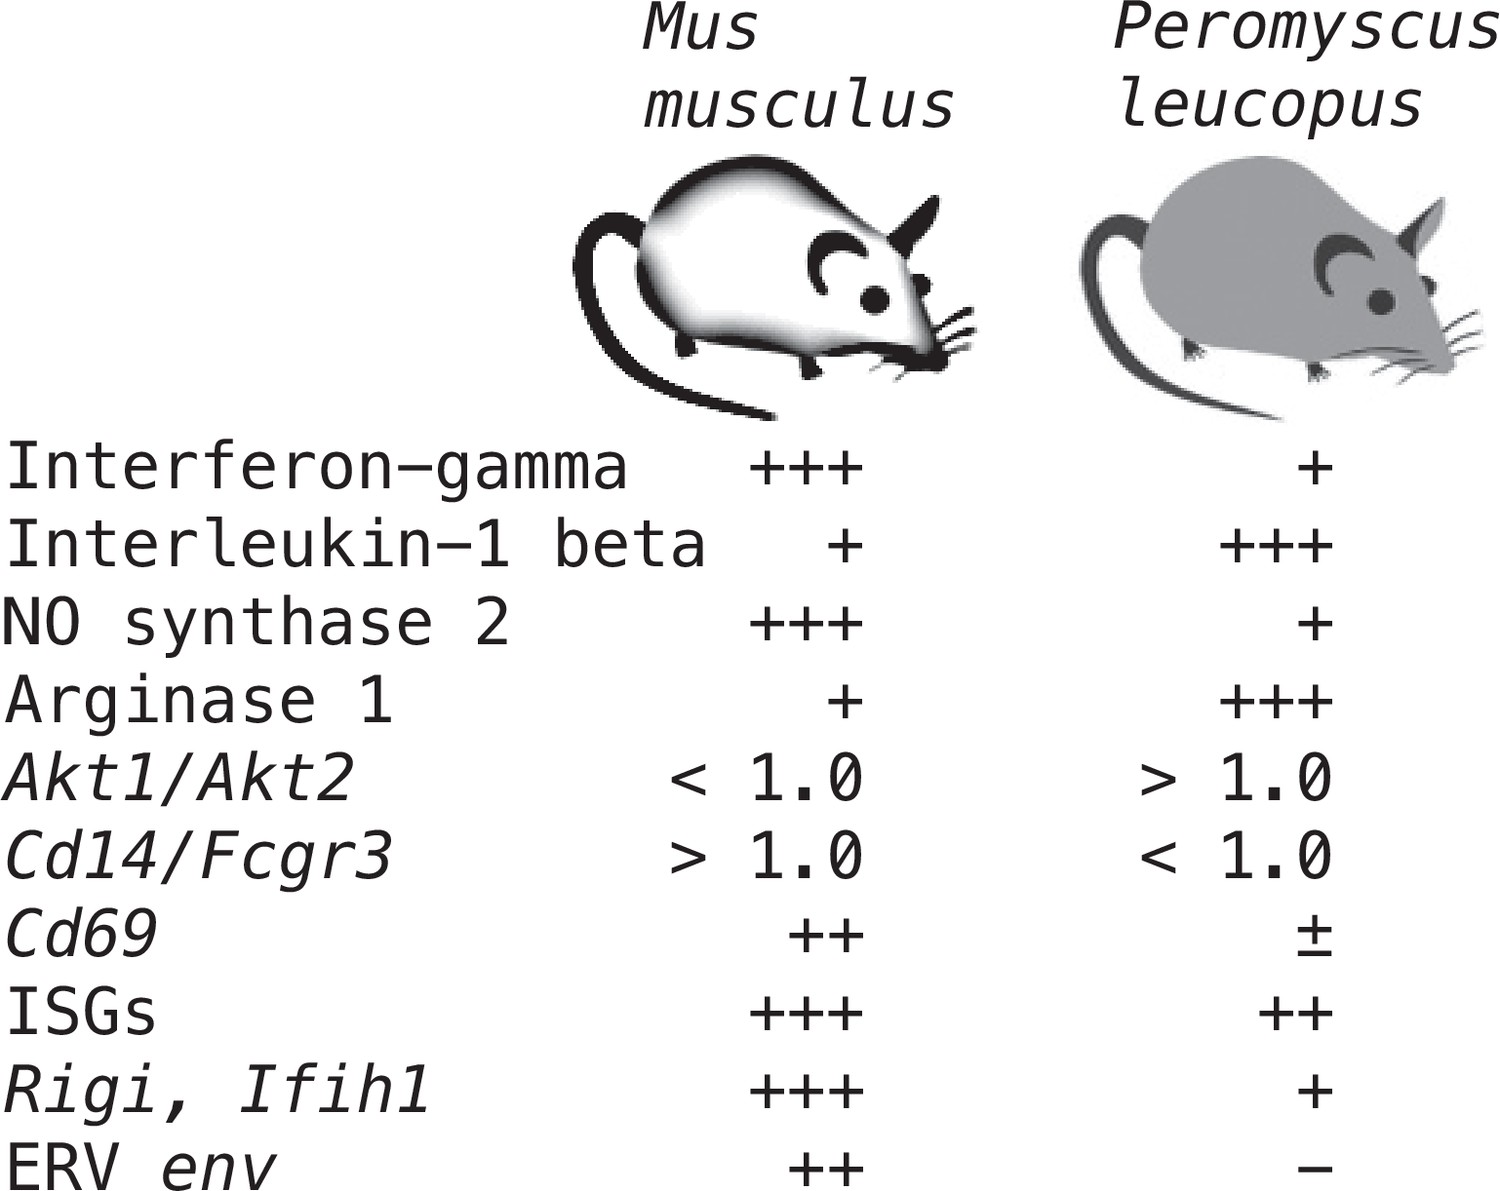
Summary of distinguishing features of transcriptional responses in the blood between Peromyscus leucopus and Mus musculus 4 hr after treatment with LPS.
There is semi-quantitative representation of relative transcription of selected coding sequences or ratios of transcription for selected pairs of genes in the blood.
Tables
Table 1
Characteristics and treatments of Mus musculus CD-1 and Peromyscus leucopus LL stock.
| Animal | Genus | Sex | Age (d) | Mass (g) | Treatment | Tachypnea | Hct* (%) | MCV* | WBC* | Neutrophils | Lymphocytes | Monocytes | Eosinophils | Neutrophils/ lymphocytes |
|---|---|---|---|---|---|---|---|---|---|---|---|---|---|---|
| MM19 | Mus | female | 149 | 60.4 | control† | no | 71 | 62 | 3800 | 570 | 2926 | 190 | 114 | 0.19 |
| MM21 | Mus | female | 149 | 51.4 | control | no | 51 | 59 | 8600 | 826 | 4897 | 177 | 0 | 0.17 |
| MM23 | Mus | female | 149 | 30.6 | control | no | 51 | . | 1500 | 135 | 1305 | 60 | 0 | 0.10 |
| MM25 | Mus | female | 149 | 42.1 | control | no | 65 | 61 | 7900 | 1106 | 6557 | 237 | 0 | 0.17 |
| MM27 | Mus | female | 149 | 39.7 | control | no | 58 | 62 | 3700 | 962 | 2257 | 333 | 148 | 0.43 |
| MM1 | Mus | male | 149 | 50.9 | control | no | 67 | 59 | 3300 | 726 | 2376 | 198 | 0 | 0.31 |
| MM17 | Mus | male | 149 | 40.8 | control | no | 51 | . | 7000 | 4970 | 2030 | 0 | 0 | 2.45 |
| MM3 | Mus | male | 149 | 45.8 | control | no | 58 | 59 | 4300 | 344 | 3655 | 301 | 0 | 0.09 |
| MM5 | Mus | male | 149 | 41.2 | control | no | 60 | 57 | 5400 | 810 | 4266 | 324 | 0 | 0.19 |
| MM7 | Mus | male | 149 | 44.1 | control | no | 47 | 58 | 3800 | 798 | 2736 | 266 | 0 | 0.29 |
| MM31 | Mus | female | 149 | 65.5 | LPS | yes | 53 | 58 | 1900 | 209 | 1539 | 114 | 38 | 0.14 |
| MM33 | Mus | female | 149 | 48.4 | LPS | yes | 62 | 62 | 3200 | 256 | 2784 | 96 | 64 | 0.09 |
| MM35 | Mus | female | 149 | 40.5 | LPS | yes | 49 | 64 | 2200 | 528 | 1518 | 88 | 66 | 0.35 |
| MM37 | Mus | female | 149 | 38.5 | LPS | no | 54 | 65 | 1900 | 152 | 1634 | 57 | 57 | 0.09 |
| MM39 | Mus | female | 149 | 40.2 | LPS | yes | 61 | 63 | 600 | 60 | 510 | 12 | 18 | 0.12 |
| MM11 | Mus | male | 149 | 57.4 | LPS | yes | 59 | 58 | 2600 | 572 | 1898 | 104 | 0 | 0.30 |
| MM13 | Mus | male | 149 | 58.5 | LPS | yes | 66 | 59 | 3700 | 1258 | 2183 | 259 | 0 | 0.58 |
| MM15 | Mus | male | 149 | 51.0 | LPS | yes | 33 | 56 | 1800 | 90 | 1602 | 90 | 0 | 0.06 |
| MM29 | Mus | male | 149 | 39.1 | LPS | no | 53 | 59 | 1800 | 306 | 1368 | 72 | 54 | 0.22 |
| MM9 | Mus | male | 149 | 44.1 | LPS | yes | 58 | . | 1300 | 260 | 858 | 182 | 0 | 0.30 |
| 24841 | Peromyscus | female | 162 | 19.9 | control | no | 58 | 48 | 5100 | 204 | 4590 | 102 | 204 | 0.04 |
| 24842 | Peromyscus | female | 164 | 18.3 | control | no | 47 | 48 | 3900 | 663 | 3003 | 117 | 117 | 0.22 |
| 24843 | Peromyscus | female | 162 | 20.5 | control | no | 45 | 46 | 4200 | 942 | 3150 | 42 | 84 | 0.30 |
| 24845 | Peromyscus | female | 161 | 18.7 | control | no | 49 | 48 | 9100 | 2002 | 6916 | 182 | 0 | 0.29 |
| 24853 | Peromyscus | female | 160 | 22.8 | control | no | 42 | . | 4800 | 1008 | 2880 | 864 | 1 | 0.35 |
| 24852 | Peromyscus | male | 162 | 19.4 | control | no | 44 | 46 | 7100 | 994 | 4970 | 284 | 852 | 0.20 |
| 24861 | Peromyscus | male | 157 | 20.8 | control | no | 28 | 50 | 1300 | 104 | 1053 | 91 | 52 | 0.10 |
| 24863 | Peromyscus | male | 157 | 17.1 | control | no | 26 | 58 | 7200 | 720 | 5904 | 288 | 288 | 0.12 |
| 24869 | Peromyscus | male | 143 | 29.0 | control | no | 48 | 52 | 6000 | 1260 | 4260 | 180 | 240 | 0.30 |
| 24876 | Peromyscus | male | 142 | 16.1 | control | no | 54 | 48 | 9700 | 2716 | 6208 | 194 | 485 | 0.44 |
| 24846 | Peromyscus | female | 162 | 22.7 | LPS | no | 23 | 47 | 1100 | 231 | 718 | 44 | 44 | 0.32 |
| 24847 | Peromyscus | female | 162 | 16.7 | LPS | no | 39 | . | 1500 | 570 | 675 | 180 | 75 | 0.84 |
| 24848 | Peromyscus | female | 166 | 16.2 | LPS | no | 43 | 49 | 2700 | 918 | 1701 | 27 | 54 | 0.54 |
| 24850 | Peromyscus | female | 157 | 19.4 | LPS | no | 46 | . | 3300 | 1551 | 1683 | 66 | 0 | 0.92 |
| 24851 | Peromyscus | female | 161 | 25.4 | LPS | no | 24 | 47 | 2300 | 552 | 1242 | 437 | 69 | 0.44 |
| 24855 | Peromyscus | male | 165 | 27.1 | LPS | no | 51 | 51 | 2100 | 1281 | 714 | 42 | 63 | 1.79 |
| 24860 | Peromyscus | male | 160 | 17.8 | LPS | yes | 42 | 54 | 13,200 | 6996 | 3696 | 1320 | 1056 | 1.89 |
| 24865 | Peromyscus | male | 160 | 16.7 | LPS | no | 49 | 46 | 1800 | 396 | 1080 | 288 | 0 | 0.37 |
| 24873 | Peromyscus | male | 145 | 23.2 | LPS | no | 43 | 48 | 2200 | 550 | 1430 | 110 | 110 | 0.38 |
| 24879 | Peromyscus | male | 145 | 22.0 | LPS | no | 40 | . | 1100 | 220 | 538 | 352 | 0 | 0.41 |
-
*
Abbreviations: Hct, hematocrit; MCV, mean cellular volume of erythrocytes; WBC, white blood cell count.
-
†
control, saline alone.
Table 2
RT-qPCR of blood of LPS-treated and control Peromyscus leucopus and Mus musculus.
| Blood mRNA source | Gene | Control mean copies (95% CI) | LPS mean copies (95% CI) | Fold difference (LPS/control) | t test p/Mann-Whitney p |
|---|---|---|---|---|---|
| P. leucopus | Gapdh | 1.2 (0.40–3.7) x 105 | 2.4 (1.1–5.2) x 105 | 1.95 | 0.35/0.49 |
| Nos2 | 191 (141–260) | 138 (61–315) | 0.72 | 0.47/0.53 | |
| Arg1 | 4.6 (3.1–6.9) x 103 | 12.3 (3.2–47) x 103 | 2.66 | 0.18/0.55 | |
| M. musculus | Gapdh | 6.1 (2.3–16.0) x 106 | 1.8 (0.80–3.9) x 106 | 0.29 | 0.06/0.02 |
| Nos2 | 101 (68–151) | 1891 (866–4130) | 18.6 | <0.00001/0.002 | |
| Arg1 | 27 (15–20) | 16 (8–34) | 0.59 | 0.29/0.45 |
-
Table 2—source data 1
RT-qPCR of Gapdh, Nos2, and Arg1 transcripts in blood of P. leucopus or M. musculus with or without treatment with LPS.
- https://cdn.elifesciences.org/articles/90135/elife-90135-table2-data1-v1.xlsx
Table 3
Targeted RNA-seq of Peromyscus leucopus blood in 12 hr experiment with LPS dose of 1 µg/g.
| Gene (alternative name) | Control (n=3) mean (95% CI)* | LPS (n=3) mean (95% CI)* | Fold change | FDR p value† |
|---|---|---|---|---|
| Akt1 | 220 (12–4202) | 514 (321–825) | 2.3 | 0.05 |
| Akt2 | 145 (97–217) | 336 (236–478) | 2.3 | 0.04 |
| Arg1 | 146 (58–367) | 2812 (273–28,925) | 19 | 0.018 |
| Cd14 | 82 (12–569) | 914 (161–5197) | 11 | 0.05 |
| Cd69 | 165 (87–310) | 68 (14–329) | 0.42 | 0.15 |
| ERV env | 25 (3–242) | 40 (7–224) | 1.6 | 0.86 |
| ERV gag-pol | 3085 (132–14,695) | 2768 (533–1278) | 0.9 | 0.66 |
| Fcgr3 | 40 (25–66) | 841 (533–1278) | 21 | 0.008 |
| Gapdh | 7176 (3504–15,142) | 23811 (5827–97,306) | 3.3 | 0.07 |
| Gbp4 | 97 (6–1551) | 439 (33–5819) | 4.5 | 0.05 |
| Ifit1 | 367 (51–2663) | 1373 (374–5047) | 3.7 | 0.05 |
| Ifng | 0 (0–0) | 0 (0–0) | . | . |
| Il1b | 258 (18–3652) | 1432 (183–11,220) | 5.6 | 0.1 |
| Irf7 | 121 (93–157) | 11405 (530–245,616) | 94 | 0.003 |
| Isg15 | 429 (184–1001) | 19505 (11140–34,152) | 45 | 0.005 |
| Mx2 | 157 (73–341) | 1310 (323–5315) | 8.3 | 0.04 |
| Nos2 | 0 (0–0) | 0 (0–0) | . | . |
| Oas1 | 65 (31–138) | 1458 (367–5795) | 22 | 0.03 |
| Rigi (Ddx58) | 38 (3–504) | 173 (35–845) | 4.5 | 0.07 |
| Saa3 | 2 (0–250) | 6683 (1494–29,896) | 3372 | 0.03 |
| Slpi | 6 (1-46) | 779 (326–1864) | 123 | 0.03 |
| Sod2 | 180 (54–607) | 3406 (698–16,633) | 19 | 0.03 |
-
*
Mean unique reads for given gene normalized for reads for Ptprc (Cd45) gene for a sample. The 95% confidence intervals (CI) are asymmetric. Actual [gene]/Ptprc ratios are x 10–3 (Source data 1).
-
†
FDR, false discovery rate p value.
-
Table 3—source data 1
Targeted RNA-seq of blood of P. leucopus 12 h after treatment with LPS (1 µg/g) or saline.
- https://cdn.elifesciences.org/articles/90135/elife-90135-table3-data1-v1.xlsx
Table 4
Hematology, cytokines, and targeted RNA-seq of LPS-treated and control Rattus norvegicus.
| Variable | Control (n=5) mean (95% CI)* | LPS (n=11) mean (95% CI)*,† | Fold change | FDR p value |
|---|---|---|---|---|
| Hematology | ||||
| Hematocrit (%) | 48 (46–50) | 48 (46–49) | 1.0 | 1E+00 |
| White blood cells | 7660 (7200–8310) | 4980 (2020–7940) | 0.75 | 2E-01 |
| Neutrophils | 3680 (3260–4090) | 1410 (520–2290) | 0.38 | 4E-03 |
| Lymphocytes | 3170 (3010–3330) | 2830 (1230–4430) | 0.89 | 8E-01 |
| Neutrophil/lymphocyte | 1.17 (1.01–1.33) | 0.49 (0.44–0.55) | 0.42 | 7E-09 |
| Blood cytokines (pg/ml) | ||||
| Interleukin-6 | 0 (0–0) | 36933 (21676–52190) | . | 5E-15 |
| Interleukin-10 | 9 (1-17) | 640 (477–802) | 71 | 2E-09 |
| Interferon-gamma | 0 (0–0) | 9091 (7126–11056) | . | 9E-20 |
| Targeted RNA-seq | ||||
| Akt1 | 35.8 (29.8–42.9) | 24.3 (21.5–27.5) | 0.68 | 4E-03 |
| Akt2 | 50.8 (44.9–57.4) | 109 (95.2–125) | 2.2 | 9E-06 |
| Arg1 | 0.04 (0.02–0.08) | 0.21 (0.10–0.44) | 4.8 | 2E-02 |
| Cd14 | 7.7 (5.3–11.2) | 43.4 (29.6–63.6) | 5.6 | 9E-05 |
| Cd177 | 0.89 (0.43–1.8) | 190 (143–251) | 213 | 2E-10 |
| Cd3 | 32.3 (27.7–37.6) | 21.9 (18.5–25.8) | 0.68 | 1E-02 |
| Cd69 | 17.9 (16.7–19.2) | 58.9 (49.1–70.7) | 3.3 | 9E-07 |
| Cgas | 1.5 (1.3–1.6) | 12.8 (10.8–15.1) | 8.7 | 3E-10 |
| Cxcl10 | 0.43 (0.34–0.56) | 130 (93.7–181) | 302 | 1E-11 |
| Dhx58 | 7.1 (6.7–7.6) | 113 (97.3–130) | 15.8 | 3E-12 |
| ERV env | 8.4 (7.5–9.3) | 713 (624–815) | 85.3 | 1E-14 |
| ERV gag-pol | 6.0 (5.4–6.7) | 506 (449–570) | 84.3 | 7E-15 |
| Fcgr2a | 114 (87.0–150) | 764 (631–925) | 6.7 | 4E-08 |
| Fcgr2b | 32.5 (24.6–43.1) | 161 (127–204) | 4.9 | 2E-06 |
| Fcgr3 | 15.2 (13.6–17.0) | 13.9 (11.8–16.3) | 0.91 | 5E-01 |
| Gapdh | 327 (237–451) | 1643 (1385–1949) | 5.0 | 2E-07 |
| Gbp4 | 35.7 (33.6–38.0) | 269 (237–306) | 7.5 | 3E-11 |
| Ifih1 | 18.7 (17.1–20.4) | 165 (149–184) | 8.8 | 2E-12 |
| Ifit1 | 102 (70.0–147) | 756 (677–844) | 7.4 | 3E-09 |
| Ifng | 0.47 (0.32–0.67) | 10.3 (6.4–16.5) | 22.1 | 1E-06 |
| Il10 | 0.12 (0.07–0.21) | 4.5 (3.4–5.8) | 38.2 | 5E-09 |
| Il12 | 0.07 (0.04–0.11) | 3.2 (2.0–4.9) | 45.9 | 7E-08 |
| Il1b | 58.6 (39.7–86.4) | 618 (503–760) | 10.6 | 2E-08 |
| Il6 | 0.06 (0.05–0.08) | 4.4 (2.9–6.6) | 70.9 | 6E-09 |
| Irf7 | 44.8 (36.9–54.3) | 443 (372–528) | 9.9 | 6E-10 |
| Isg15 | 15.6 (13.1–18.7) | 624 (534–729) | 39.9 | 6E-13 |
| Itgam | 66.3 (52.5–83.7) | 208 (161–269) | 3.1 | 9E-05 |
| Mmp8 | 75.2 (50.4–112) | 519 (438–615) | 6.9 | 7E-08 |
| Mx2 | 40.7 (35.9–46.2) | 900 (780–1039) | 22.1 | 1E-12 |
| Nos2 | 32.4 (17–60.6) | 2990 (2491–3589) | 92.4 | 1E-10 |
| Oas1 | 23.1 (18.8–28.4) | 151 (140–164) | 6.6 | 3E-11 |
| Rigi (Ddx58) | 8.6 (7.8–9.4) | 151 (135–168) | 17.6 | 1E-13 |
| S100a9 | 298 (190–466) | 2884 (2269–3666) | 9.7 | 2E-07 |
| Saa1 | 0.60 (0.49–0.73) | 699 (552–884) | 1167 | 4E-14 |
| Slpi | 20.2 (13.1–31.3) | 262 (197–347) | 12.9 | 1E-07 |
| Sod2 | 63.8 (51.1–79.6) | 901 (759–1070) | 14.1 | 2E-10 |
| Tlr4 | 5.3 (4.6–6.0) | 20.1 (17.2–23.6) | 3.8 | 8E-08 |
| Tnf | 1.1 (0.63–1.9) | 78.8 (62.6–99.1) | 72.8 | 2E-10 |
| Ratios | ||||
| Akt1/Akt2 | 0.70 (0.65–0.76) | 0.22 (0.19–0.25) | 0.31 | 2E-08 |
| Cd14/Fcgr3 | 0.51 (0.34–0.76) | 3.14 (2.26–4.36) | 6.16 | 1E-05 |
| IL12/IL10 | 0.54 (0.22–1.37) | 0.70 (0.51–0.95) | 1.30 | 5E-01 |
| Nos2/Arg1 | 741 (403–1362) | 14244 (7615–26646) | 19.2 | 5E-05 |
-
*
For targeted RNA-seq it is mean unique reads for given gene normalized for reads for Ptprc (Cd45) gene for a sample. The 95% confidence intervals (CI) are asymmetric. Actual [gene]/Ptprc ratios are x 10–3.
-
†
The results for rats receiving 5 µg/g (n=6) and 20 µg/g (n=5) were combined.
-
Table 4—source data 1
Targeted RNA-seq of blood of Rattus norvegicus with or without treatment with LPS and with normalization by Ptprc transcripts.
- https://cdn.elifesciences.org/articles/90135/elife-90135-table4-data1-v1.xlsx
-
Table 4—source data 2
Differentially expressed genes of genome-wide RNA-seq of blood of R. norvegicus with and without treatment with LPS.
- https://cdn.elifesciences.org/articles/90135/elife-90135-table4-data2-v1.xlsx
Table 5
Targeted RNA-seq of Peromyscus leucopus with and without Borrelia hermsii infection.
| Variable | Uninfected (n=3) mean (95% CI)* | Infected (n=4) mean (95% CI)* | Fold change | FDR p value |
|---|---|---|---|---|
| B. hermsii qPCR of spleen | . | 13615 (1882–98,476) | . | . |
| B. hermsii reads blood† | . | 3487 (743–16,362) | . | . |
| % spleen/body mass | 0.15 (0.12–0.19) | 0.36 (0.26–0.51) | 2.4 | 1E-02 |
| Targeted RNA-seq | ||||
| Akt1 | 184 (135–253) | 347 (191–630) | 1.88 | 3E-01 |
| Akt2 | 92.9 (72.4–119) | 141 (89.4–222) | 1.52 | 3E-01 |
| Arg1 | 247 (96.9–630) | 1375 (848–2230) | 5.57 | 4E-02 |
| Cd14 | 308 (119–799) | 598 (357–1002) | 1.94 | 3E-01 |
| Cd177 | 2.11 (0.71–6.27) | 35.9 (11.9–108) | 17.0 | 4E-02 |
| Cd69 | 133 (114–155) | 65 (33.6–128) | 0.49 | 2E-02 |
| Cxcl10 | 0.33 (0.14–0.76) | 4.85 (2.74–8.59) | 14.7 | 2E-02 |
| ERV env | 26.8 (22.4–32.1) | 29.2 (14.8–57.8) | 1.09 | 9E-01 |
| ERV gag-pol | 1853 (1351–2542) | 1578 (820–3037) | 0.85 | 8E-01 |
| Fcgr2a | 44.8 (24.0–83.6) | 715 (303–1689) | 16.0 | 2E-02 |
| Fcgr2b | 47.3 (30.2–74.3) | 578 (167–2000) | 12.2 | 5E-02 |
| Fcgr3 | 30.6 (18.6–50.4) | 392 (171–897) | 12.8 | 2E-02 |
| Gapdh | 1985 (1142–3447) | 5366 (2383–12,081) | 2.70 | 2E-01 |
| Gbp4 | 126 (82.3–193) | 289 (130–644) | 2.30 | 3E-01 |
| Ifit1 | 223 (107–465) | 604 (303–1203) | 2.71 | 2E-01 |
| Ifng | 0.58 (0.09–3.92) | 2.28 (0.86–6.06) | 3.94 | 3E-01 |
| Il10 | 0.25 (0.07–0.87) | 1.49 (0.31–7.28) | 5.94 | 3E-01 |
| Il12 | 0.43 (0.23–0.81) | 1.13 (0.45–2.88) | 2.63 | 3E-01 |
| Il1b | 477 (174–1308) | 2828 (1325–6034) | 5.93 | 7E-02 |
| Irf7 | 93.3 (13.4–65) | 626 (196–1998) | 6.71 | 2E-01 |
| Isg15 | 302 (30.1–3030) | 1922 (623–5934) | 6.36 | 3E-01 |
| Itgam | 72.2 (44.5–117) | 322 (211–492) | 4.45 | 2E-02 |
| Mmp8 | 7.1 (2.74–18.6) | 537 (148–1952) | 75.2 | 2E-02 |
| Mx2 | 152 (48.6–476) | 167 (48.0–582) | 1.10 | 9E-01 |
| Nos2 | 0.16 (0.08–0.30) | 0.32 (0.13–0.80) | 2.01 | 4E-01 |
| Oas1 | 51.3 (6.75–390) | 159 (39.2–643) | 3.10 | 5E-01 |
| Rigi (Ddx58) | 38.7 (18.9–79.2) | 55.7 (33.9–91.5) | 1.44 | 5E-01 |
| S100a9 | 1739 (657–4596) | 18430 (6546–51,883) | 10.6 | 5E-02 |
| Saa3 | 0.49 (0.13–1.87) | 212 (25.9–1733) | 431 | 2E-02 |
| Slpi | 0.41 (0.18–0.95) | 166 (49.0–566) | 401 | 1E-02 |
| Sod2 | 104 (51.4–211) | 2011 (804–5028) | 19.3 | 2E-02 |
| Tlr2 | 83.2 (59.7–116) | 371 (234–587) | 4.46 | 2E-02 |
| Tlr4 | 44.8 (26.1–77.0) | 256 (138–474) | 5.71 | 3E-02 |
| Ratios | ||||
| Akt1/Akt2 | 2.0 (1.7–2.3) | 2.5 (2.1–2.9) | 1.25 | 1E-01 |
| Cd14/Fcgr3 | 11.3 (4.8–17.9) | 1.7 (0.72–2.8) | 0.15 | 2E-02 |
| IL12/IL10 | 2.3 (0.00–5.0) | 2.8 (0.0–7.6) | 1.21 | 9E-01 |
| Nos2/Arg1 | 0.001 (0.0–0.002) | 0.0001 (0.0–0.0004) | 0.28 | 2E-01 |
-
*
For targeted RNA-seq it is mean unique reads for given gene normalized for reads for Ptprc (Cd45) gene for a sample. The 95% confidence intervals (CI) are asymmetric. Actual [gene]/Ptprc ratios are x 10–3.
-
†
† Normalized PE150 reads mapping to cp6.5 plasmid of B. hermsii.
-
Table 5—source data 1
Targeted RNA-seq of blood with normalization by Ptprc of P. leucopus with and without infection by Borrelia hermsii.
- https://cdn.elifesciences.org/articles/90135/elife-90135-table5-data1-v1.xlsx
Key resources table
| Reagent type (species) or resource | Designation | Source or reference | Identifiers | Additional information |
|---|---|---|---|---|
| Strain, strain background (Peromyscus leucopus) | Outbred LL stock; adults of both sexes | Peromyscus Genetic Stock Center of the University of South Carolina | ||
| Strain, strain background (Mus musculus) | Outbred CD-1 breed; adults of both sexes | Charles River Laboratories | Crl:CD1(ICR) IGS | |
| Strain, strain background (Rattus norvegicus) | Inbred Fischer F344 strain; adult females | Charles River Laboratories | F344/NHsd | |
| Strain, strain background (Borrelia hermsii) | Genomic group II, strain MTW | Balderrama-Gutierrez et al., 2021 (reference 3) | Provided by Tom Schwan, Rocky Mountain Laboratories | |
| Sequence-based reagent | Arg1_F for P. leucopus | This paper | PCR primer | TCCGCTGACAACCAACTCTG |
| Sequence-based reagent | Arg1_R for P. leucopus | This paper | PCR primer | GACAGGTGTGCCAGTAGATG |
| Sequence-based reagent | Arg1_F for M. musculus | This paper | PCR primer | TGTGAAGAACCCACGGTCTG |
| Sequence-based reagent | Arg1_R for M. musculus | This paper | PCR primer | ACGTCTCGCAAGCCAATGTA |
| Sequence-based reagent | Nos2_F for P. leucopus and M. musculus | Balderrama-Gutierrez et al., 2021 (reference 3) | PCR primer | GACTGGATTTGGCTGGTCCC |
| Sequence-based reagent | Nos2_R for P. leucopus and M. musculus | Balderrama-Gutierrez et al., 2021 (reference 3) | PCR primer | GAACACCACTTTCACCAAGAC |
| Sequence-based reagent | Gapdh_F for P. leucopus and M. musculus | Balderrama-Gutierrez et al., 2021 (reference 3) | PCR primer | TCACCACCATGGAGAAGGC |
| Sequence-based reagent | Gapdh_R for P. leucopus and M. musculus | Balderrama-Gutierrez et al., 2021 (reference 3) | PCR primer | GCTAAGCAGTTGGTGGTGCA |
| Commercial assay or kit | Invitrogen Mouse RiboPure-Blood RNA Isolation Kit | Invitrogen | AM1951 | |
| Commercial assay or kit | TruSeq Stranded mRNA kit for cDNA | Illumina | 20020594 | |
| Commercial assay or kit | Power Sybr Green RNA-to-Ct 1-Step Kit for RT-qPCR | Applied Biosystems | ThermoFisher 4389986 | |
| Chemical compound, drug | Lipopolysaccharide, Escherichia coli O111:B4, ion-exchange chromatography purified | Sigma-Aldrich | L3024 | |
| Chemical compound, drug | Lipopolysaccharide, Escherichia coli O111:B4, cell culture grade” | Sigma-Aldrich | L4391 | |
| Chemical compound, drug | 0.9% sodium chloride sterile-filtered, endotoxin-tested | Sigma-Aldrich | S8776 | |
| Software, algorithm | FastQC, version 0.12.0 | Babraham Bioinformatics | https://www.bioinformatics.babraham.ac.uk/projects/fastqc/ | |
| Software, algorithm | Trimmomatic, version 0.40 | USADELLAB.org; Usadel and Bolger, 2023 | https://github.com/usadellab/Trimmomatic | |
| Software, algorithm | CLC Genomics Workbench, version 23.1 | Qiagen | ||
| Software, algorithm | EnrichR (Enrichment of Gene Ontology) | Metascape | https://metascape.org | |
| Software, algorithm | SYSTAT, version 13.1 | Systat Software, Inc | ||
| Software, algorithm | False Discovery Rate Online Calculator | Carbocation Corporation | https://tools.carbocation.com/FDR |
Additional files
-
MDAR checklist
- https://cdn.elifesciences.org/articles/90135/elife-90135-mdarchecklist1-v1.docx
-
Supplementary file 1
Targeted RNA-seq of blood for 115 selected genes of Peromyscus leucopus and Mus musculus 4 hours after intraperitoneal injection of lipopolysaccharide (LPS) or saline control.
The list includes the 113 coding sequences listed in Methods, as well as endogenous retrovirus (ERV) env transcripts and ERV gag-pol transcripts. The values are mean unique reads with asymmetric 95% confidence intervals for a given gene transcript normalized for reads for Ptprc transcripts for a sample. Each species is analyzed separately with respect to LPS-treated and control animals. For cross-species comparisons the fold-change (FC) differences between control and LPS-treated animals were individually determined. For a summary representation of the differences between the two species in responses to LPS, the ratios of P. leucopus to M. musculus FC values were calculated. These are schematically displayed as a color-coded heat-map as well.
- https://cdn.elifesciences.org/articles/90135/elife-90135-supp1-v1.docx
-
Source data 1
Targeted RNA-seq with normalization by Ptrc transcripts of blood of P. leucopus LL stock or M. musculus CD-1 with or without treatment with LPS by individual animal.
- https://cdn.elifesciences.org/articles/90135/elife-90135-data1-v1.xlsx
Download links
A two-part list of links to download the article, or parts of the article, in various formats.
Downloads (link to download the article as PDF)
Open citations (links to open the citations from this article in various online reference manager services)
Cite this article (links to download the citations from this article in formats compatible with various reference manager tools)
The infection-tolerant white-footed deermouse tempers interferon responses to endotoxin in comparison to the mouse and rat
eLife 12:RP90135.
https://doi.org/10.7554/eLife.90135.3


