Minimal twister sister-like self-cleaving ribozymes in the human genome revealed by deep mutational scanning
- Institute for Systems and Physical Biology, Shenzhen Bay Laboratory, China
- University of Science and Technology of China, China
- Institute for Biomedicine and Glycomics, Griffith University, Australia
- Suzhou Institute for Advanced Research, University of Science and Technology of China, China
- High Magnetic Field Laboratory, Key Laboratory of High Magnetic Field and Ion Beam Physical Biology, Hefei Institutes of Physical Science, Chinese Academy of Sciences, China
- Institute of Physical Science and Information Technology, Anhui University, China
- School of Information and Communication Technology, Griffith University, Australia
- Ribopeutic Inc, Guangzhou International Bio Island, China
Figures
Figure 1 with 6 supplements
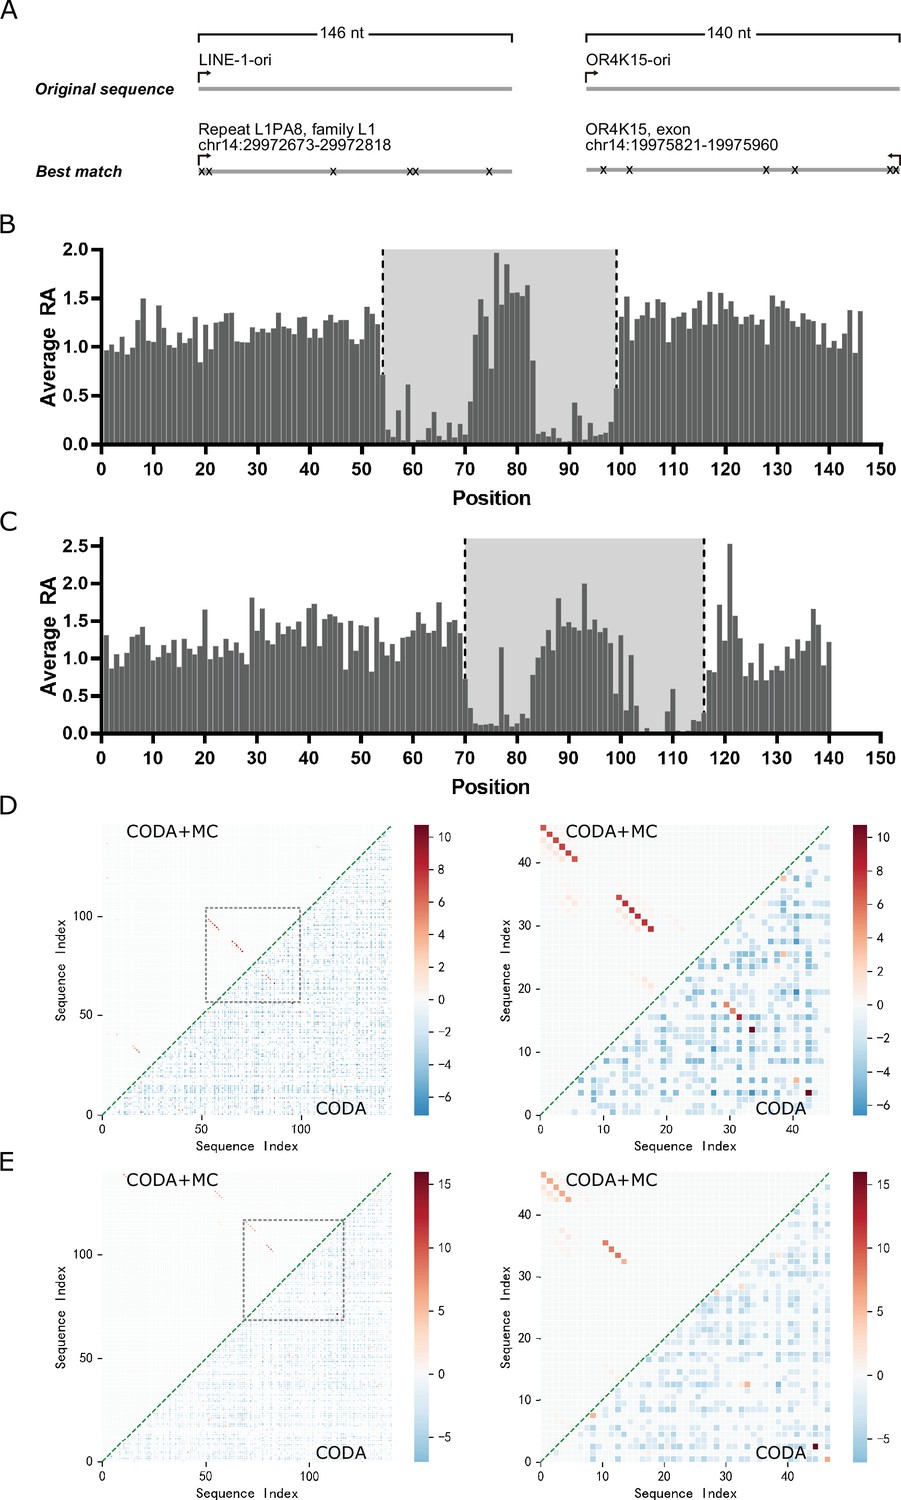
Deep mutational scanning results of the LINE-1 and OR4K15 ribozymes.
(A) Genomic locations of the sequences with the highest similarity to the LINE-1 (left) and OR4K15 (right) ribozymes. (B) Average relative activity of mutations at each sequence position of the original LINE-1 ribozyme (LINE-1-ori). (C) Average relative activity of mutations at each sequence position of the original OR4K15 ribozyme (OR4K15-ori). (D) (Left) Base-pairing maps inferred from LINE-1-ori deep mutation data by covariation-induced deviation of activity (CODA) (lower triangle) and by CODA in combination with Monte-Carlo simulated annealing (CODA+MC) (upper triangle). (Right) Same as (Left) but for the contiguous functional region corresponds to 54–99 of LINE-1-ori (LINE-1-rbz). (E) (Left) Base-pairing maps inferred from OR4K15-ori deep mutation data by CODA (lower triangle) and by CODA+MC (upper triangle). (Right) Same as (Left) but for the contiguous functional region which corresponds to 70–116 of OR4K15-ori (OR4K15-rbz).
Figure 1—figure supplement 1
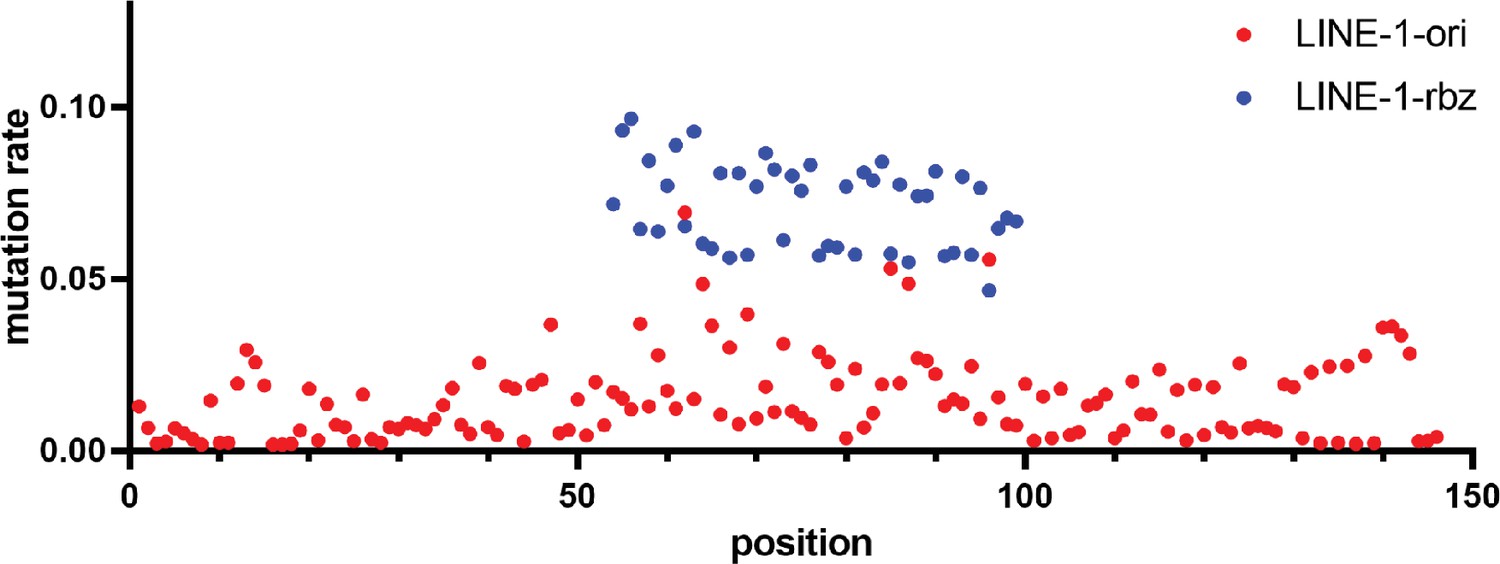
Mutation rates of two deep mutational scanning results at each nucleotide position of LINE-1 ribozyme.
The mutation rate was calculated as the proportion of mutations observed at each position for the DNA-seq library.
Figure 1—figure supplement 2
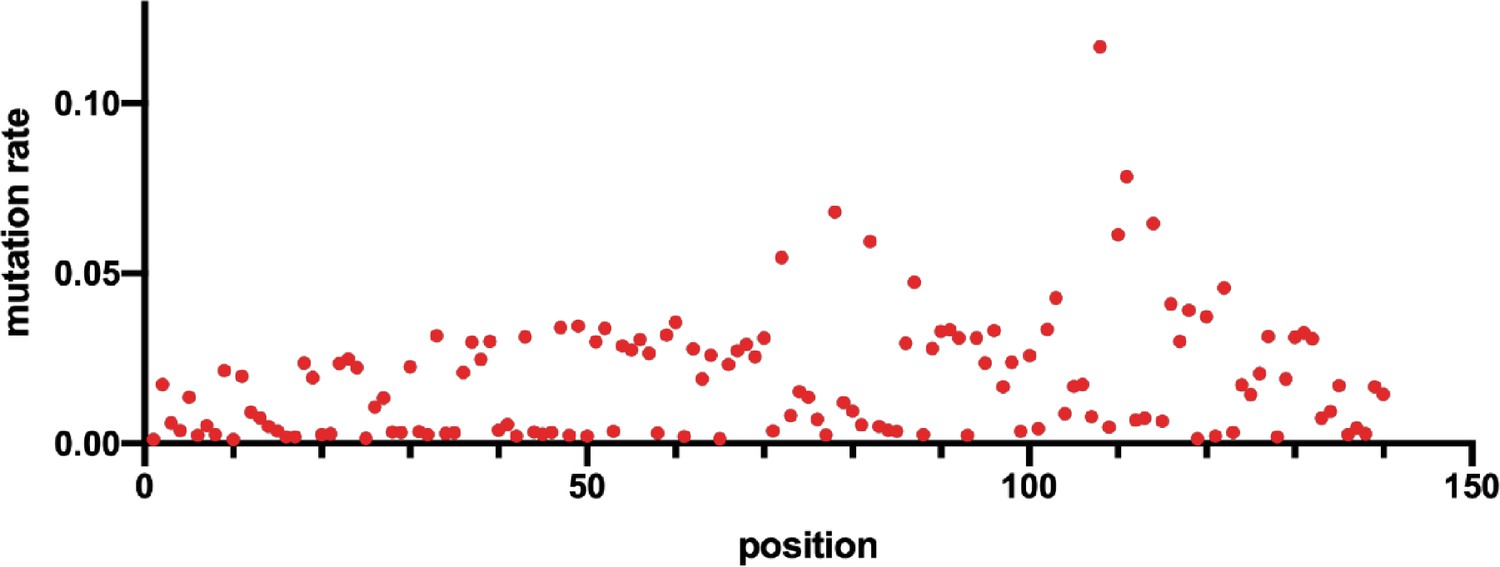
Mutation rates at each nucleotide position of OR4K15 ribozyme.
The mutation rate was calculated as the proportion of mutations observed at each position for the DNA-seq library.
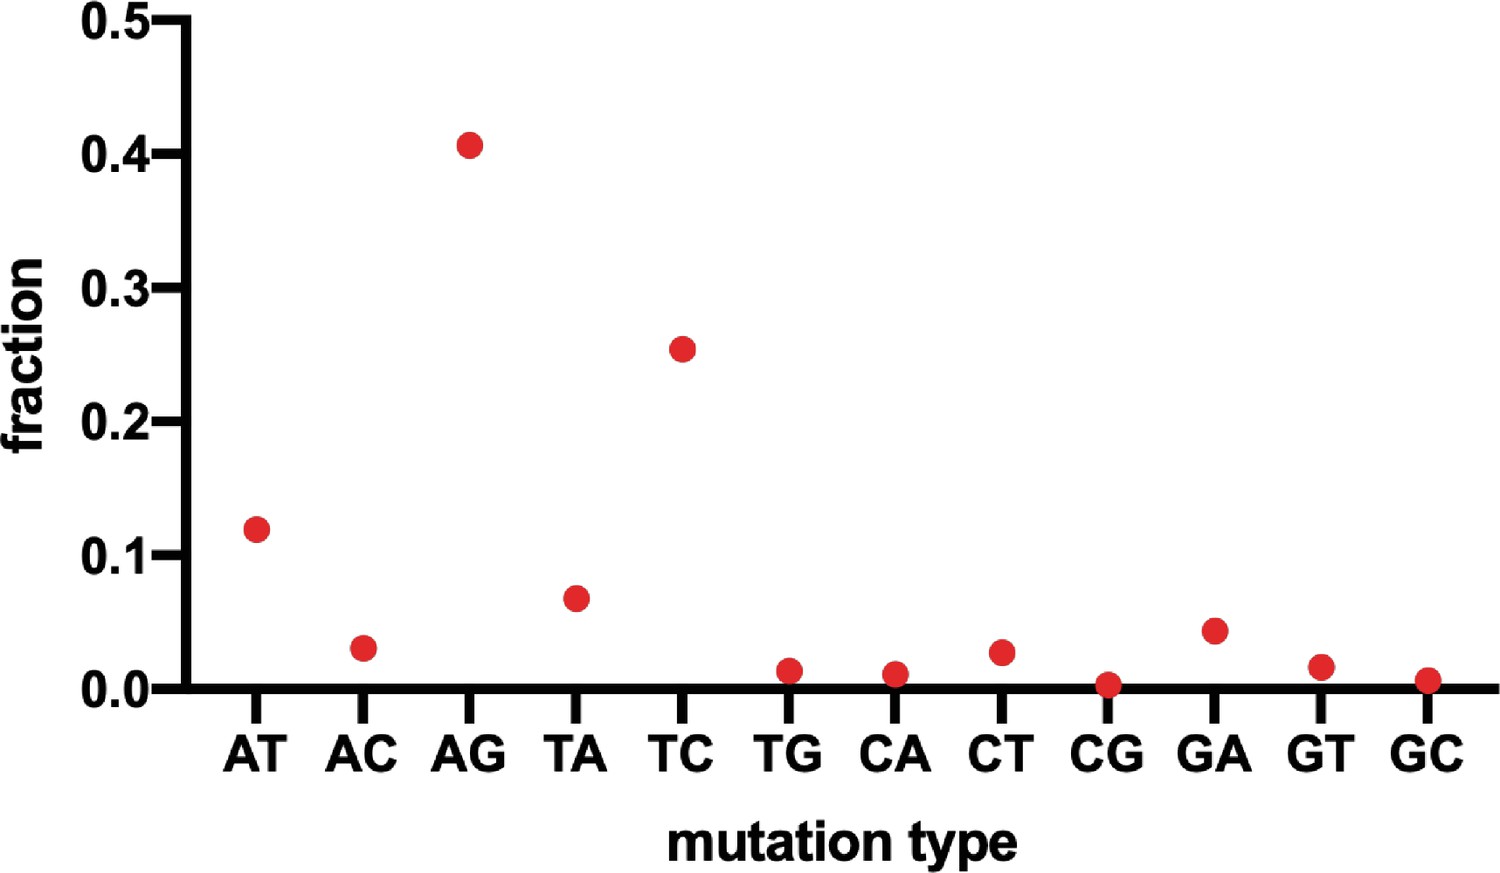
Figure 1—figure supplement 3
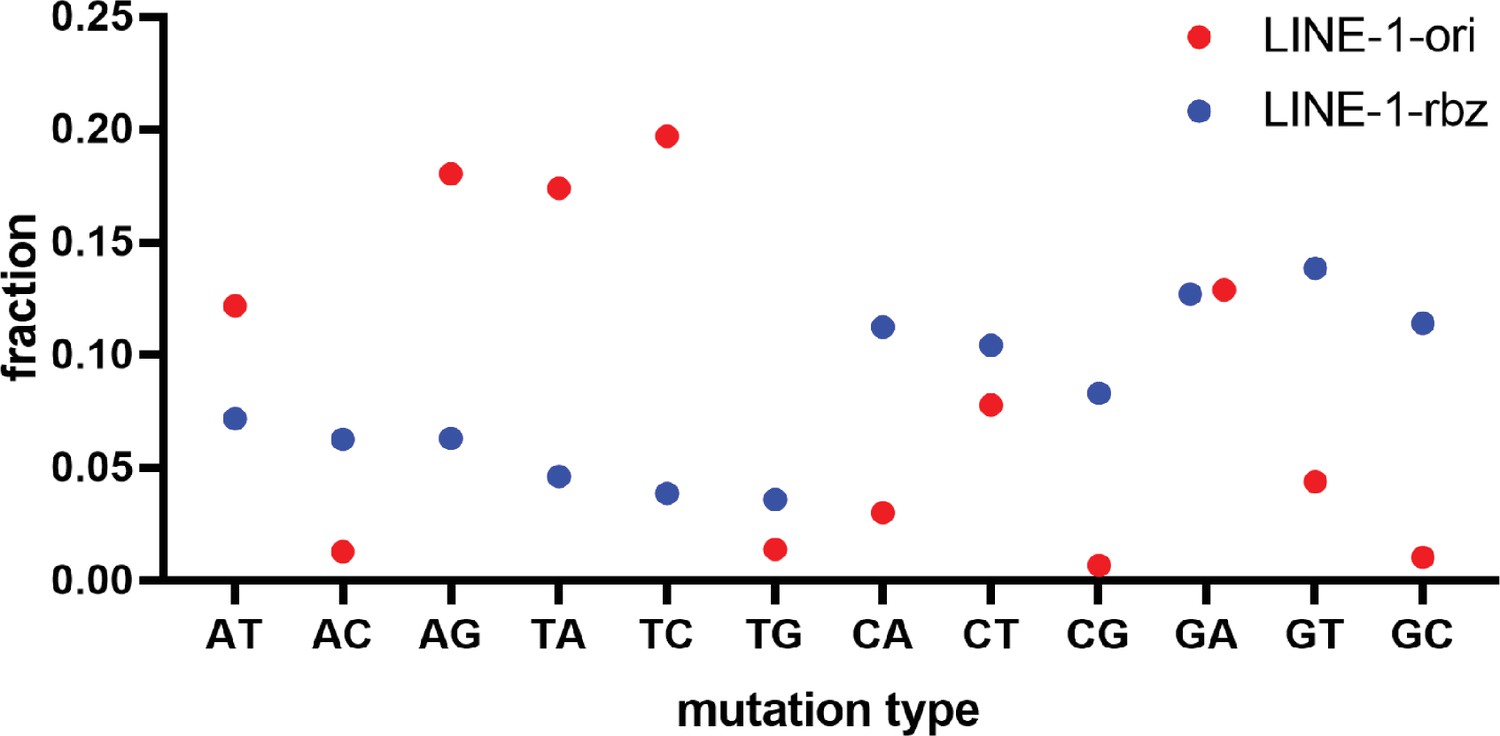
Distribution of different mutation types in deep sequencing result of LINE-1 ribozyme.
The Y axis represents the ratio of each mutation type observed in all variants.
Figure 1—figure supplement 4
Distribution of different mutation types in the deep sequencing result of OR4K15 ribozyme.
The Y axis represents the ratio of each mutation type observed in all variants.
Figure 1—figure supplement 5
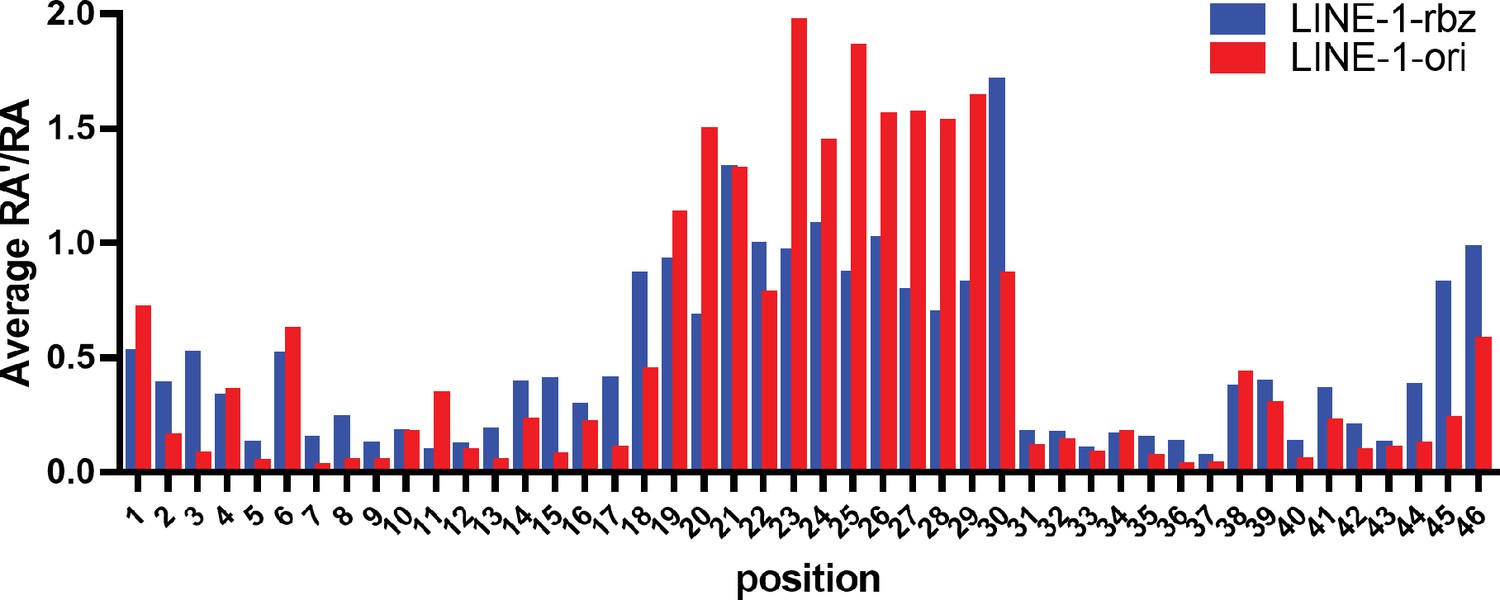
Single mutation-based average RA′ and RA distribution.
Blue, average RA′ for LINE-1-rbz; red, average RA for LINE-1-ori. This RA′ measure is calculated based on the cleaved sequences which were captured by RtcB ligation, while the RA used both cleaved and uncleaved sequences from the RNA-seq data.
Figure 1—figure supplement 6
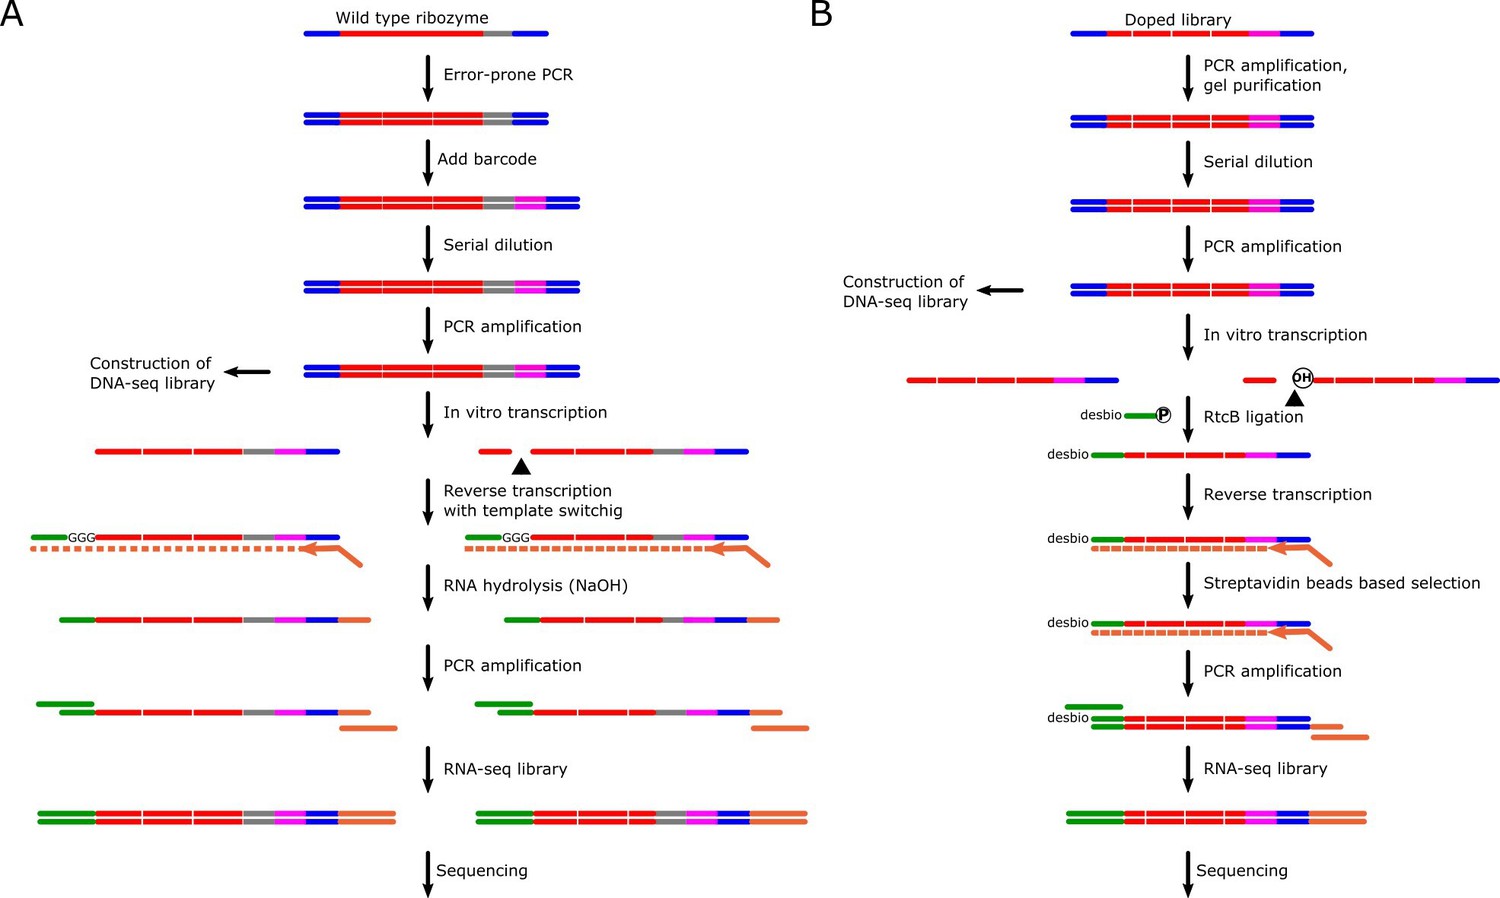
Experimental pipeline of two deep mutational scanning experiments.
Red, ribozyme sequence; blue, T7 promoter and M13F sequence; gray, linker sequence; magenta, barcode sequence; green, template switching oligo and sequencing primer; orange, reverse transcription primer and sequencing primer. (A) The mutation library of the original sequence of LINE-1 ribozyme was generated by error-prone PCR. The RNA-seq library was constructed by using the cDNA synthesized by reverse transcription and template switching. (B) The chemically synthesized doped library was used to construct the mutation library of the contiguous, functional region of LINE-1 ribozyme. RtcB ligase was used to capture 3′ fragment after cleavage, then the ligated product was used to construct the RNA-seq library.
Figure 2
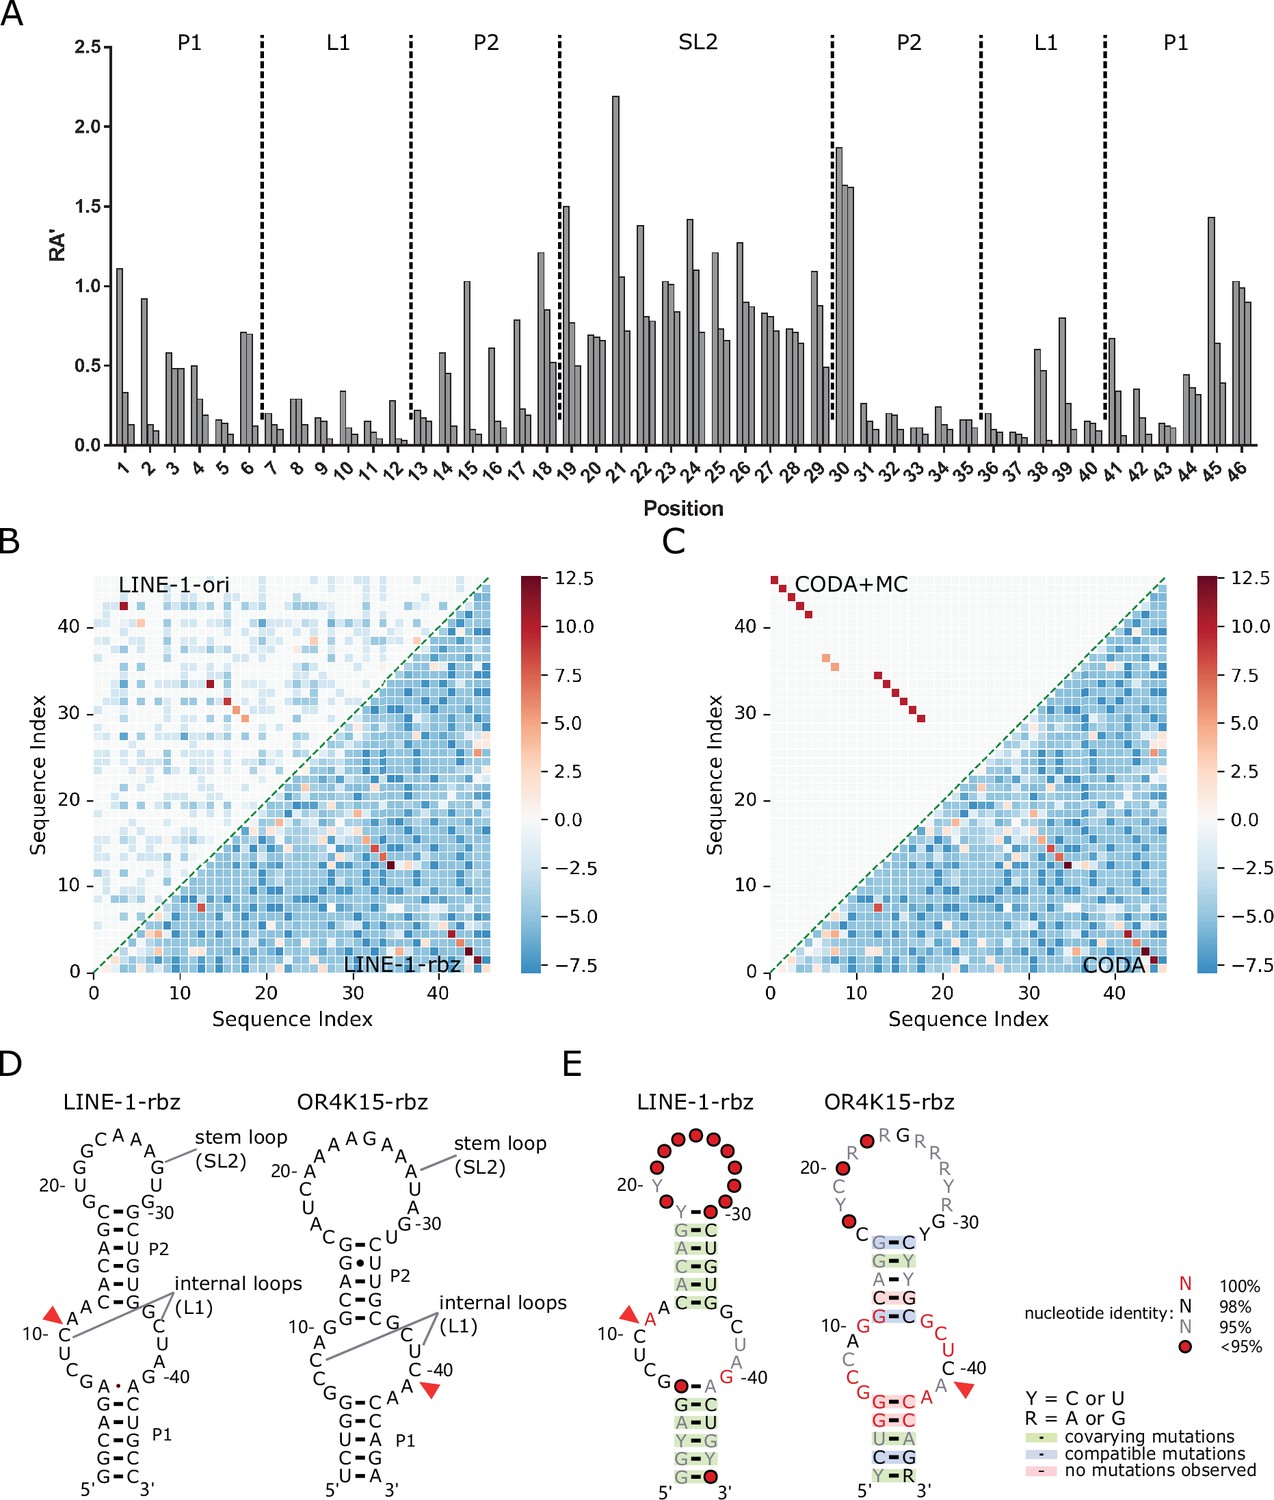
Secondary structures of the functional regions of the LINE-1 and OR4K15 ribozymes.
(A) Relative activity of all mutations at each sequence position of the functional region of LINE-1 ribozyme (LINE-1-rbz). (B) Comparison between the base-pairing maps inferred from covariation-induced deviation of activity (CODA) analysis of deep mutational scanning of the functional region of LINE-1 ribozyme (LINE-1-rbz) (lower triangle) and that from the corresponding region (54–99 nt) in the deep mutational scanning of the original LINE-1 ribozyme (LINE-1-ori) (upper triangle). (C) Comparison between the base-pairing map inferred from LINE-1-rbz deep mutational data by CODA (lower triangle) and that after Monte-Carlo simulated annealing (CODA+MC, upper triangle). (D) Secondary structure model (left: LINE-1-rbz; right: OR4K15-rbz) inferred from the deep mutational scanning result. The red triangles indicate the cleavage sites of ribozymes. (E) Consensus sequence and secondary structure model (left: LINE-1-rbz; right: OR4K15-rbz) based on the alignment of functional mutants with RA′ ≥ 0.5. The red triangles indicate the ribozyme cleavage sites. Positions with conservation of 95%, 98%, and 100% were marked with gray, black, and red nucleotides, respectively; positions in which nucleotide identity is less conserved are represented by circles. Green shading denotes predicted base pairs supported by covariation. R and Y denote purine and pyrimidine, respectively.
Figure 3 with 5 supplements
Homology-modeled structures of the bimolecular LINE-1-core and OR4K15-core.
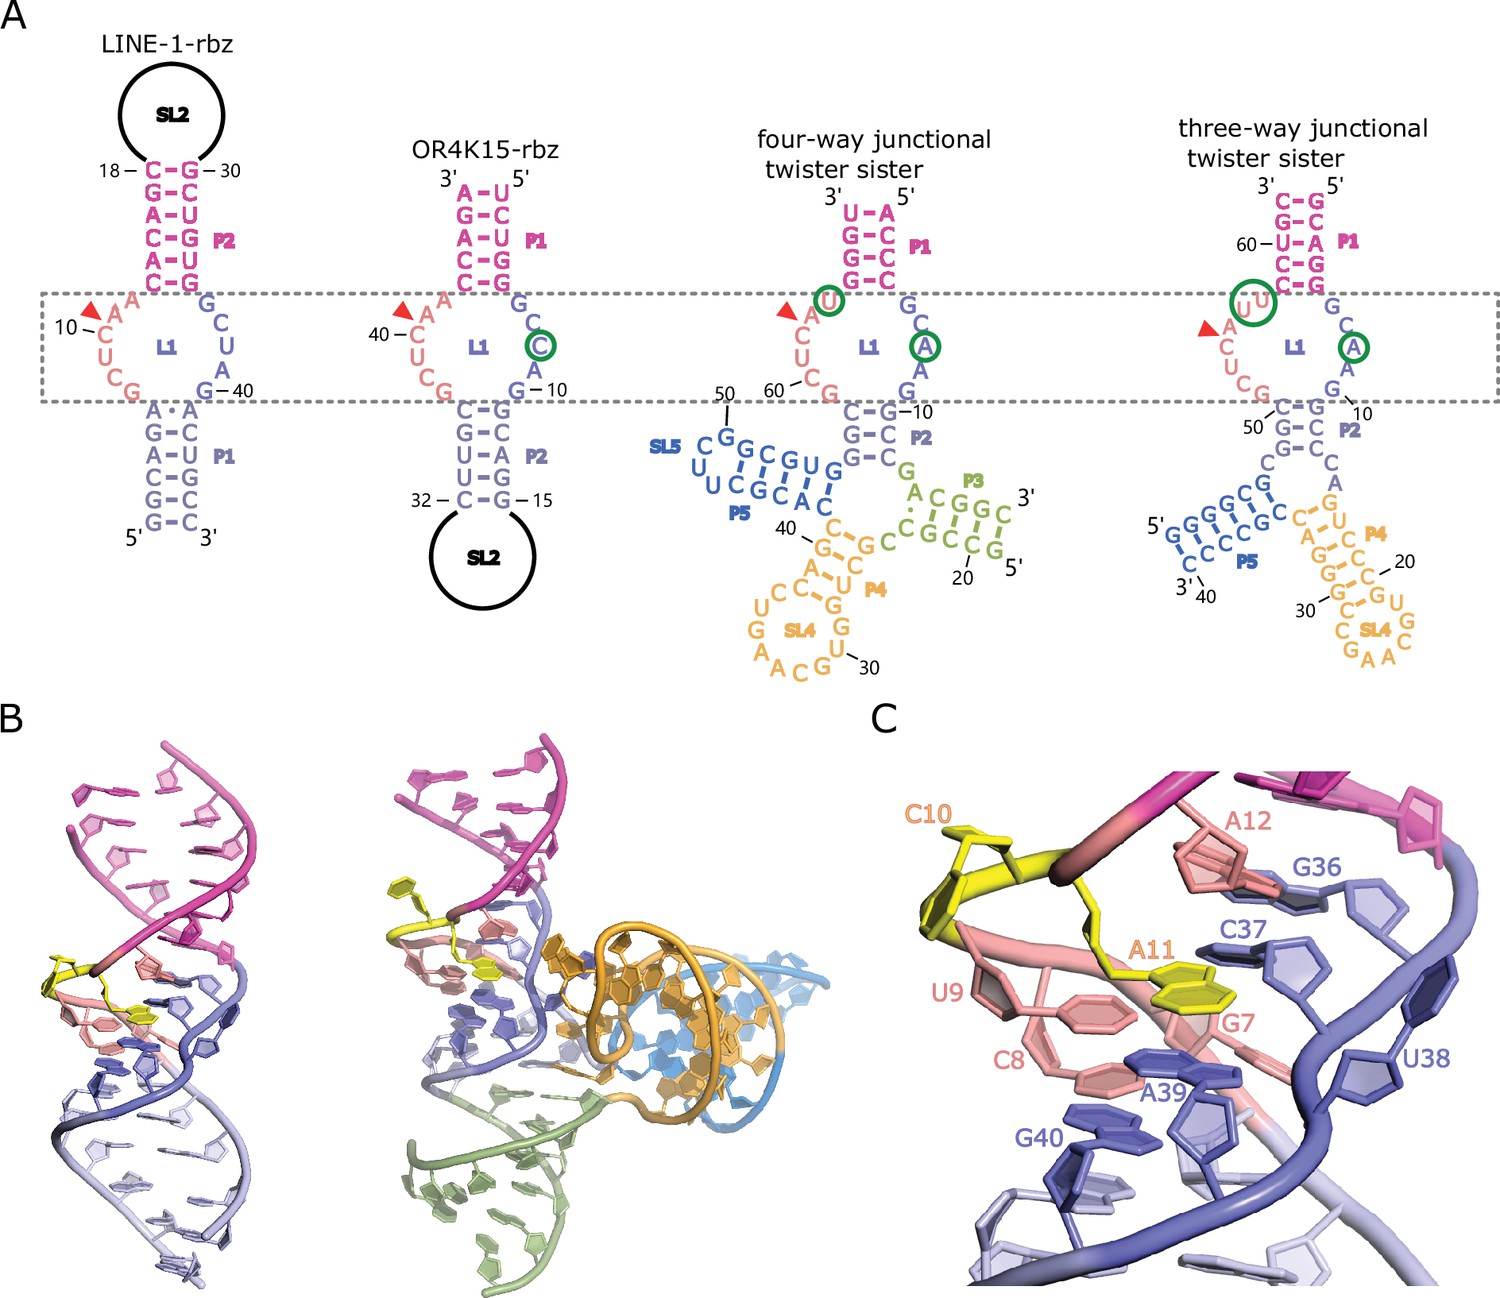
(A) Comparison between the secondary structure of LINE-1-rbz, OR4K15-rbz, four-way (PDB ID: 5Y87) and three-way junctional twister-sister ribozyme (PDB ID: 5T5A) reveals strikingly similar internal loops surrounding the cleavage sites (red triangles) with few nucleotide differences at each side of the internal loops L1. (B) A cartoon view of the homology-modeled structure of LINE-1-core (left) and four-way junctional twister-sister ribozyme (PDB ID: 5Y87) (right). (C) A detailed view of the catalytic core L1 of LINE-1-core in cartoon representation.
Figure 3—figure supplement 1

Structural patterns used for pattern-based similarity search.
(A) Structure descriptor for LINE-1-rbz. (B) Structure descriptor for OR4K15-rbz.
Figure 3—figure supplement 2
Homology-modeled structure of the bimolecular LINE-1-core.
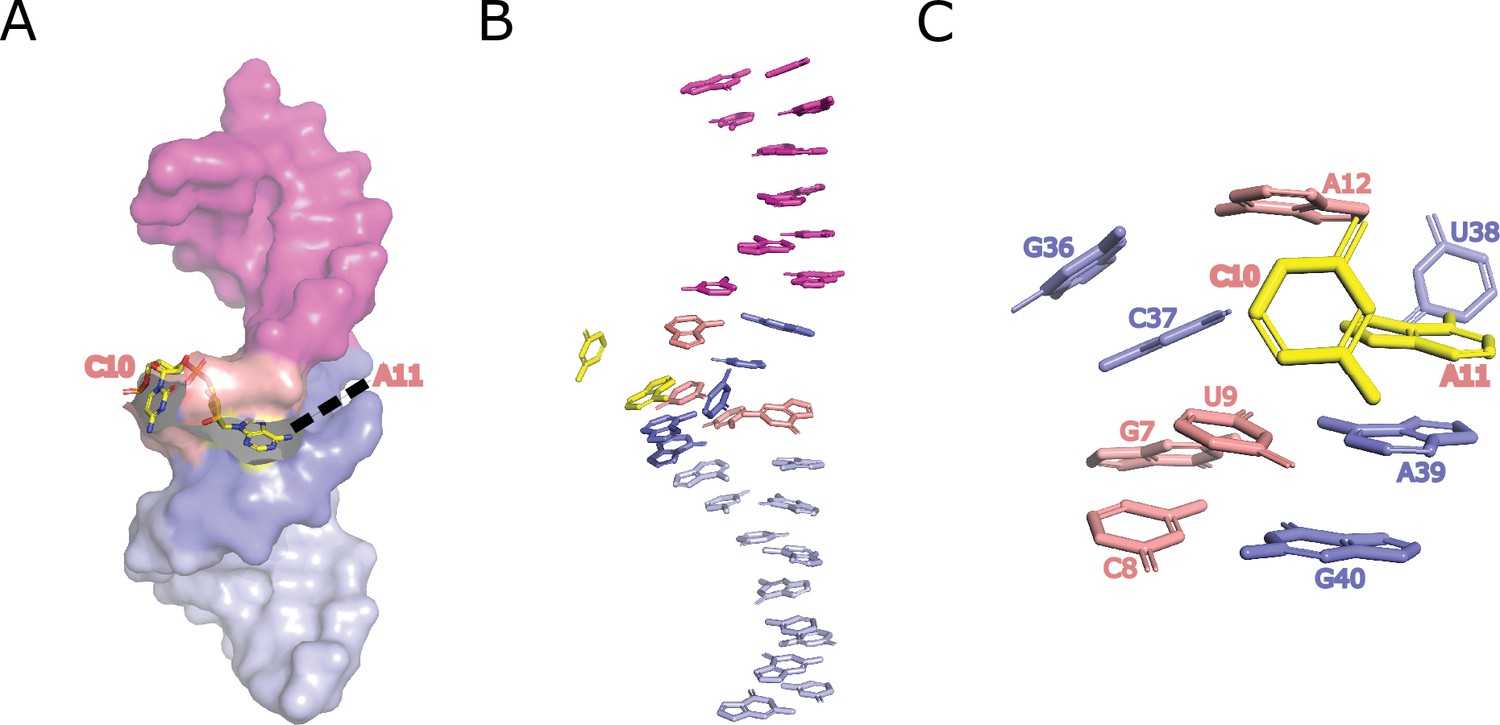
(A) The structure of LINE-1-core in a surface representation, except for the C10-A11 site, which is shown in a stick representation. (B) Continuous stacking of stems P1 and P2. (C) Stacking interactions in loop L1 region.
Figure 3—figure supplement 3
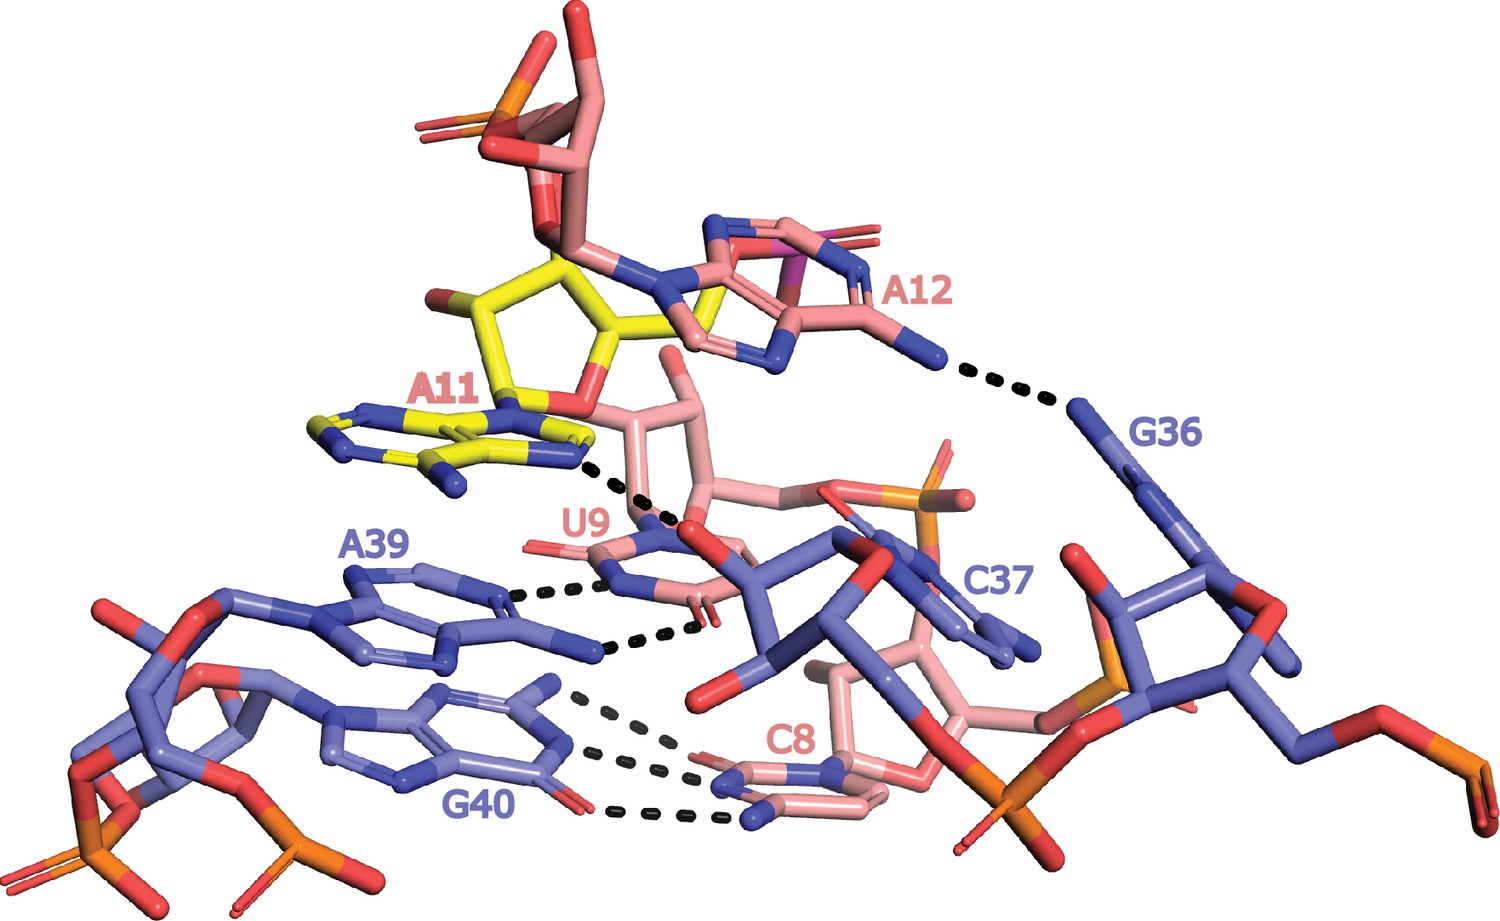
Base-pairing interactions in loop L1 of LINE-1-core that extend the stems P1 and P2.
Figure 3—figure supplement 4
Homology modeled structure of the bimolecular OR4K15-core.
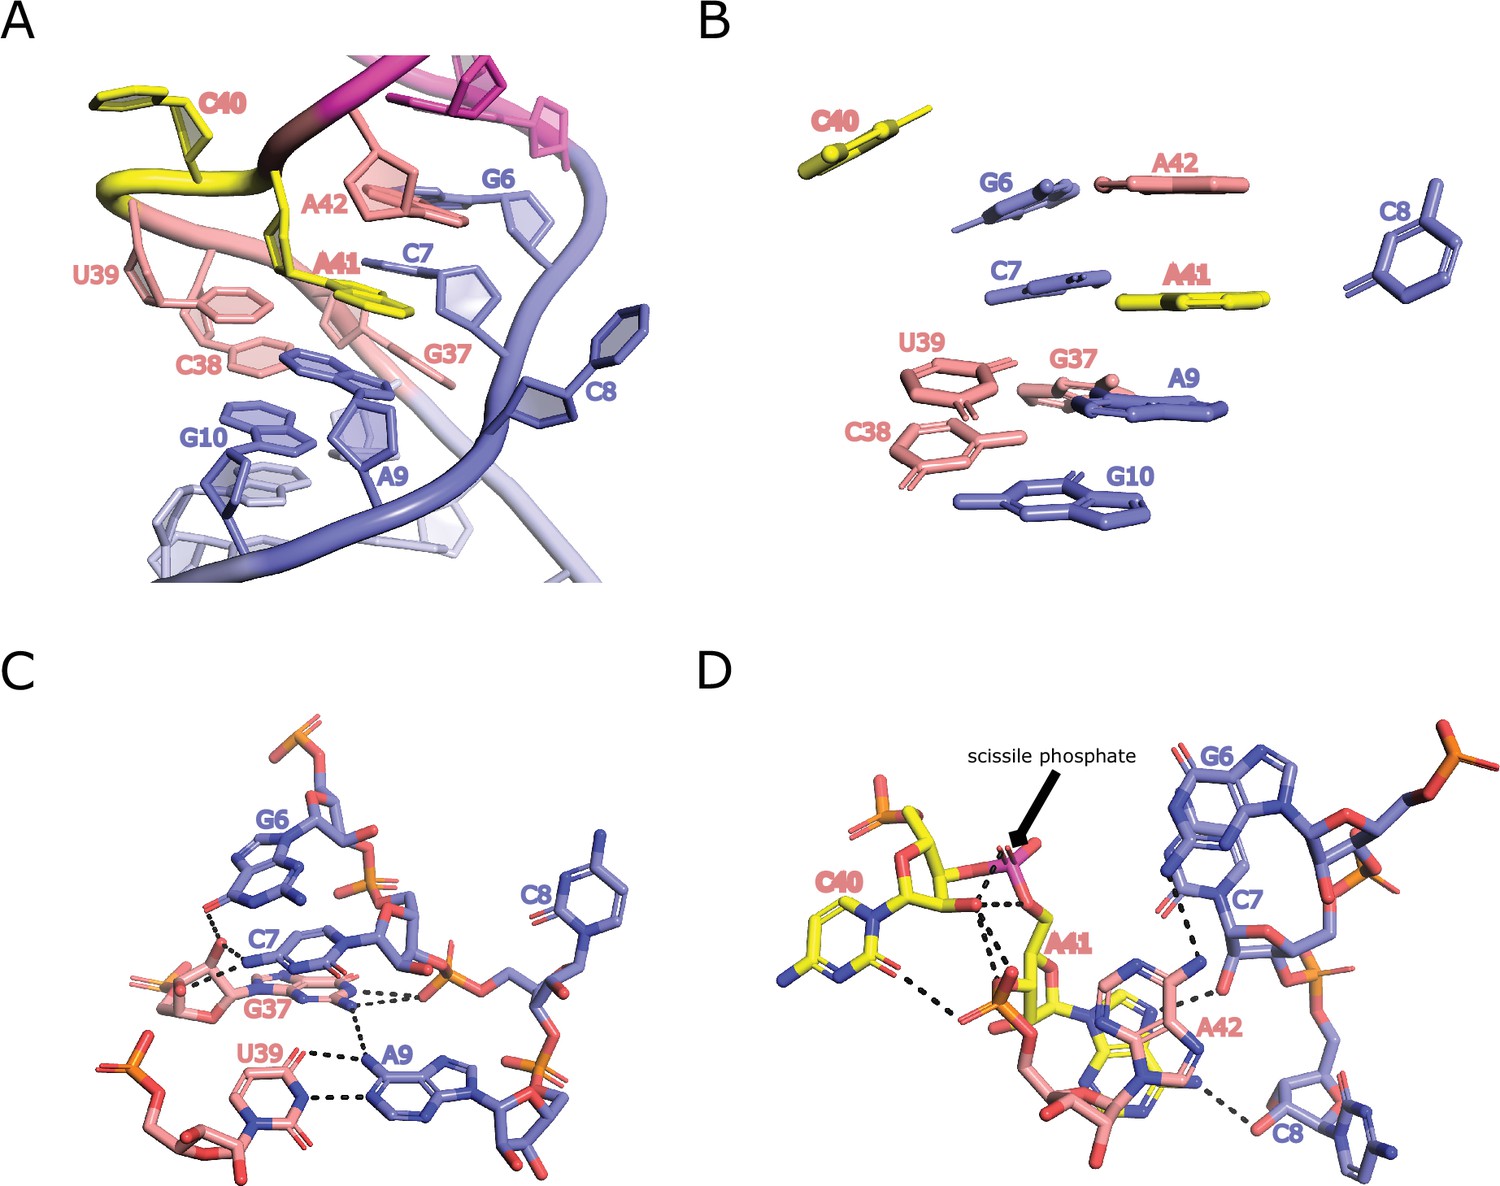
(A) A detailed view of the interactions in loop L1 of OR4K15-core. (B) Stacking interactions in loop L1 region. (C) The network of H-bonding interactions involving G37. (D) Intermolecular contacts at the C40-A41 cleavage site in the modeled structure. The scissile phosphate is colored magenta.
Figure 3—figure supplement 5
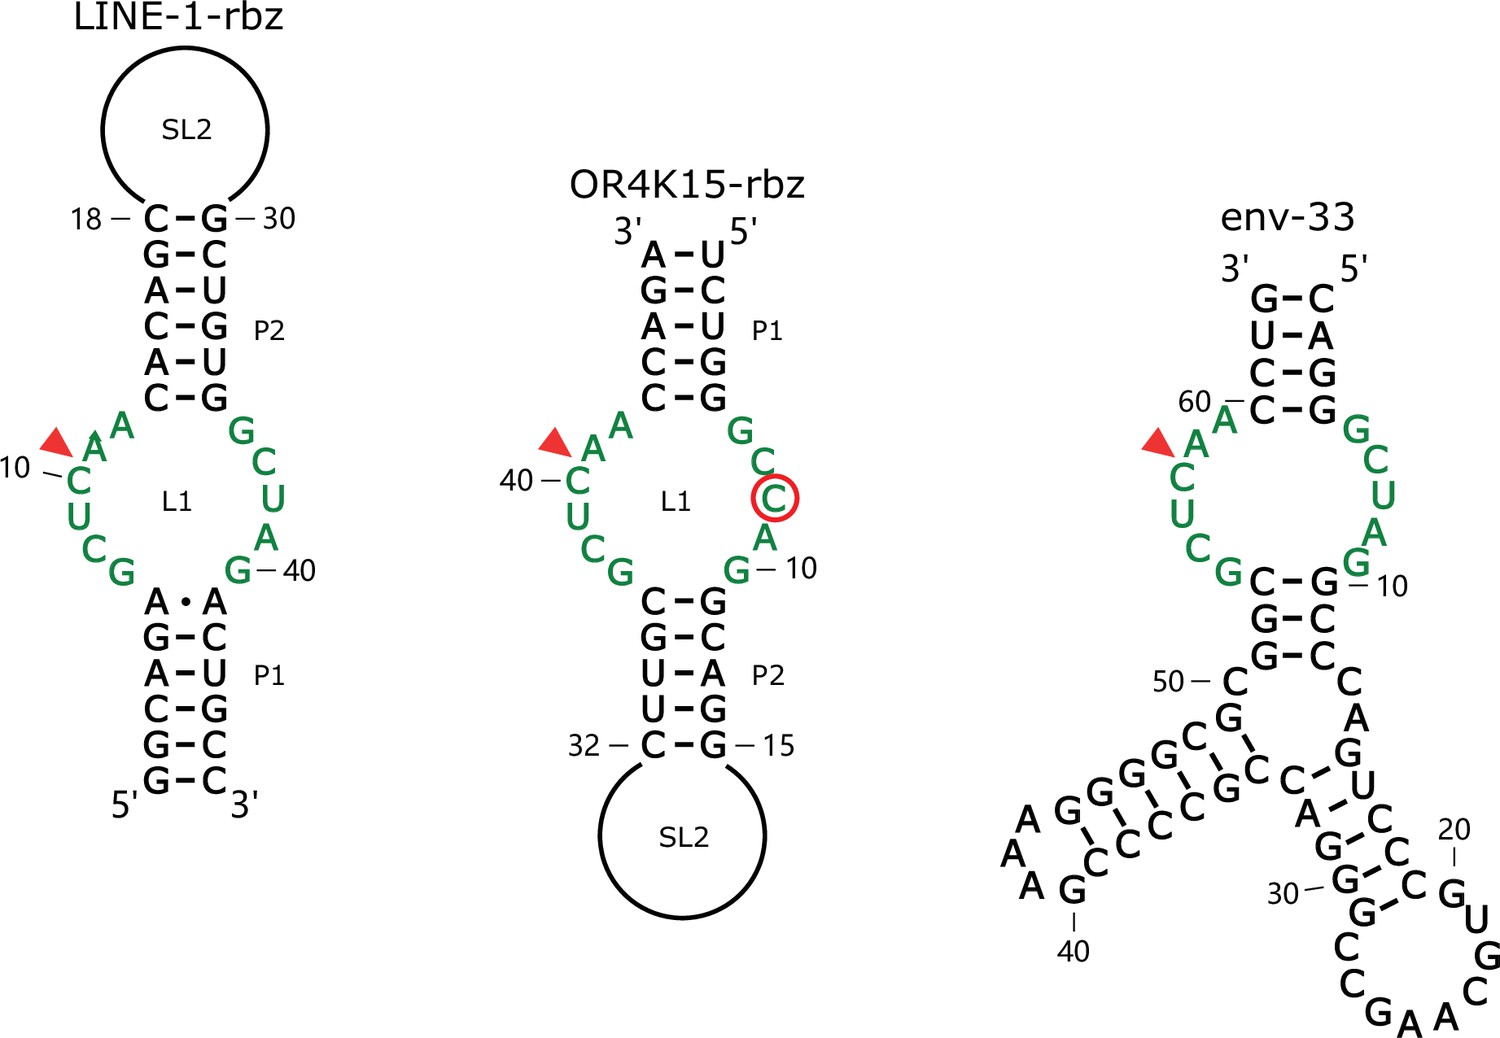
Comparison between the secondary structure of LINE-1-rbz, OR4K15-rbz, and predicted secondary structure of the env-33 sequence from the multiple-sequence alignment of the twister sister ribozyme.
Figure 4
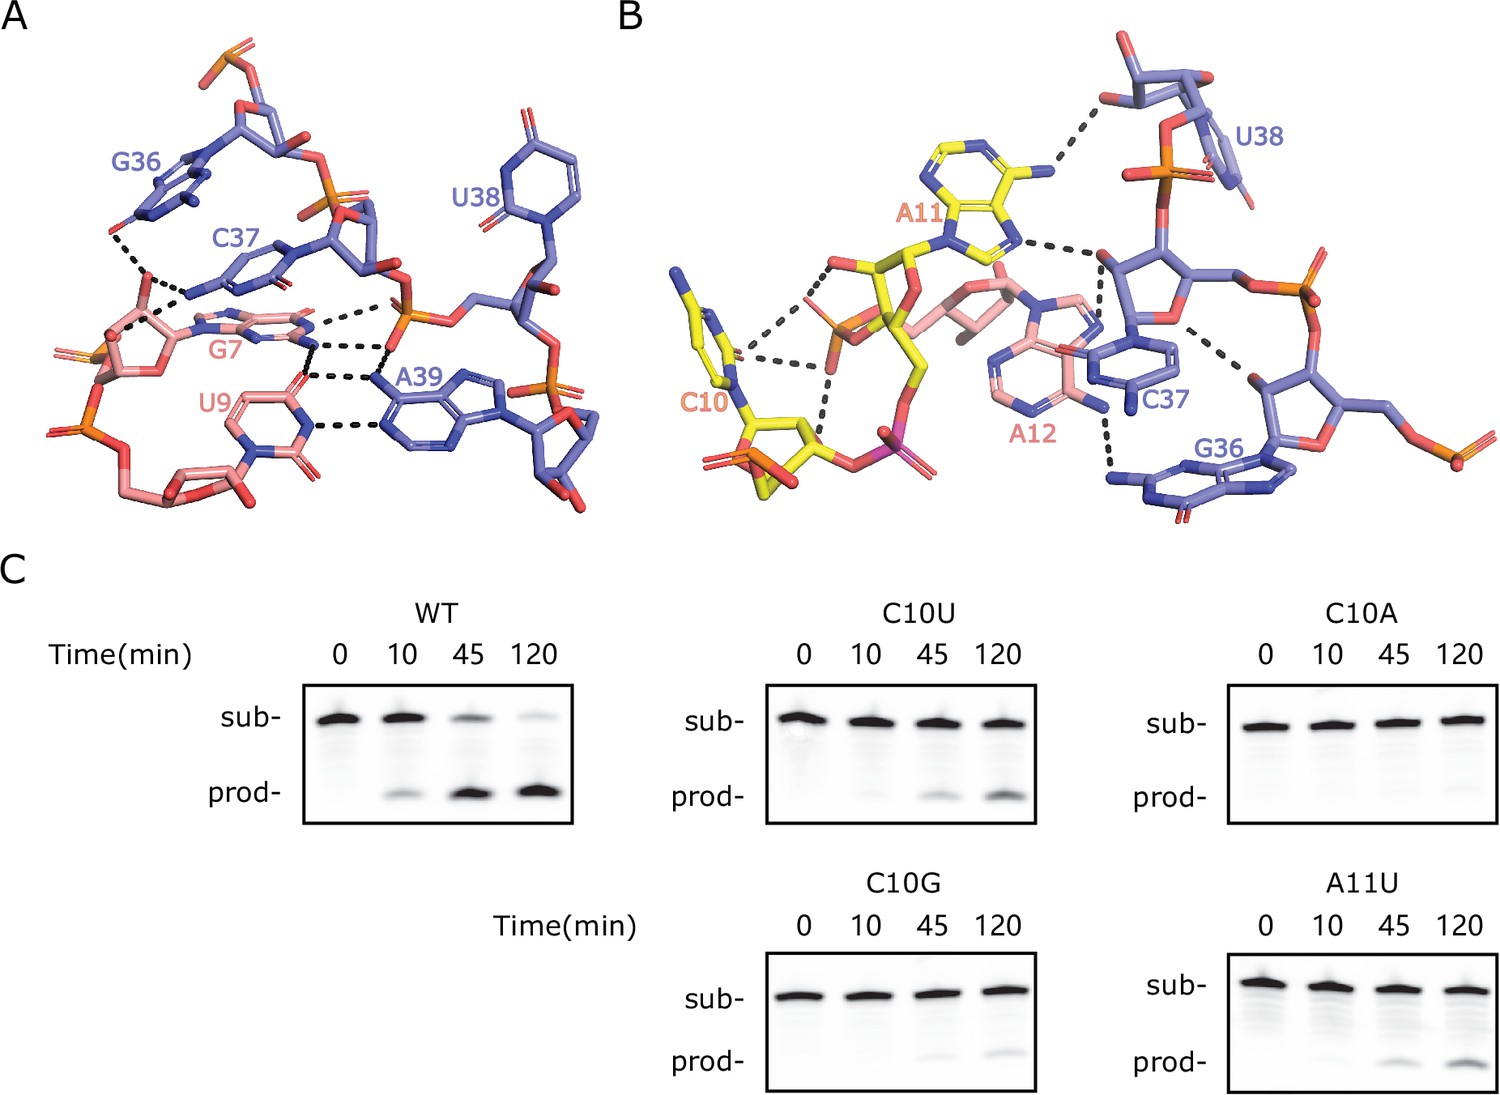
Special features of the homology-modeled LINE-1-core structure.
(A) The network of H-bonding interactions involving G7. (B) Intermolecular contacts at the C10-A11 cleavage site in the modeled structure. The scissile phosphate is colored magenta. (C) PAGE analysis of the cleavage activity of wild-type (WT) and mutants C10U, C10G, C10A, and A11U.
-
Figure 4—source data 1
Original files for PAGE analysis displayed in Figure 4C.
- https://cdn.elifesciences.org/articles/90254/elife-90254-fig4-data1-v1.zip
-
Figure 4—source data 2
Original files for PAGE analysis displayed in Figure 4C, with the relevant bands labeled.
- https://cdn.elifesciences.org/articles/90254/elife-90254-fig4-data2-v1.zip
Figure 5 with 5 supplements
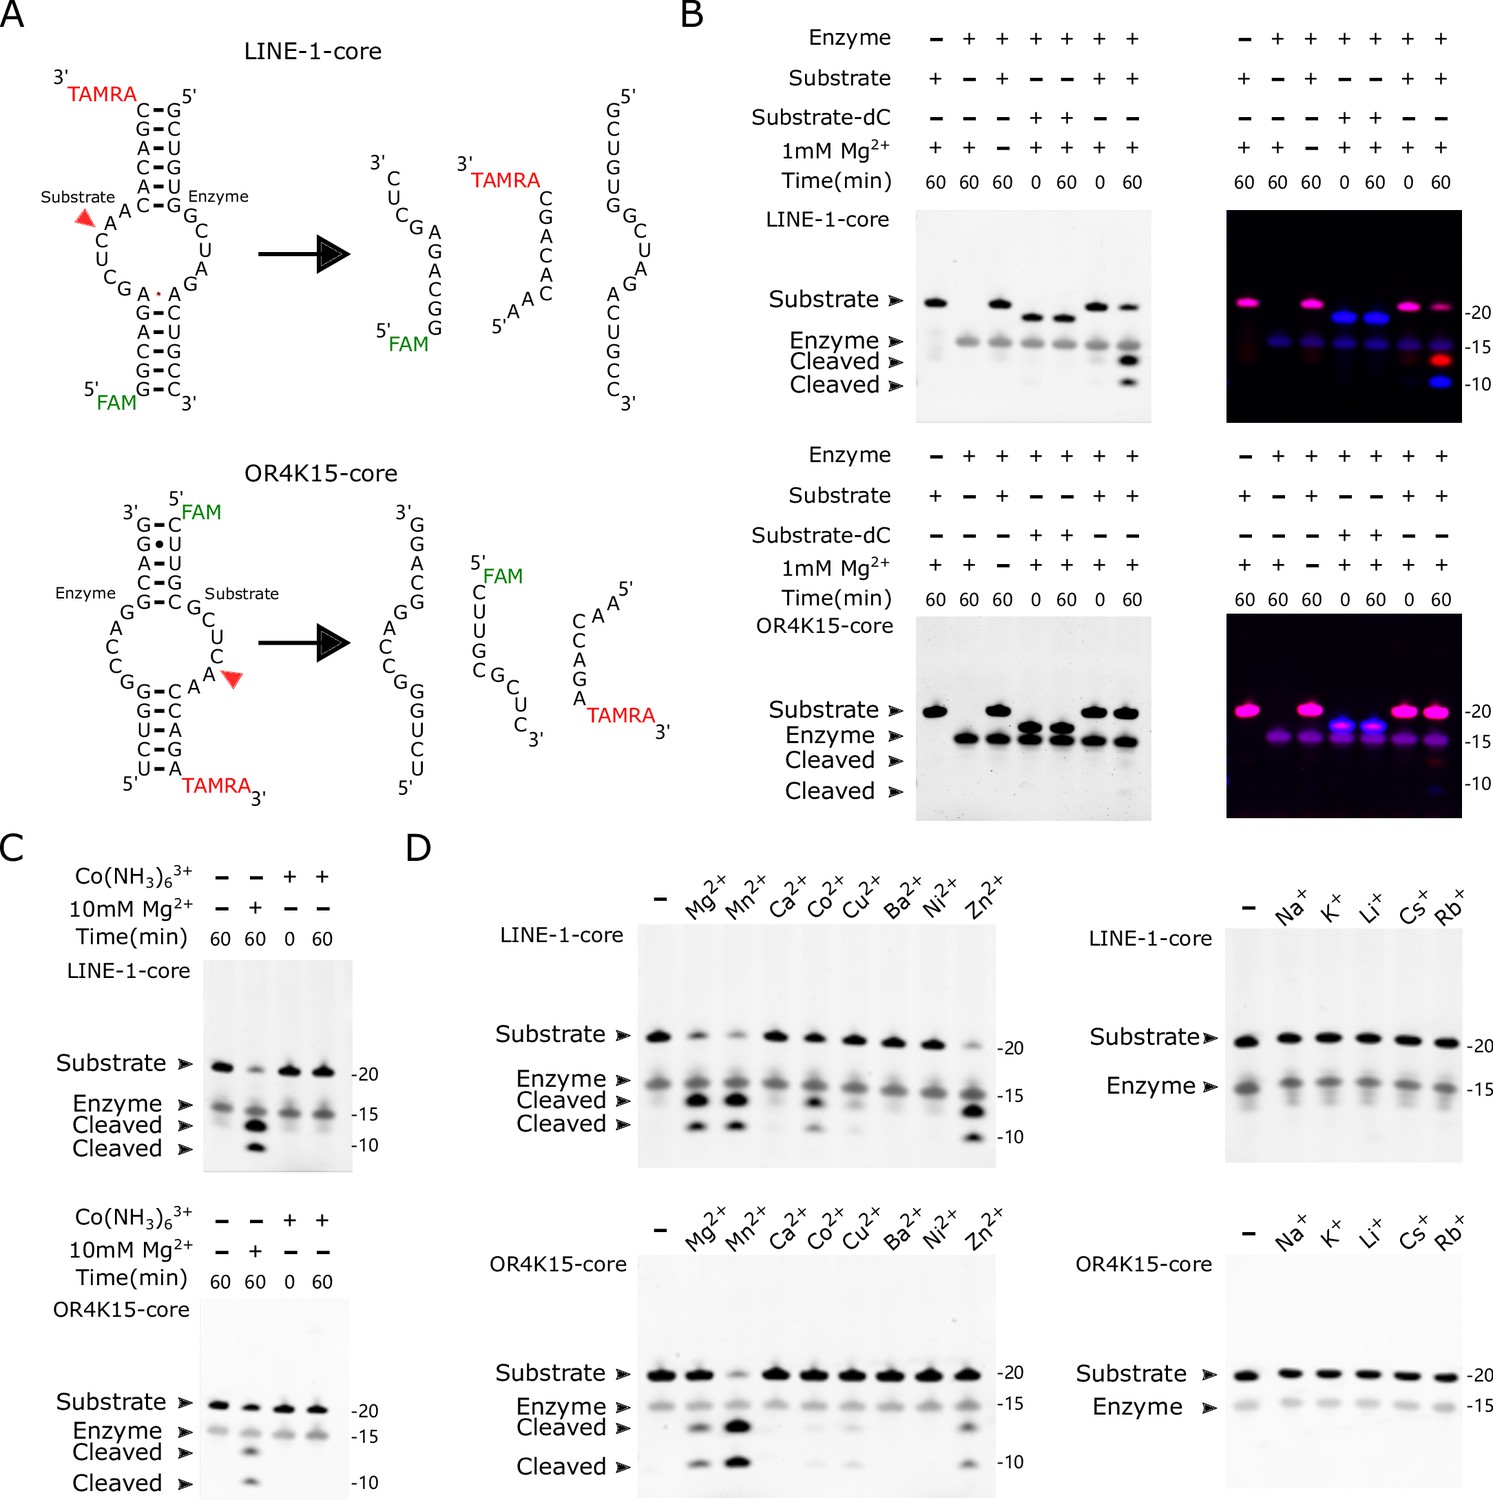
Biochemical assays of LINE-1-core and OR4K15-core.
(A) (Top) The components of the bimolecular construct of LINE-1-core during cleavage, substrate strand (54–71) and enzyme strand (83–99). (Bottom) The components of the bimolecular construct of OR4K15-core during cleavage, the enzyme strand (70–84) and substrate strand (101–116). The red arrowhead indicates the cleavage site. (B) PAGE-based cleavage assays of the bimolecular construct with the all-RNA substrate and a substrate analog (dC) wherein a 2′-deoxycytosine is substituted for the cytosine ribonucleotide at position 10 or 40 of the substrate RNA. The substrate RNA was incubated with the enzyme RNA at 37°C for 1 hr in the presence (+) or absence (−) of 1 mM MgCl2. The single-channel fluorescent images (left) were generated by using UV excitation (302 nm) and 590/110 nm emission on the ChemiDoc MP imaging system. The multi-channel fluorescent images (right) are overlays of two scans. They were generated from the ChemiDoc MP imaging system (Bio-Rad), Fluorescein (excitation: Epi-Blue 460–490 nm, emission: 532/28) for FAM, Cy3 (excitation: Epi-Green 520–545 nm, emission: 602/50) for TAMRA. (C) Cleavage assays in the absence (−) or presence of cobalt hexammine chloride [Co(NH3)6Cl3] or MgCl2 at 5 mM for 1 hr. (D) Cleavage assays at 37°C for 1 hr, in the absence (−) or presence (+) of various metal ions. Divalent metal ions (left) were used at a final concentration of 1 mM, and monovalent metal ions (right) were used at a final concentration of 1 M.
-
Figure 5—source data 1
Original files for PAGE analysis displayed in Figure 4C.
- https://cdn.elifesciences.org/articles/90254/elife-90254-fig5-data1-v1.zip
-
Figure 5—source data 2
Original files for PAGE analysis displayed in Figure 4C, with the relevant bands labeled.
- https://cdn.elifesciences.org/articles/90254/elife-90254-fig5-data2-v1.zip
Figure 5—figure supplement 1
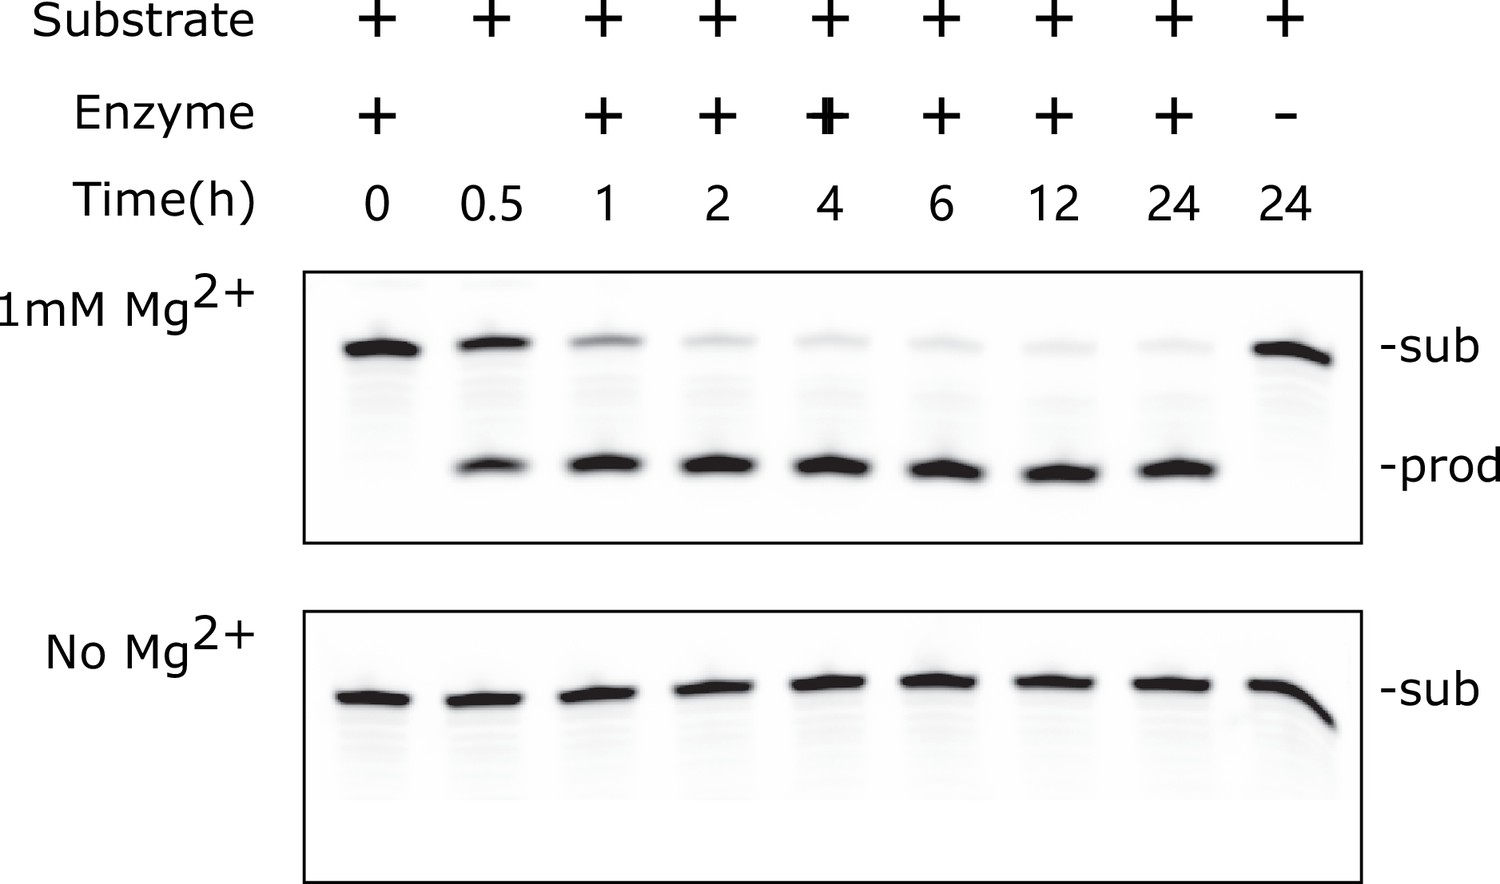
PAGE-based cleavage assay of LINE-1-core in a 24-hr range.
-
Figure 5—figure supplement 1—source data 1
Original files for PAGE analysis displayed in Figure 1.
- https://cdn.elifesciences.org/articles/90254/elife-90254-fig5-figsupp1-data1-v1.zip
-
Figure 5—figure supplement 1—source data 2
Original files for PAGE analysis displayed in Figure 1, with the relevant bands labeled.
- https://cdn.elifesciences.org/articles/90254/elife-90254-fig5-figsupp1-data2-v1.zip
Figure 5—figure supplement 2
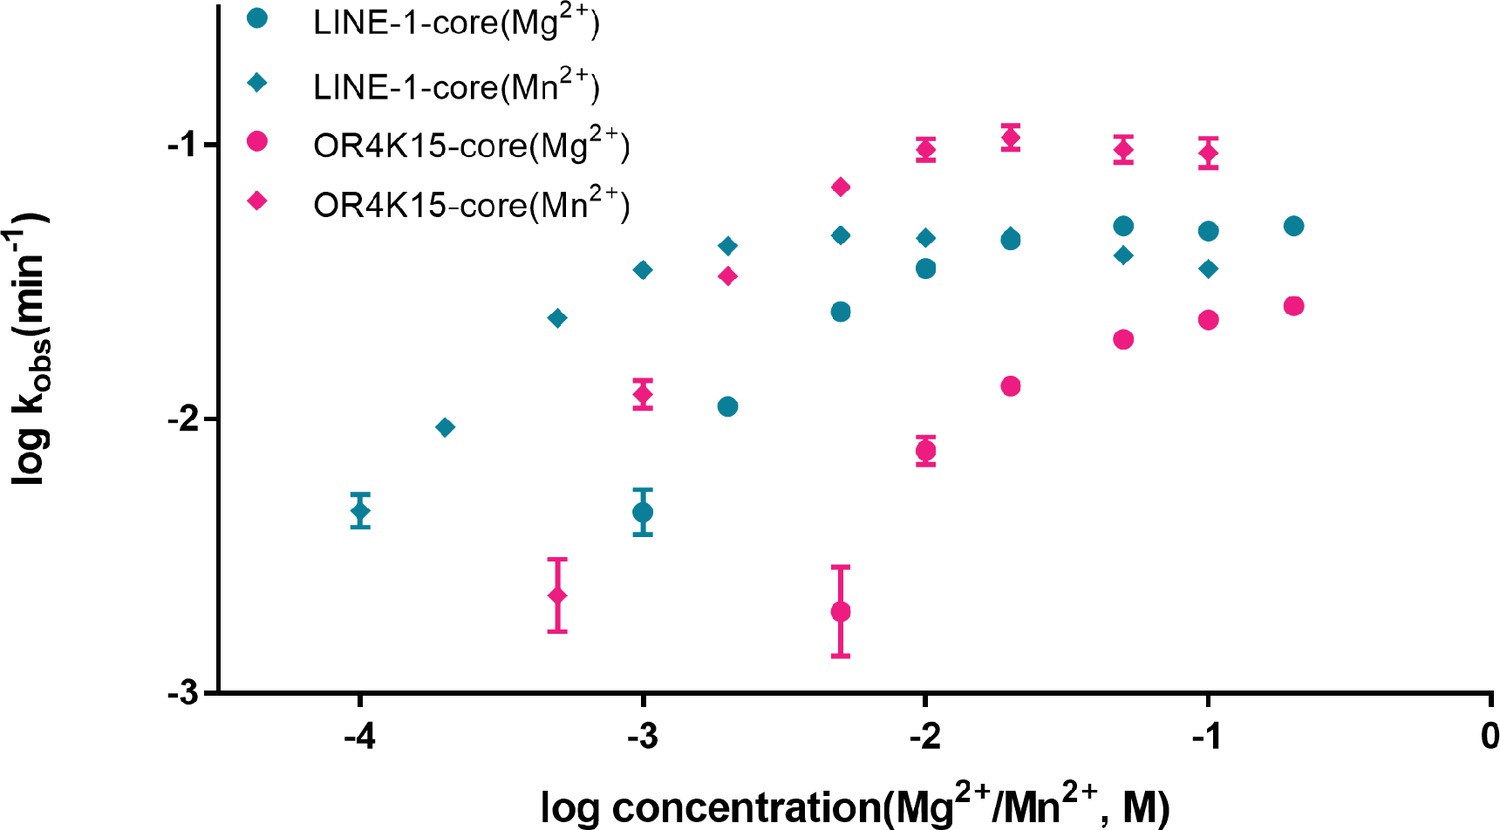
The dependence of two twister sister-like (TS-like) ribozymes’ rate constants on Mg2+/Mn2+ concentration.
Figure 5—figure supplement 3

A representative time course for the bimolecular ribozyme construct LINE-1-core under the conditions indicated as used for determining kobs values.
Figure 5—figure supplement 4
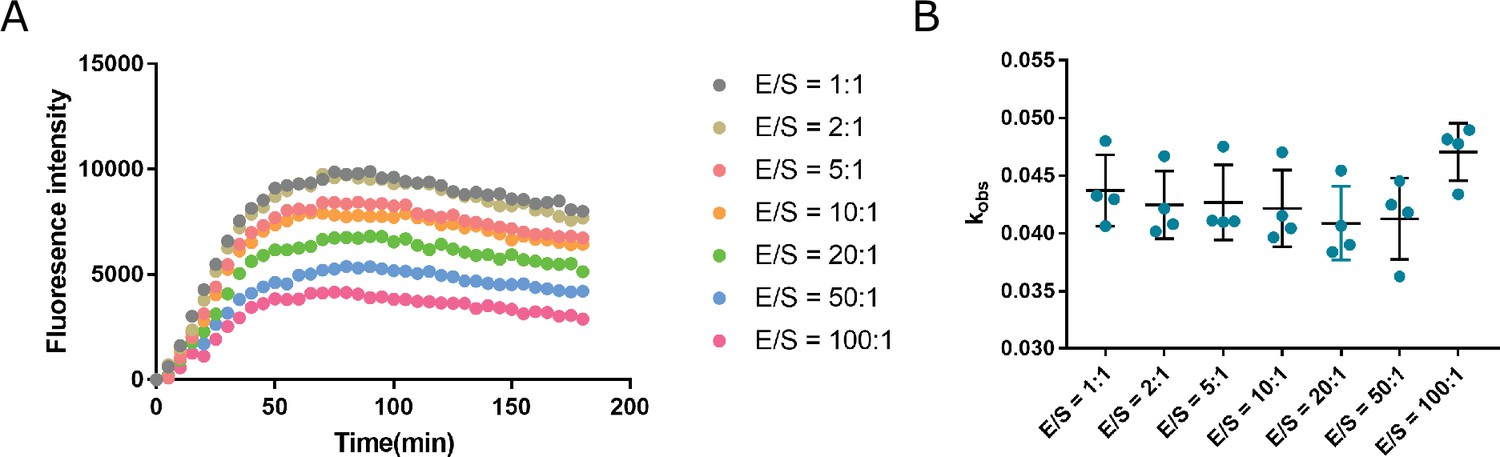
The bimolecular ribozyme construct LINE-1-core with different E/S ratios (molar ratio between the enzyme strand and the substrate strand) for determining kobs values.
The final concentrations for the reaction solution were 20 mM Tris–HCl buffer (pH 7.5 at 23°C), 100 mM KCl, and 10 mM MgCl2. (A) An example of the time course assay for ribozyme cleavage. (B) The distribution of kobs values measured using different E/S ratios.
Figure 5—figure supplement 5
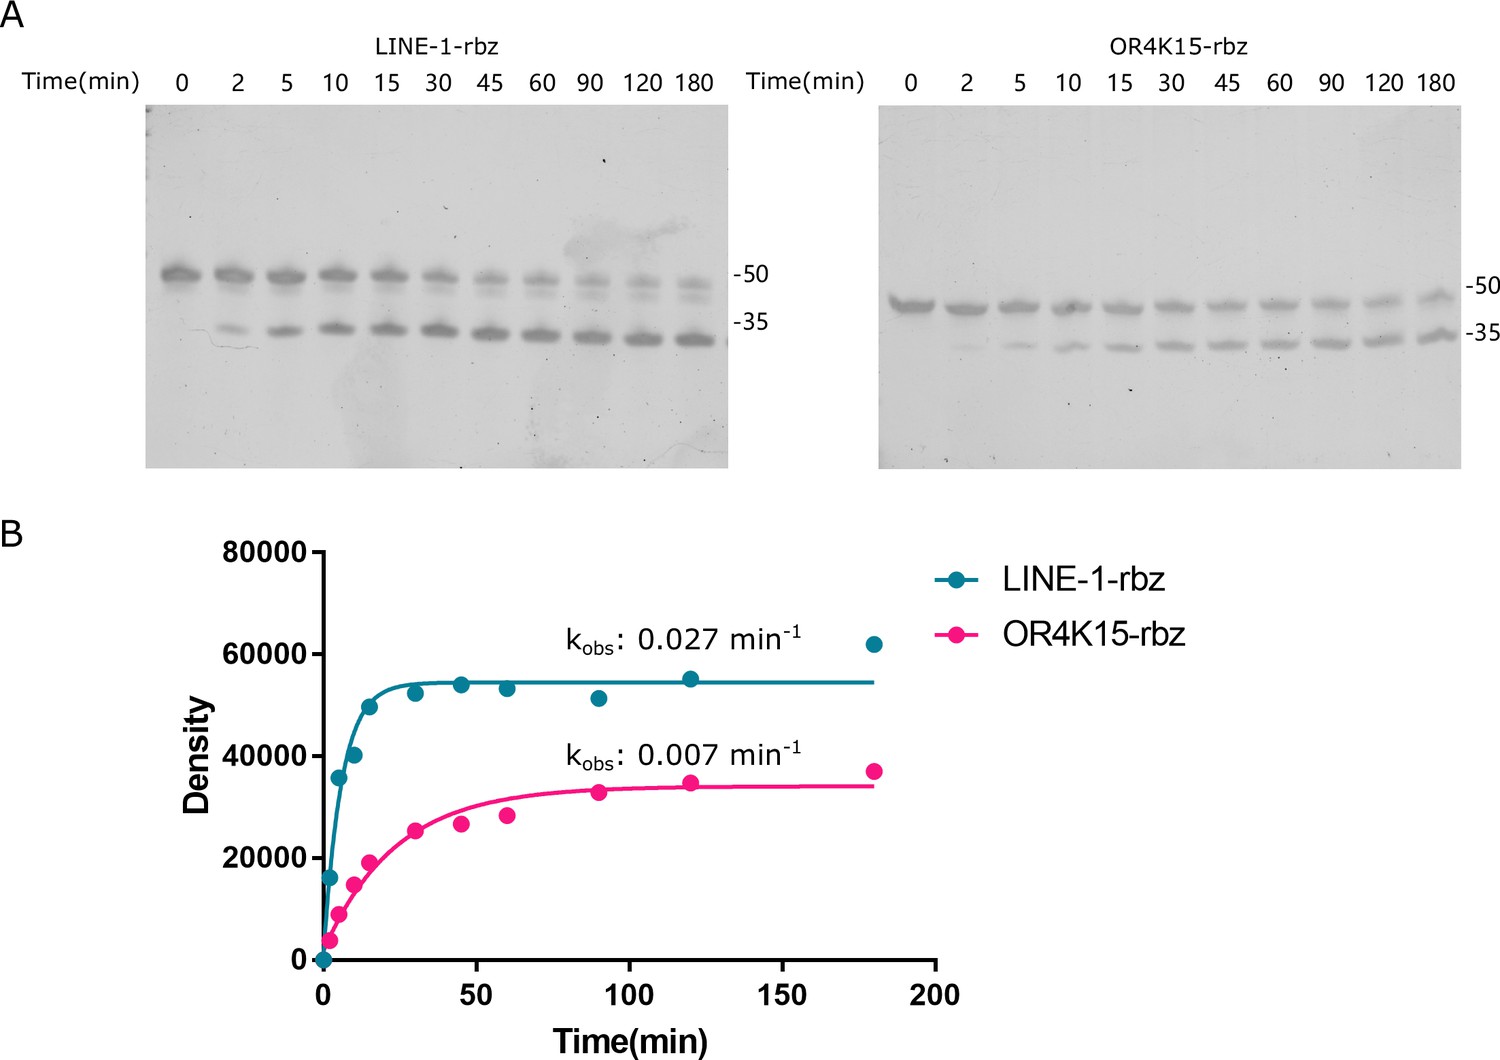
Kinetic analysis using the single-stranded LINE-1-rbz and OR4K15-rbz.
The final concentrations for the reaction solution were 20 mM Tris–HCl buffer (pH 7.5 at 23°C), 100 mM KCl, and 10 mM MgCl2. (A) The time course assay for ribozyme cleavage. (B) Kinetic analysis based on the band intensity.
-
Figure 5—figure supplement 5—source data 1
Original files for PAGE analysis displayed in Figure 5.
- https://cdn.elifesciences.org/articles/90254/elife-90254-fig5-figsupp5-data1-v1.zip
-
Figure 5—figure supplement 5—source data 2
Original files for PAGE analysis displayed in Figure 5, with the relevant bands labeled.
- https://cdn.elifesciences.org/articles/90254/elife-90254-fig5-figsupp5-data2-v1.zip
Figure 6 with 1 supplement

Homologous sequences of the two twister sister-like (TS-like) ribozymes.
(A) Genomic locations of the sequences with the highest similarity to the LINE-1-rbz (left) and OR4K15-rbz (right). (B) The distribution of LINE-1-rbz homologs in different LINE-1 subfamilies of the human genome assembly (hg38). (C) Genomic locations of OR4K15-rbz homologs. (D) Nucleotide compositions of LINE-1-rbz homologs found in the human genome. (E) Sequence alignment (left) and PAGE result (right) of four LINE-1-rbz homologs. (F) Sequence alignment (left) and PAGE result (right) of four OR4K15-rbz homologs. OR_c1, OR_c2, and OR_c3 correspond to the three homologs (from top to bottom) shown in (C).
-
Figure 6—source data 1
Original files of the full raw unedited gels displayed in Figure 6.
- https://cdn.elifesciences.org/articles/90254/elife-90254-fig6-data1-v1.zip
-
Figure 6—source data 2
Figures with the uncropped gels displayed in Figure 6, with the relevant bands labelled.
- https://cdn.elifesciences.org/articles/90254/elife-90254-fig6-data2-v1.zip
Figure 6—figure supplement 1
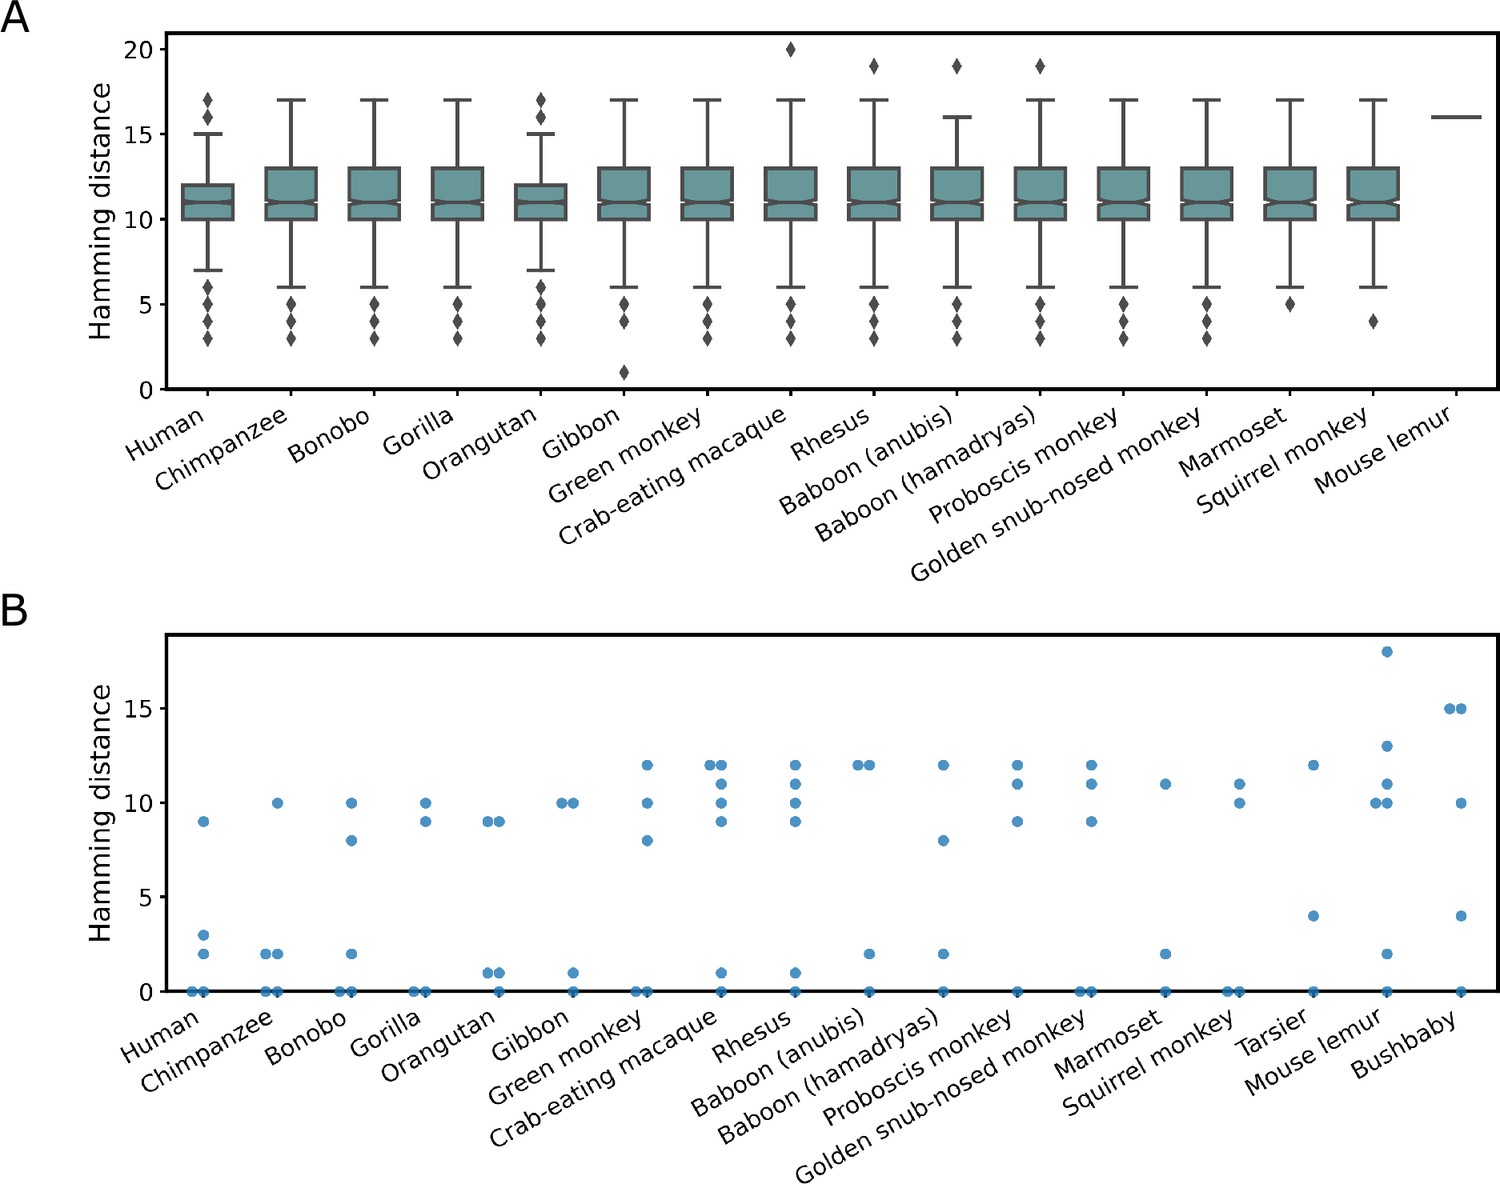
Secondary structure-based search of LINE-1-rbz and OR4K15-rbz in primate genomes.
(A) Hamming distance distribution of LINE-1-rbz homologs found in representative primate genome assemblies. (B) Hamming distance distribution of OR4K15-rbz homologs found in representative primate genome assemblies.
Additional files
-
MDAR checklist
- https://cdn.elifesciences.org/articles/90254/elife-90254-mdarchecklist1-v1.pdf
-
Supplementary file 1
Summary of the deep sequencing results.
- https://cdn.elifesciences.org/articles/90254/elife-90254-supp1-v1.xlsx
-
Supplementary file 2
Pattern-based similarity search results against the Rfam database.
- https://cdn.elifesciences.org/articles/90254/elife-90254-supp2-v1.xlsx
-
Supplementary file 3
Oligonucleotides used in this study.
- https://cdn.elifesciences.org/articles/90254/elife-90254-supp3-v1.xlsx
Download links
A two-part list of links to download the article, or parts of the article, in various formats.
Downloads (link to download the article as PDF)
Open citations (links to open the citations from this article in various online reference manager services)
Cite this article (links to download the citations from this article in formats compatible with various reference manager tools)
Minimal twister sister-like self-cleaving ribozymes in the human genome revealed by deep mutational scanning
eLife 12:RP90254.
https://doi.org/10.7554/eLife.90254.3


