Commensal bacteria maintain a Qa-1b-restricted unconventional CD8+ T population in gut epithelium
- Department of Pathology, Johns Hopkins University School of Medicine, United States
- Institute of Cell Engineering, Johns Hopkins University School of Medicine, United States
- Division of Immunology and Molecular Medicine, Department of Molecular and Cell Biology, University of California, Berkeley, United States
Figures
Figure 1 with 2 supplements
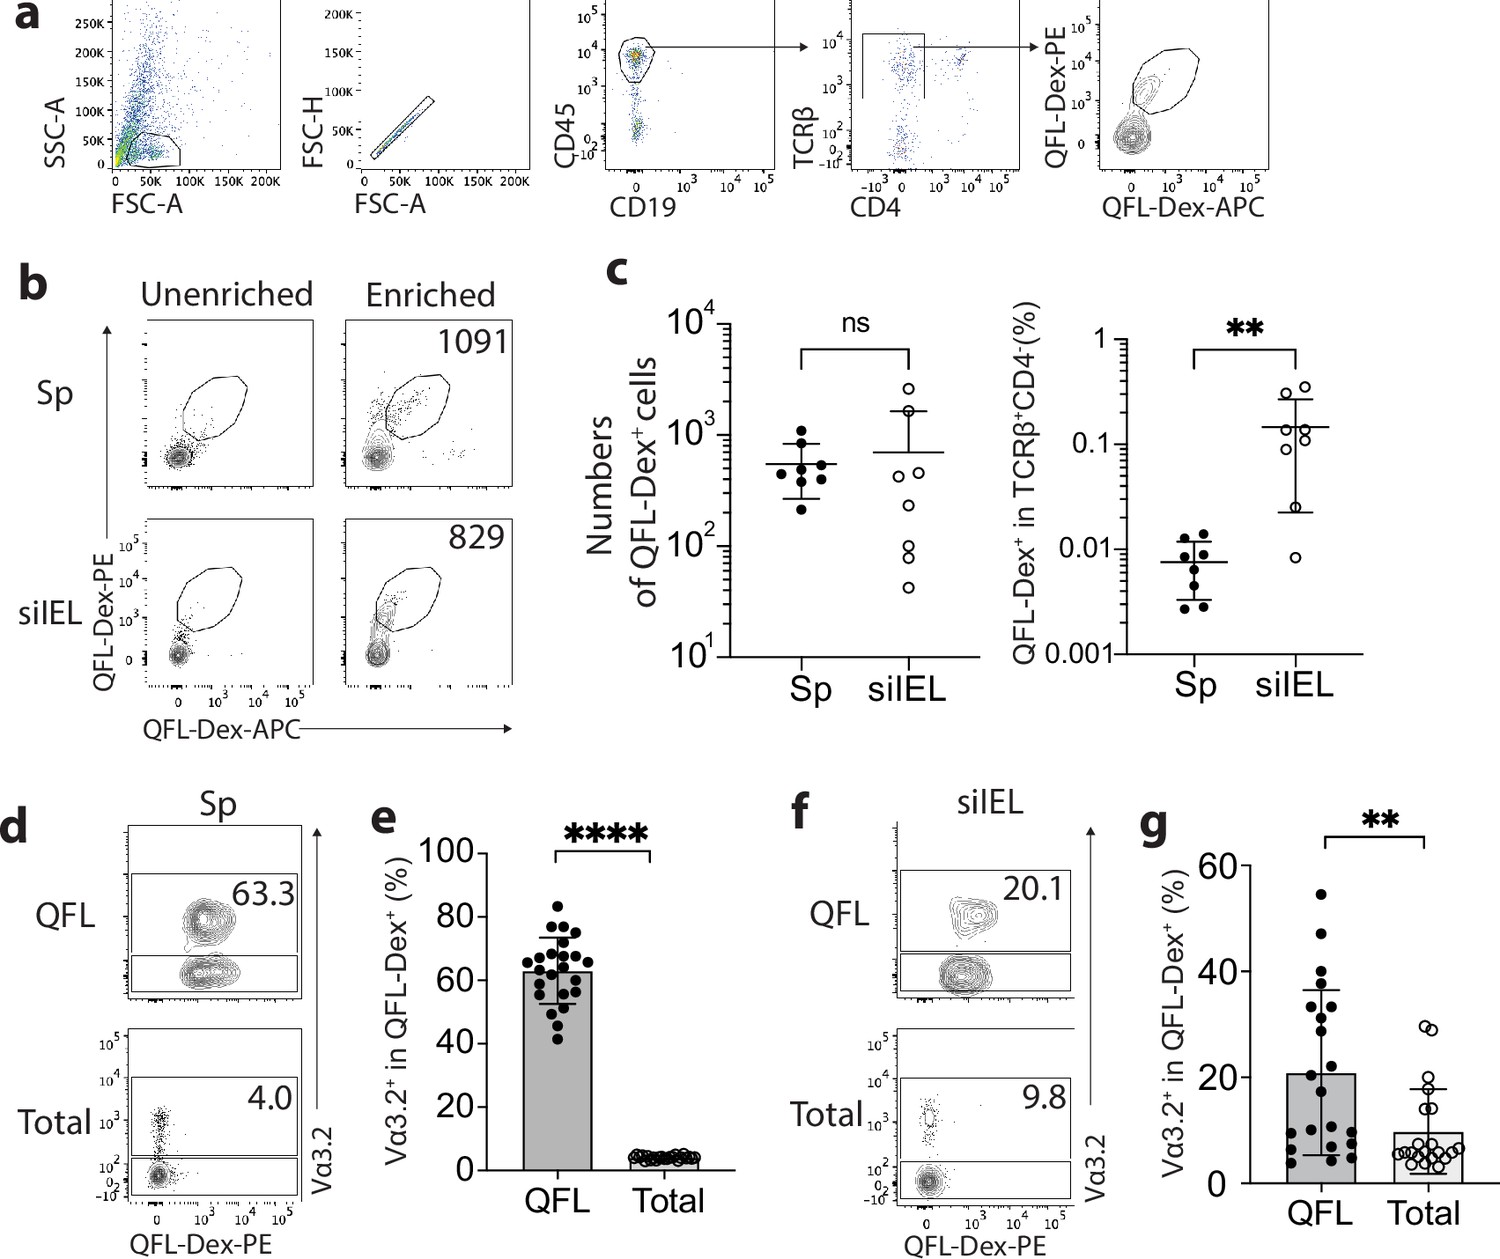
Abundant Vα3.2+ QFL T cells in both the spleen and small intestinal intraepithelial lymphocyte (siIEL) compartment of naïve wild-type (WT) mice.
(a) Definition of QFL T cells by flow cytometry. Cells from the spleen or siIEL compartment were stained with Qa-1b-FL9 (QFL) dextramers labeled with phycoerythrin (QFL-Dex-PE) or allophycocyanin (QFL-Dex-APC) and analyzed for before (Unenriched) or after (Enriched) magnetic enrichment of dextramer-positive cells. QFL T cells are defined as the CD45+CD19-TCRβ+CD4-QFL-Dex-PE+APC+ population. Plots representing siIELs from naïve WT mice after enrichment for QFL-Dex+ cells. (b) Flow cytometry of cells from the spleen (Sp) and siIEL compartment of naïve WT mice ‘Unenriched’ or ‘Enriched’ for dextramer-positive cells. Numbers in plots indicate absolute numbers of QFL-Dex+ cells detected after enrichment. (c) Absolute numbers (left) and frequencies (right) of QFL-Dex+ cells detected (as in b) among TCRβ+CD4- population in the spleen or siIEL compartment. **p=0.0069 (d, f) Analysis of Vα3.2 expression on QFL-Dex+(QFL) or total CD8+ T (Total) cells from the spleen (d) or the siIEL compartment (f). Numbers in plots indicate average percentages of Vα3.2+ cells within the indicated populations. (e) Frequencies of Vα3.2+ cells detected as in (d) ****p<0.0001 (g) Frequencies of Vα3.2+ cells detected as in (f) **p=0.0058 Representative data are shown in flow plots (a, b, d, f) and the number of replicates is specified in the bar graphs (c, e, g). Each symbol represents data collected from the indicated tissue isolated from an individual mouse. Data from ≧5 independent experiments were pooled for statistical analysis. p-values were calculated with student’s t-test. ‘ns’ indicates the comparison was not significant.
Figure 1—figure supplement 1
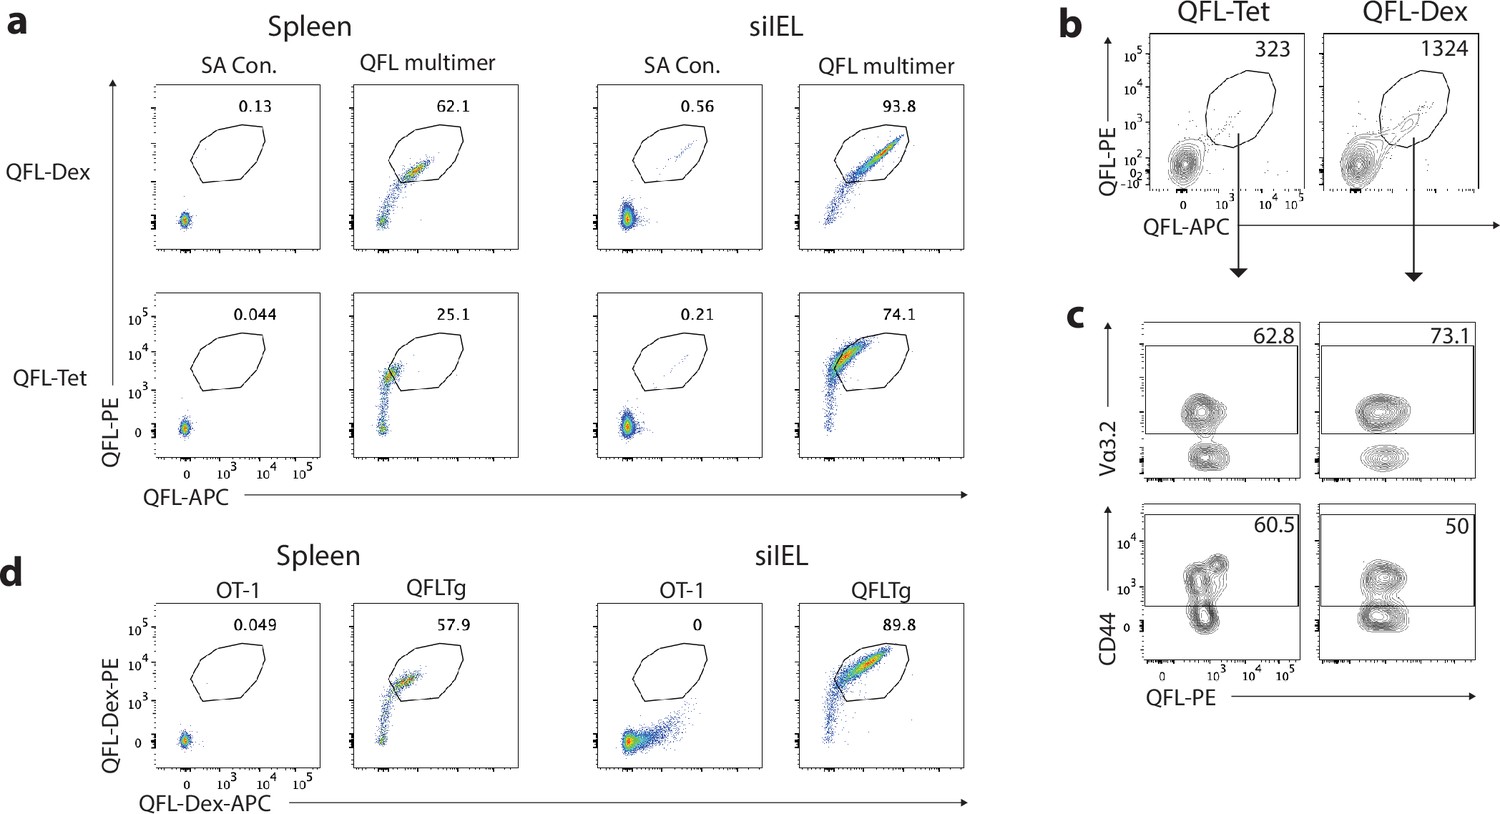
Verification of QFL-Dextramers.
(a) Flow cytometry of splenocytes or small intestinal intraepithelial lymphocyte (siIELs) isolated from QFLTg mouse stained with Qa-1b-FL9 tetramers (QFL-Tet) or dextramers (QFL-Dex). The unloaded streptavidin and streptavidin-dextran without QFL monomers (SA Con.) represents background signal of QFL-Tet and QFL-Dex, respectively. (b) Flow cytometry of QFL T cells enriched from the spleen cells of naïve WT mice using QFL-Tet or QFL-Dex. Numbers in plots indicate absolute numbers of QFL-Tet/Dex+ cells detected. Splenocytes from two animals were pooled and splitted into two groups for the test. (c) Analysis of Vα3.2 or CD44 expression on the QFL T cells enriched as in (b) Numbers in plots indicate percentages of Vα3.2+ or CD44hi cells. (d) Flow cytometry of splenocytes or siIELs from OT-1 or QFLTg mice stained with QFL-Dex-PE and -APC. Data are representative of two independent experiments.
Figure 1—figure supplement 2
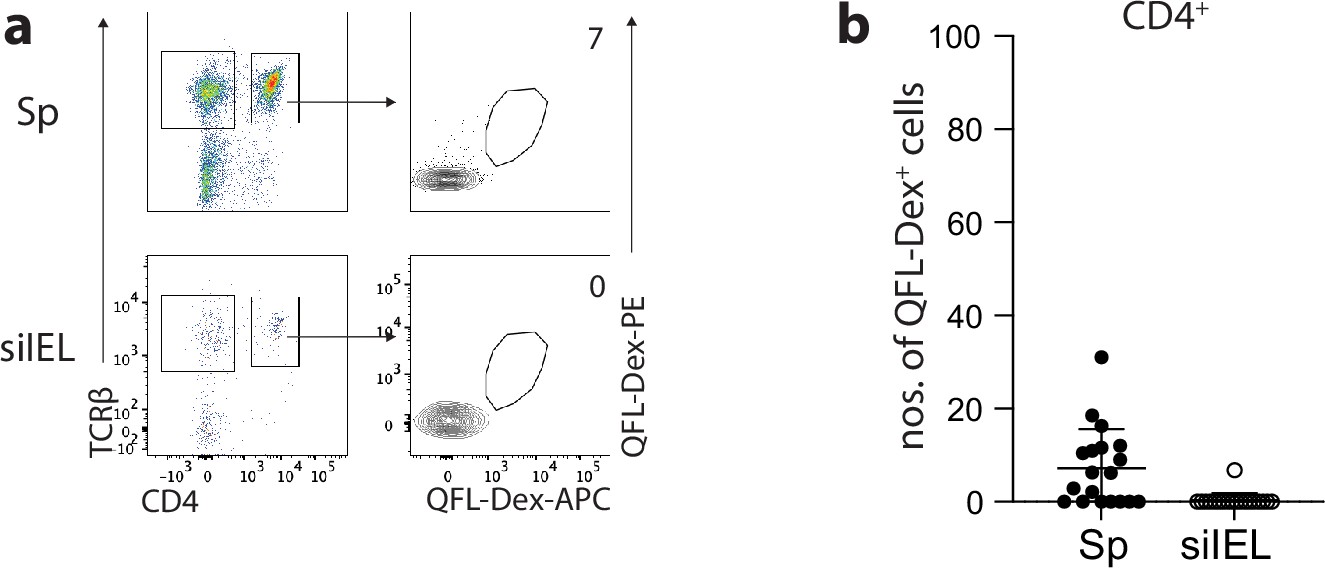
QFL T cells are barely detectable in the TCRβ+CD4+ population.
(a) Flow cytometry of QFL T cells enriched from the TCRβ+CD4+ population of the spleen or QFLTg (siIEL) compartment in naïve wild-type (WT) mice. Numbers in plots indicate average numbers of CD4+QFL-Dex+ cells. (b) Absolute numbers of enriched CD4+ QFL T cells detected as in (a) Number of replicates is specified in the bar graphs with each symbol representing data collected from an individual mouse.
Figure 2 with 1 supplement
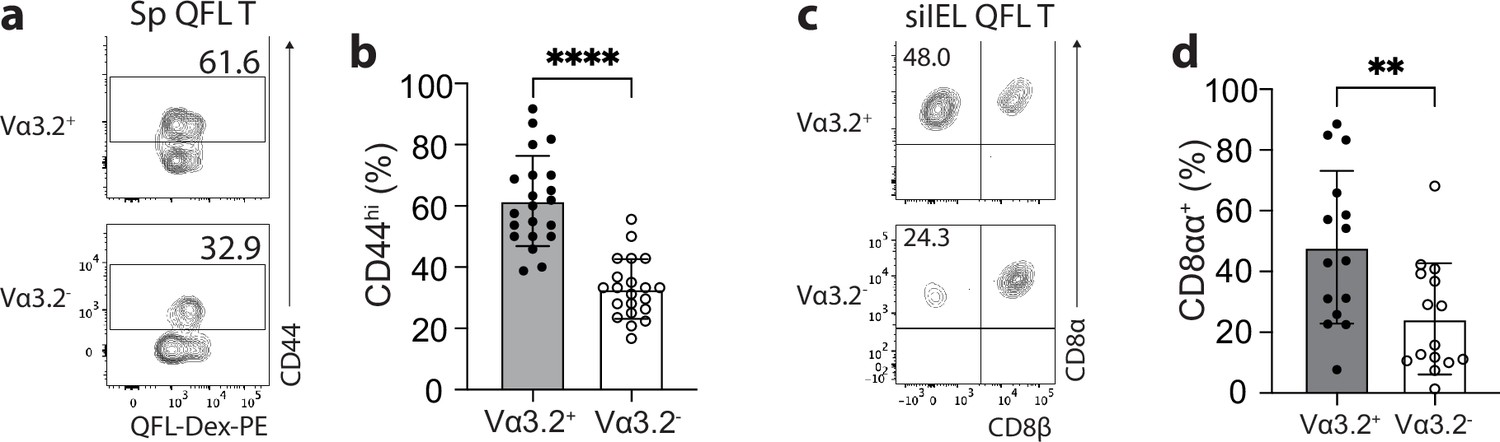
The unconventional phenotype of Vα3.2+ QFL T cells.
(a) Analysis of CD44 expression on Vα3.2+ or Vα3.2- QFL-Dex+ cells enriched from the spleen of naïve wild-type (WT) mice. Numbers in plots indicate average percentages of CD44hi cells detected among the Vα3.2+ or Vα3.2- QFL-Dex+ populations. (b) Frequencies of CD44hi cells detected as in (a).****p<0.0001 (c) Analysis of CD8α and CD8β expression on Vα3.2+ or Vα3.2- QFL-Dex+ cells enriched from the small intestinal intraepithelial lymphocyte (siIEL) compartment of naïve WT mice. Numbers in plots indicate average percentages of CD8αα+ cells detected among the Vα3.2+ or Vα3.2- QFL-Dex+ populations. (d) Frequencies of CD8αα+ cells detected as in (c) **p=0.0065 Samples of <20 cells in the Vα3.2+QFL-Dex+ gate were excluded in the phenotype analysis. Representative data are shown in flow plots (a, c) and the number of replicates is specified in the bar graphs (b, d). Each symbol represents data collected from the indicated tissue isolated from an individual mouse. Data from ≧11 independent experiments were pooled for statistical analysis. p-values were calculated with student’s t-test. ‘ns’ indicates the comparison was not significant.
Figure 2—figure supplement 1

Phenotype of total Vα3.2+ or Vα3.2- T population in the spleen or small intestinal intraepithelial lymphocyte (siIEL) compartment.
(a) Frequencies of CD44hi cells detected within the total Vα++ or Vα3.2- CD8αβ+ splenocytes from naïve wild-type (WT) mice. *p=0.0168 (b) Frequencies of CD8αα+ cells detected within the total Vα3.2+ or Vα3.2- TCRβ+CD4- siIELs from naïve WT mice. (c) Frequencies of CD44hi cells among Vα3.2+ or Vα3.2- CD8+ T cells isolated from the spleen of WT, Qa-1b-KO, or ERAP1-KO mice. *p<0.04 Number of replicates is specified in the bar graphs with each symbol representing data collected from an individual mouse. p-values were calculated with student’s t-test. ‘ns’ indicates the comparison was not significant.
Figure 3 with 1 supplement
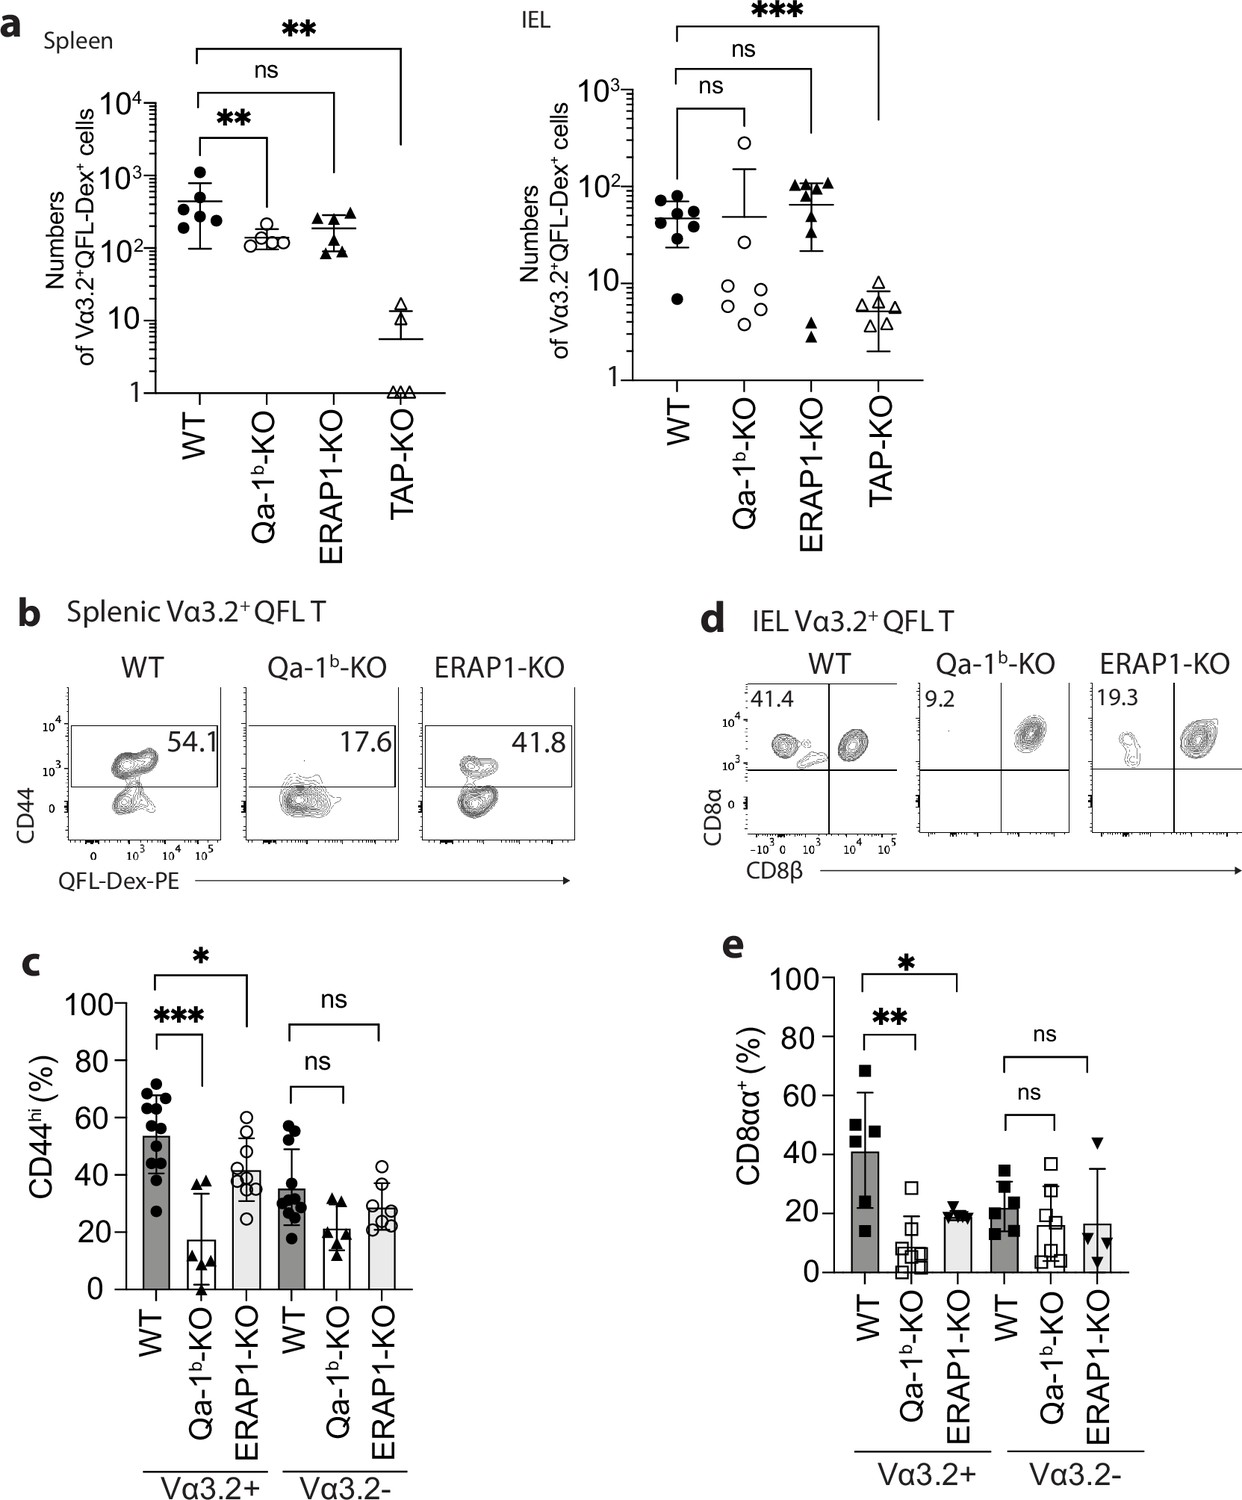
Phenotype of Vα3.2+ QFL T cells in mice of various genotypes.
(a) Absolute numbers of Vα3.2+QFL-Dex+ cells detected in the spleen (left) or small intestinal intraepithelial lymphocyte (siIEL) compartment (right) of Qa-1b, ERAP1, or TAP deficient (Qa-1b-KO, ERAP1-KO, or TAP-KO) mice in comparison with wild-type (WT) mice.**p<0.009 ***p=0.0006 Symbols on x-axis indicate that the cells were undetectable in TAP-KO mice. (b) Analysis of CD44 expression on splenic Vα3.2+QFL-Dex+ cells enriched from naïve WT, Qa-1b-KO, or ERAP1-KO mice. Numbers in plots indicate average percentages of CD44hi cells. (c) Frequencies of CD44hi cells detected among Vα3.2+(as in b) or Vα3.2- QFL T cells.***p=0.0004 *p=0.0388 (d) Flow cytometry analysis of CD8α and CD8β expression on the Vα3.2+QFL-Dex+ cells enriched from the siIEL compartment of naïve WT, Qa-1b-KO or ERAP1-KO mice. Numbers in plots indicate average percentages of CD8αα+ cells. (e) Percentages of CD8αα+ cells detected among Vα3.2+(as in d) or Vα3.2- QFL T cells. **p=0.0082 *p=0.0335 Representative data are shown in flow plots (b, d) and the number of replicates is specified in the bar graphs (a, c, e). Each symbol represents data collected from the indicated tissue isolated from an individual mouse. Data from ≧4 independent experiments were pooled for statistical analysis. p-values were calculated with student’s t-test. ‘ns’ indicates the comparison was not significant.
Figure 3—figure supplement 1

Qa-1b-dependent expression of natural IELs (natIEL) markers on Vα3.2+ QFL T cells.
(a) Flow cytometry analysis of CD90.2 and CD5 expression on the small intestinal intraepithelial lymphocyte (siIEL) Vα3.2+ or Vα3.2- QFL-Dex+ cells from naïve wild-type (WT) or Qa-1b-KO mice. Numbers in plots indicate average percentages of CD90.2-CD5- natural intestinal intraepithelial lymphocyte (IEL) population. (b) Frequencies of CD90.2-CD5- cells detected as in (a) **p=0.0023 Number of replicates is specified in the bar graphs with each symbol representing data collected from an individual mouse. p-values were calculated with student’s t-test. ‘ns’ indicates the comparison was not significant.
Figure 4 with 1 supplement
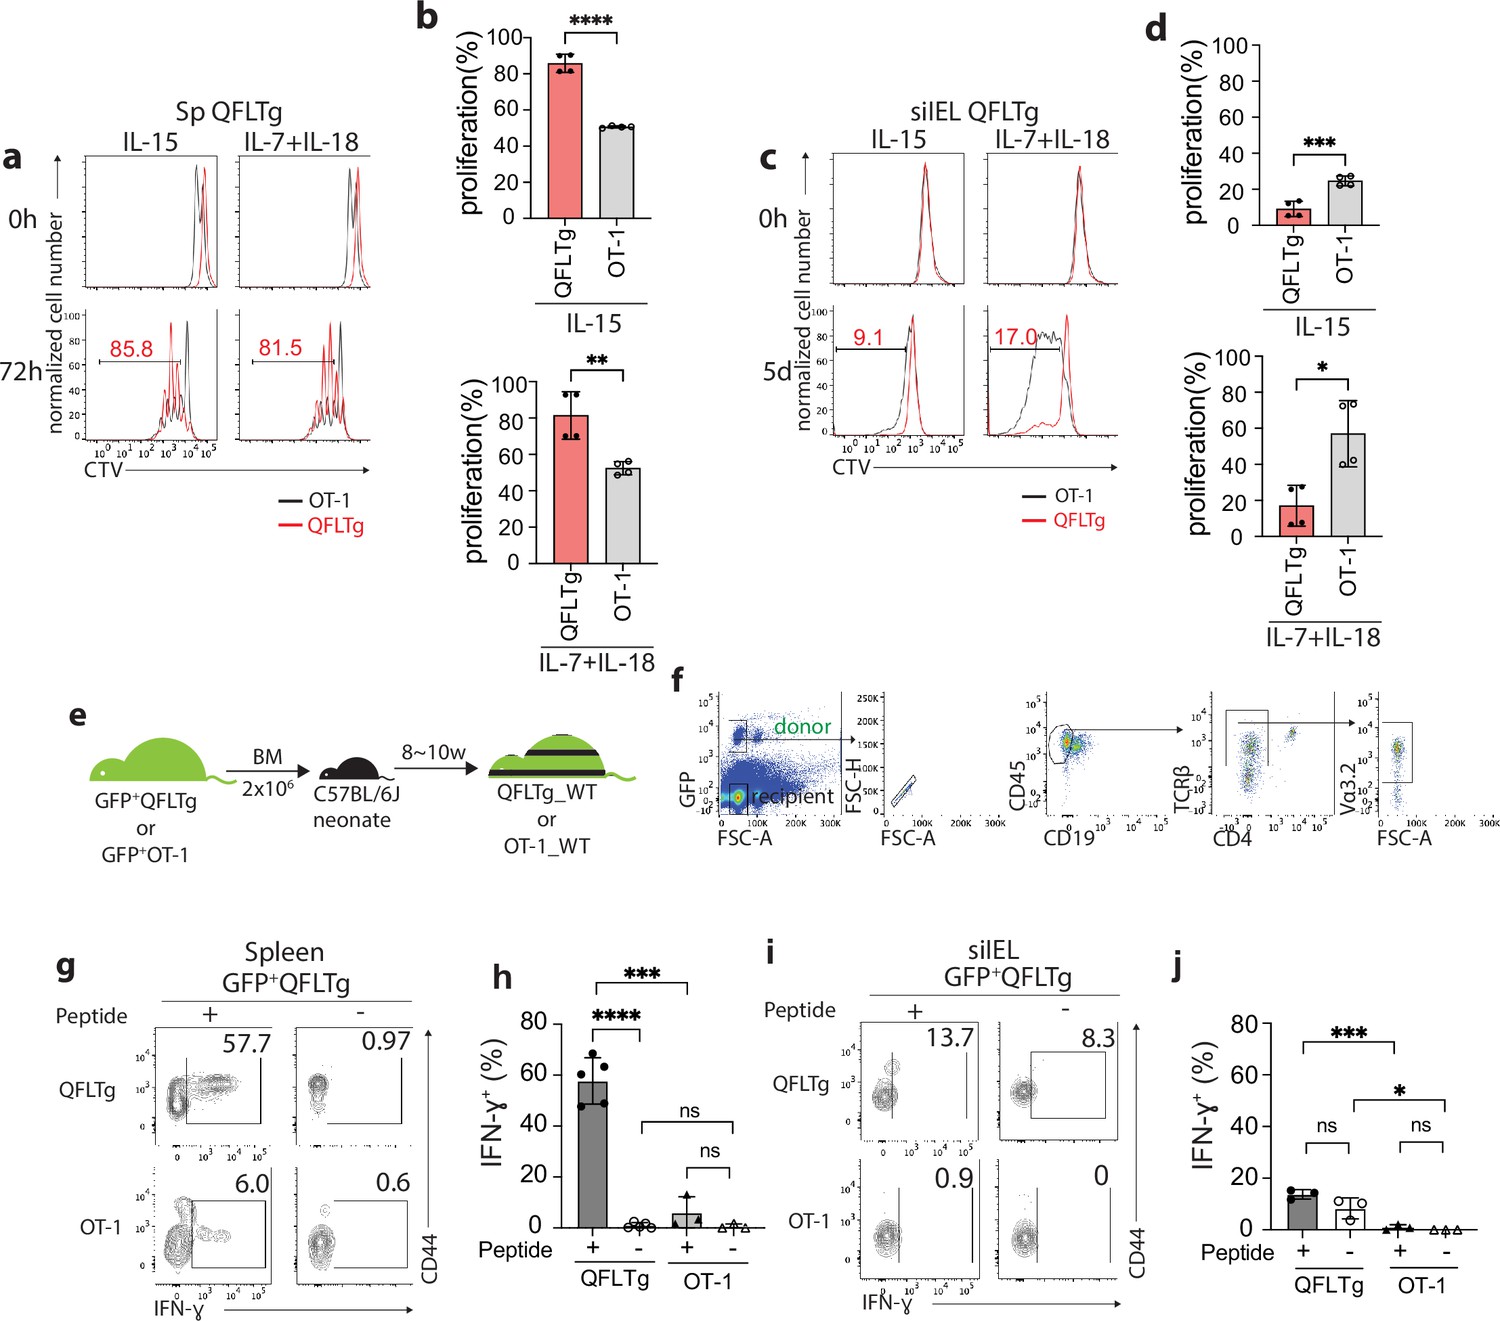
Distinct functional features of QFLTg cells in the spleen and gut.
(a, c) Proliferation of splenic (a) or small intestinal intraepithelial lymphocyte (siIEL) (c) QFLTg or OT-1 cells from QFLTg or OT-1 mice in response to IL-15 (left) or a combination of IL-7 and IL-18 (right) stimulation. Cells were tracked using cell tracing violate (CTV). Numbers in plots indicate average percentages of proliferated QFLTg cells. (b) Percentages of proliferated splenic QFLTg or OT-1 cells as detected in (a) ****p<0.0001 **p=0.0052 (d) Percentages of proliferated siIEL QFLTg or OT-1 as detected in (c). ***p=0.0009 *p=0.0101 (e) Generation of QFLTg_WT or OT-1_WT partial hematopoietic chimera mice. 2 x 10⁶ of the bone marrow (BM) cells from GFP+QFLTg or GFP+OT-1 mice were transferred into wild-type (WT) neonates at 3~5 days of age. The chimera mice were analyzed at 8~10 weeks of age. (f) Gating strategy for the QFLTg cells originated from donor bone marrow cells in QFLTg_WT chimera mice. Plots representing donor-derived QFLTg population in the spleen being gated as GFP+CD45+CD19-TCRβ+CD4-Vα3.2+ cells. (g, i) Flow cytometry measurement of IFN-ɣ production by QFLTg or OT-1 cells isolated from the spleen (g) or siIEL compartment (i) of naïve chimera mice stimulated with or without 2 µM FL9 or SL8 peptide, respectively for 4.5 hr. Numbers in plots indicate average percentages of IFN-ɣ+ cells. (h) Percentages of IFN-ɣ+ cells detected as in (g) ****p<0.0001 ***p=0.0001 (j) Percentages of IFN-ɣ+ cells detected as in (i) ***p=0.0004 *p=0.0247 Representative data are shown in flow plots (a, c, f, g, i) and the number of replicates is specified in the bar graphs (b, d, h, j). Data from 2 (b), (d) or 3 (h, j) independent experiments were pooled for statistical analysis. Each symbol represents data collected from the indicated tissue isolated from an individual mouse. p-values were calculated with student’s t-test. ‘ns’ indicates the comparison was not significant.
Figure 4—figure supplement 1
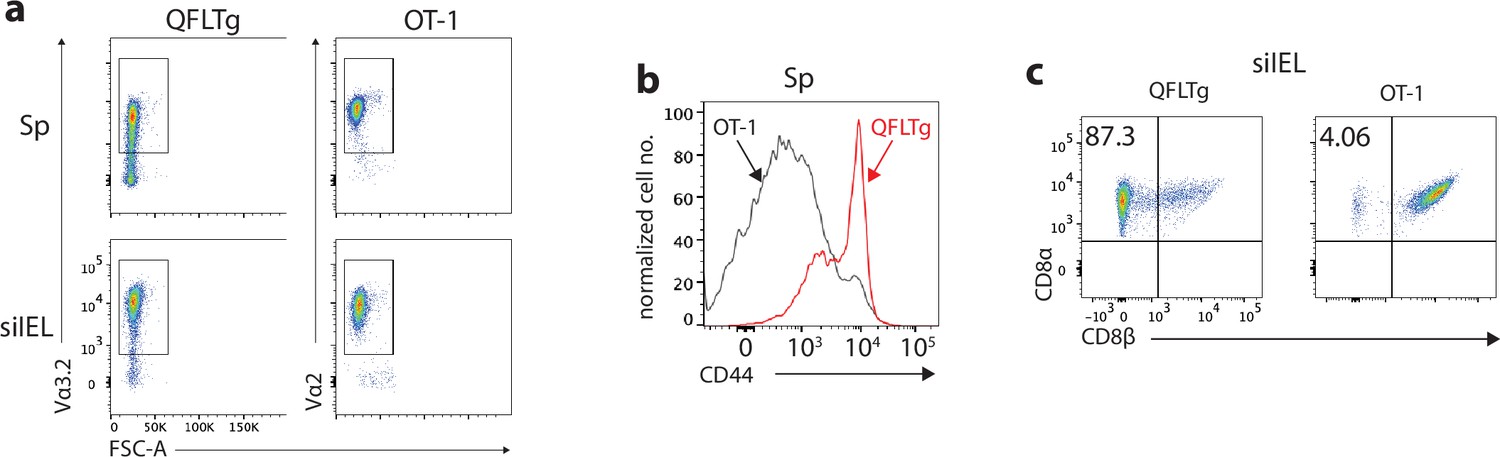
Phenotypes of QFLTg and OT-1 cells from the corresponding transgenic mice.
(a) Detection of QFLTg and OT-1 cells in the spleen or small intestinal intraepithelial lymphocyte (siIEL) of QFLTg or OT-1 transgenic mice. (b) Flow cytometry analysis of CD44 expression on the splenic QFLTg or OT-1 cells. (c) Flow cytometry analysis of CD8α and CD8β expression on the siIEL QFLTg or OT-1 cells. Numbers in plots indicate percentages of CD8αα+ cells. Results are representative of three independent experiments.
Figure 5 with 2 supplements
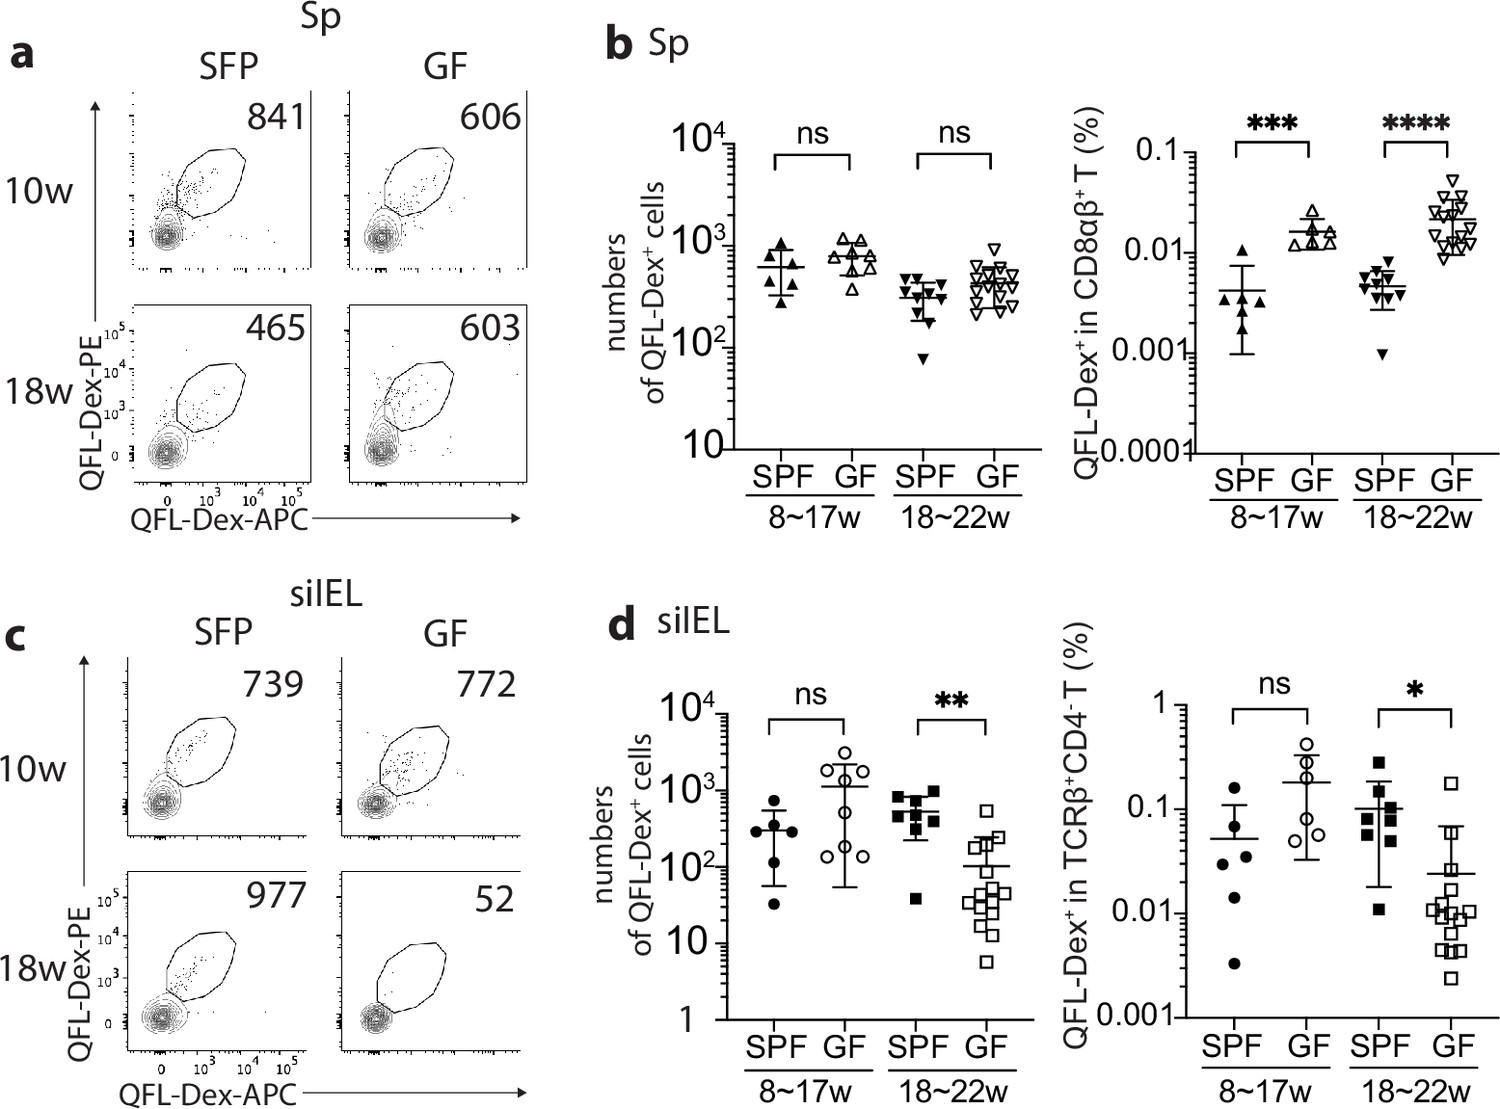
Gut microbiota is associated with retention but not homing of QFL T cells in the small intestinal intraepithelial lymphocyte (siIEL) compartment.
(a, c) Flow cytometry of QFL-Dex+ cells enriched from the spleen (a) or siIEL compartment (c) of specific-pathogen-free (SPF) or germ-free (GF) wild-type (WT) mice at 10 or 18 weeks of age. Numbers in plots indicate absolute numbers of QFL-Dex+ cells. (b) Absolute numbers (left) and frequencies (right) of QFL-Dex+ cells detected within the total splenic CD8+ population in SPF or GF WT mice of 8~17 weeks or 18~22 weeks of age.***p=0.009 ****p<0.0001 (d) Absolute numbers and frequencies of QFL-Dex+ cells detected among the total siIEL TCRβ+CD4- population in SPF or GF WT mice of 8~17 weeks or 18~22 weeks of age. **p=0.005 *p=0.037 Representative data are shown in flow plots (a, c) and the number of replicates is specified in the bar graphs (b, d). Each symbol represents data collected from the indicated tissue isolated from an individual mouse. Data from ≧5 independent experiments were pooled for statistical analysis. p-values were calculated with student’s t-test. ‘ns’ indicates the comparison was not significant.
Figure 5—figure supplement 1

Presence of antigen experienced CD8+ T cells is independent of gut microbiota.
(a) Frequencies of CD44hi cells among the total Vα3.2+ or Vα3.2- TCRβ+CD4- splenocytes in naïve specific-pathogen-free (SPF) or germ-free (GF) WT mice. *p<0.05 ***p=0.0004 (b) Frequencies of CD8αα+ cells among the total Vα3.2+ or Vα3.2- TCRβ+CD4- siIELs in naïve SPF or GF WT mice. **p=0.0030 Number of replicates is specified in the bar graphs with each symbol representing data collected from an individual mouse. p-values were calculated with student’s t-test. ‘ns’ indicates the comparison was not significant.
Figure 5—figure supplement 2
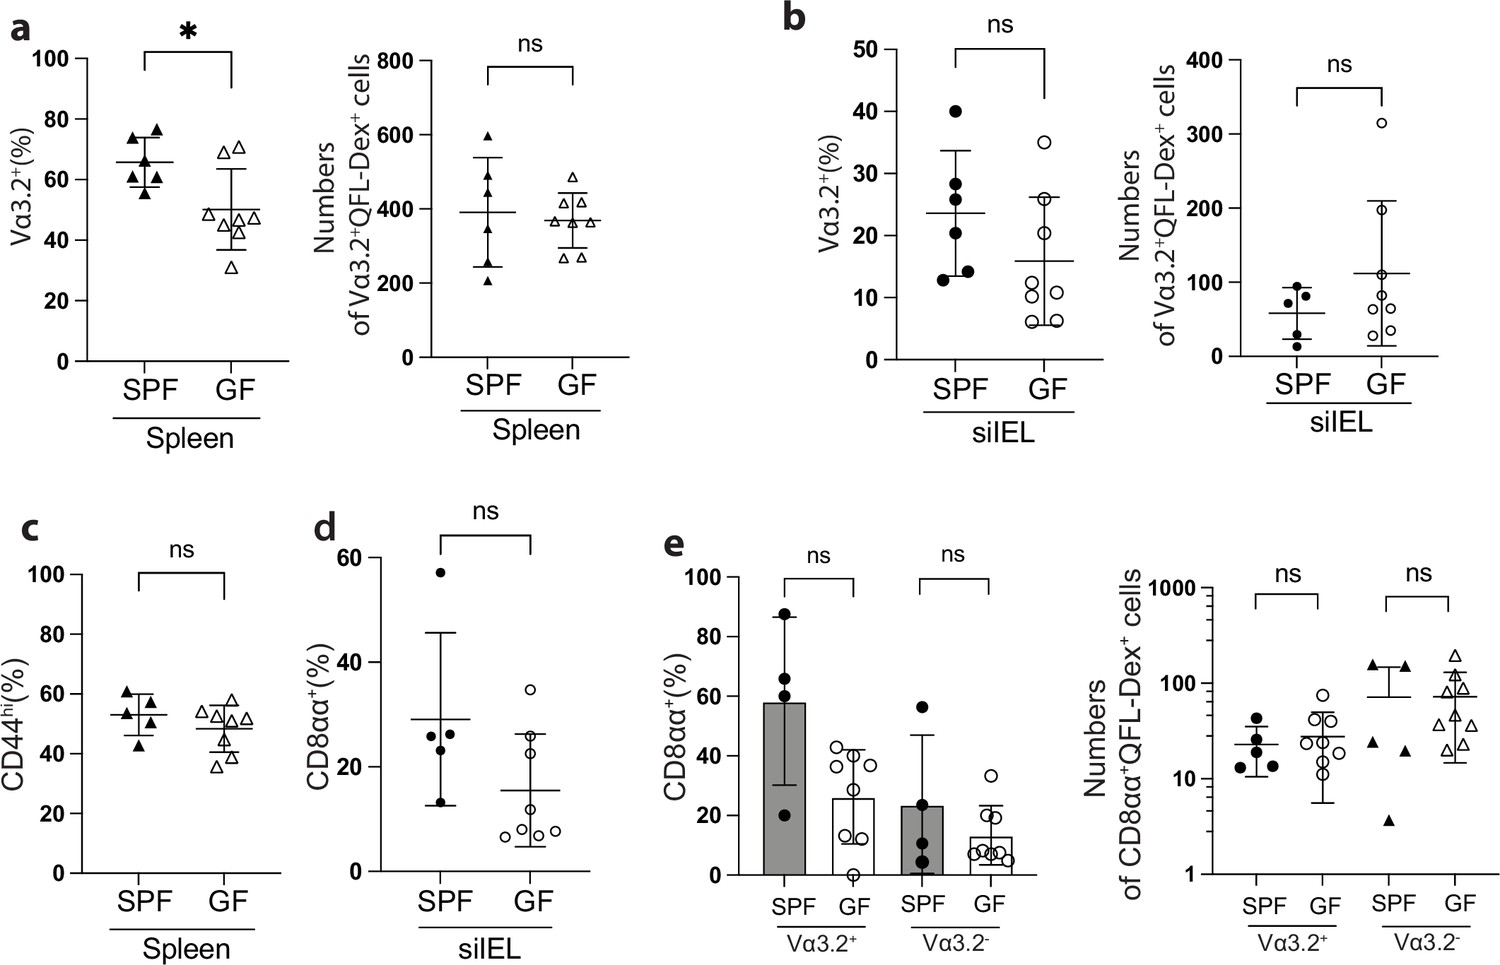
QFL T cells detected in relatively young (8~17 week) specific-pathogen-free (SPF) or germ-free (GF) wild-type (WT) mice are phenotypically similar.
(a) Percentages (left) and absolute numbers (right) of Vα3.2+ cells among the splenic QFL-Dex+ population in SPF or GF WT mice. *p=0.0203 (b) Percentages (left) and absolute numbers (right) of Vα3.2+ cells among small intestinal intraepithelial lymphocyte (siIEL) QFL-Dex+ population in SPF or GF WT mice. (c) Percentages of CD44hi cells among splenic QFL-Dex+ population from SPF or GF WT mice. (d) Percentages of CD8αα+ cells among siIEL QFL-Dex+ population from SPF or GF WT mice. (e) Percentages (left) and absolute numbers (right) of CD8αα+ cells among Vα3.2+ or Vα3.2- QFL-Dex+ population in siIEL of SPF or GF WT mice. Number of replicates is specified in the bar graphs with each symbol representing data collected from an individual mouse. p-values were calculated with student’s t-test. ‘ns’ indicates the comparison was not significant.
Figure 6 with 1 supplement
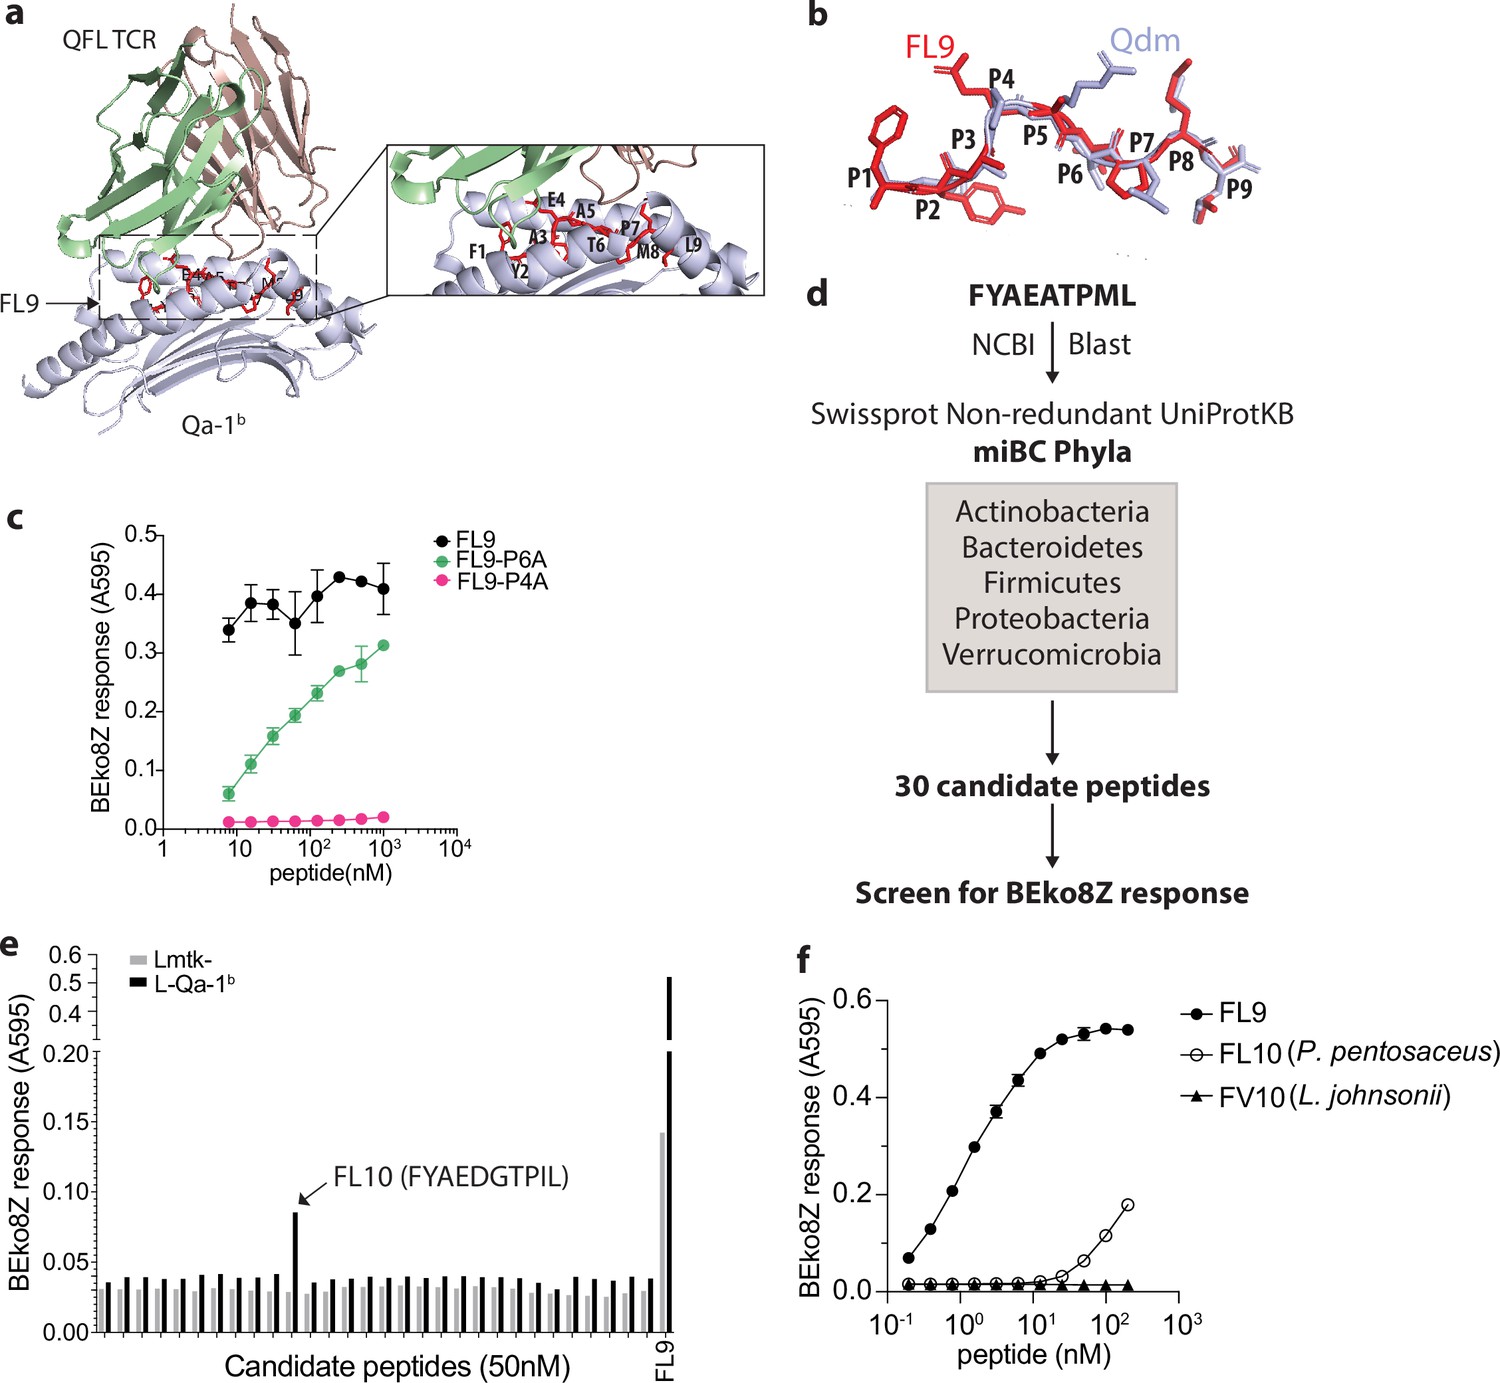
Identification of a QFL T cross-reactive FL9 homolog peptide expressed in commensal bacterium P. pentosaceus.
(a) Structure model of the QFL TCR:FL9:Qa-1b complex predicted by AlphaFold2. Detailed view of the binding groove is shown in the right panel. (b) Conformation alignment of FL9 (red) and Qdm (periwinkle). (c) Alanine screen of the predicted key residues (P4 and P6) in FL9. Activation of QFL T cells was assessed by measuring the LacZ response of BEko8Z hybridoma cells to the Qa-1b-expressing Lmtk- (L-Qa-1b) cells pulsed with mutant FL9 peptides including FYAEAAPML (FL9-P6A) and FYAAATPML(FL9-P4A) or the wild-type FYAEATPML(FL9) using spectrophotometry. (d) Workflow for identification of commensal bacterial FL9 homolog peptide which cross-activates QFL T cells. (e) Identification of the QFL T cross-reactive peptide FYAEDGTPIL(FL10). BEko8Z response to the L-Qa-1b cells or the non-Qa-1b-expressing Lmtk- cells pulsed with 50 nM of the FL9 or the candidate homolog peptides. (f) Response of BEko8Z hybridoma to L-Qa-1b cells pulsed with FL9, FL10 or FYAEDDTPIV (FV10) peptide of various concentrations. (c, e, f) Data are from one experiment representative of three independent experiments.
Figure 6—figure supplement 1
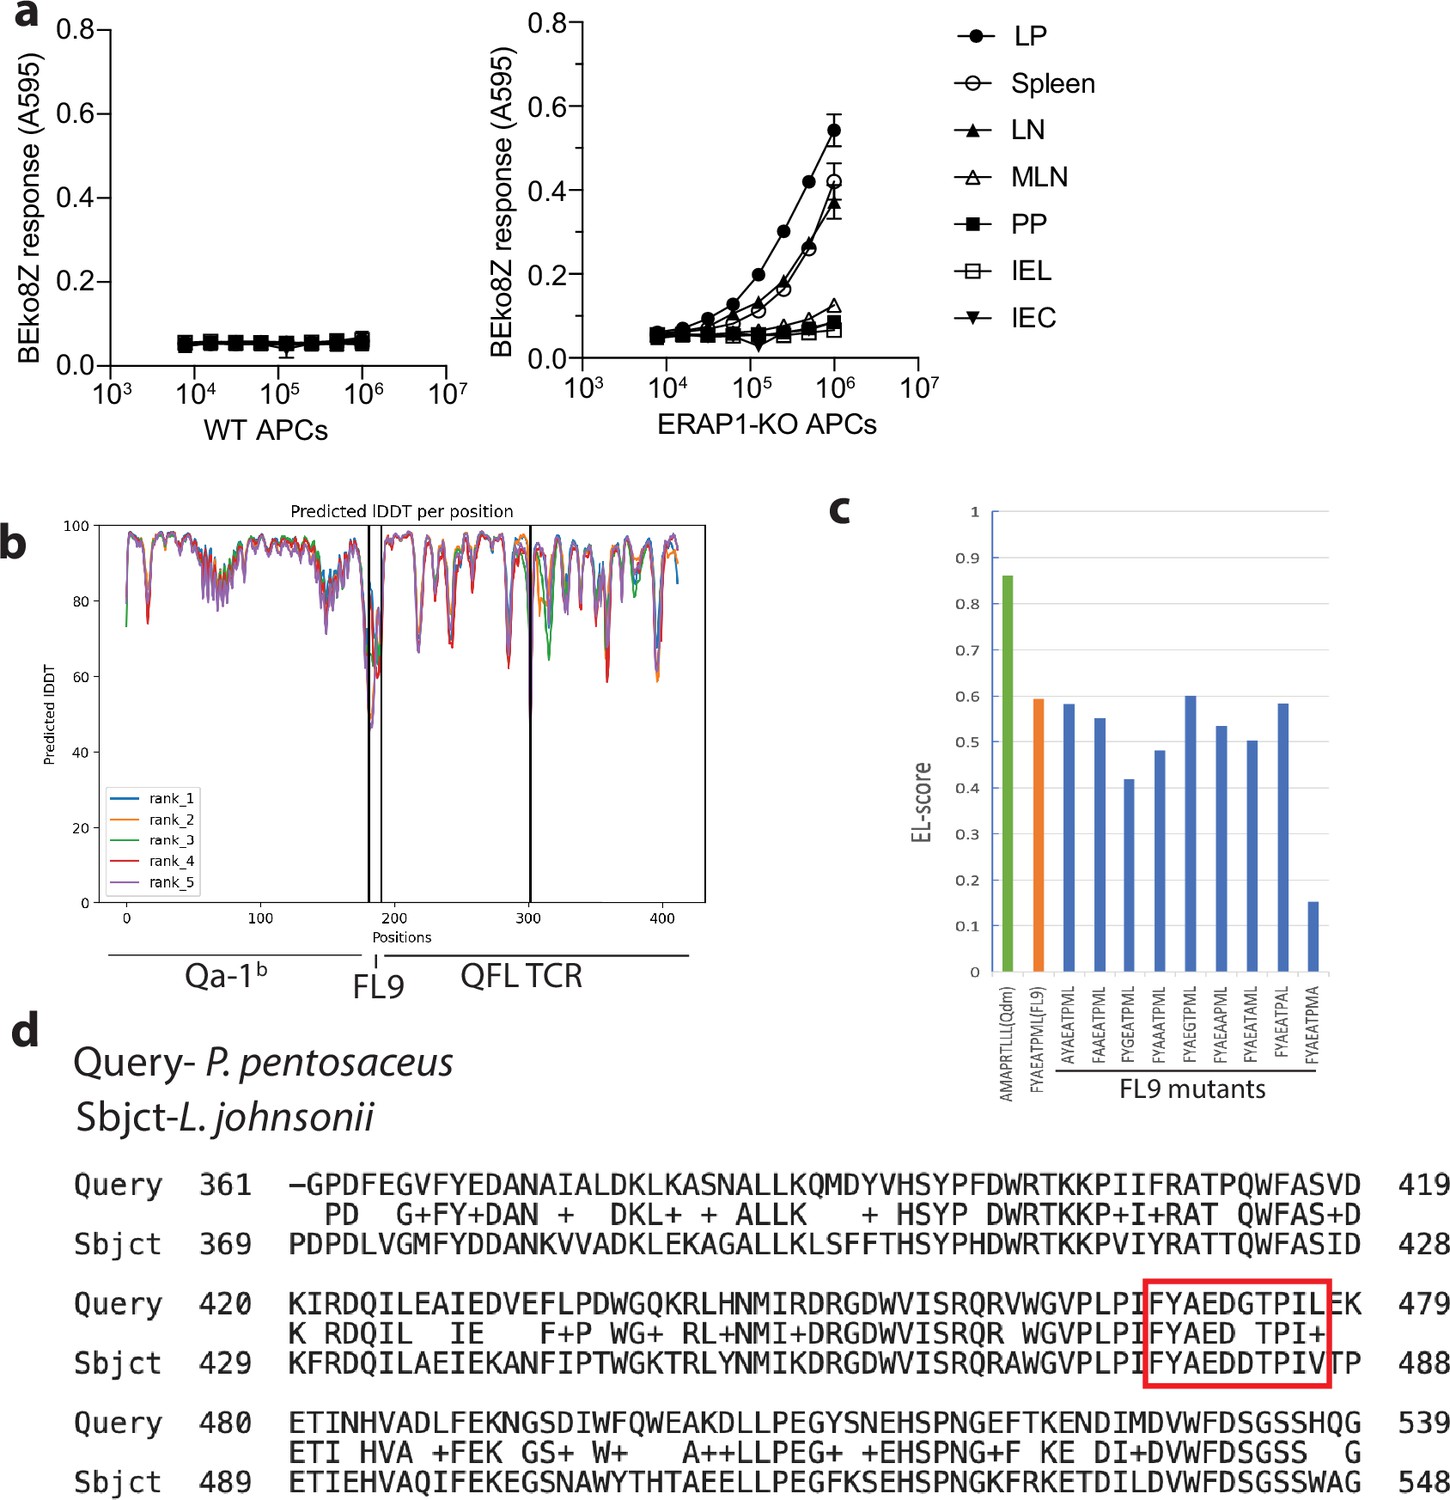
Generation of a curated library of 30 candidate FL9 homolog peptides.
(a) BEko8Z response to cells isolates from various tissues, including lamina propria compartment (LP), spleen, non-mesenteric lymph node (LN), mesenteric lymph node (MLN), Peyer’s Patch (PP), intestinal intraepithelial lymphocyte (IEL) compartment or small intestinal epithelial cells (IEC) in naïve wild-type (WT) (left) or ERAP1-KO cells (right). (b) Prediction quality measured by predicted local distance difference test (pLDDT). The output of the highest pLDDT score (‘rank_1’) was selected for visualization. (c) Binding score of Qdm, wild-type FL9, and various FL9 mutants to Qa-1b predicted by NetMHCpan-4.1. (d) Alignment of amino acid sequences of the isoleucine tRNA ligase proteins expressed in P. pentosaceus or L. johnsonii. The FYAEDGTPIL(FL10) peptide expressed in P. pentosaceus and its homolog FYAEDDTPIV(FV10) expressed in L. johnsonii are highlighted in the red box.
Figure 7 with 3 supplements
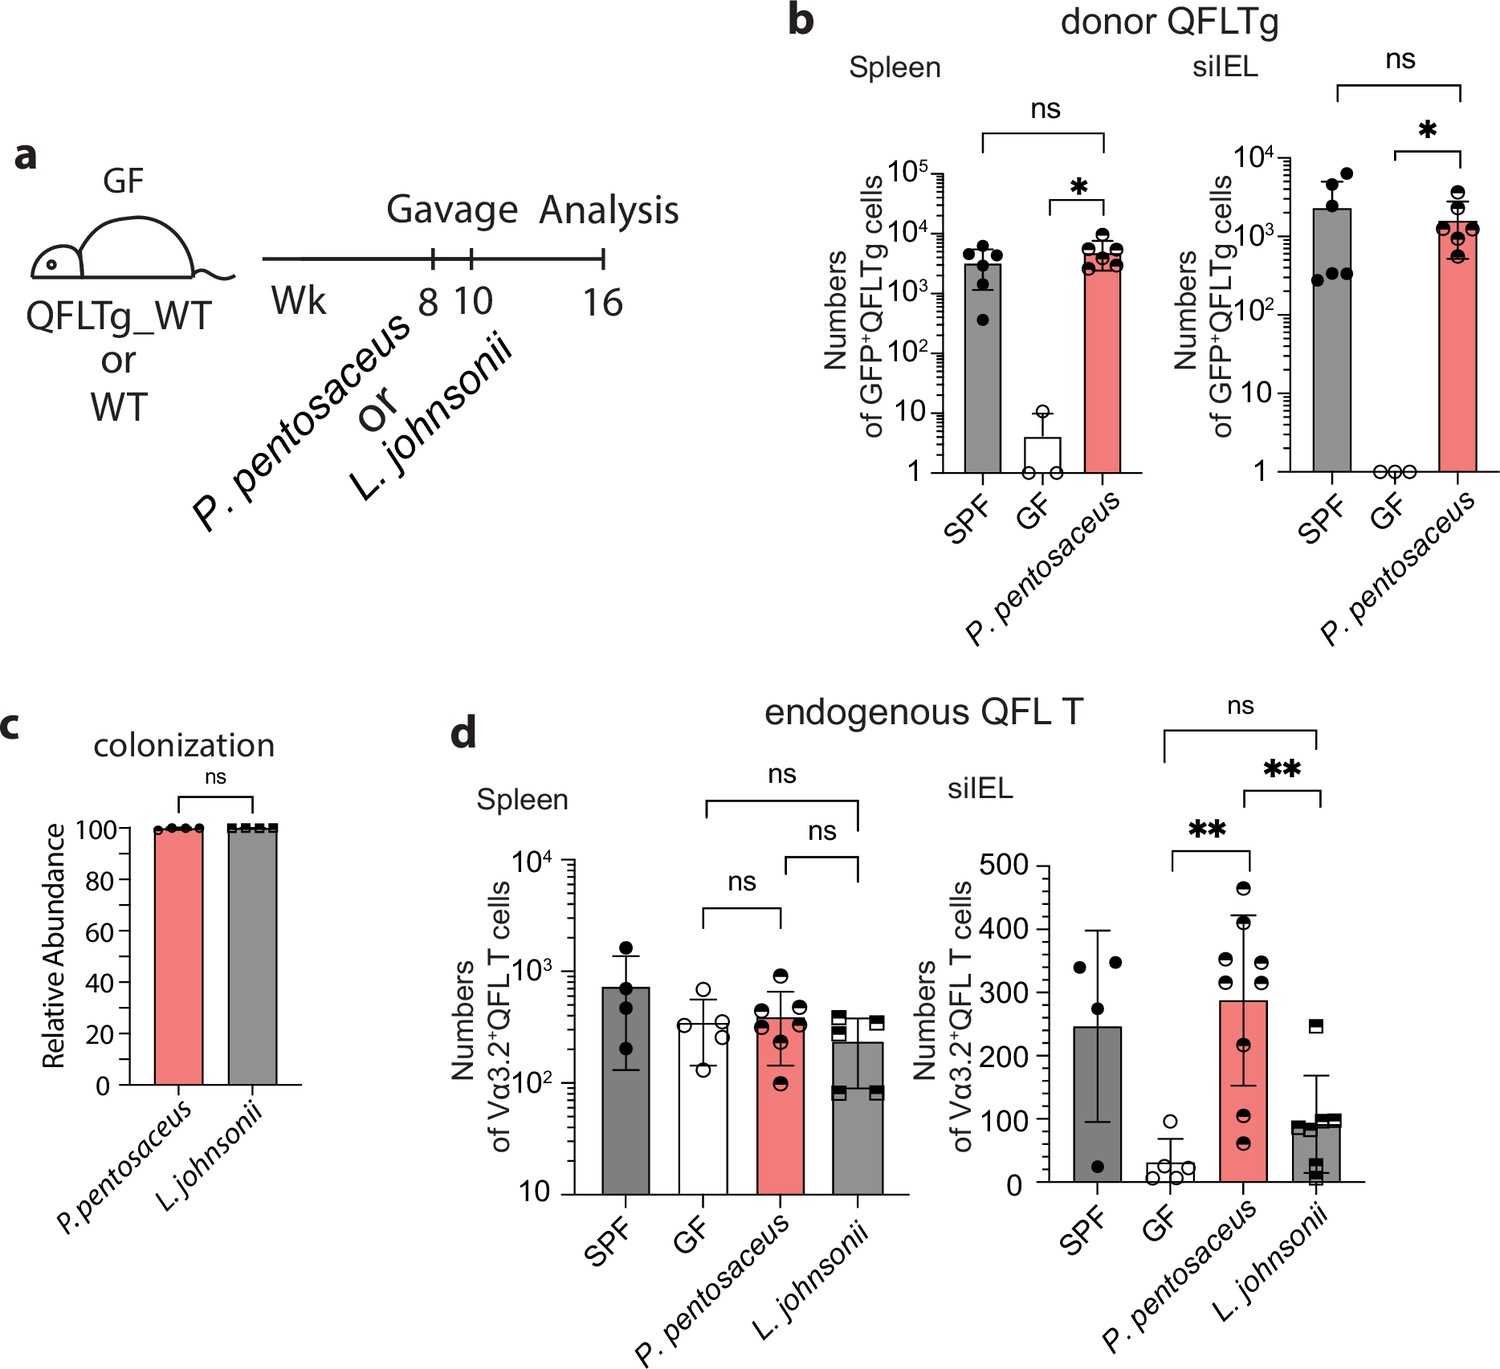
Association between Vα3.2+QFL T cells and the commensal bacterium P. pentosaceus.
(a) Colonization of germ-free (GF) mice with commensal bacteria. GF QFLTg_WT chimera mice received oral gavage of P. pentosaceus at 8 weeks of age and were analyzed for both the donor-derived QFLTg cells and the endogenous Vα3.2+QFL T cells at 16 weeks of age. GF wild-type (WT) mice received oral gavage of P. pentosaceus or L. johnsonii at 8 and 10 weeks of age and were analyzed for the endogenous Vα3.2+QFL T cells at 16 weeks of age. (b) Absolute numbers of donor-derived QFLTg cells in the spleen (left) or small intestinal intraepithelial lymphocyte (siIEL) compartment (right) of 16 week GF QFLTg_WT chimera mice colonized with P. pentosaceus in comparison with specific-pathogen-free (SPF) or uncolonized GF chimera mice. Symbols on the x-axis indicate that QFLTg cells were undetectable in the indicated group. *p<0.03 (c) Relative abundance of P. Pentosaceus or L. Johnsonii was determined by whole shotgun metagenomic sequencing of microbiota composition in pooled fecal pallets collected from each cage. (d) Absolute numbers of endogenous Vα3.2+QFL T cells in the spleen (left) or siIEL compartment (right) of 16 week colonized GF mice compared with SPF or uncolonized GF chimera mice. Endogenous Vα3.2+QFL T data collected from the GF QFLTg_WT chimeric mice and the non-chimeric WT mice were pooled for this analysis. **p<0.008 The number of replicates is specified in the bar graphs with each symbol representing data collected from the indicated sample/tissue isolated from an individual cage (c) or mouse (b, d). Data from ≧3 independent experiments were pooled for statistical analysis. p-values were calculated with student’s t-test. ‘ns’ indicates the comparison was not significant.
Figure 7—figure supplement 1
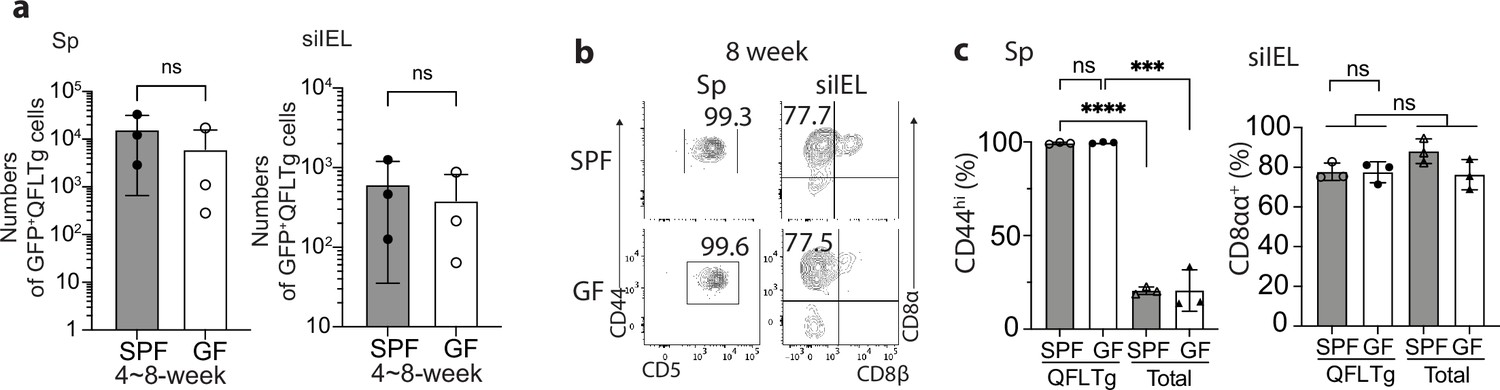
Donor-derived QFLTg cells are present and phenotypically similar in specific-pathogen-free (SPF) or germ-free (GF) QFLTg_WT chimera mice before 8 weeks of age.
(a) Absolute numbers of donor-derived QFLTg cells detected in the spleen (left) and small intestinal intraepithelial lymphocyte (siIEL) (right) compartment of SPF or GF QFLTg_WT chimera mice at 4~8 weeks of age. (b) Flow cytometry analysis of CD44 and CD5 expression on the splenic (left) or CD8α and CD8β expression on the siIEL (right) donor-derived QFLTg cells detected in 8 week SPF or GF QFLTg_WT chimera mice. Numbers in plots indicate percentages of CD44hiCD5+ or CD8αα+ cells. (c) Frequencies of CD44hiCD5+ or CD8αα+ cells among the splenic or siIEL donor-derived QFLTg populations in comparison with the total recipient-derived TCRβ+CD4- cells (Total) from SPF or GF QFLTg_WT chimera mice. ****p<0.0001 ***p=0.0002 Number of replicates is specified in the bar graphs with each symbol representing data collected from an individual mouse. p-values were calculated with student’s t-test. ‘ns’ indicates the comparison was not significant.
Figure 7—figure supplement 2
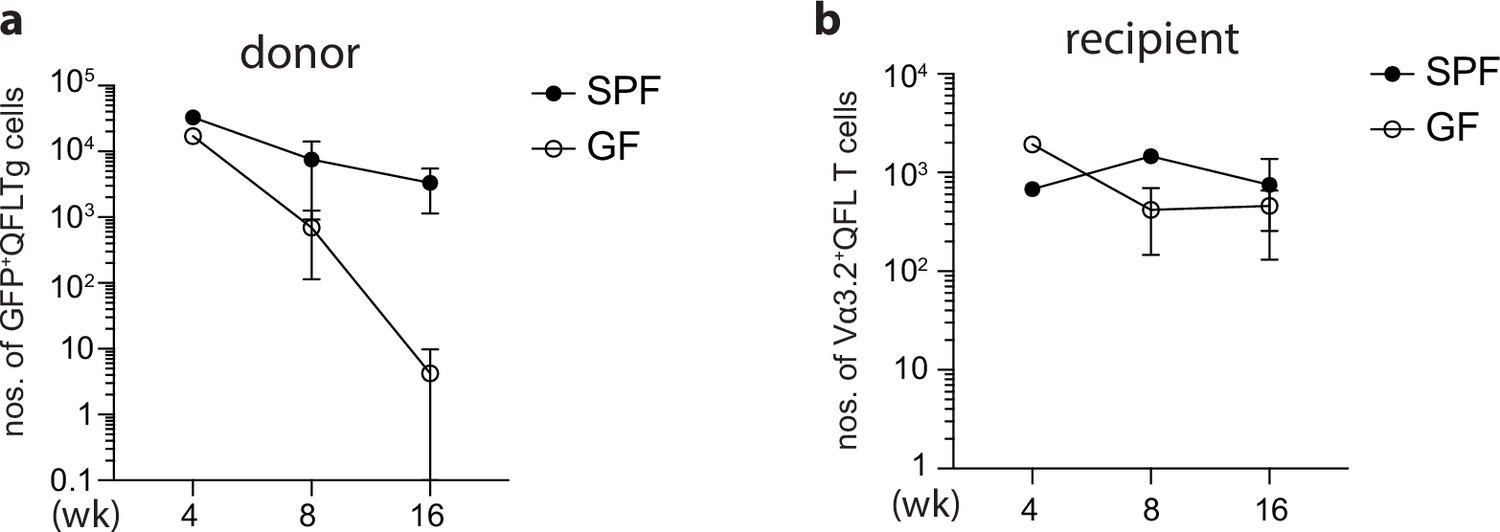
Age-associated loss of donor-derived QFLTg cells in the spleen of QFLTg_WT chimera mice.
(a) Absolute numbers of donor-derived GFP+QFLTg cells enriched from the spleen of specific-pathogen-free (SPF) or germ-free (GF) QFLTg_WT chimera mice at 4, 8, or 16 weeks of age. (b) Absolute numbers of recipient-derived Vα3.2+QFL T cells enriched from the spleen of SPF or GF QFLTg_WT chimera mice at 4, 8, or 16 weeks of age. Data is shown as mean (SD) of one 4 week SPF/GF chimera mice, two 8 week SPF/GF chimera mice, and three SPF/six GF 16 week chimera mice.
Figure 7—figure supplement 3

Unaltered phenotype of donor- or recipient-derived Vα3.2+ QFL T cells in 16 week germ-free (GF) chimera mice colonized with P. pentosaceus.
(a) Frequencies of CD44hi (left) or CD8αα+(right) cells detected among the splenic or small intestinal intraepithelial lymphocyte (siIEL) donor-derived QFLTg population from SPF QFLTg_WT chimeric mice or the GF chimeric mice colonized with P. Pentosaceus. (b) Analysis of the phenotype of endogenous Vα3.2+ QFL T population as described in (a) Data from both QFLTg_WT chimeric mice and the non-chimeric WT mice are pooled for analysis of the endogenous populations. The number of replicates is specified in the bar graphs with each symbol representing data collected from the indicated tissue isolated from an individual mouse. p-values were calculated with student’s t-test. ‘ns’ indicates the comparison was not significant.
Tables
Table 1
Characteristics of Vα3.2+ QFL T cells in the spleen and intestinal intraepithelial lymphocyte (IEL).
Summary of the characteristic features of the splenic and IEL Vα3.2+ QFL T cells including their cell type, expression of cell surface markers, dependence on microbiota for tissue homing/retention, and the critical molecules required for population establishment or phenotype imprinting.
| Tissue | Cell type | Phenotype | Microbiota | Critical molecules |
|---|---|---|---|---|
| Spleen | Innate-like T | CD44hi | Independent | Population establishment: Qa-1b (partially required), TAP Phenotype imprinting: Qa-1b, ERAP1 (partially required) |
| IEL | Natural IELs | CD8αα+ CD5-CD90- | Homing: Independent Retention: Dependent |
Additional files
-
Supplementary file 1
Library of the 30 candidate FL9 homolog peptides expressed in commensal bacteria.
- https://cdn.elifesciences.org/articles/90466/elife-90466-supp1-v1.xlsx
-
MDAR checklist
- https://cdn.elifesciences.org/articles/90466/elife-90466-mdarchecklist1-v1.docx
Download links
A two-part list of links to download the article, or parts of the article, in various formats.
Downloads (link to download the article as PDF)
Open citations (links to open the citations from this article in various online reference manager services)
Cite this article (links to download the citations from this article in formats compatible with various reference manager tools)
Commensal bacteria maintain a Qa-1b-restricted unconventional CD8+ T population in gut epithelium
eLife 12:RP90466.
https://doi.org/10.7554/eLife.90466.3


