Prior probability cues bias sensory encoding with increasing task exposure
- School of Psychological Sciences, Monash University, Australia
- School of Psychology, Dublin City University, Ireland
- Institute of Psychiatry, Psychology & Neuroscience, King's College London, United Kingdom
- School of Electrical Engineering, University College Dublin, Ireland
- Trinity College Institute of Neuroscience, Trinity College Dublin, Ireland
- School of Psychology, Trinity College Dublin, Ireland
Figures
Figure 1
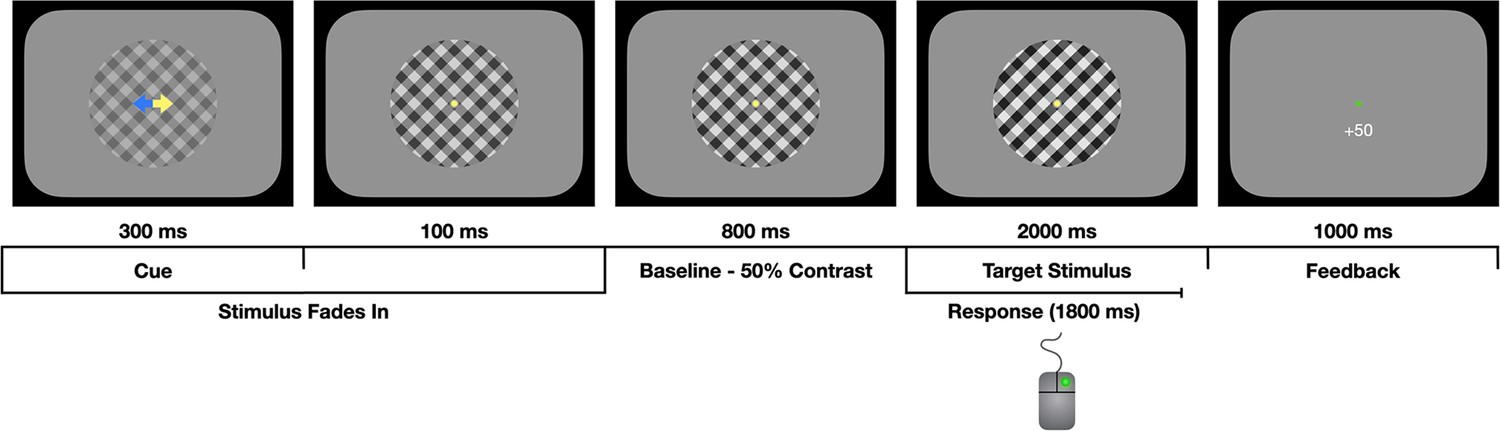
Task schematic.
Participants were asked to decide which of two overlaid gratings (left-tilt or right-tilt) were presented at a higher contrast while fixating on a central fixation dot. The gratings gradually faded in from 0% to 50% contrast during the first 400 ms, as the predictive cue was presented. The cue (yellow arrow) could be valid, invalid, or neutral (both arrows yellow). The gratings were then held at 50% contrast for a 800 ms baseline phase. At evidence onset, there was an instantaneous increase in the contrast of the ‘target’ grating (right-tilt in the illustration above) and a reciprocal decrease in the contrast of the ’non-target’ grating. The participant responded by clicking the left or right mouse button and they received feedback on their choices in the form of points and the fixation dot changing colour to green (correct) or red (incorrect/early response/miss).
Figure 2
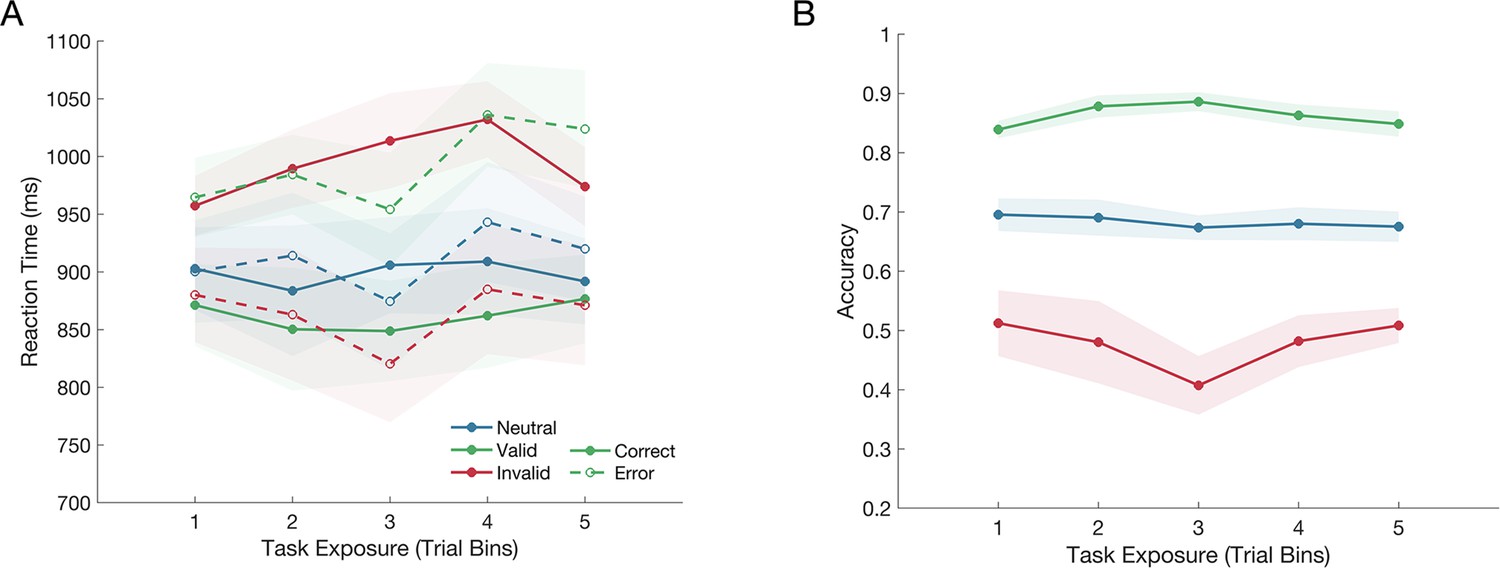
The effect of the cue on reaction time and choice accuracy over the course of testing, as indicated by the task exposure bins.
(A) The cue significantly influenced reaction time for both correct and error responses, but this effect did not change over the course of testing. (B) The cue also significantly influenced accuracy, but again, this effect did not interact with the task exposure. The shaded regions represent the standard error of the mean (n = 12).
Figure 3
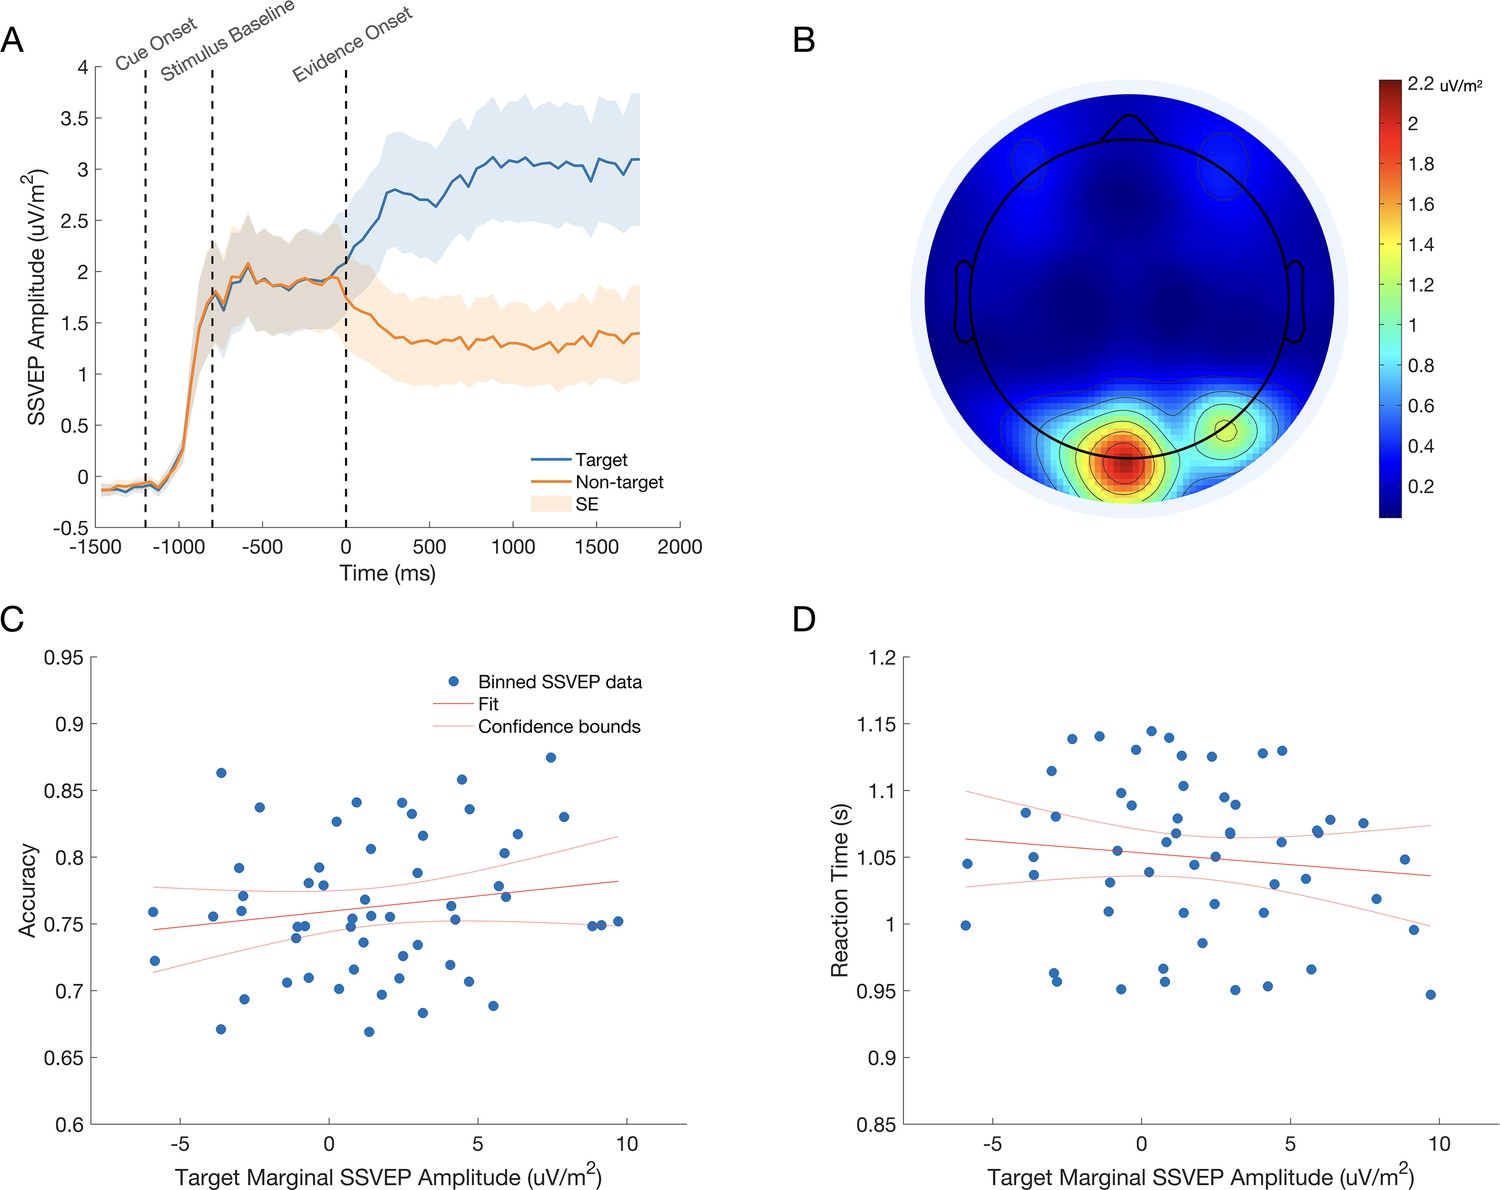
The SSVEP tracks stimulus contrast.
(A) The dashed time markers represent the onset of the fade-in sequence, the onset of the baseline phase, and the onset of evidence. The mean SSVEP can be seen to rise as the stimulus fades-in. The signal then plateaus for the 800ms baseline phase, where both gratings are presented at 50% contrast. Finally, the signal clearly discriminates the target stimulus from the non-target stimulus as evidence onsets at 0ms. The shaded regions represent the standard error of the mean (n = 11). (B) The topography of the SSVEP signal during evidence presentation shows strong activity over visual cortex. (C, D) The relationship between marginal SSVEP amplitude and choice accuracy (C) and reaction time (D). Data points represent each subject’s data divided into quintiles according to marginal SSVEP amplitude. For illustration, a linear regression trend line is shown with 95% confidence bounds in red in each plot.
Figure 4 with 1 supplement
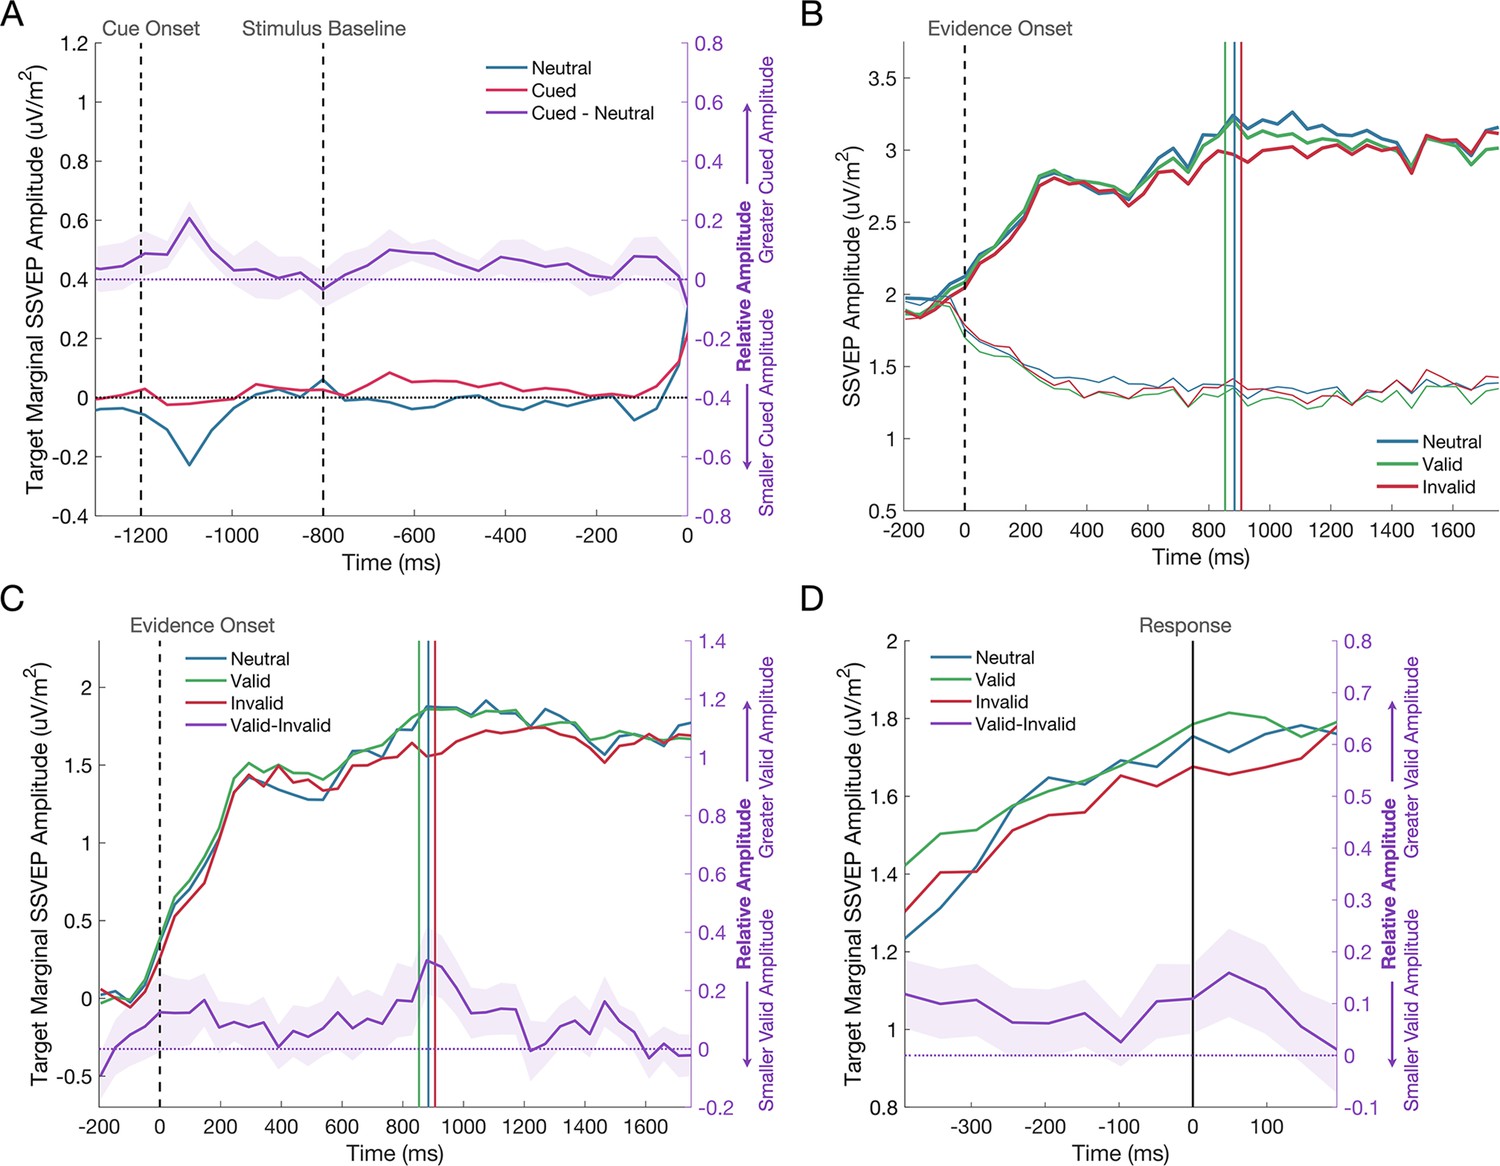
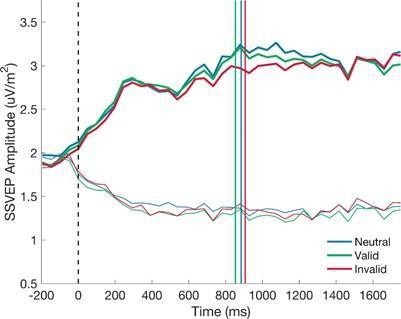
The SSVEP response to the predictive cue.
(A) There was no significant difference in the amplitude of the SSVEP across cued and neutral cue trials during the baseline phase of the trial, when the cue had been shown, but the gratings were presented at equal contrast. The cue was presented at –1200ms, the grating stimuli reached 50% contrast at –800ms (marked by the first dashed vertical line), and evidence onset at 0ms (marked by the second dashed vertical line). The deflection at approximately –1100ms is likely a response to the presentation of the directional cue. The shaded regions represent the standard error of the mean (n = 11). The difference between neutral and cued conditions is shown on the right axis in purple. (B) The effect of the cue on the evidence-locked SSVEP is shown for the target (thick line) and non-target (thin line) signals separately. (C) The target marginal SSVEP in the invalid cue condition has a reduced amplitude compared to the neutral and valid cue conditions. The dashed vertical line represents evidence onset and the coloured vertical lines represent the median reaction times for each cue condition. The difference between valid and invalid cue conditions is shown on the right axis in purple. (D) The response-locked SSVEP across cue conditions, where the vertical line marks the response. The same trend of a reduced amplitude in the invalid cue condition can be seen at all time points leading to the response. Again, the difference between valid and invalid cue conditions is shown on the right axis in purple.
Figure 4—figure supplement 1
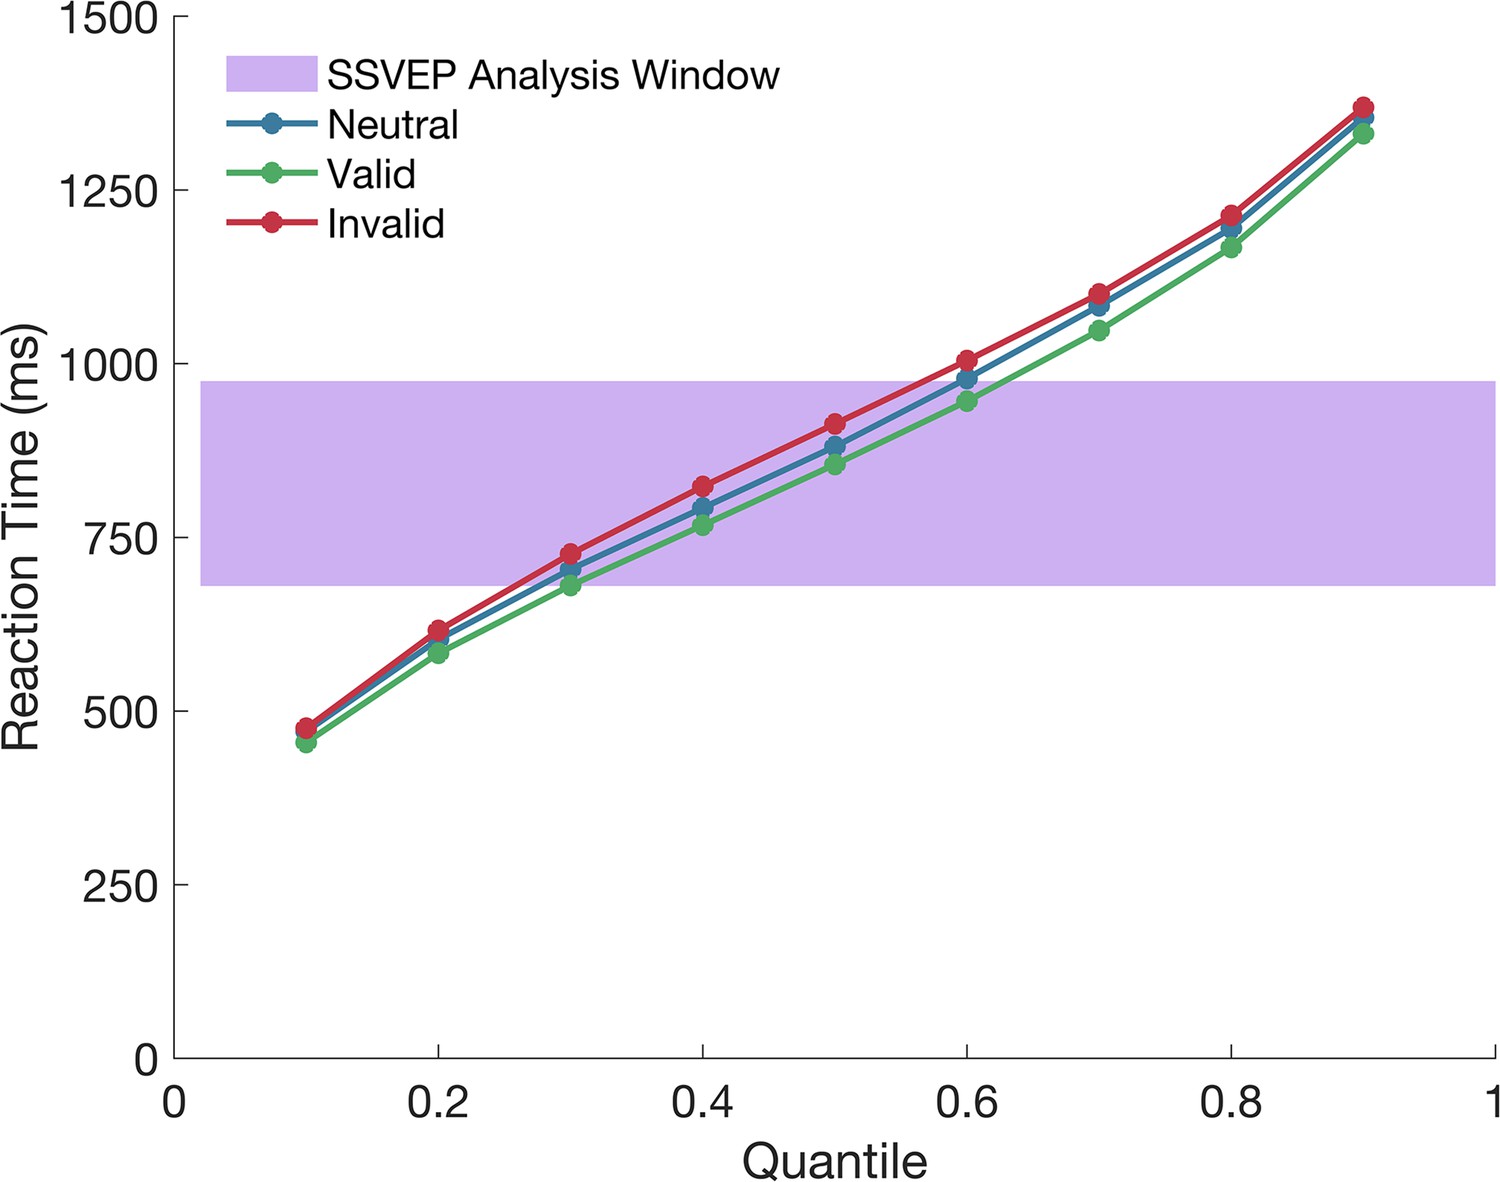
Reaction time quantiles across cue conditions.
The plot illustrates the proportion of trials where responses occurred at different stages of the trial. The SSVEP analysis window is highlighted in purple.
Figure 5
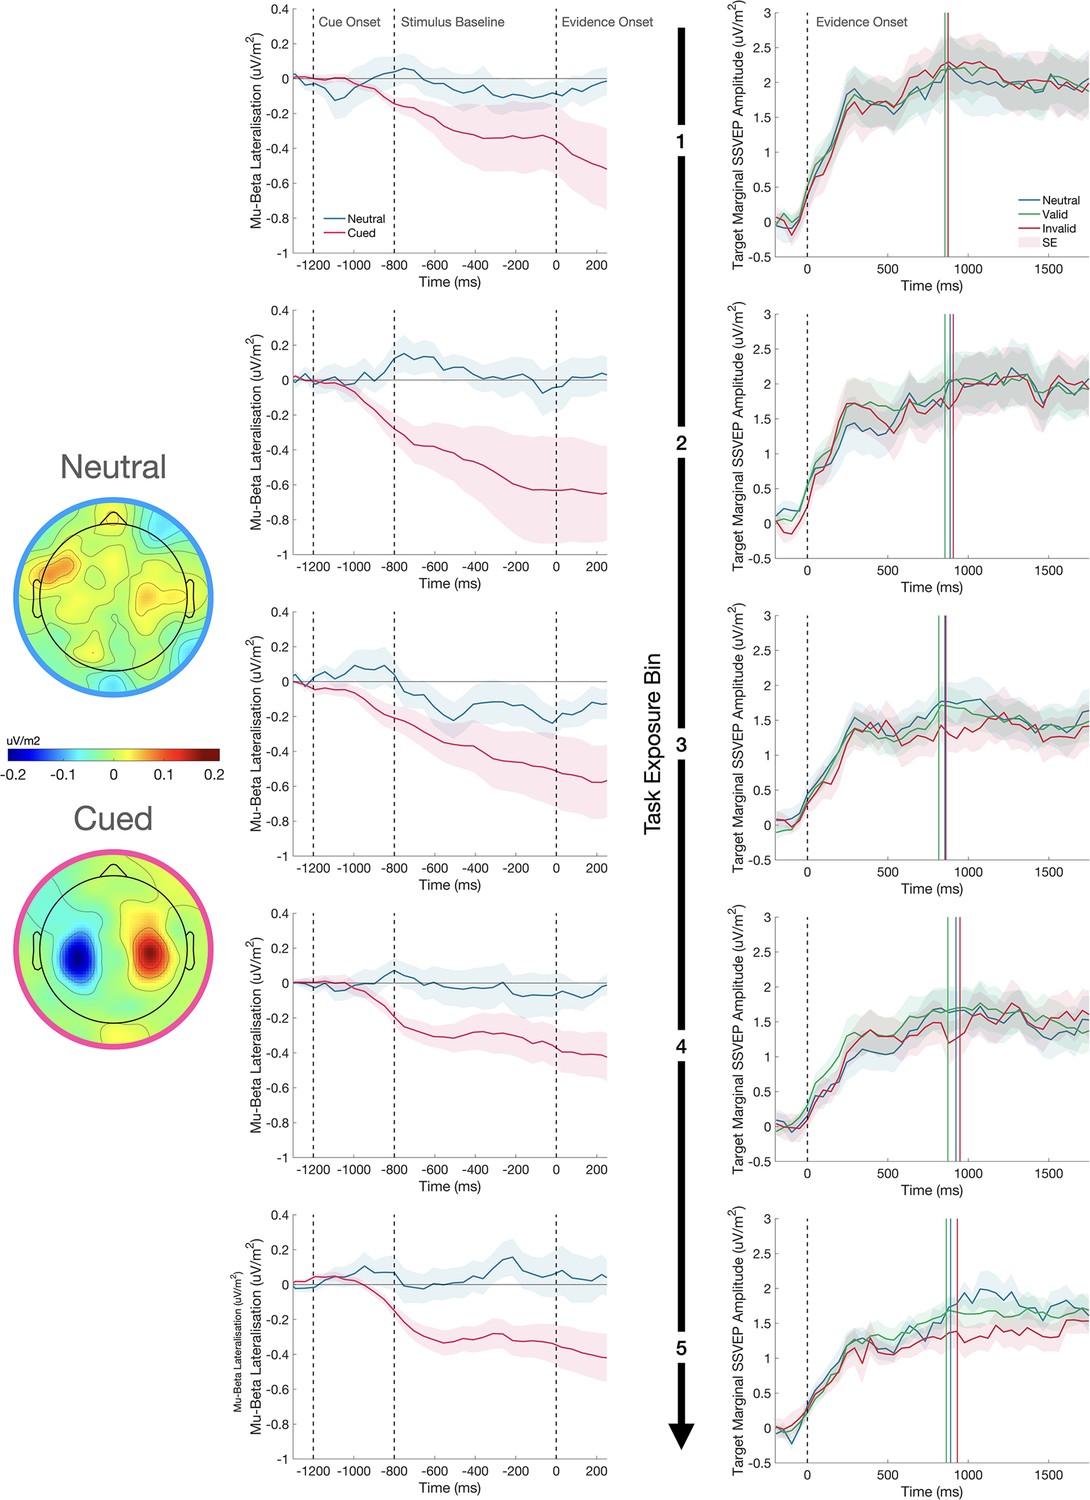
The effect of the cue on motor preparation before evidence onset, as indexed by mu-beta oscillatory activity (MB), and the representation of the sensory evidence (SSVEP) after evidence onset over the course of testing.
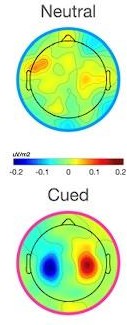
MB lateralisation (left) and the target marginal SSVEP (right) are shown for each of the five task exposure bins separated by rows. In the MB plots, cue-lateralised activity (contralateral minus ipsilateral) is shown during the 800ms baseline phase of the trial after presentation of the cue and immediately prior to evidence onset (0ms), where each grating was held at 50% contrast. Greater lateralisation of MB activity provides a neural signature of the extent of motor preparation for the contralateral response. In the cued conditions, the signals are defined as contralateral and ipsilateral to the cue; in the neutral cue condition, the signals are defined as contralateral and ipsilateral to the correct response on that trial, which could not be known before evidence onset. The topography of MB activity in the window - 200:0ms before evidence onset is plotted on a common scale for neutral and cued conditions separately. There was no change in the degree of pre-evidence MB lateralisation across task exposure. In the SSVEP plots, evidence onset is marked by the dashed vertical line. The coloured vertical lines represent the median reaction times for each cue condition in each plot and the shaded regions represent the standard error of the mean (n = 12 for MB and n = 11 for SSVEP). The relatively reduced amplitude of the marginal SSVEP in the invalid cue condition emerges over the course of task exposure.
Figure 6
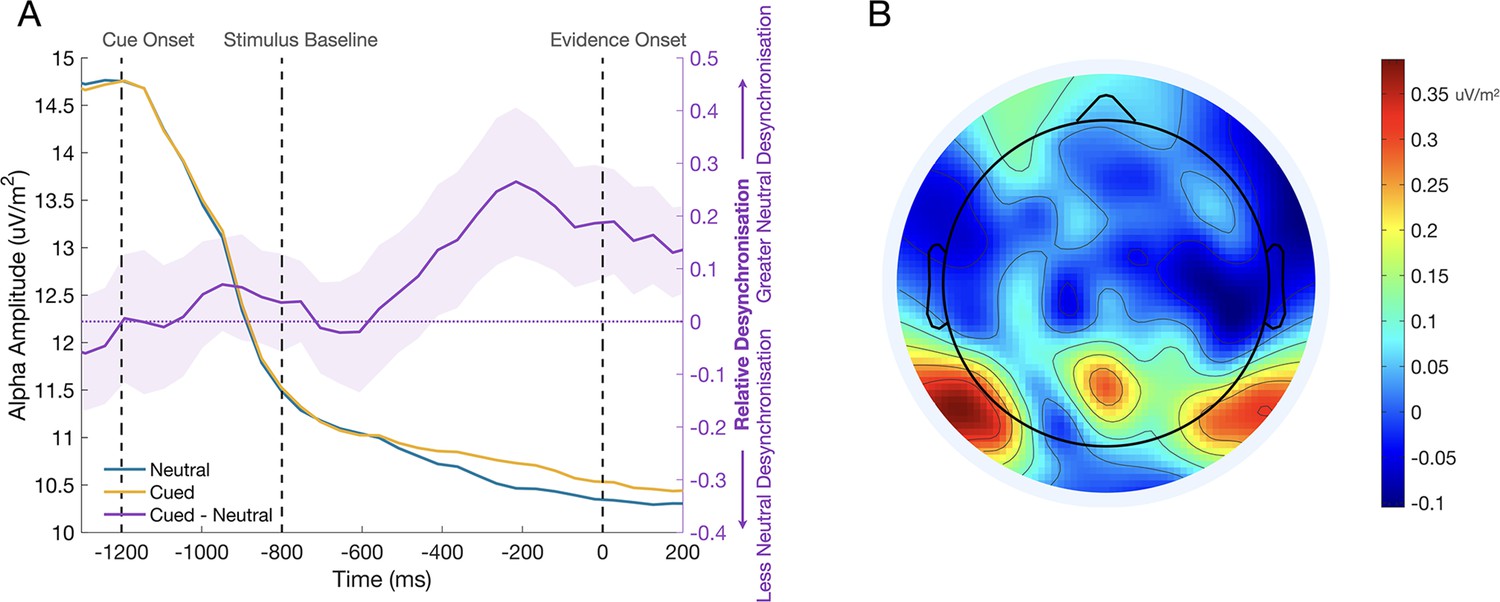
The effect of the cue stimulus engagement before evidence onset.
(A) Alpha waveforms for the cued and neutral conditions are shown in yellow and blue on the left axis. The difference between these conditions (cued - neutral) is shown on the right axis, where the shaded region represents the standard error (n = 12). Alpha desynchronisation is greater in the neutral cue condition, suggesting that participants may approach neutral cue trials with greater attention to the stimulus to optimise their encoding of the evidence in the absence of predictive information. (B) The topography of the difference between cued and neutral conditions in the pre-evidence window –362:–215ms. The differential activity has the expected central occipito-parietal topography.
Author response image 1

Reaction time quantiles across cue conditions.
The plot illustrates the proportion of trials where responses occurred at different stages of the trial. The SSVEP analysis window is highlighted in purple.
Author response image 2
Author response image 3

Author response image 4
Author response image 5

Author response image 6

Additional files
Download links
A two-part list of links to download the article, or parts of the article, in various formats.
Downloads (link to download the article as PDF)
Open citations (links to open the citations from this article in various online reference manager services)
Cite this article (links to download the citations from this article in formats compatible with various reference manager tools)
Prior probability cues bias sensory encoding with increasing task exposure
eLife 12:RP91135.
https://doi.org/10.7554/eLife.91135.3


