PKR activation-induced mitochondrial dysfunction in HIV-transgenic mice with nephropathy
- Kidney Disease Section, Kidney Diseases Branch, NIDDK, NIH, United States
- Department of Pathology, Johns Hopkins Medical Institutions, United States
- Department of Pathology and Anatomical Sciences, Jacobs School of Medicine & Biomedical Sciences, University at Buffalo, United States
- Department of Biochemistry and Molecular & Cellular Biology, Georgetown University, United States
- Polycystic Kidney Disease Section, Kidney Diseases Branch, NIDDK, NIH, United States
- Frederick National Laboratory for Cancer Research, NCI, NIH, United States
- College of Medicine, University of Florida, United States
- Nephrology Endocrinology and Vascular Medicine, Tohoku University Hospital, Japan
Figures
Figure 1
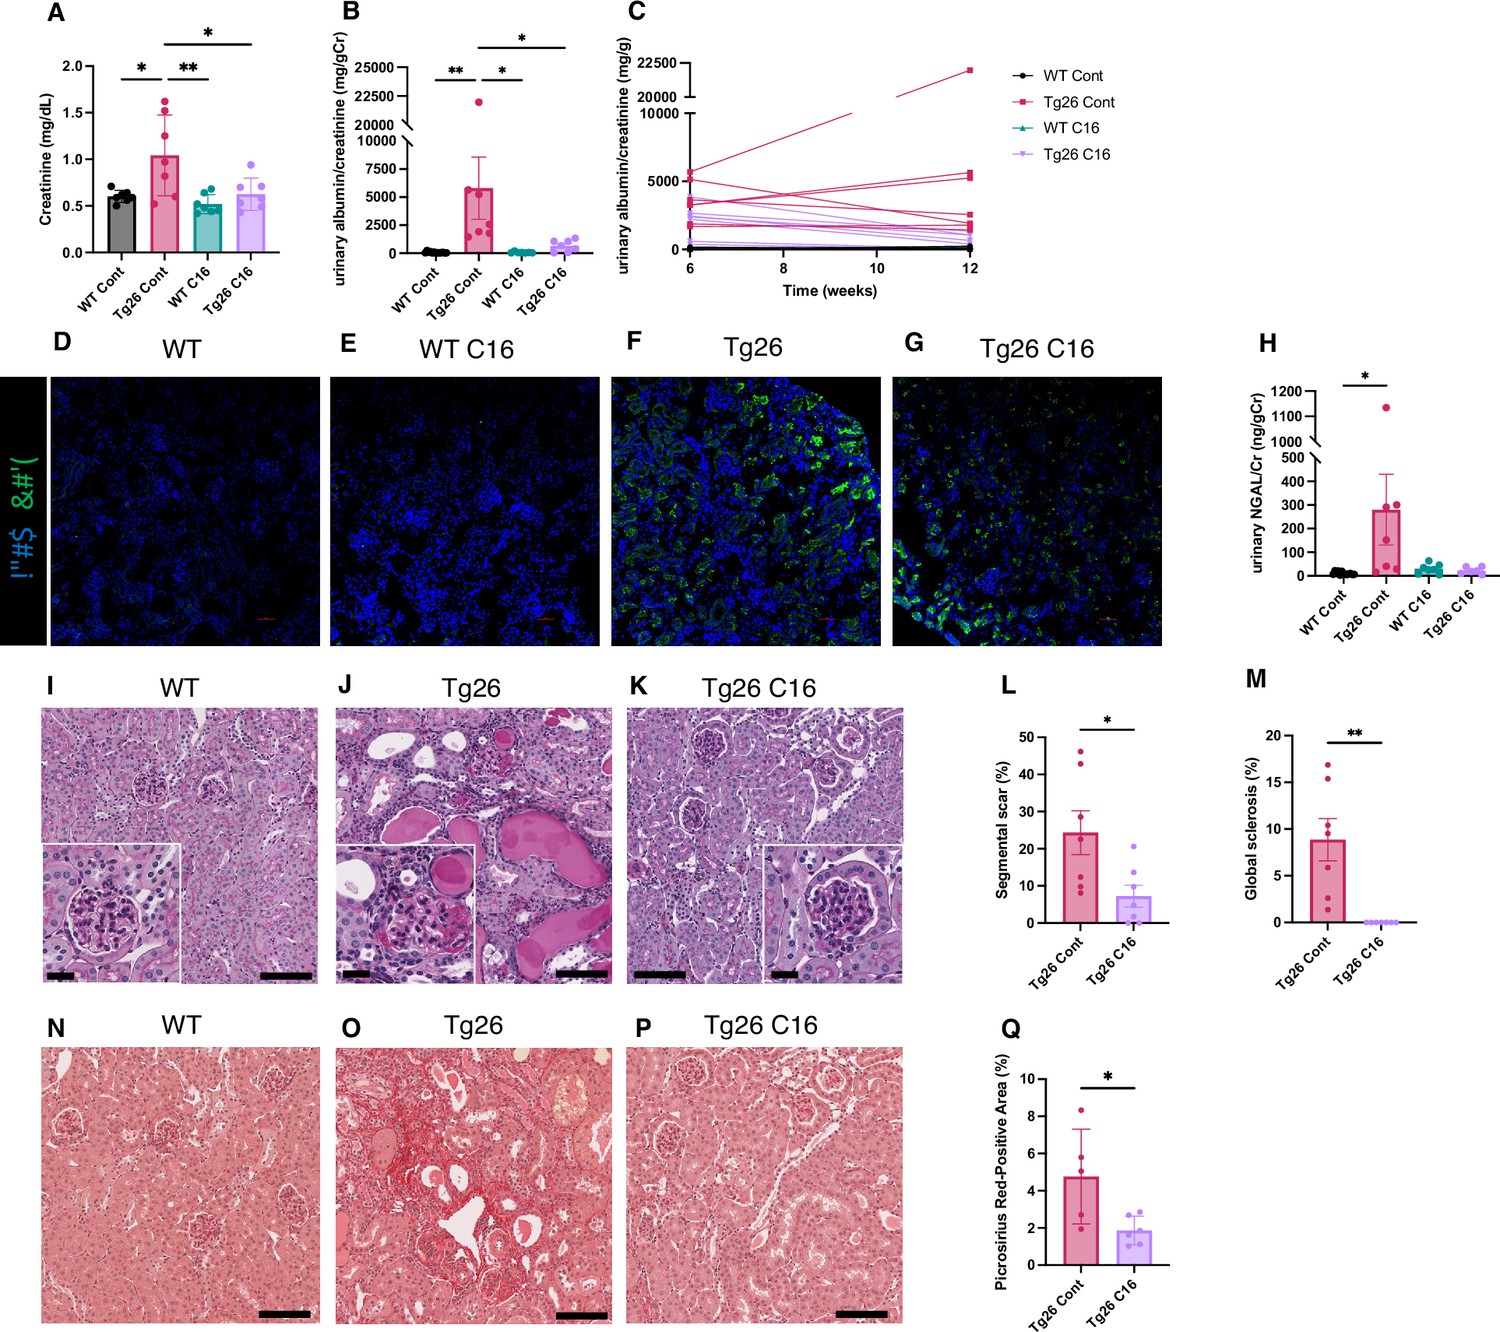
PKR inhibition by C16 ameliorates Tg26 mice kidney phenotype.
(A–C) Shown are the following: plasma creatinine (mg/dl, mean with SD), urinary albumin-to-creatinine ratio (mg/g creatinine, mean with SEM), urinary albumin-to-creatinine ratio (mg/g creatinine) of 6 and 12 weeks of age. (D–G) Immunofluorescent images showed PKR activation by detecting pPKR in Tg26 mouse kidney. pPKR was inhibited by C16 treatments. (H) Shown is urinary neutrophil gelatinase-associated lipocalin (NGAL)-to-creatinine ratio (ng/g creatinine, mean with SEM). (I–K) Representative PAS staining images of wild-type (WT), Tg26, and C16-treated Tg26 kidney. (L, M) Quantitative analysis of glomeruli for segmental scarring and global sclerosis (mean with SEM). (N–P) Representative Picrosirius Red staining images of WT, Tg26, and C16-treated Tg26 kidney. (Q) Quantitative analysis of Picrosirius Red staining area (mean with SD). (one-way ANOVA (A, B, H), t-test (L, M, Q); *, p<0.05; **, p<0.01; scale bars are 50 μm).
Figure 2 with 2 supplements
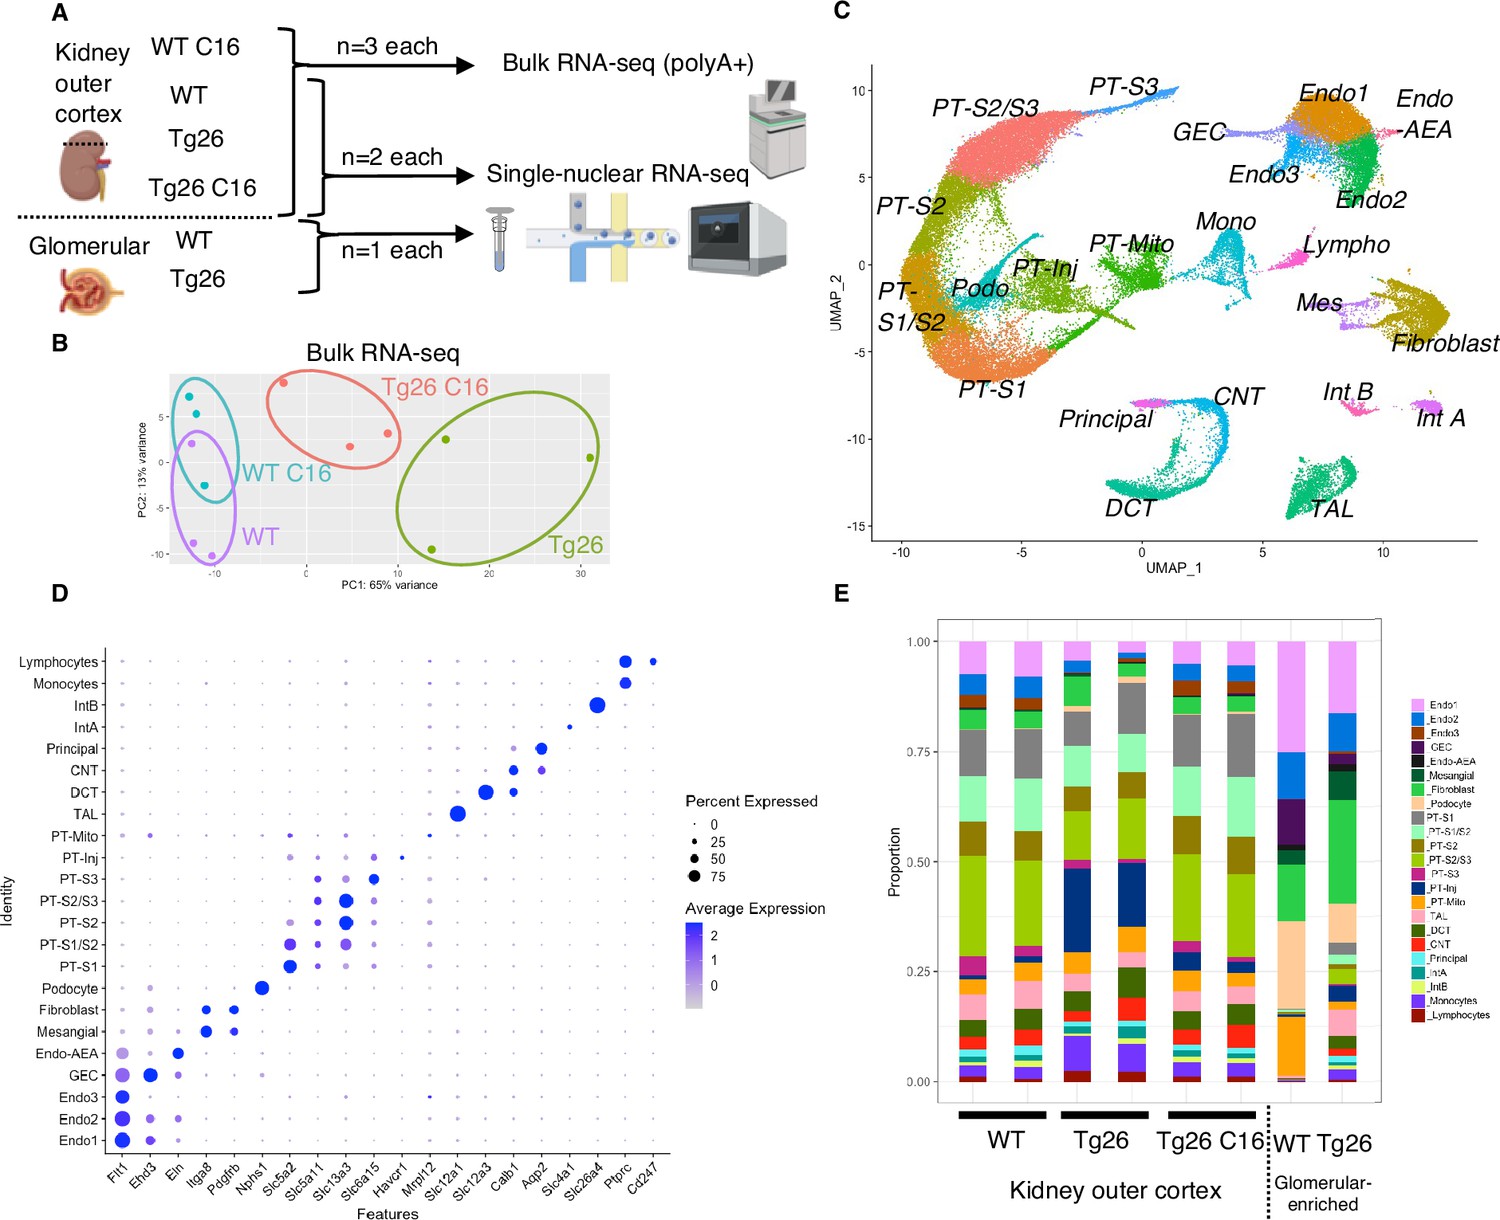
Overview of bulk RNA-seq and single-nucleus RNA-seq experiments.
(A) Shown is the workflow of the bulk RNA-seq and single-nucleus RNA-seq experiments. (B) Principal component analysis plot of bulk RNA-seq results. (C) Uniform manifold approximation and projection (UMAP) plot of single-nuclear RNA-seq data from 8 samples, 56,976 nuclei, showing 23 clusters. (D) Shown is a dot plot of 23 marker genes, each characteristic for the cluster. (E) Shown is the ratio of nuclei grouped to each cluster in each sample.
Figure 2—figure supplement 1
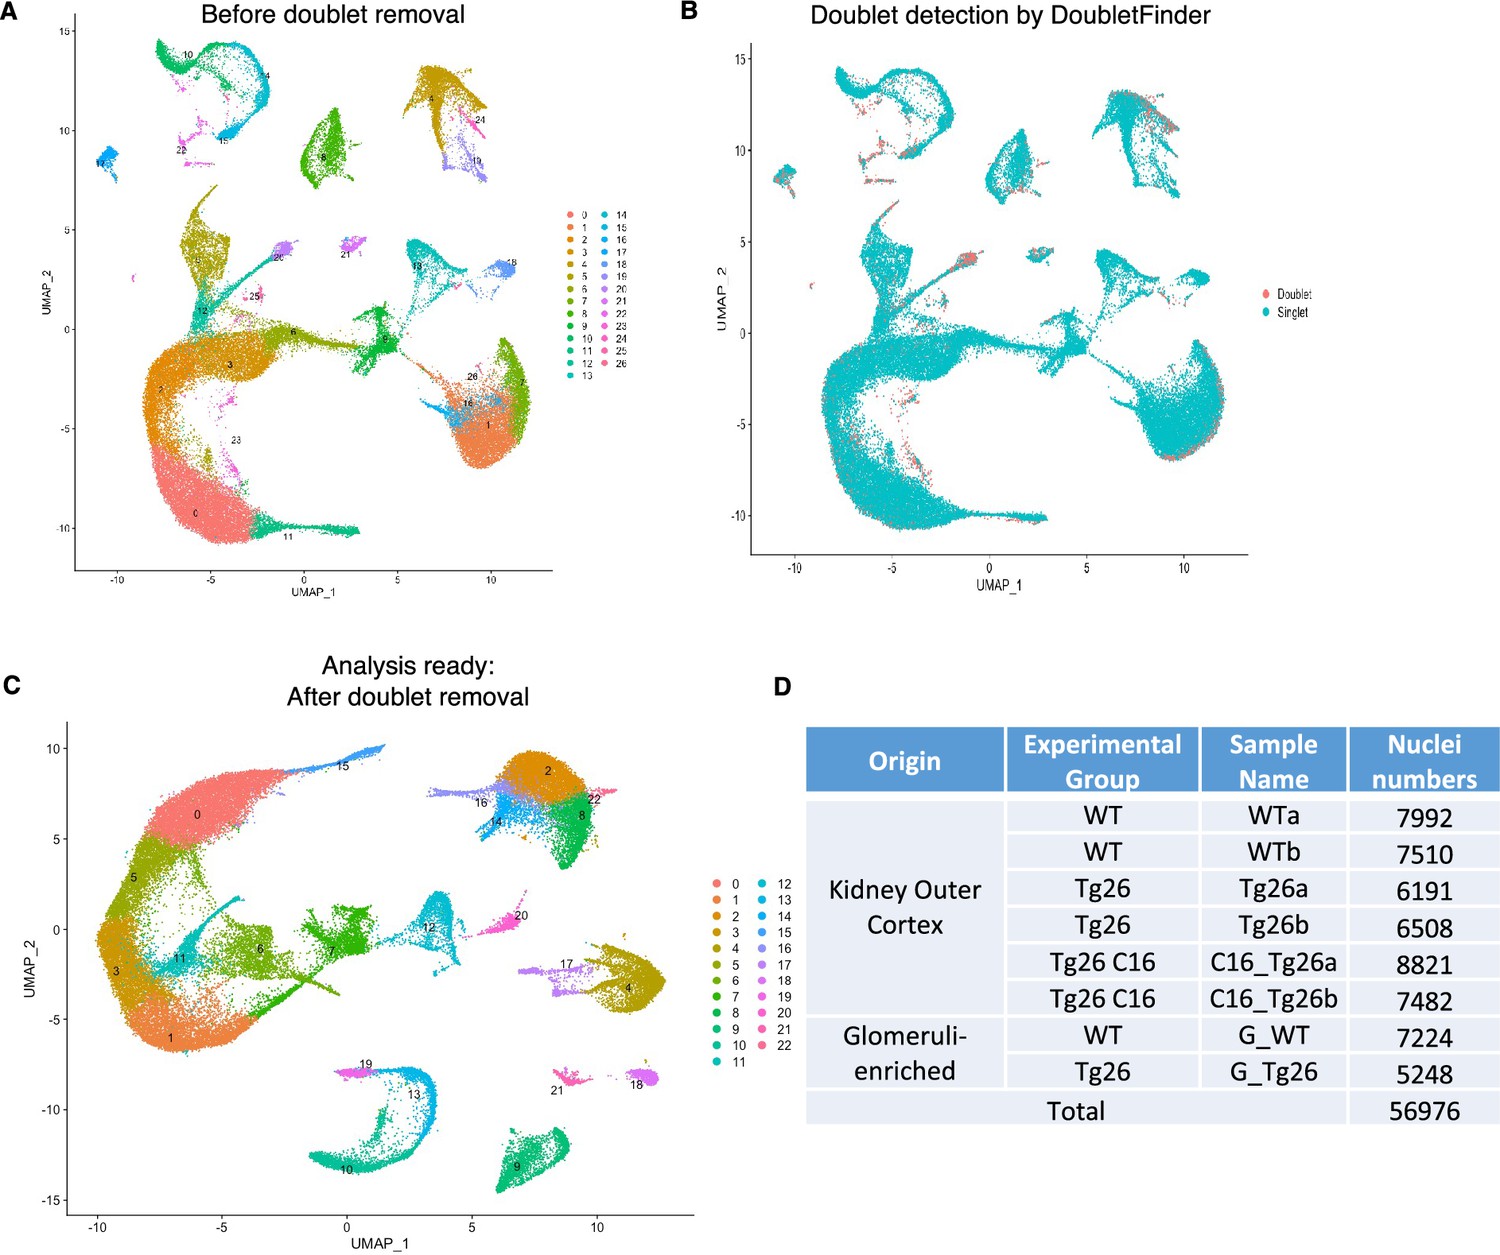
Pre-processing of single-nuclear RNA-seq data.
(A) Uniform manifold approximation and projection (UMAP) plot of single-nuclear RNA-seq data before doublet removal from 8 samples, 57,061 cells, showing 27 clusters. (B) UMAP plot showing detected doublet by DoubletFinder. (C) UMAP plot after doublet removal, showing 23 clusters, 56,976 nuclei for the analysis. (D) Breakdown of nuclei numbers from each sample showed comparable numbers of nuclei analyzed.
Figure 2—figure supplement 2
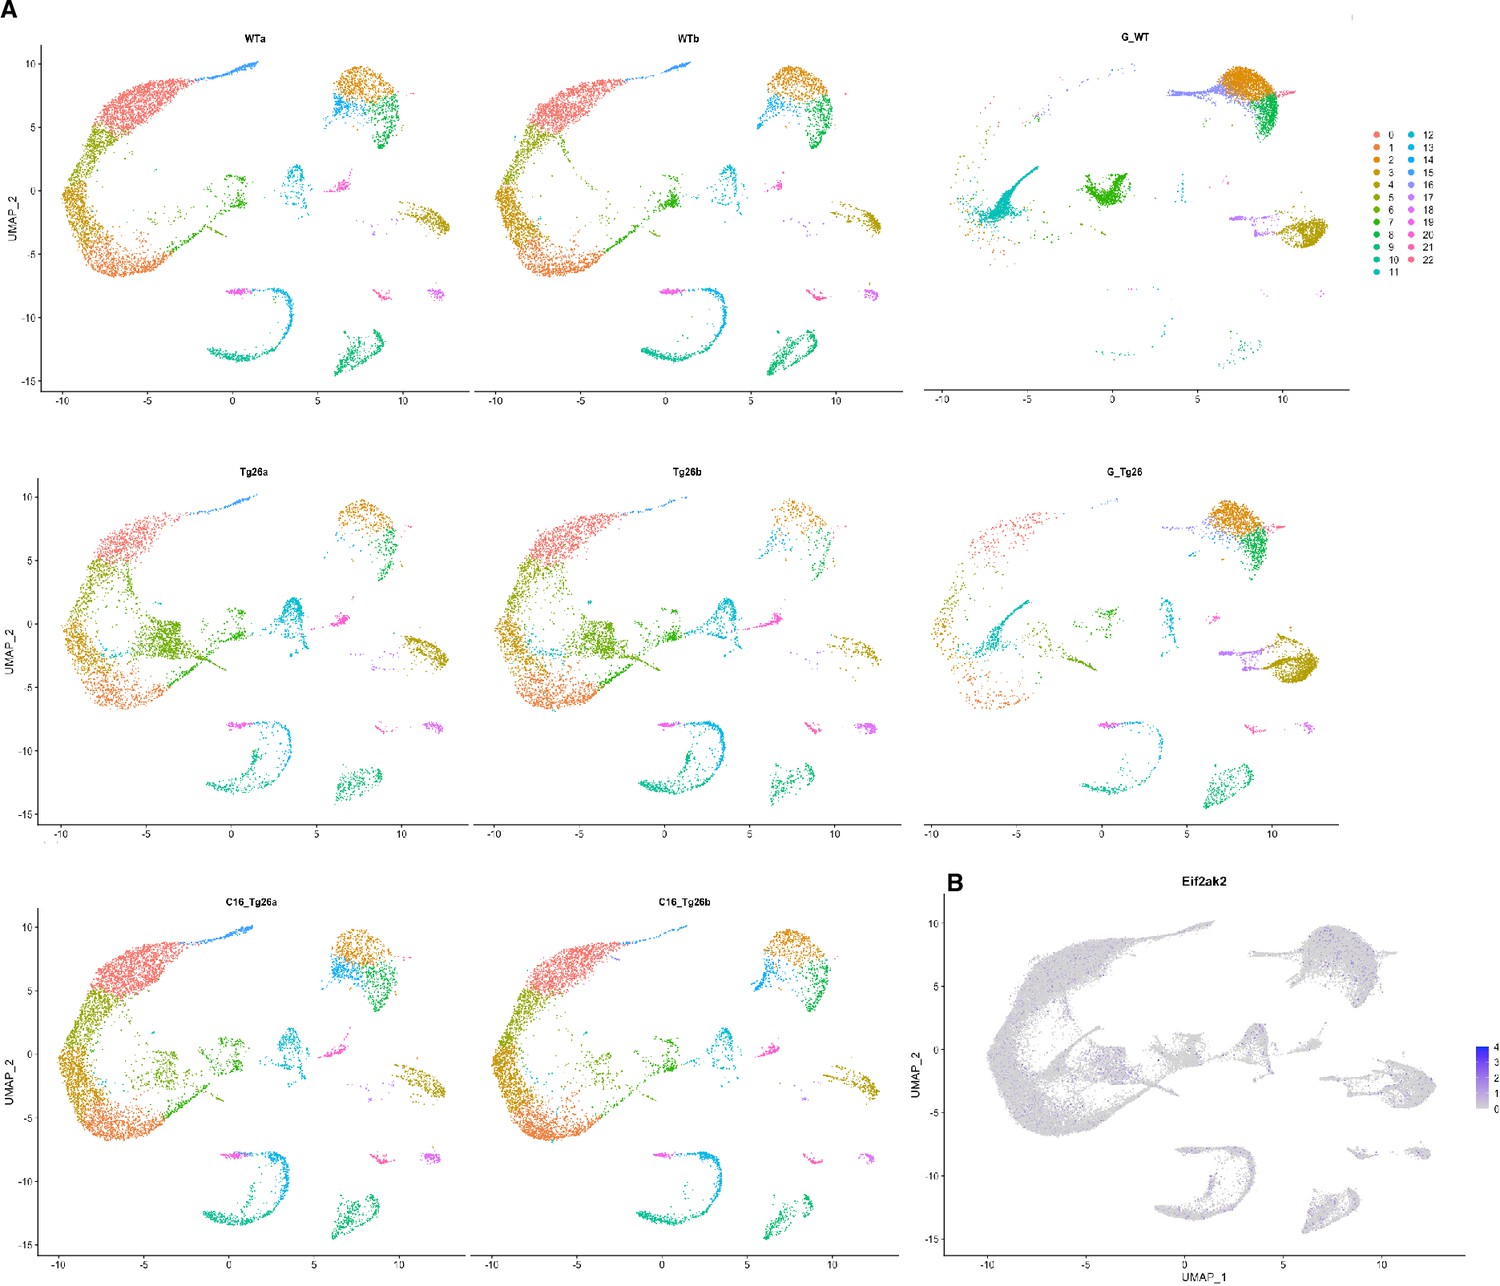
Additional plots of single-nuclear RNA-seq data.
(A) Uniform manifold approximation and projection (UMAP) plot of single-nuclear RNA-seq data from each 8 samples. (B) Feature plot showing Eif2ak2 expression.
Figure 3 with 1 supplement
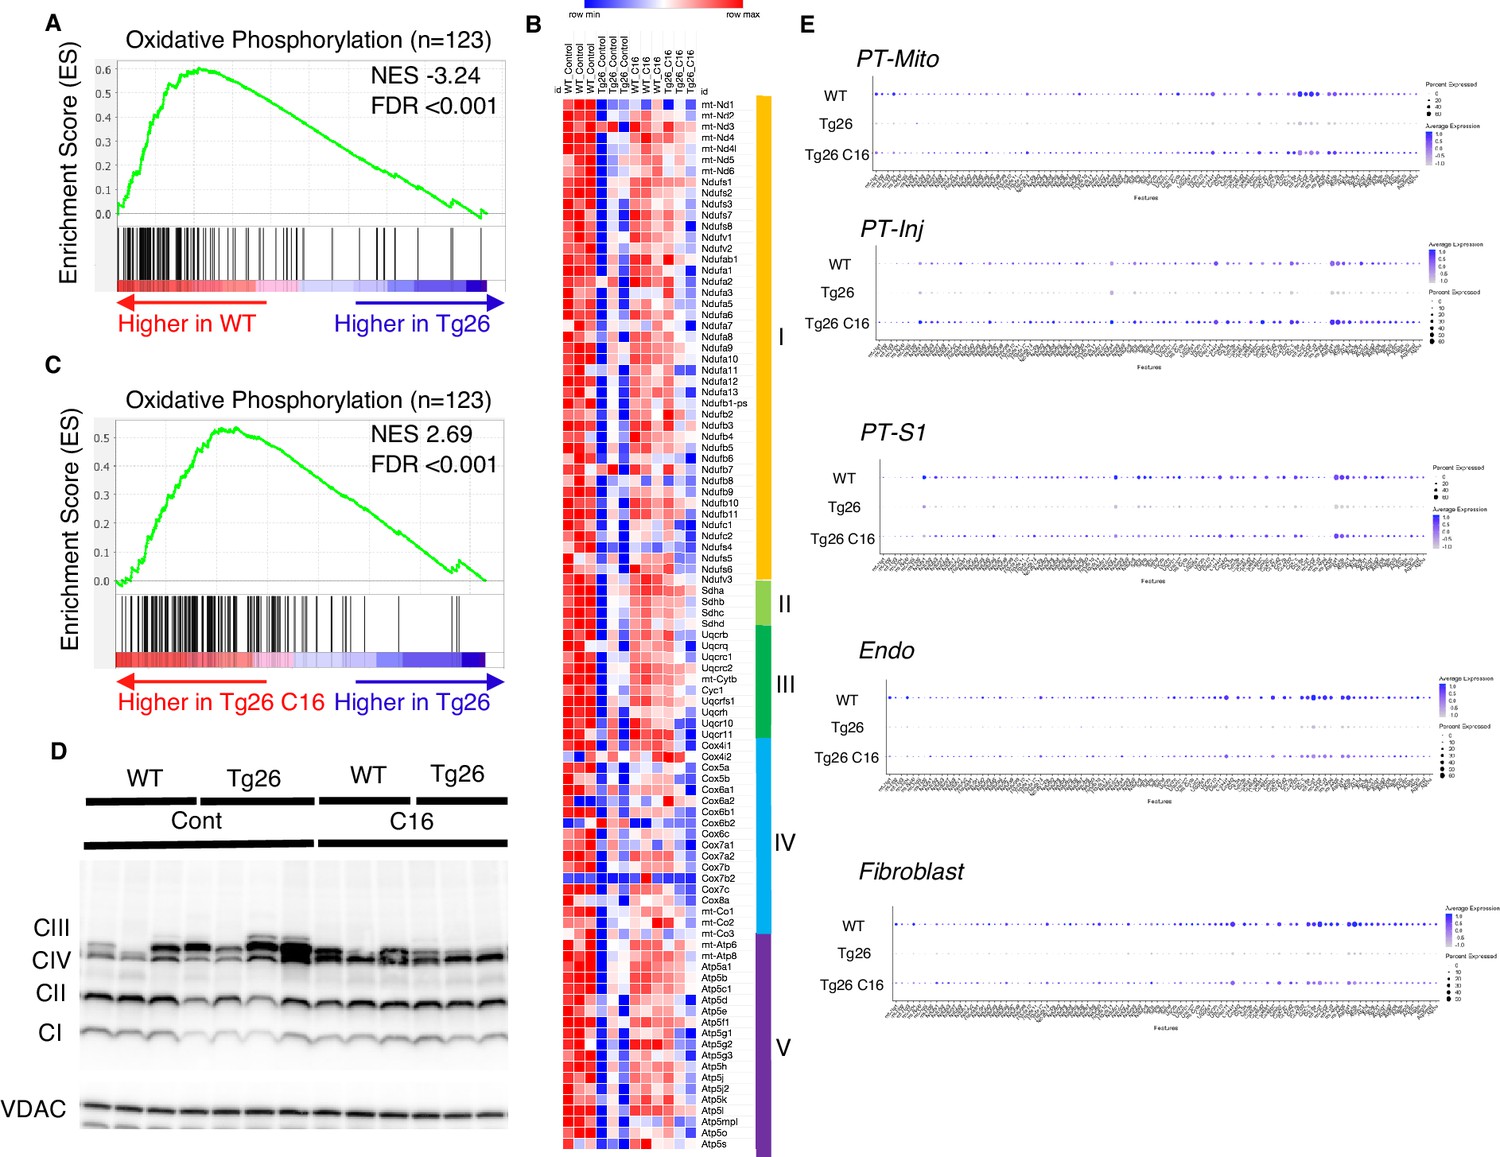
Oxidative phosphorylation genes are downregulated in Tg26 mice and downregulation is reversed by PKR inhibition using C16.
(A) Shown is the enrichment plot of oxidative phosphorylation pathway based on bulk mRNA-seq comparing Tg26 and wild-type (WT). (B) Shown is the enrichment plot of oxidative phosphorylation pathway based on bulk mRNA-seq comparing C16-treated Tg26 and Tg26. (C) Heatmap of expressed genes in oxidative phosphorylation pathway (n=123), based on data from bulk mRNA-seq. (D) Western blot to identify mitochondrial subunits CI through CIV and VDAC. (E) Dot plot showing expression of oxidative phosphorylation pathway genes in PT-Mito, PT-S1, PT-Inj, Endo, and Fibroblast cluster by snRNA-seq.
-
Figure 3—source data 1
Uncropped and labeled gels for Figure 3D.
- https://cdn.elifesciences.org/articles/91260/elife-91260-fig3-data1-v2.zip
-
Figure 3—source data 2
Raw unedited gels for Figure 3D.
- https://cdn.elifesciences.org/articles/91260/elife-91260-fig3-data2-v2.zip
Figure 3—figure supplement 1
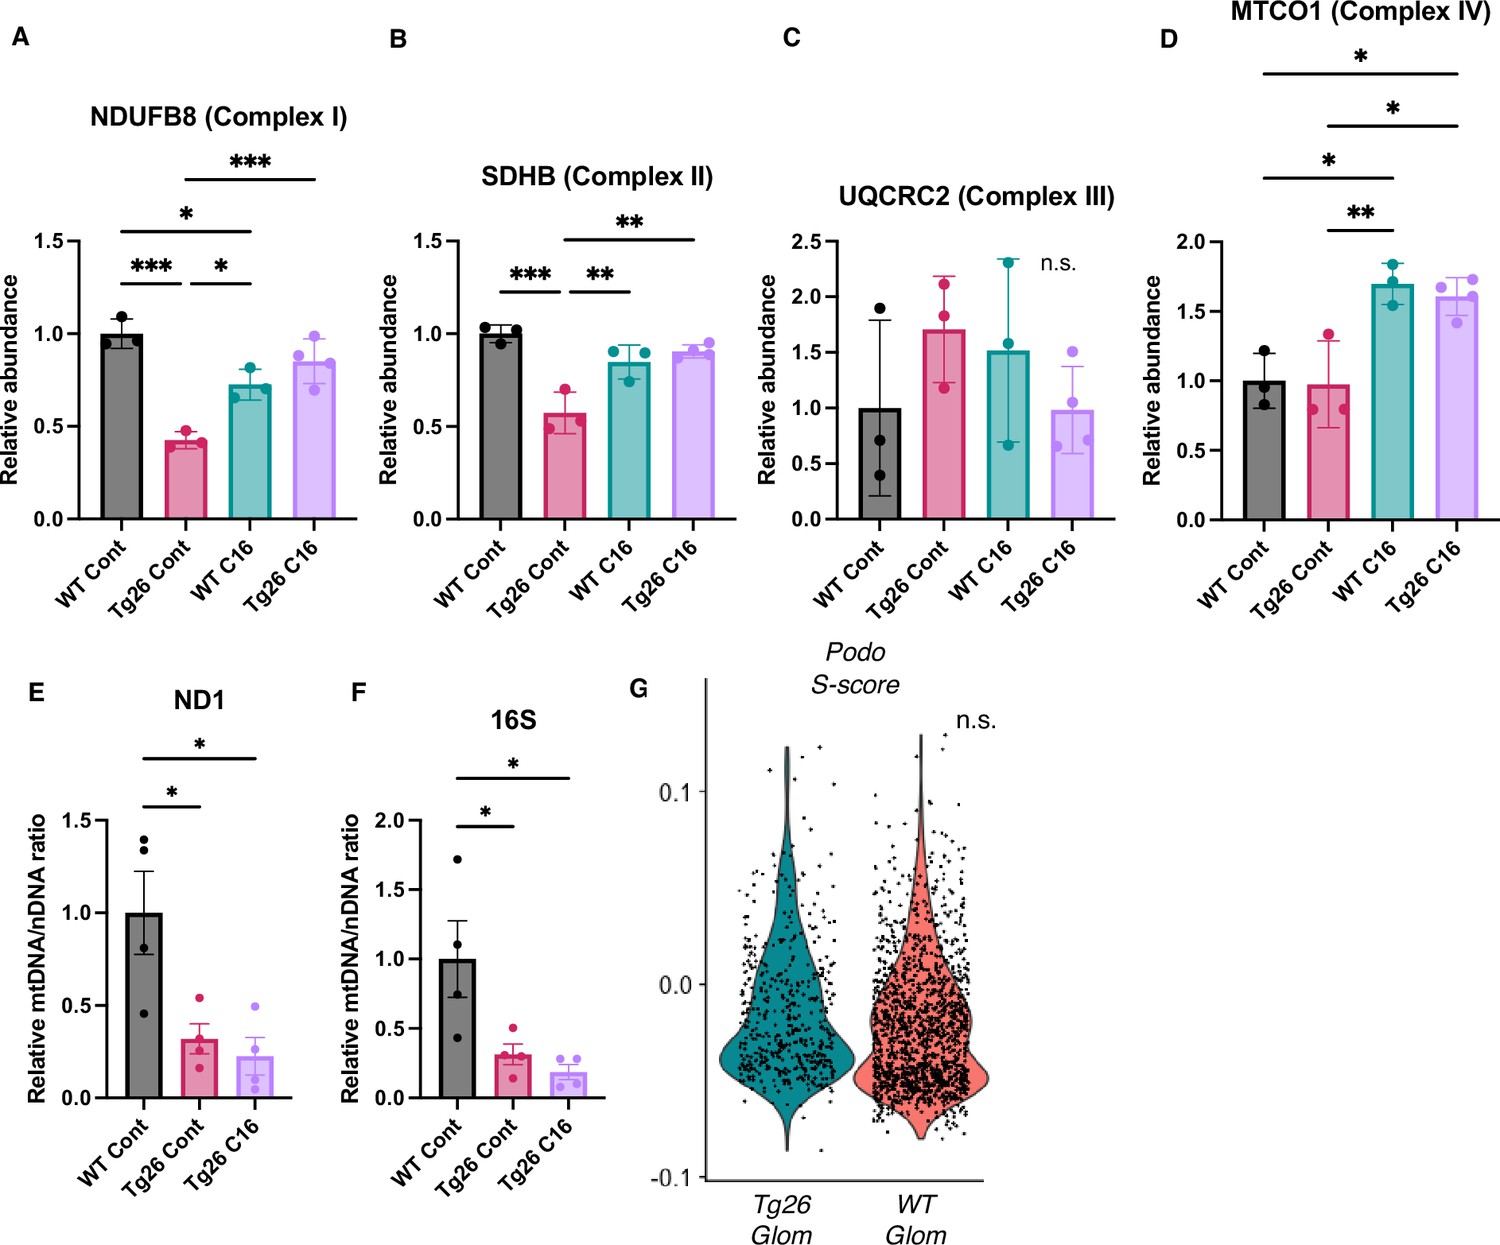
Additional data about mitochondria and S phase score of podocytes.
(A–D) Quantification of western blot probed against mitochondrial subunits normalized by VDAC (mean with SD). (E and F) Relative expression ratio of Nd1 and 16S divided by Hk2 (mean with SEM). (G) Violin plot showing S phase score of podocytes in each sample (one-way ANOVA; *, p<0.05; **, p<0.01; ***, p<0.001).
Figure 4 with 3 supplements
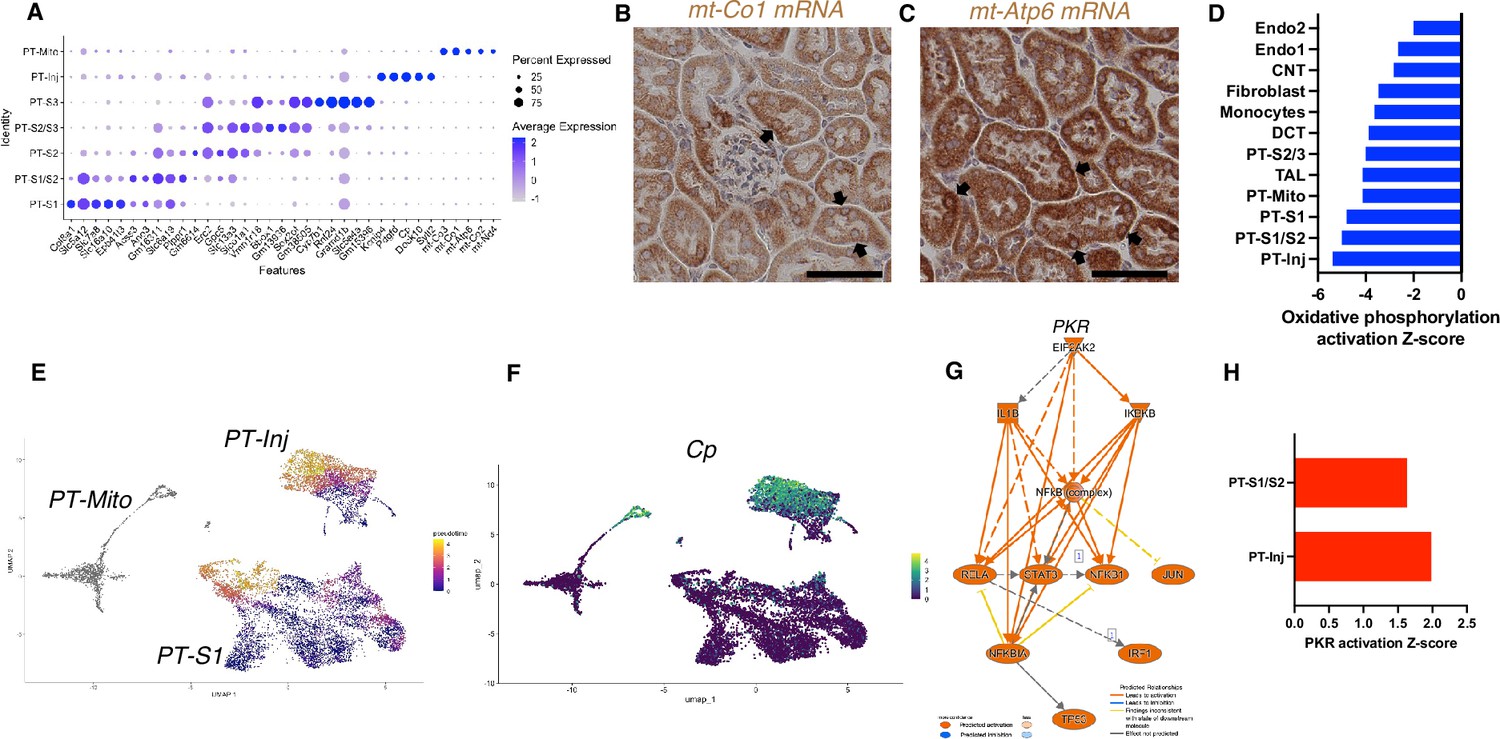
PT-Mito and PT-Inj cluster characterization.
(A) Shown are dot plots showing the top five marker genes in each of the PT clusters (PT-S1, PT-S1/S2, PT-S2, PT-S2/S3, PT-S3, PT-Inj, PT-Mito). (B, C) In situ hybridization of mt-Co1 and mt-Atp6 genes showed signals inside nuclei of wild-type (WT) mice (scale bars are 50 μm). (D) Shown is the activation Z-score of the oxidative phosphorylation pathway by pathway analysis of each cluster comparing Tg26 vs WT mice. (E) Trajectory analysis results including PT-S1, PT-Mito, PT-Inj from WT and Tg26 mice. (F) Ceruloplasmin (Cp) expression in the trajectory analysis plot. (G) PKR downstream pathway mapping by IPA comparing Tg26 vs WT by bulk mRNA-seq data. (H) Activation Z-score of PKR pathway by IPA in each cluster comparing Tg26 vs WT.
Figure 4—figure supplement 1
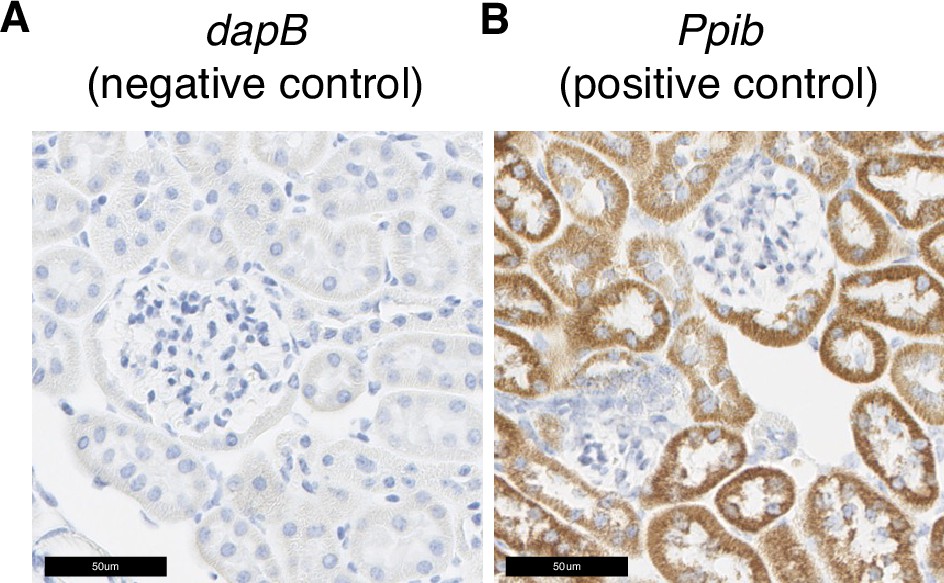
Additional in situ hybridization images.
(A) In situ hybridization images probing dapB (negative control probe) showed no signals. (B) In situ hybridization images probing Ppib (positive control probe) showed strong signals.
Figure 4—figure supplement 2
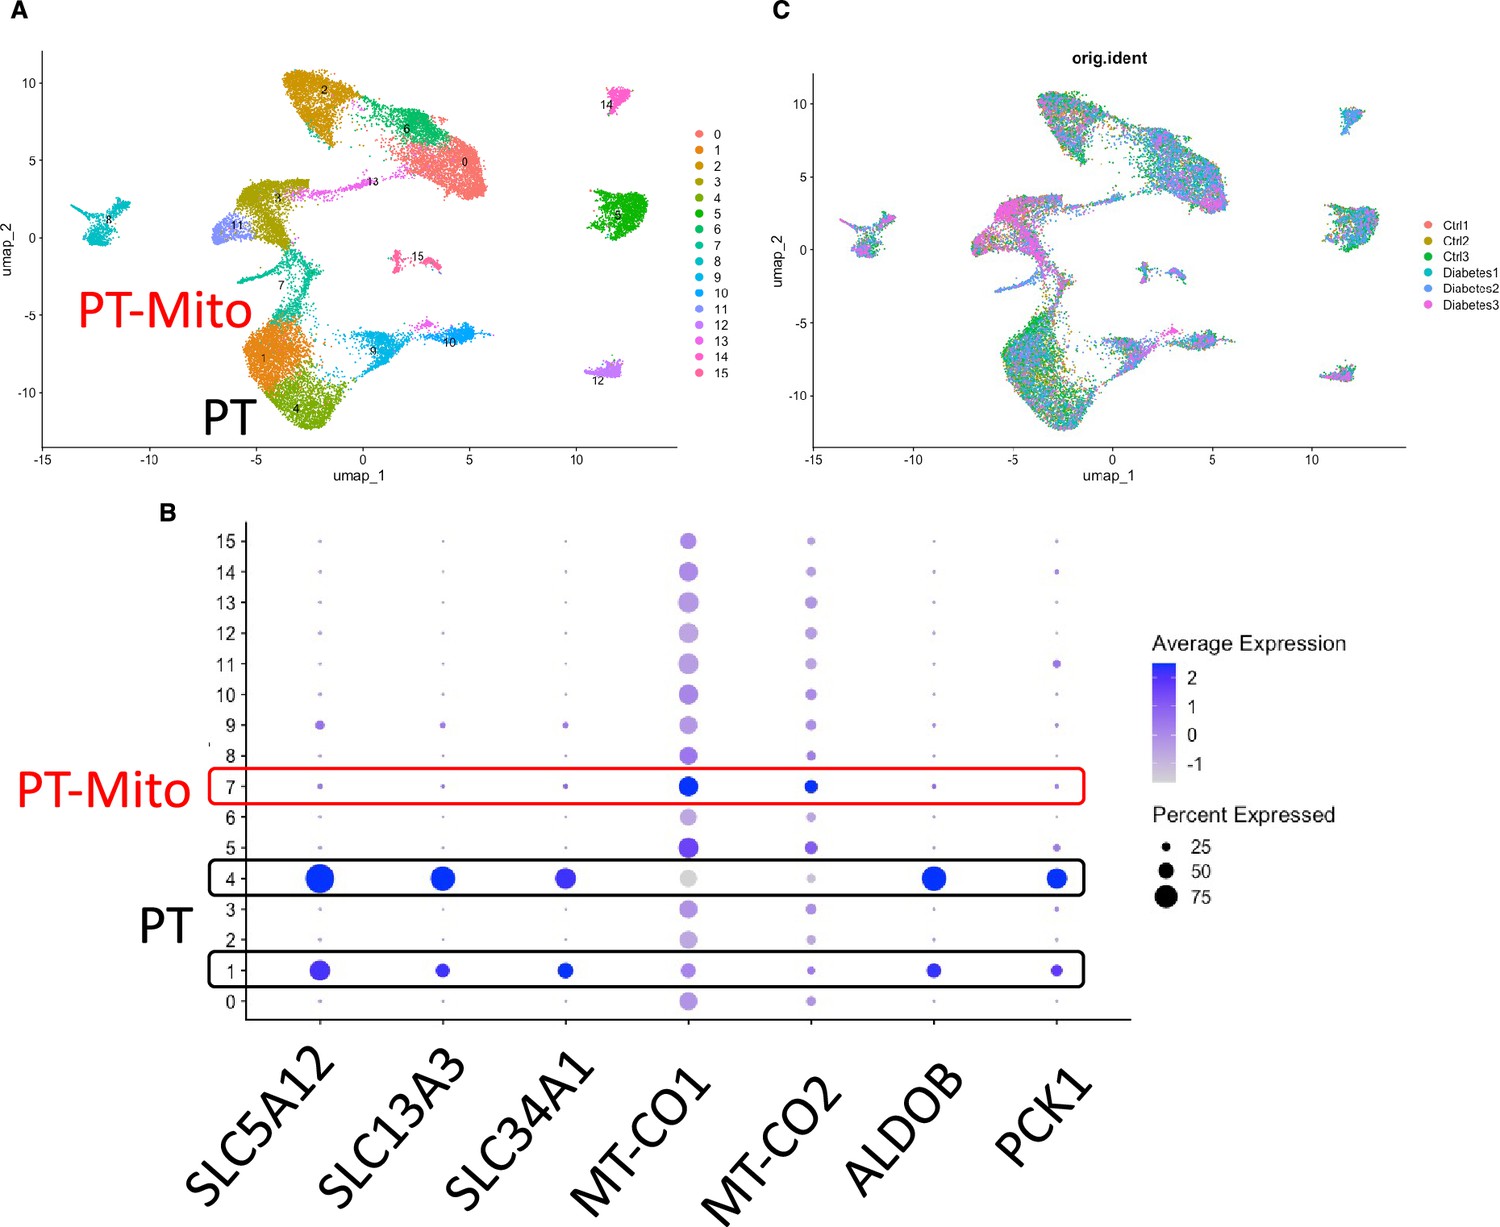
PT-Mito cluster detection of publicly available human kidney single-nuclear RNA-seq data (GSE131882).
(A) Uniform manifold approximation and projection (UMAP) plot of human kidney single-nuclear RNA-seq data shows 16 clusters. Clusters 1, 4 are proximal tubule (PT) clusters, and cluster 7 is PT-Mito cluster. (B) Dot plot shows expression of PT marker genes and PT-Mito marker genes obtained from current manuscript data. PT-Mito markers including MT-CO1 and MT-CO2 had high expression in cluster 7. (C) UMAP plot shows all six samples are contributing to all cell clusters.
Figure 4—figure supplement 3
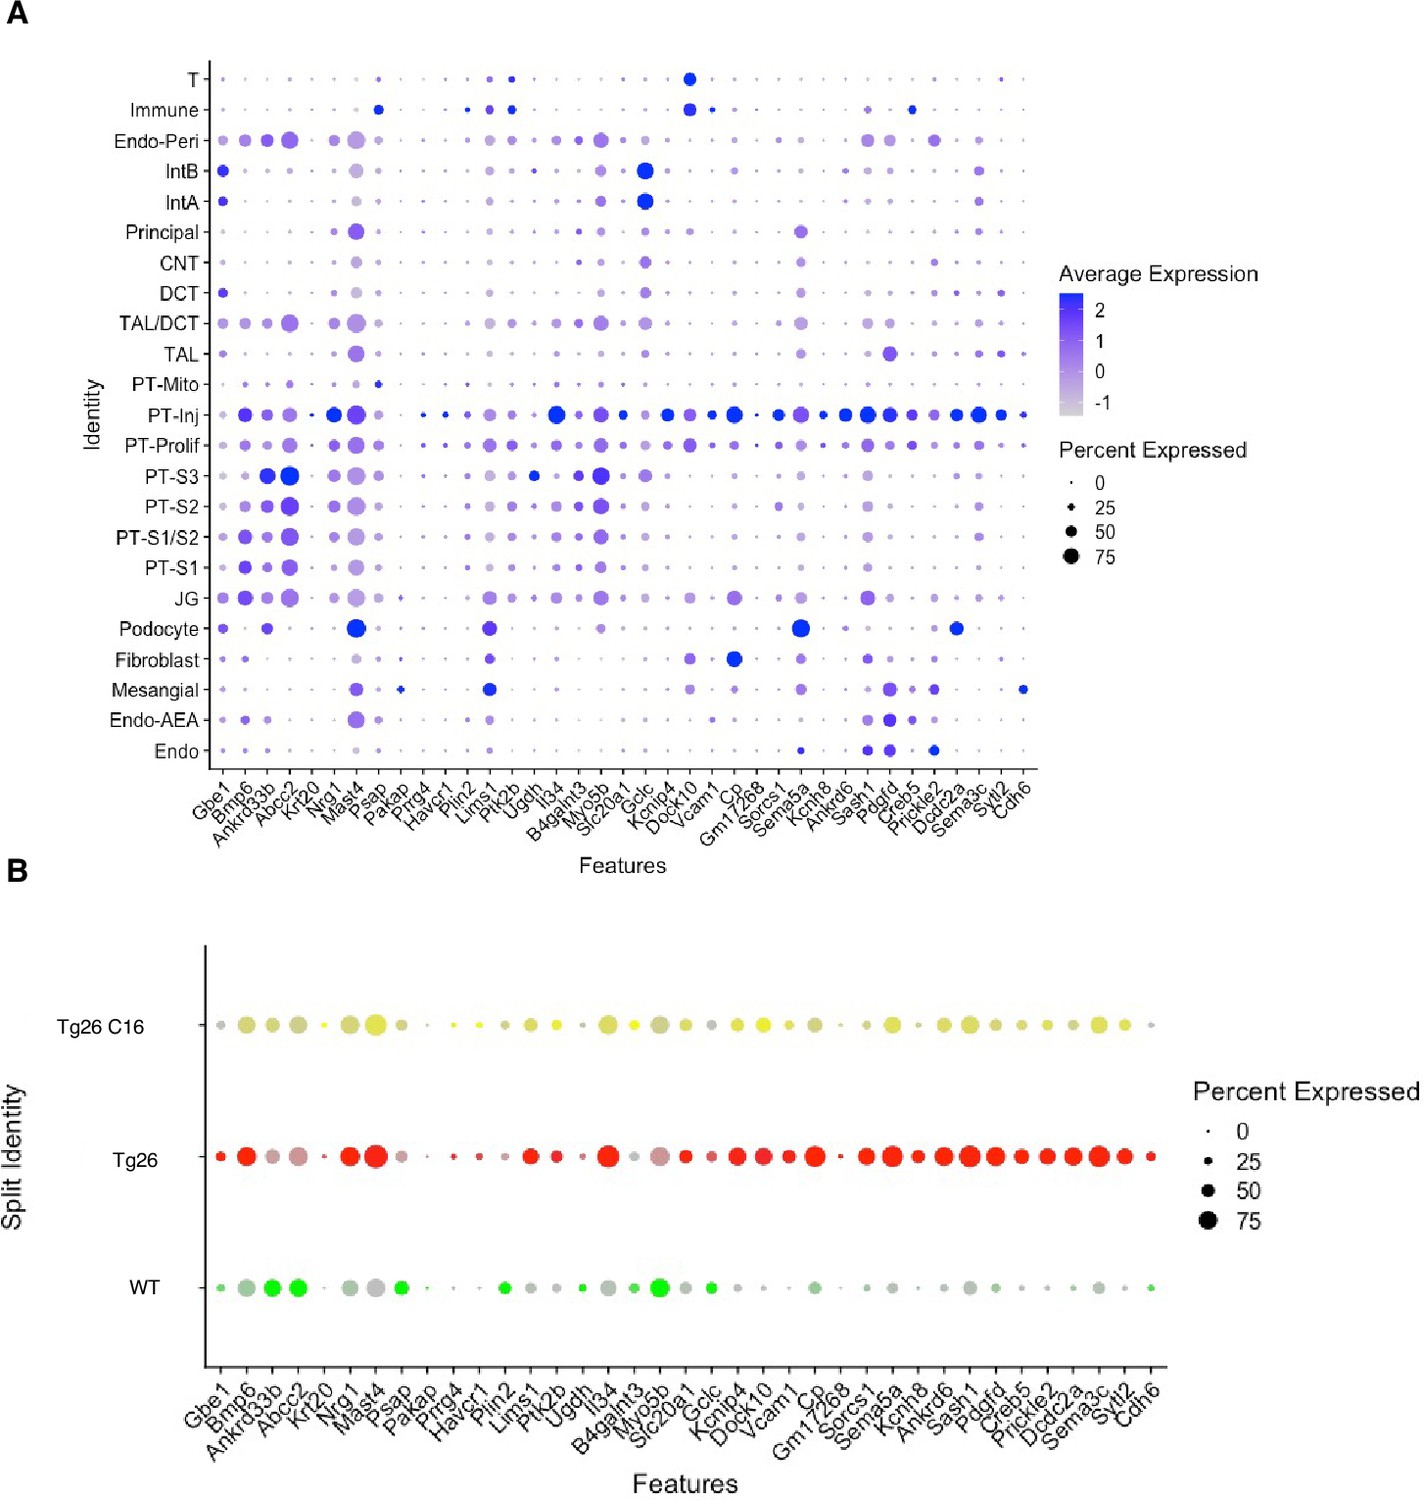
Single-nuclear RNA-seq data comparison with ischemic reperfusion injury model.
(A) Dot plot showing expression of marker genes reported in new proximal tubular clusters by mouse ischemic reperfusion acute kidney injury model (Kirita.PNAS.2020). (B) Dot plot showing expression of marker genes reported (Kirita.PNAS.2020) in PT-Inj cells by snRNA-seq.
Figure 5
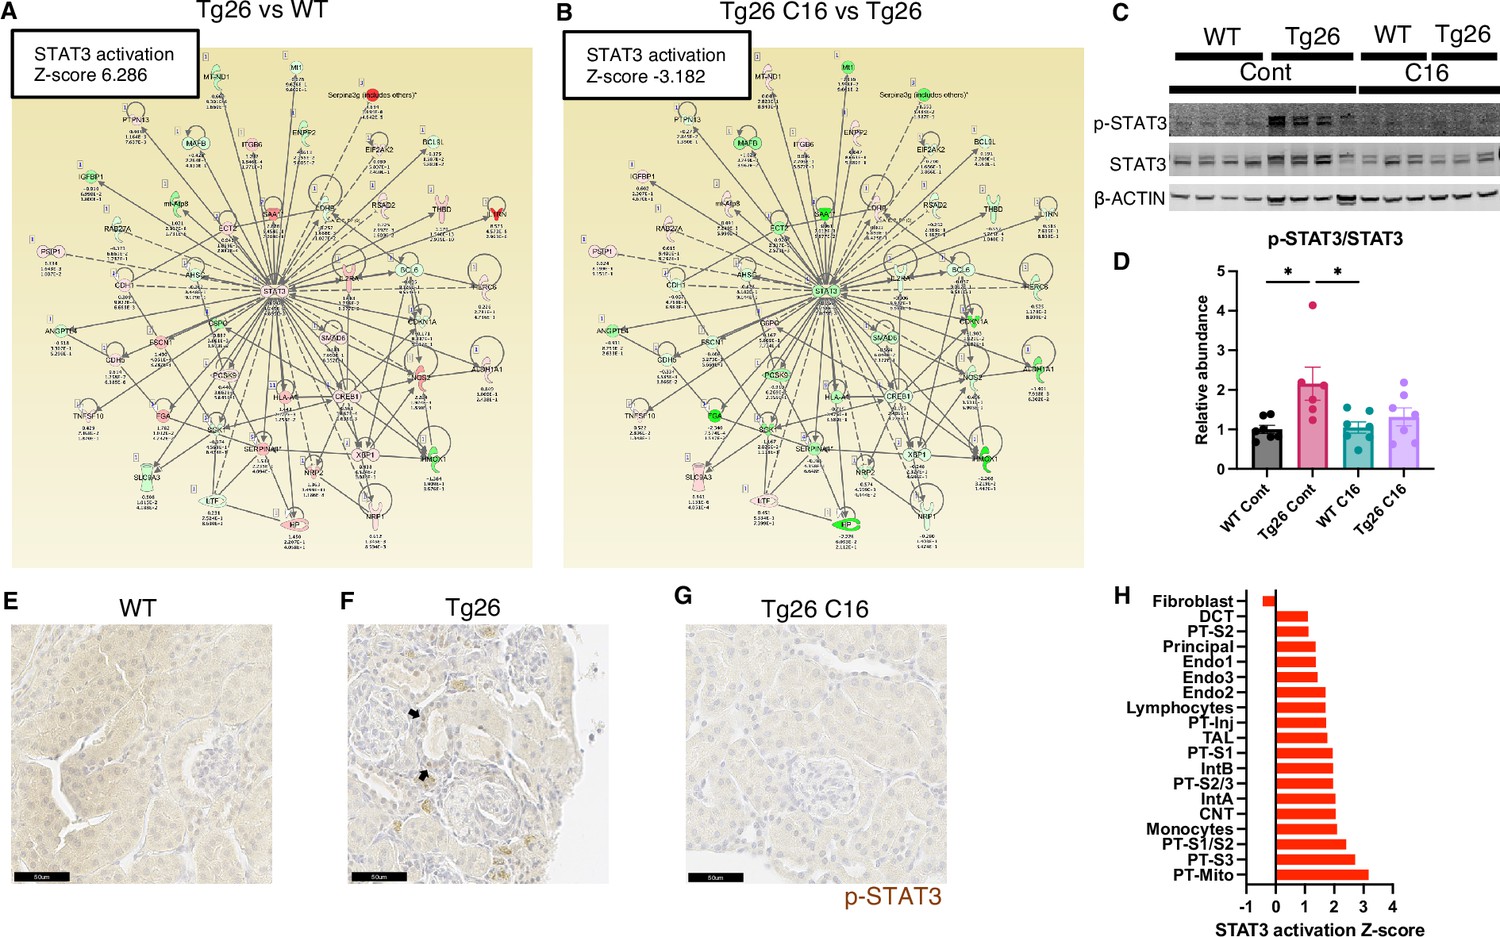
STAT3 activation downstream of PKR.
(A, B) Shown is mapping of STAT3 regulating genes comparing Tg26 vs WT (Z-score 6.286), Tg26 C16 vs Tg26 (Z-score –3.182) by bulk mRNA-seq. Red color indicates upregulation and green color indicates downregulation, quantified as log2-fold change, p-value; and adjusted p-value by false discovery rate are shown. Solid line indicates known positive regulation, dotted line indicates known negative regulation. (C) Representative immunoblotting of phospho-STAT3, STAT3, and β-ACTIN. (D) Quantitative results of phospho-STAT3/STAT3 by immunoblotting (mean with SEM, one-way ANOVA; *, p<0.05). (E–G) Phospho-STAT3 immunostaining of mouse kidneys is shown (scale bars are 50 μm). Arrows indicate p-Stat3 detection in injured tubular cells. (H) STAT3 activation Z-score by upstream regulator analysis comparing Tg26 vs WT in each cluster by snRNA-seq.
Figure 6
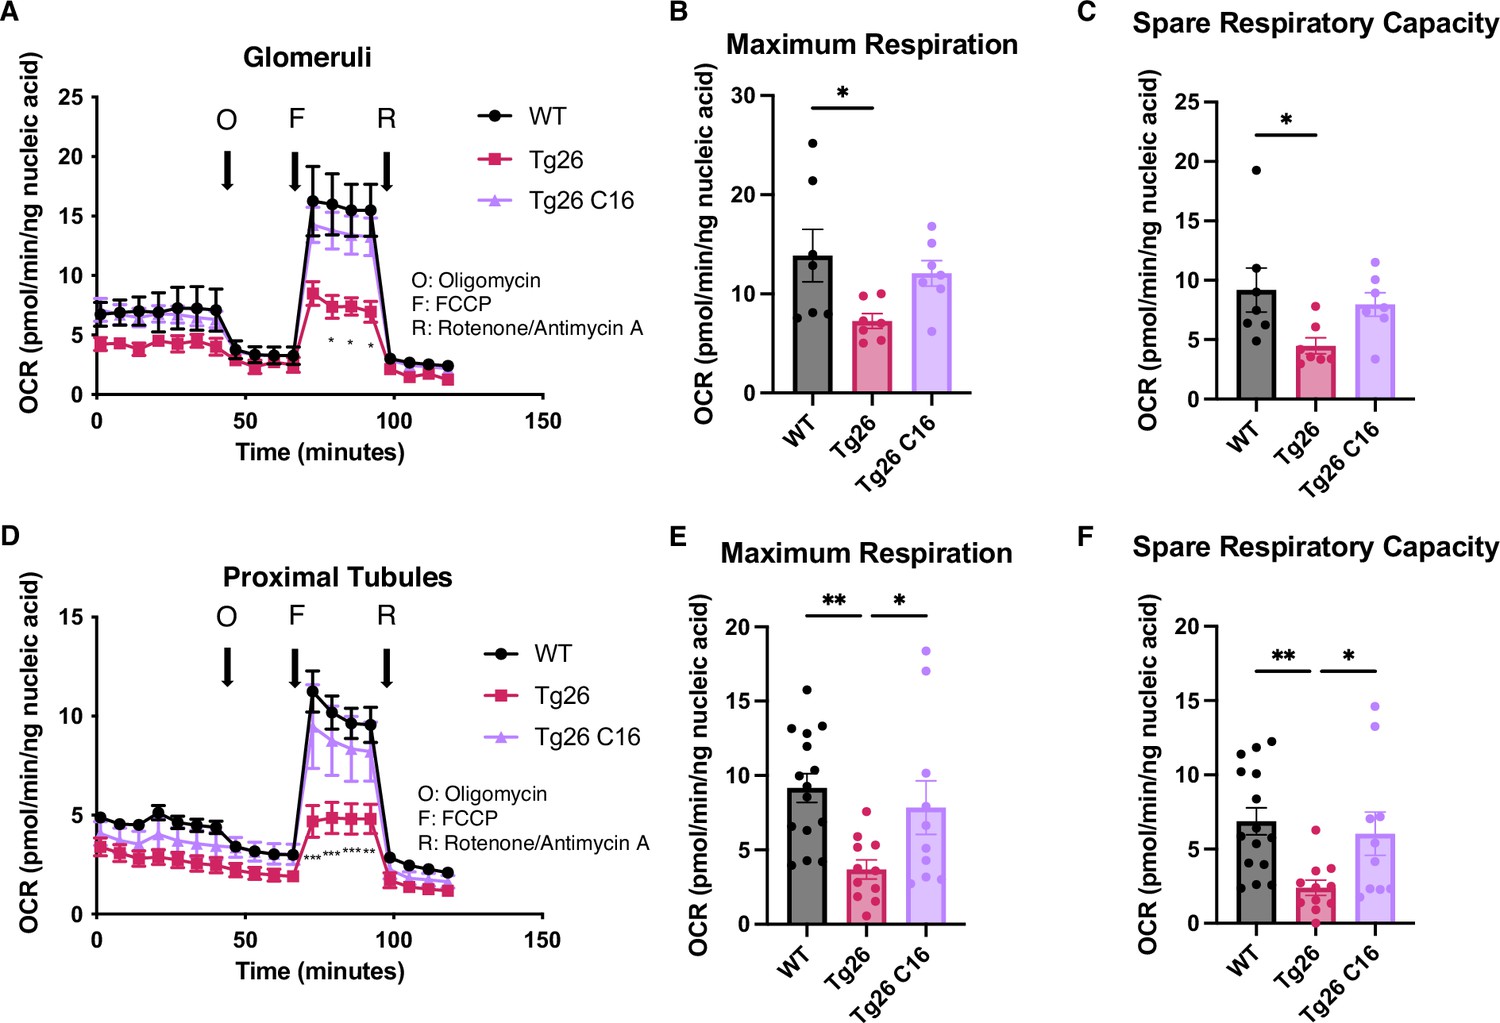
PKR inhibition with C16 reverses mitochondrial dysfunction in Tg26 glomeruli and proximal tubules.
(A) Shown are oxygen consumption rate (OCR) measurements during cell mitochondrial stress testing, using extracted glomeruli from wild-type (WT), Tg26, and C16 Tg26 kidney tissue. (B) Maximum respiration rate was calculated by OCR measurements of glomeruli (mean with SEM). (C) Spare respiratory capacity was calculated by OCR measurements of glomeruli (mean with SEM). (D) Shown are OCR measurements during cell mitochondrial stress testing, using extracted proximal tubules from WT, Tg26, and C16 Tg26 kidney tissue. (E) Maximum respiration rate was calculated by OCR measurements of isolated proximal tubules (mean with SEM). (F) Spare respiratory capacity was calculated by OCR measurements of isolated proximal tubules (mean with SEM). (one-way ANOVA; *, p<0.05; **, p<0.01).
-
Figure 6—source data 1
Uncropped and labeled gels for Figure 6C.
- https://cdn.elifesciences.org/articles/91260/elife-91260-fig6-data1-v2.zip
-
Figure 6—source data 2
Raw unedited gels for Figure 6C.
- https://cdn.elifesciences.org/articles/91260/elife-91260-fig6-data2-v2.zip
Figure 7
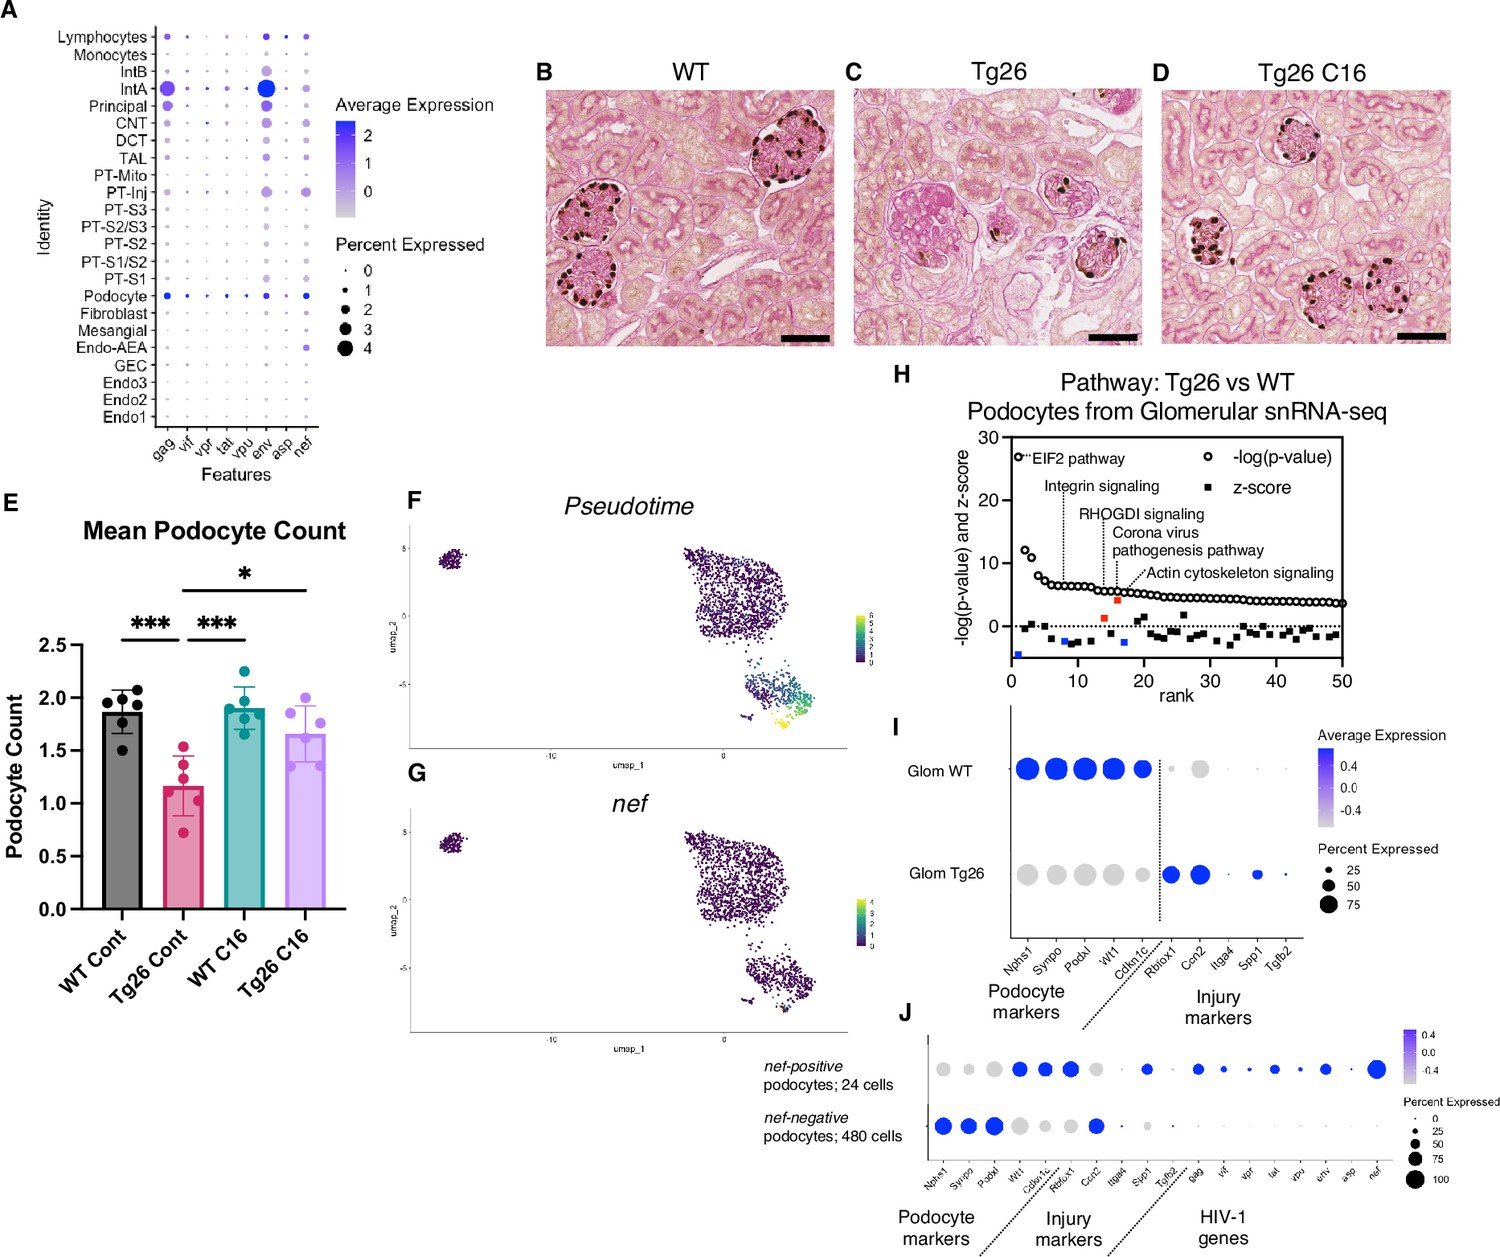
HIV-1 gene expression causes Tg26 podocytes dedifferentiation.
(A) Shown is dot plot demonstrating HIV-1 gene expression levels in each cluster detected by snRNA-seq. (B–D) p57 staining of kidney showing podocyte loss and dedifferentiation (scale bars are 50 μm). (E) PodoCount analysis showed podocyte loss in Tg26 and was rescued by C16 (one-way ANOVA; *, p<0.05; ***, p<0.001). (F) Trajectory analysis of podocytes by snRNA-seq data from wild-type (WT), Tg26 glom samples. (G) Trajectory map showing nef expression. (H) Pathway analysis results by IPA comparing Tg26 vs WT using glomerular snRNA-seq data from podocyte cluster. (I) Dot plot showing podocyte marker genes and representative differentially expressed genes in podocytes by glomerular snRNA-seq. (J) Dot plot comparing expression of representative genes in glomerular Tg26 podocytes between nef-positive and nef-negative podocytes.
Figure 8
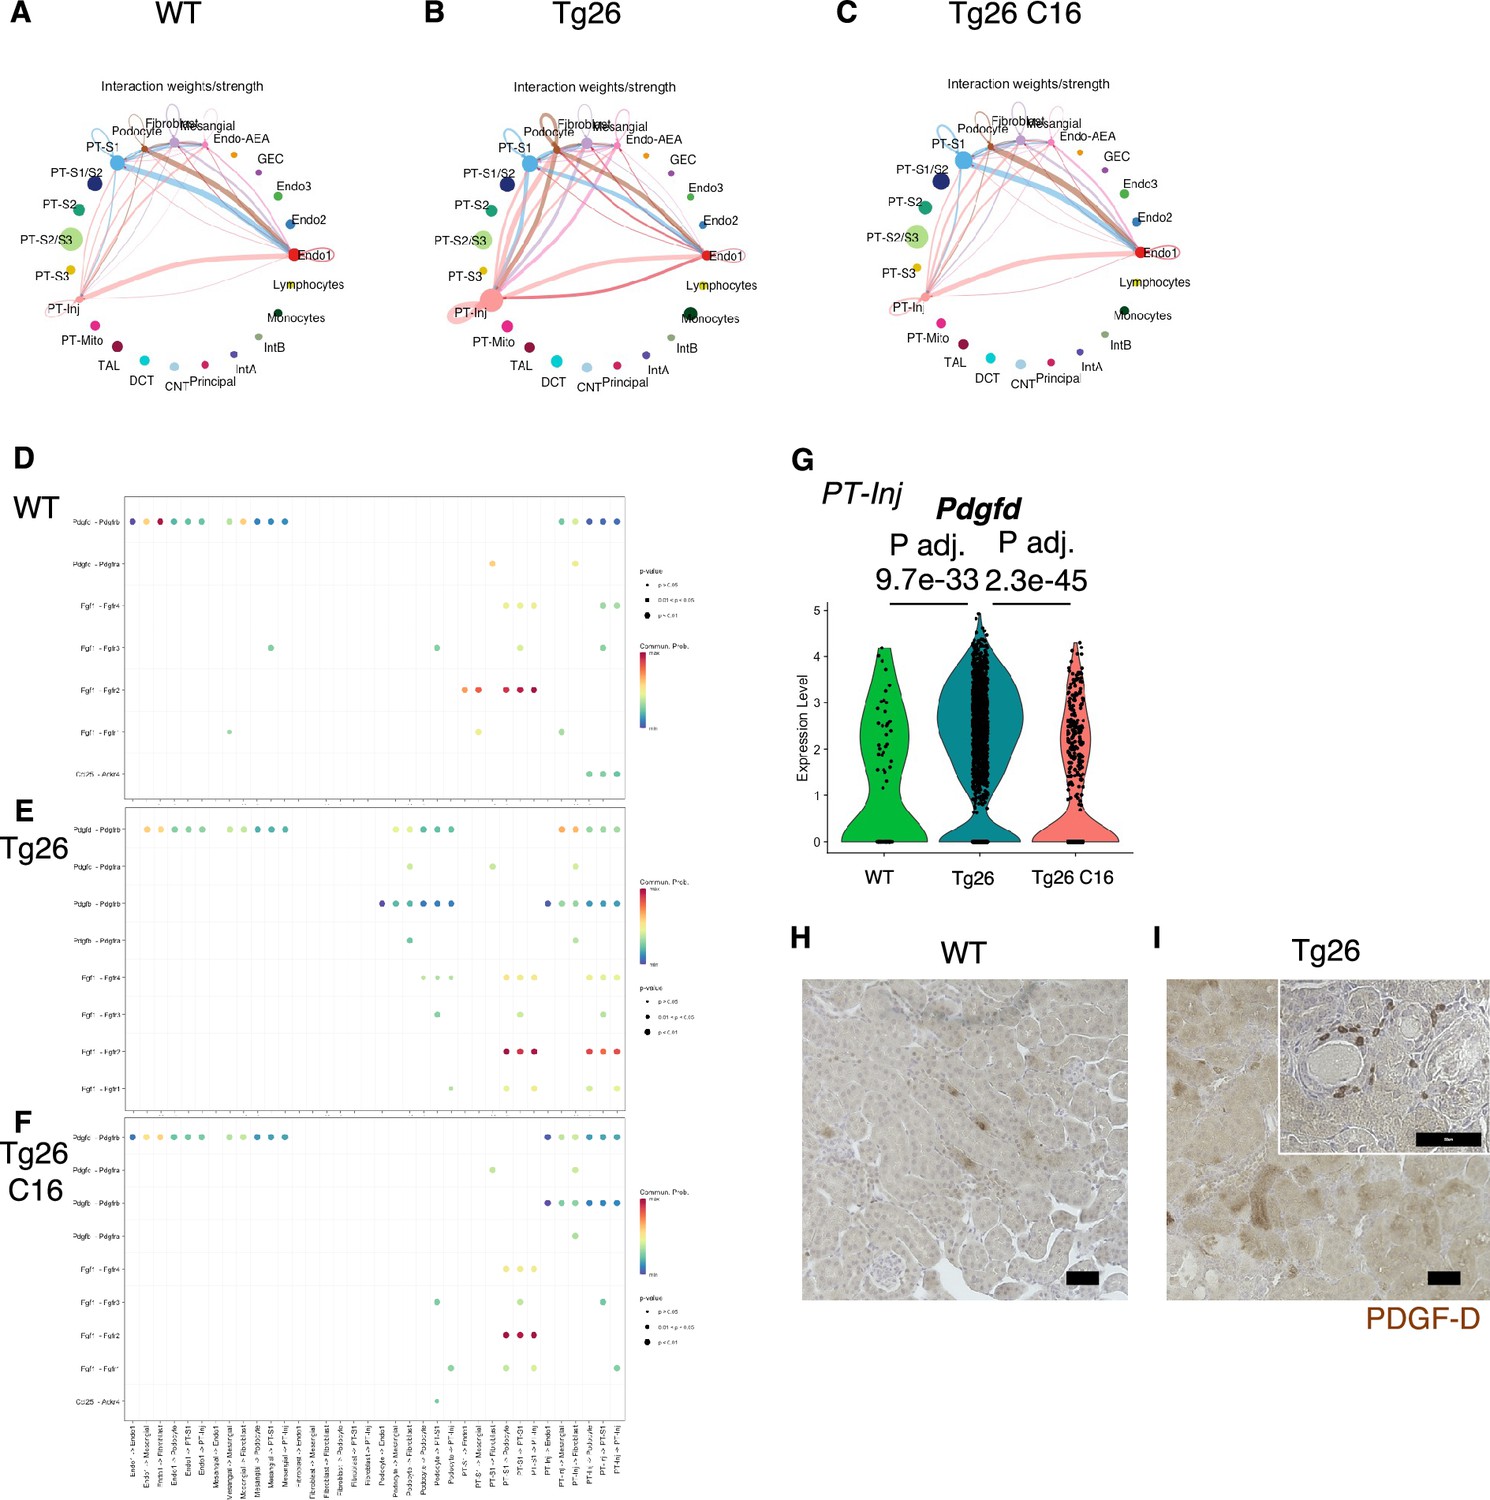
Cell-cell interaction analysis shows activated ligand-receptor interaction: platelet-derived growth factor (PDGF)-D-PDGFR-B pathway in Tg26.
(A–C) Circles plot showing cell-cell interaction weight in each sample at the resolution of each identified cell cluster. (D–F) Shown are dot plots depicting results from cell-cell interaction analysis of wild-type (WT), Tg26, C16 Tg26 snRNA-seq data. (G) Violin plots showing Pdgfd expression levels in the PT-Inj cluster. (H, I) PDGF-D immunostaining of mouse kidneys is shown (scale bars are 50 μm).
Tables
Table 1
Activation Z-scores from bulk RNA-seq data.
Activation Z-scores of transcription factors by upstream regulator analysis of Ingenuity Pathway Analysis. Triple Z-score was calculated by multiplying three Z-scores in each comparison.
| Upstream regulator | Activation Z-scoreWT C16 vs WT | Activation Z-scoreTg26 vs WT | Activation Z-scoreTg26 C16 vs Tg26 | Triple Z-score |
|---|---|---|---|---|
| STAT3 | –2.183 | 6.286 | –3.182 | 43.66 |
| FOXO1 | –3.618 | 3.991 | –2.697 | 38.94 |
| GLI1 | –2.335 | 5.517 | –2.936 | 37.82 |
| EPAS1 | –2.665 | 3.554 | –3.242 | 30.71 |
| SREBF1 | –3.013 | 3.672 | –2.63 | 29.10 |
| CREB1 | –2.325 | 4.181 | –2.916 | 28.35 |
| ATF4 | –2.606 | 4.445 | –2.028 | 23.49 |
| SMAD2 | –2.207 | 2.791 | –2.335 | 14.38 |
Additional files
Download links
A two-part list of links to download the article, or parts of the article, in various formats.
Downloads (link to download the article as PDF)
Open citations (links to open the citations from this article in various online reference manager services)
Cite this article (links to download the citations from this article in formats compatible with various reference manager tools)
PKR activation-induced mitochondrial dysfunction in HIV-transgenic mice with nephropathy
eLife 12:RP91260.
https://doi.org/10.7554/eLife.91260.4


