Accurate prediction of CDR-H3 loop structures of antibodies with deep learning
- MOE Key Laboratory of Bioinformatics, State Key Laboratory of Molecular Oncology, School of Pharmaceutical Sciences, Tsinghua University, China
- Tsinghua Institute of Multidisciplinary Biomedical Research, Tsinghua University, China
- Department of Natural Language Processing, Baidu International Technology (Shenzhen) Co Ltd, China
Figures
Figure 1
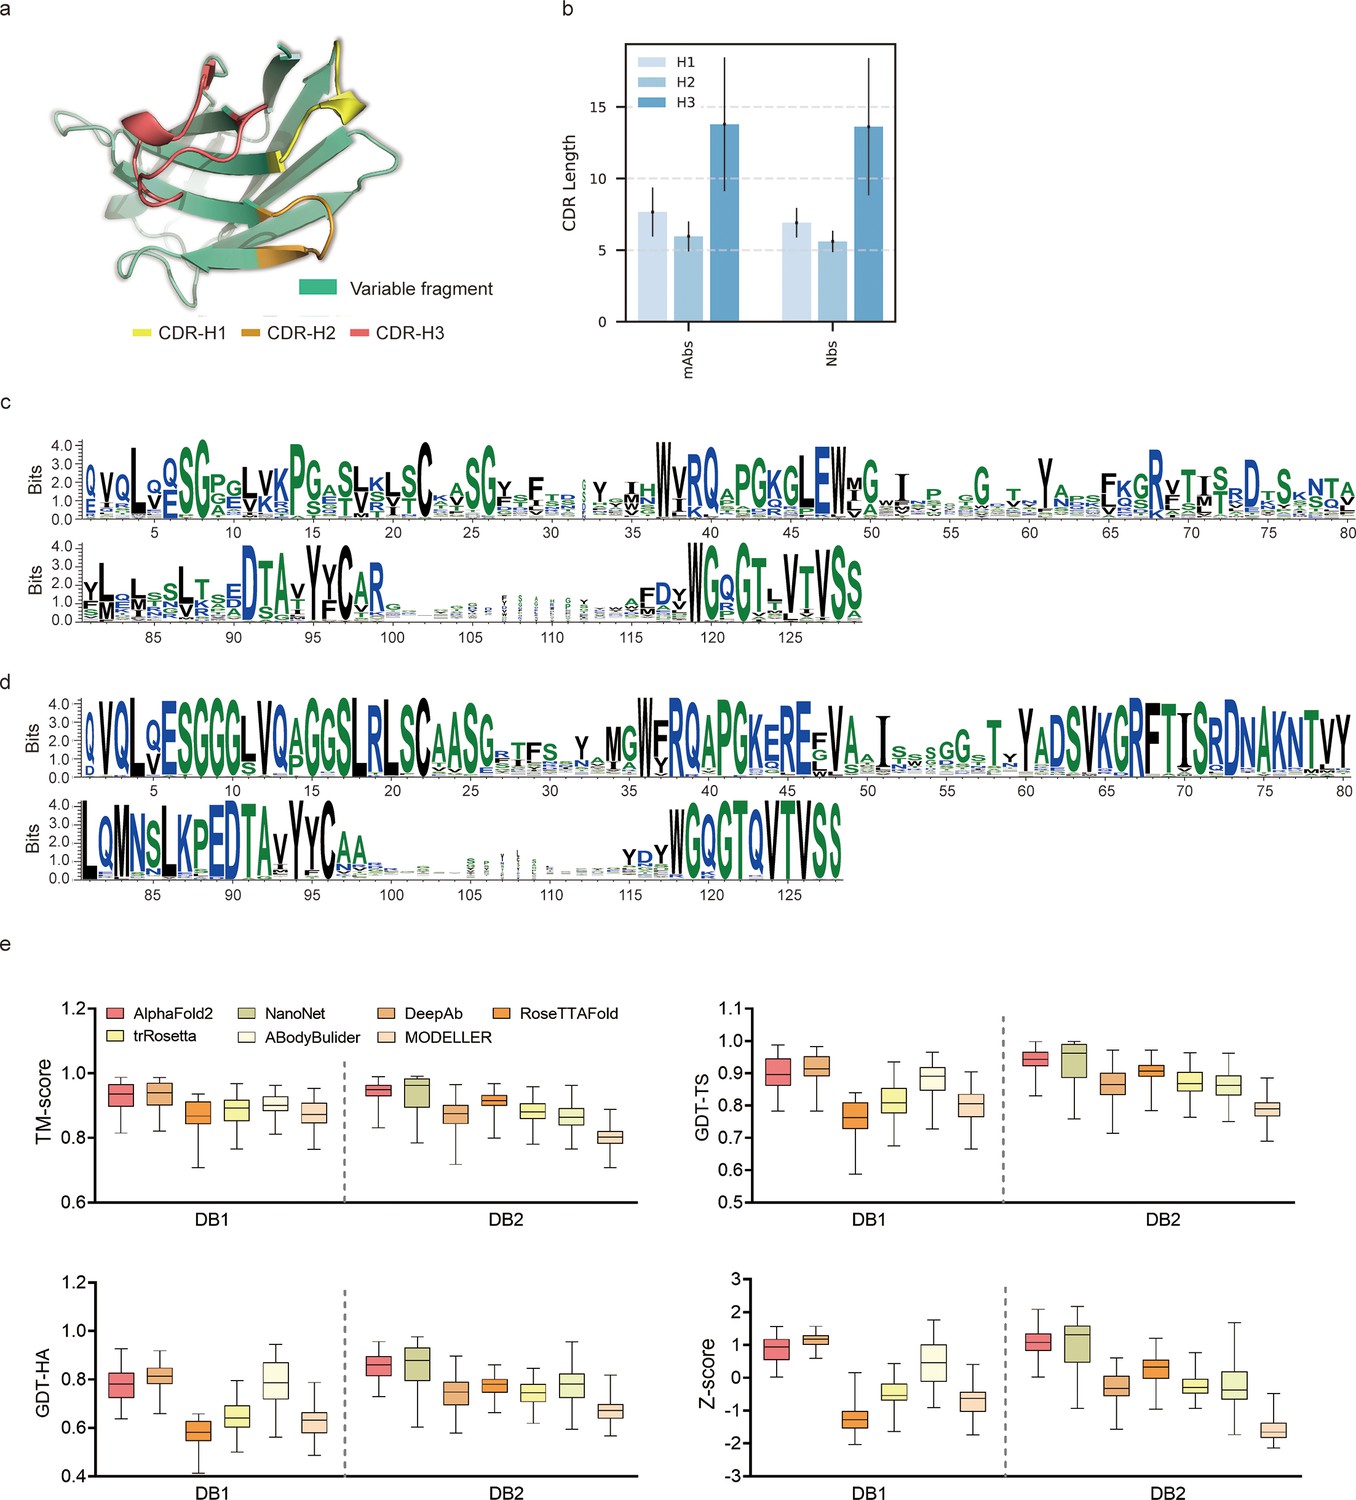
Accuracy of AF2 on antibody modeling.
(a) Schematic for CDR heavy chain loops. (b) The CDR lengths of monoclonal antibodies (mAbs) (n = 47) and nanobodies (Nbs) (n = 78). The error bars represent the standard deviation of the data. (c) Sequence logo plots of VH fragments in DB1. (d) Sequence logo plots of VH fragments in DB2. The different colors of codes represent the hydrophobicity of amino acids. (e) The performance of AF2 on different datasets using various evaluation metrics. In the box plots, the lines at the center of the boxes represent the medians, and the top and bottom lines of the boxes represent the upper and lower quartiles.
Figure 2 with 1 supplement
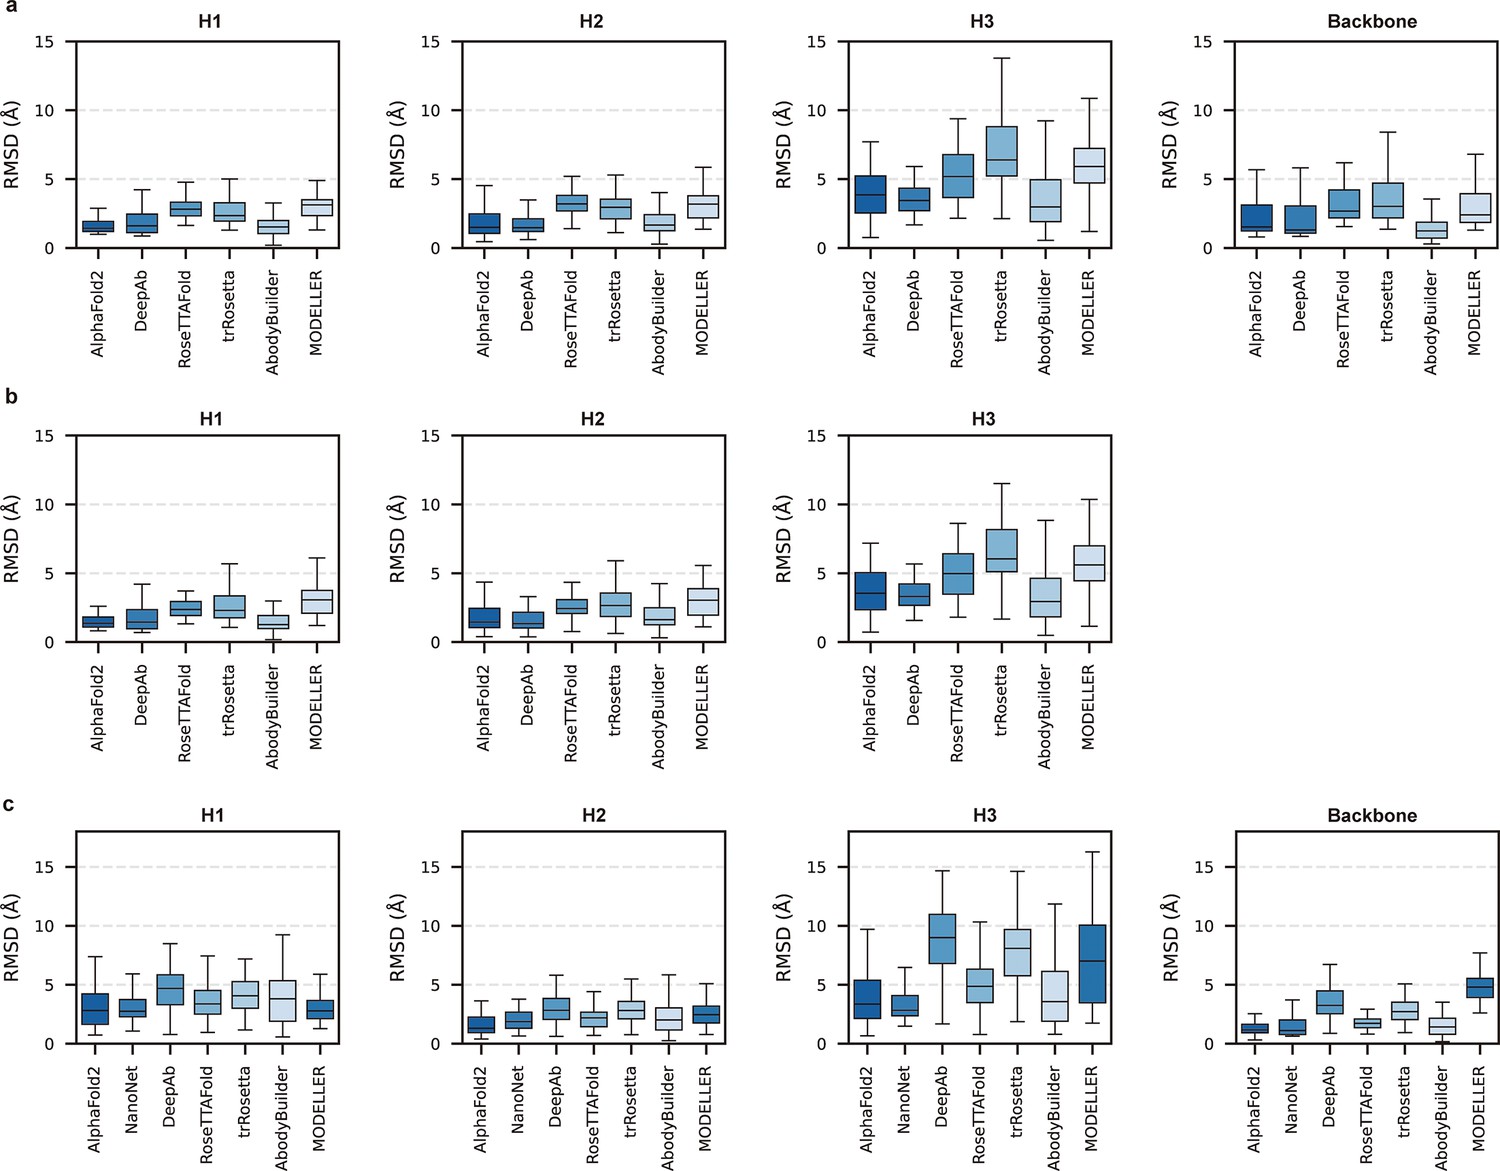
Accuracy of AF2 on different antibody regions.
(a) The performance of AlphaFold2 in DB1 relative to other methods after superimposing Fv backbones. (b) The performance of H3-OPT in DB1 relative to other methods after superimposing VH backbones. (c) The performance of H3-OPT in DB2 relative to other methods.
Figure 2—figure supplement 1
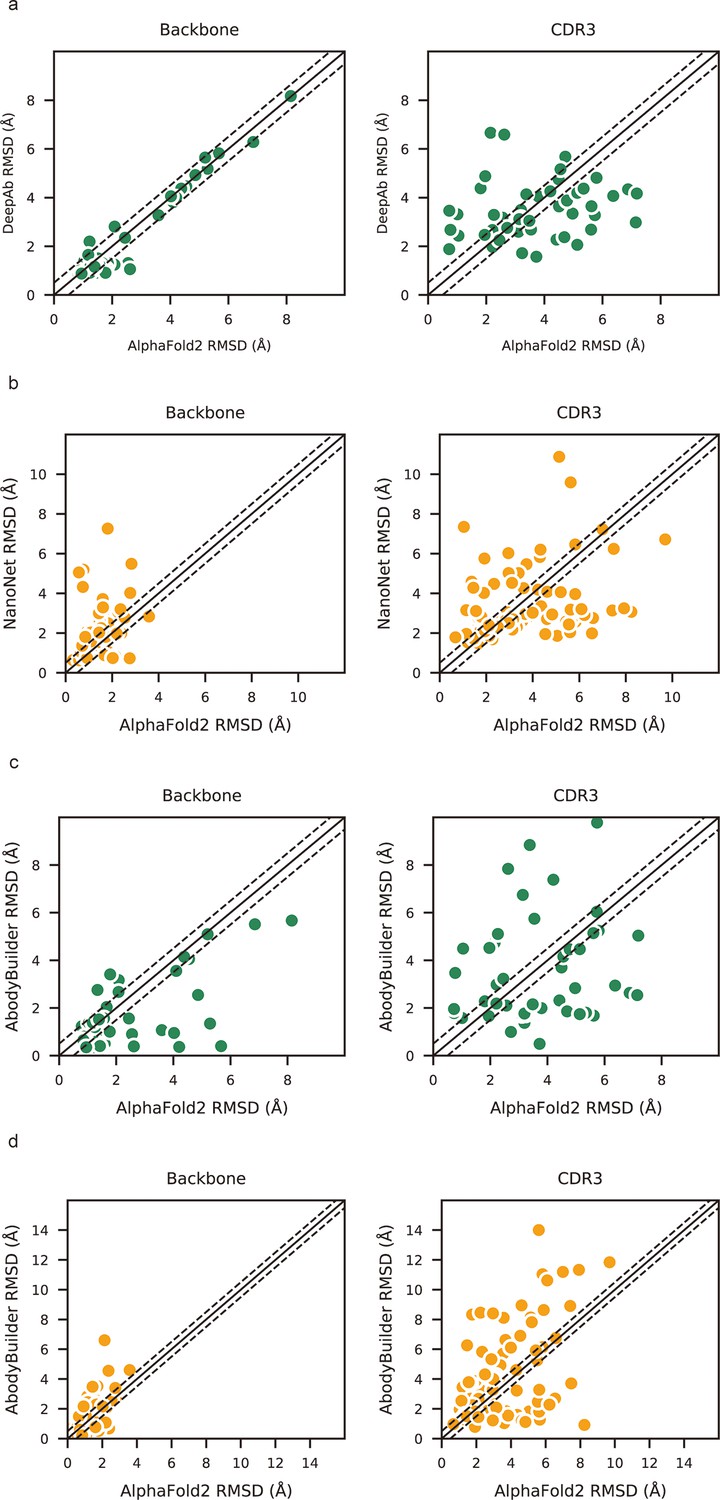
Local accuracy of AlphaFold2 prediction.
(a) Side-by-side comparison of backbone and CDR3 heavy atom root mean square deviations (RMSDs) for DeepAb and AlphaFold2 in DB1. (b) Side-by-side comparison of backbone and CDR3 heavy atom RMSDs for NanoNet and AlphaFold2 in DB2. (c) Side-by-side comparison of backbone and CDR3 heavy atom RMSDs for ABodyBuilder and AlphaFold2 in DB1. (d) Side-by-side comparison of backbone and CDR3 heavy atom RMSDs for ABodyBuilder and AlphaFold2 in DB2. The slashes represent a cutoff value of 0.5 Å.
Figure 3
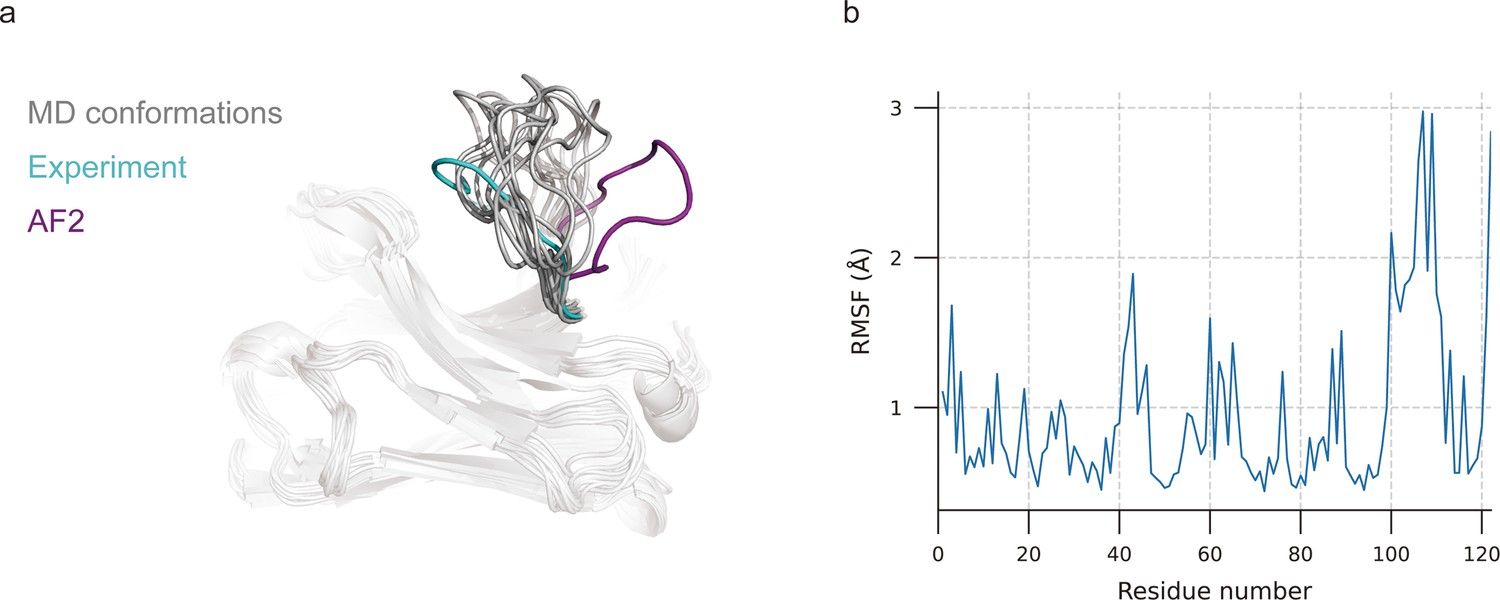
Molecular dynamics (MD) generated conformations for benchmark target 7N0R.
(a) Comparison of CDR-H3 loops of MD (gray), AF2 (pink), and experimentally determined structure (cyan). (b) Root mean square fluctuation (RMSF) of antibody residues during simulation. CDR-H3 loop is located in residue number ranging from 98 to 109.
Figure 4
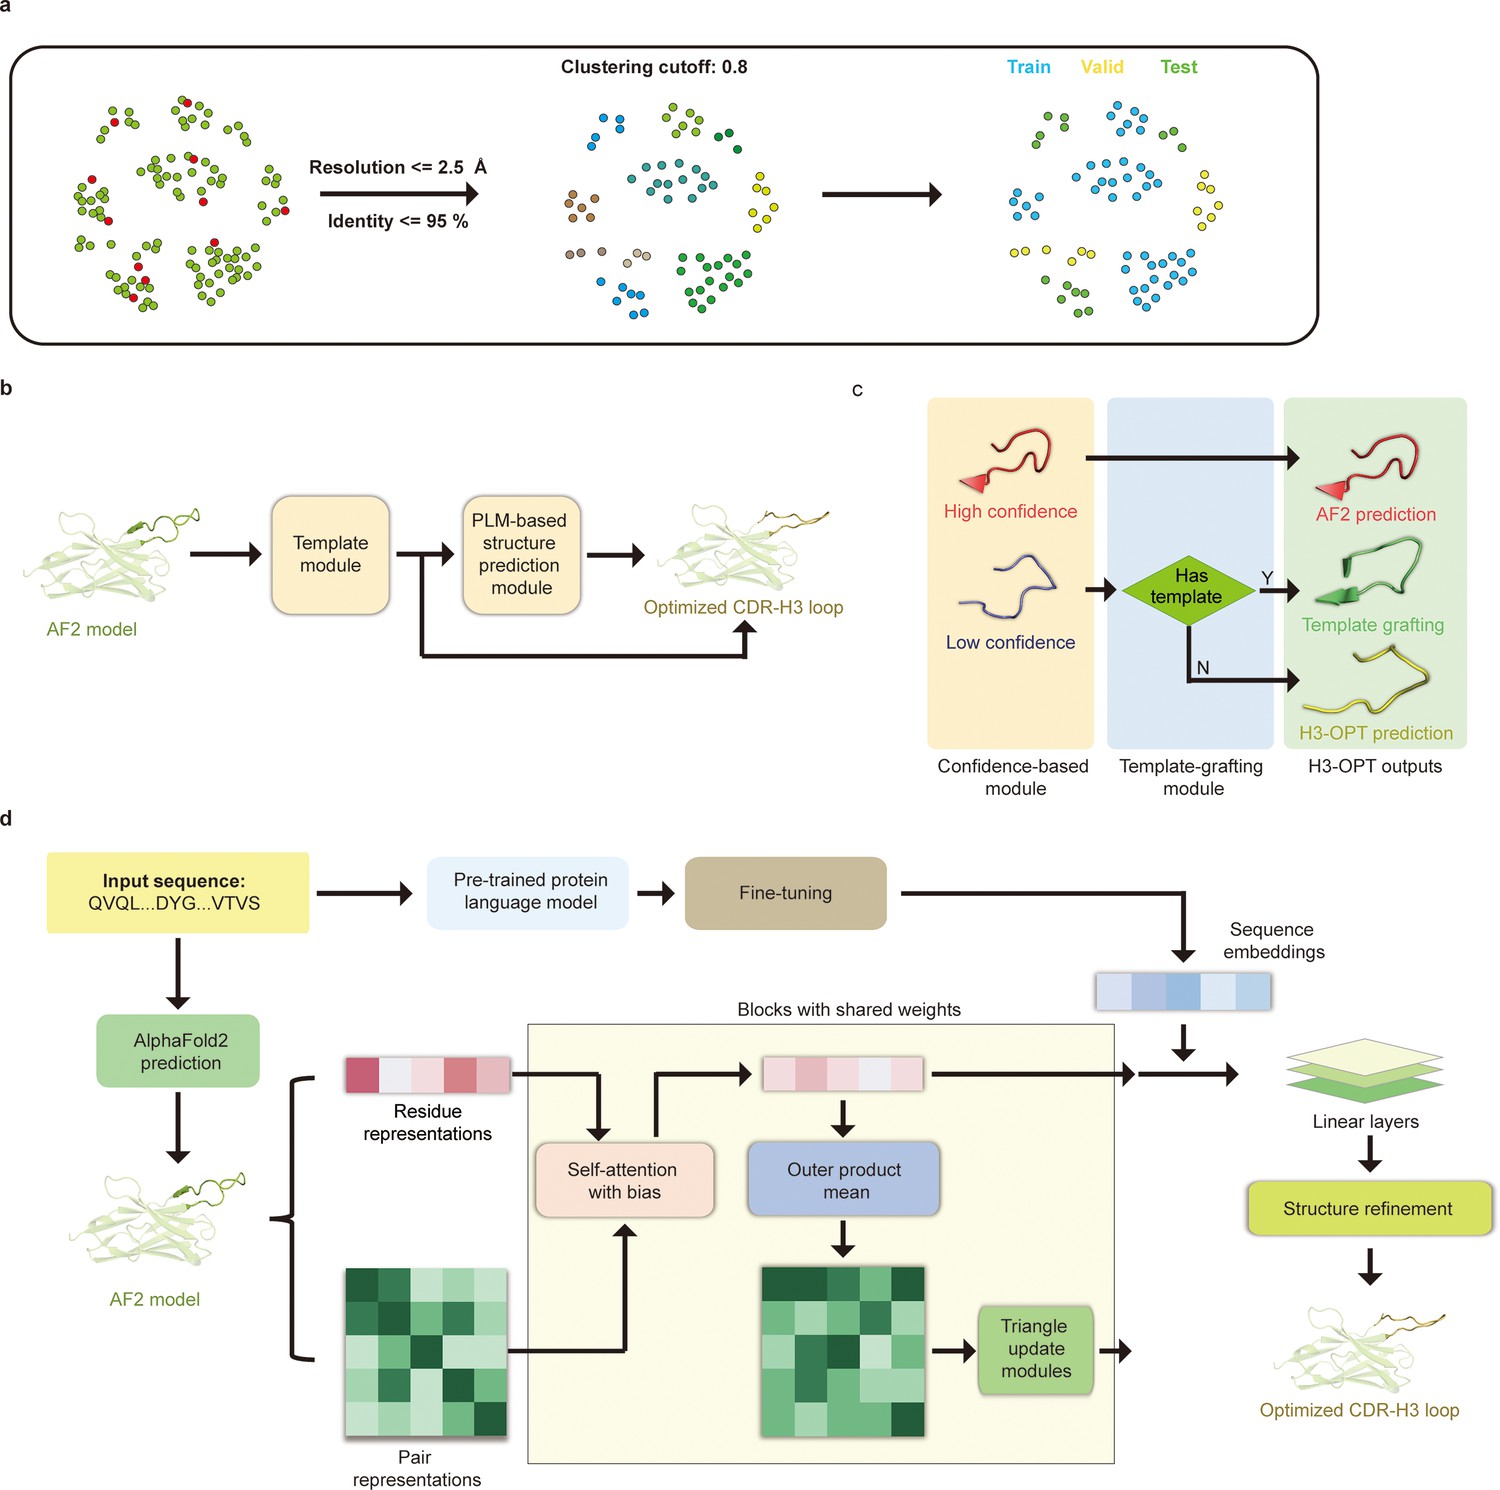
H3-OPT architecture.
(a) Schematic for dataset preparation. Structures were screened from the SAbDab database based on resolution and sequence identity. Clustering of the filtered, high-resolution structures yielded three datasets for training (n = 1021), validation (n = 134), and testing (n = 131). (b) The workflow of H3-OPT includes two modules. The template module determines whether to use PLM-based structure prediction module (PSPM), while the PSPM module optimizes the AF2 input structures. (c) The template module retains AF2-predicted loops when the confidence score is >0.8 and grafts CDR-H3 loops onto AF2 models for structures with an available template. (d) In the PSPM, the network extracts residue-level information and pairwise residue representations from the AF2-predicted models, which are subsequently updated using weight-sharing blocks and concatenated with sequence representations from ESM2. The resulting data is used to predict the 3D coordinates of the H3 loops.
Figure 5
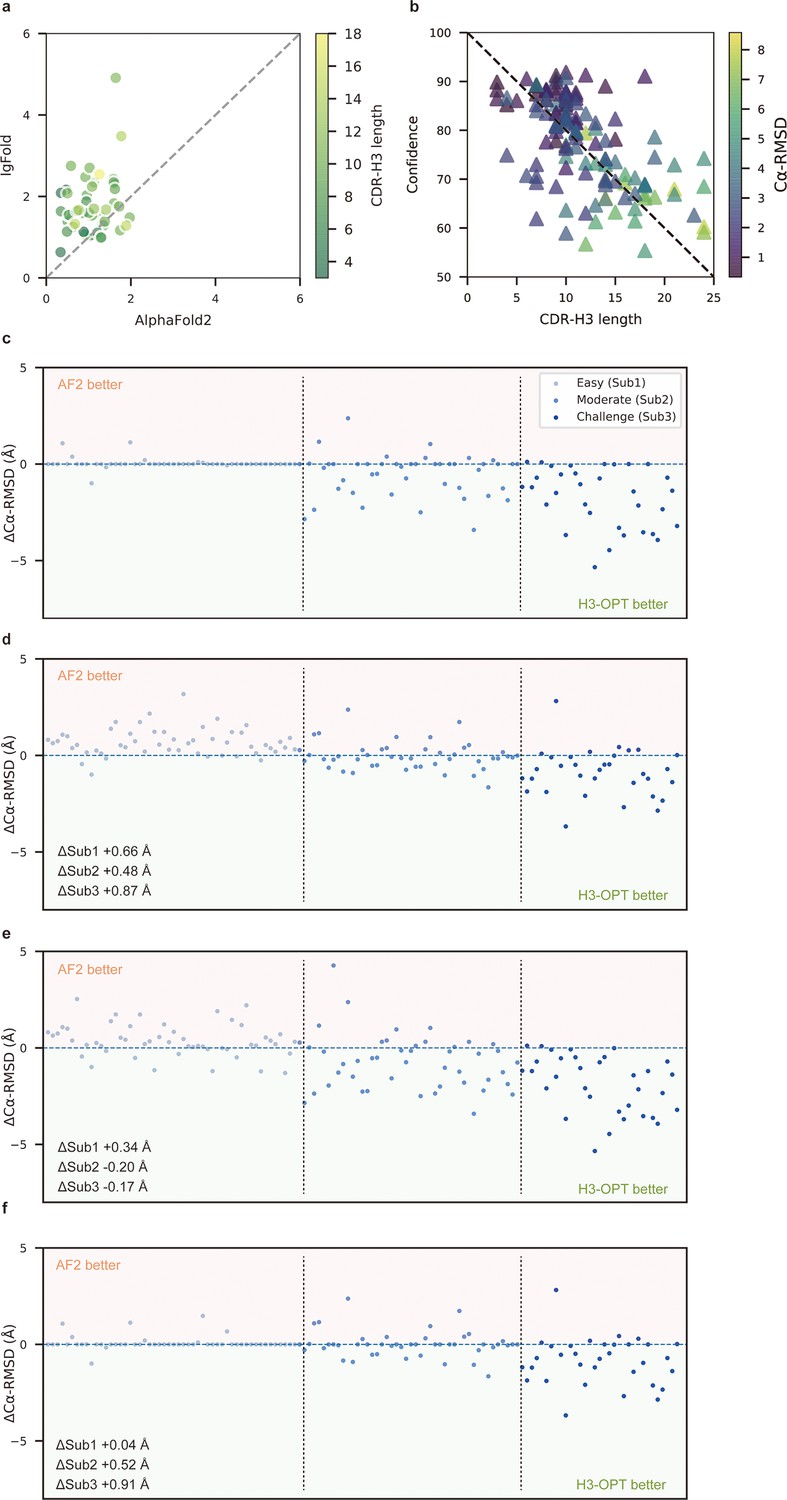
Template module and ablation studies.
(a) Side-by-side comparison of Cα-RMSDs of AF2 and IgFold for Sub1 (n = 52); color scale for data points reflects CDR3 length. AF2 outperformed IgFold for targets left of the dashed diagonal; IgFold outperformed AF2 for targets right of the dashed diagonal. (b) Correlations between AF2 confidence score and amino acid sequence length of CDR-H3 loops. Datapoint color indicates Cα-RMSD value for that target. The correlation coefficient for confidence score and CDR-H3 loop length is −0.5921. (c) The accuracy of H3-OPT in three subgroups of the test set. ΔCα-RMSDs were calculated by subtracting the RMSDCα of AF2 from that of H3-OPT. AF2 had higher accuracy for targets above the dashed line; H3-OPT had better accuracy for structures below the dashed line. (d) Differences in H3-OPT accuracy without the template module. This ablation study means only PLM-based structure prediction module (PSPM) is used. (e) Differences in H3-OPT accuracy without the confidence-based module (CBM). This ablation study means input loop is optimized by template-grafting module (TGM) and PSPM. There are 30 targets in our database with identical CDR-H3 templates. (f) Differences in H3-OPT accuracy without the TGM. This ablation study means input loop is optimized by CBM and PSPM.
Figure 6
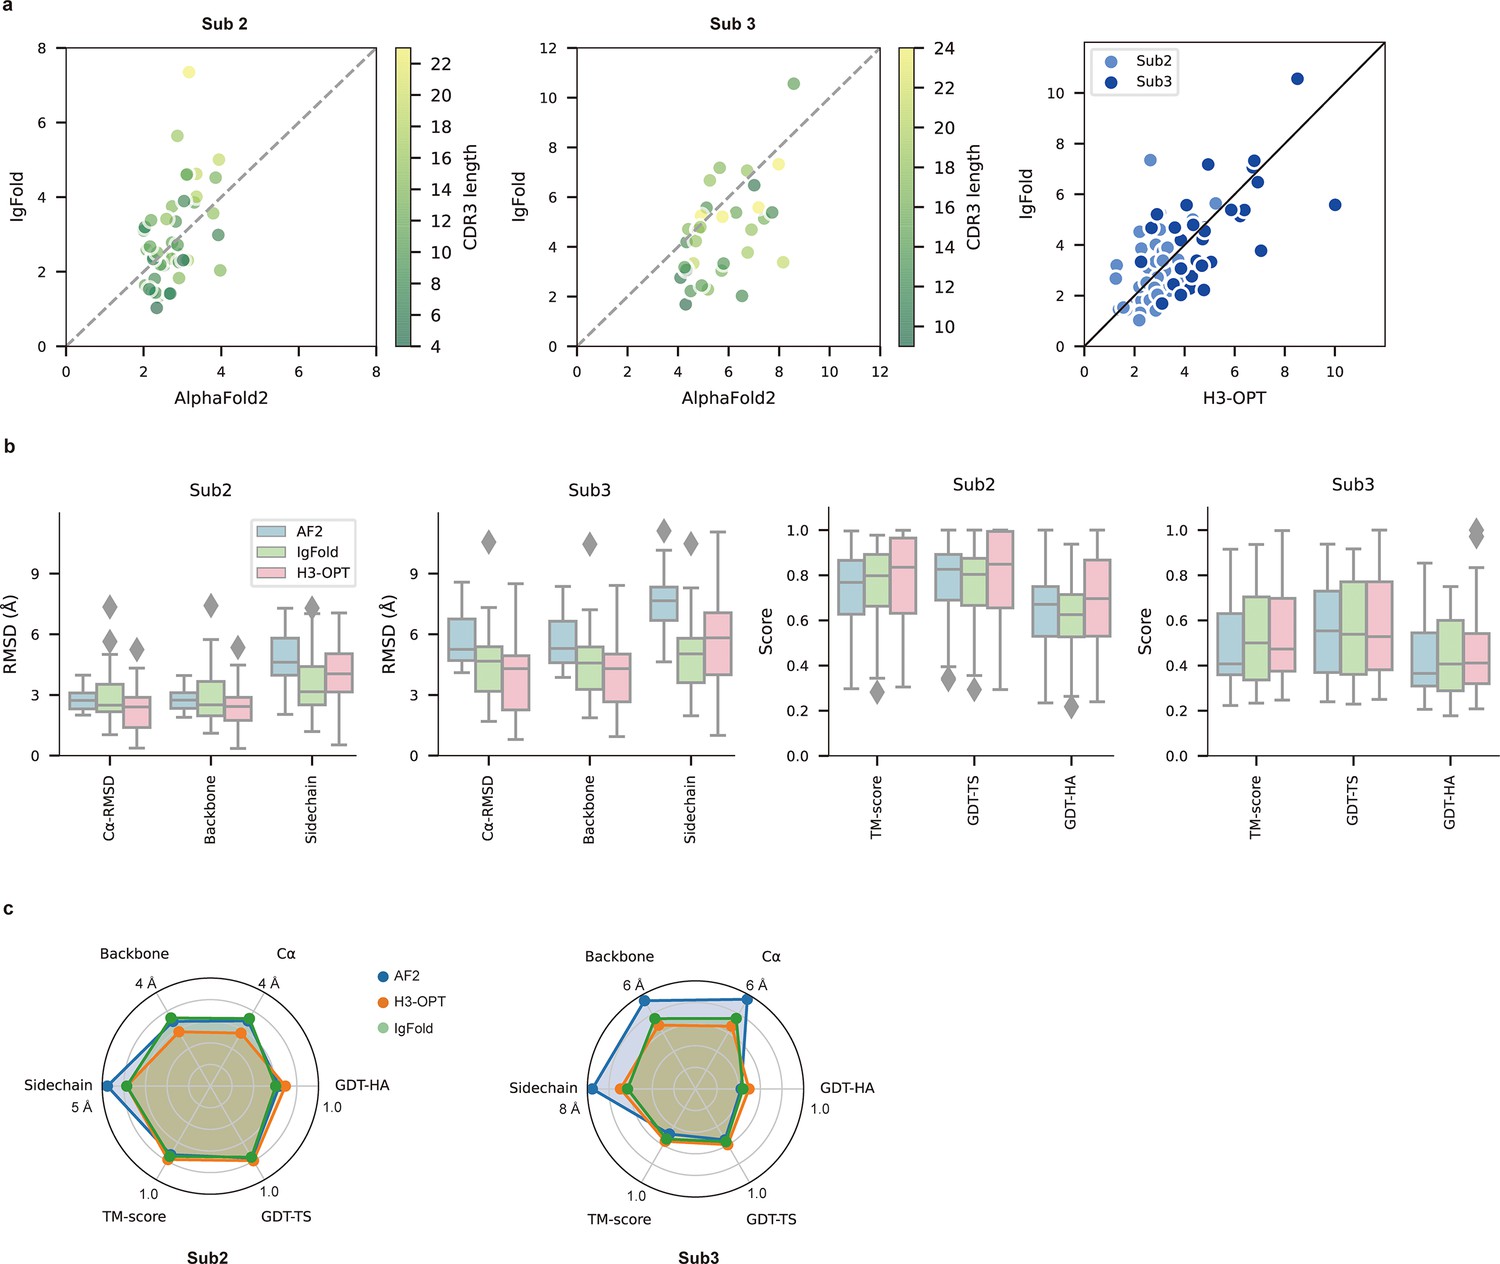
PLM-based structure prediction module (PSPM) module.
(a) Side-by-side comparison of Cα-RMSDs for AF2 and IgFold, IgFold and H3-OPT in the Sub2 (n = 46) and Sub3 (n = 33) test sets, respectively. (b) Comparison of prediction accuracy between AF2 and H3-OPT for Sub2 and Sub3 targets. Metrics including root mean square deviations (RMSDs), template modeling scores (TM-scores), and global distance test (GDT) scores were used to quantitatively assess similarity between predicted and experimental structures. (c) Comparison of prediction accuracy between AF2 and H3-OPT using six metrics (RMSDCα, RMSDbackbone, RMSDsidechain, TM-score, GDT-TS score and GDT-HA score). Radar plots of the mean values of different methods and metrics in predictions of Sub2 and Sub3 targets.
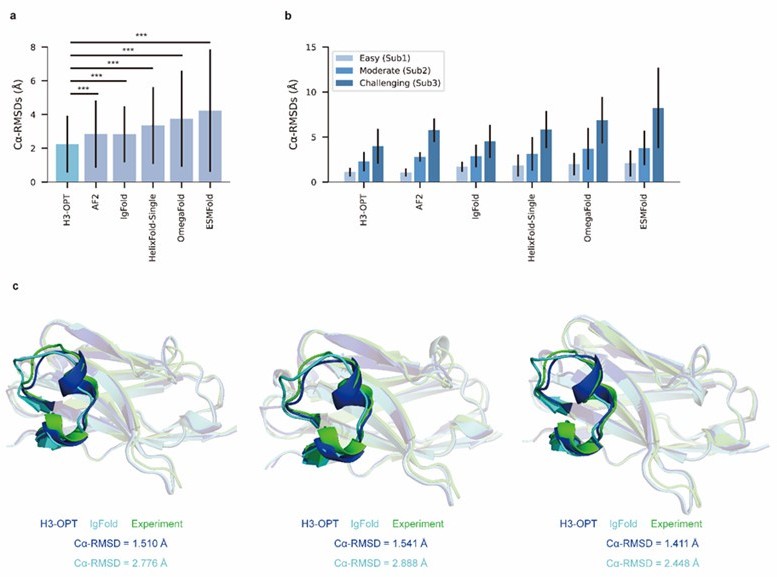
Figure 7 with 1 supplement
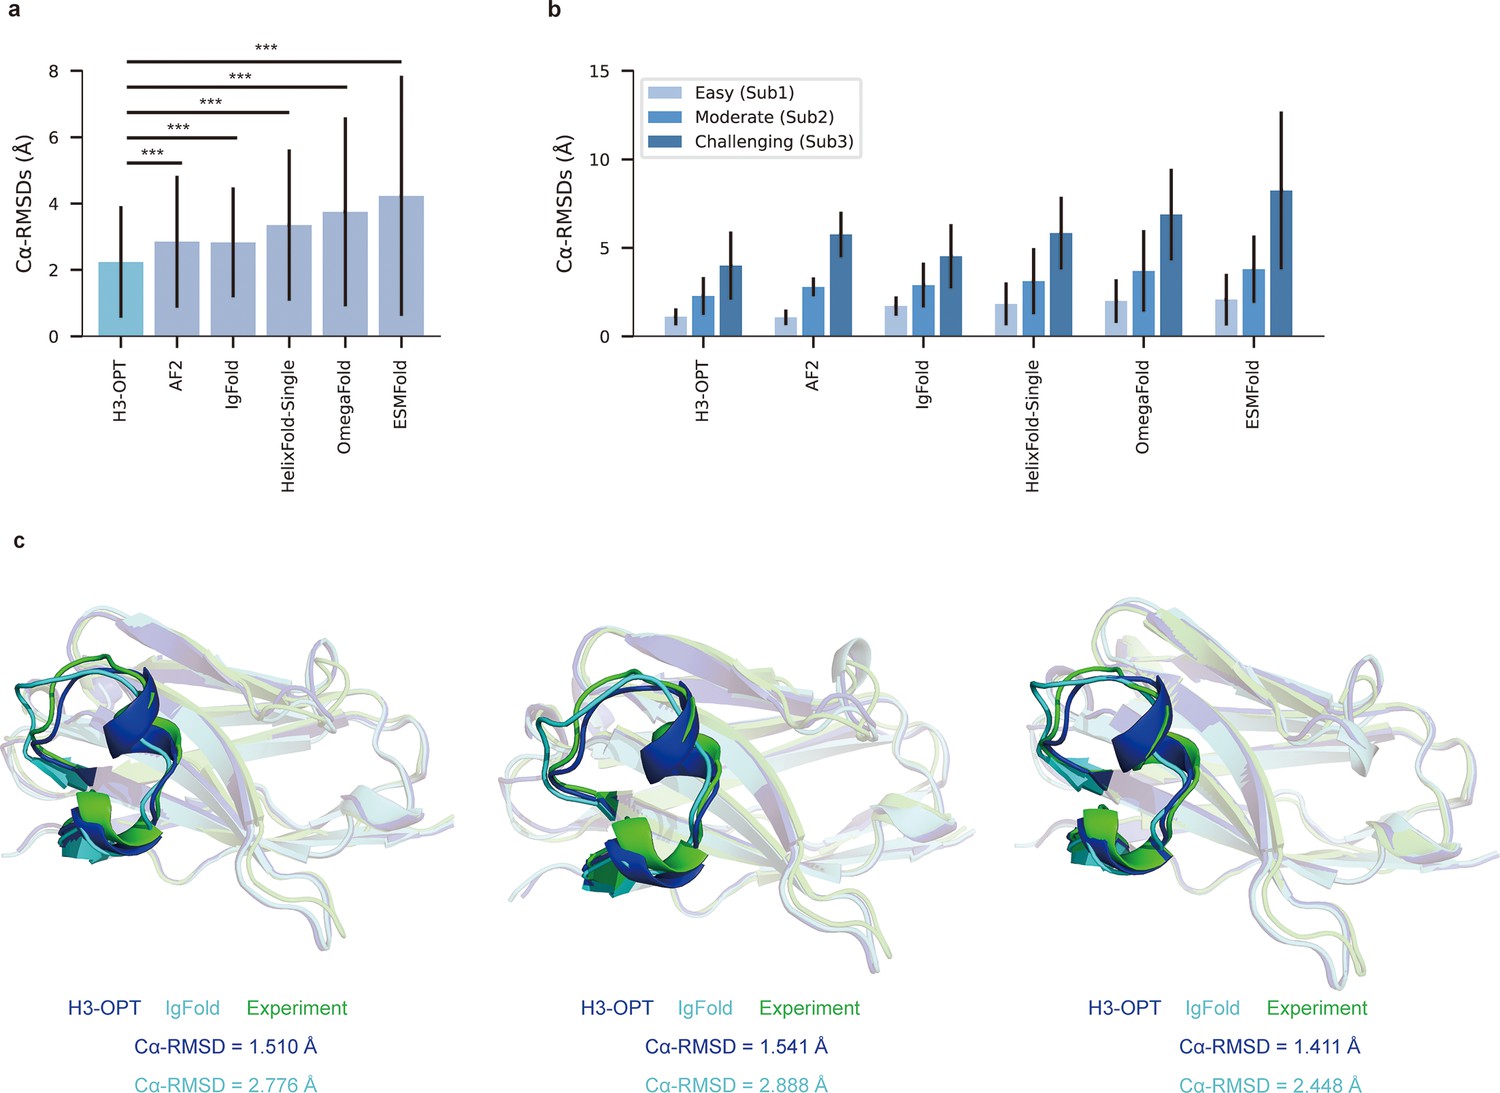
Accuracy of CDR-H3 loop prediction by H3-OPT.
(a) The performance of H3-OPT in the test set (nmAbs = 119, nNbs = 12) relative to other methods. The RMSDCα of H3-OPT was significantly lower than other existing methods (p<0.001). (b) The performance of H3-OPT in structural predictions of three subgroups of the test set (n = 52, 46, and 33). (c) H3-OPT structural predictions for three anti-VEGF nanobodies (PDB ID: 8IIU, 8IJZ, 8IJS). The sequence identities of the VH domain and H3 loop are 0.816 and 0.647, respectively, compared with the best template. ***p<0.001. RMSD, root mean square deviation.
Figure 7—figure supplement 1

Comparison of accuracy between AF2, H3-OPT, and tFold-Ab methods using the CAMEO 2022 benchmark dataset (Leemann et al., 2023).
The x-axis represents different targets, and y-axis represents Cα-RMSD values. RMSD, root mean square deviation.
Figure 8 with 1 supplement
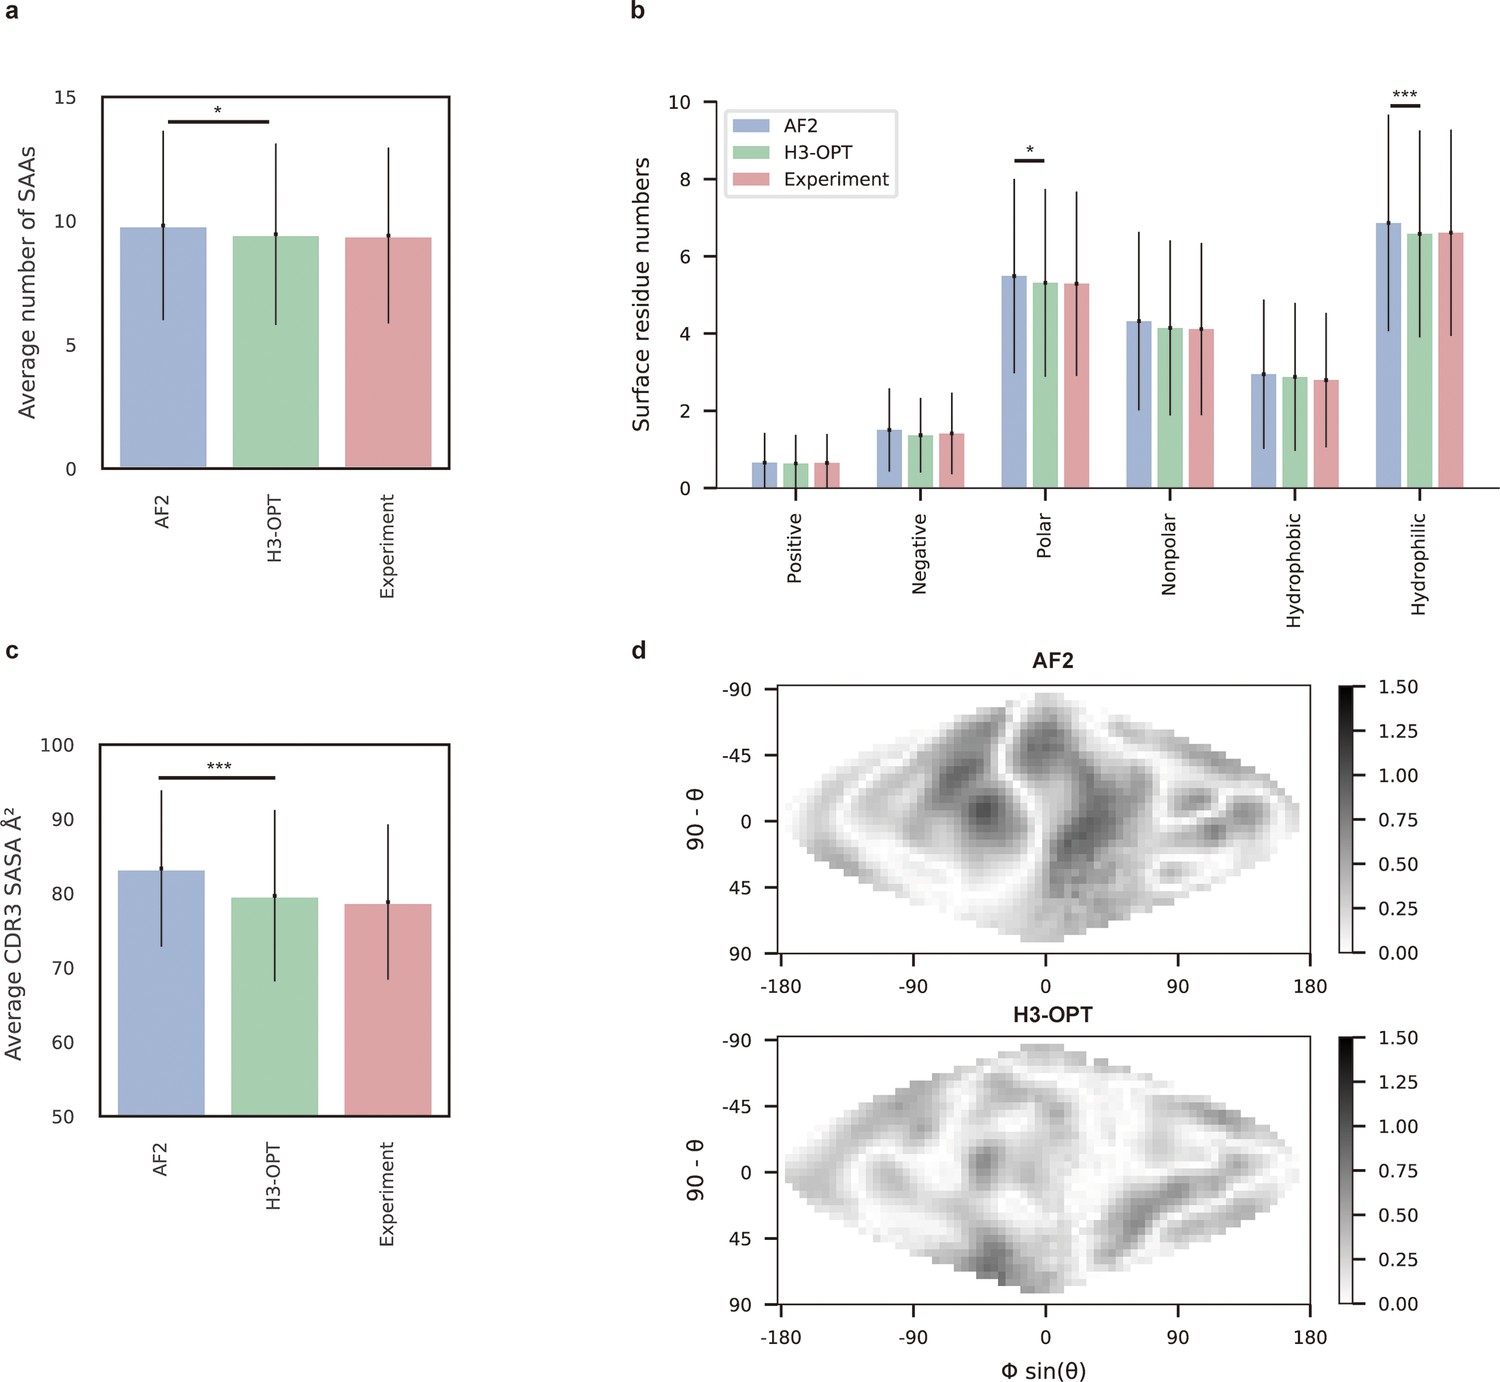
Analysis of surface patches.
(a) Analysis of surface amino acids for predicted H3 loops. Y-axis represents average number of surface residues for H3 loops (n = 131). The surface residues of AF2 models are significantly higher than those of H3-OPT models (p<0.05). (b) Histogram of surface patches with different properties predicted by H3-OPT, AF2, or experimentally solved H3 loops. Error bars show standard deviations. H3-OPT models predicted lower values than AF2 models in terms of various surface properties, including polarity (p<0.05) and hydrophilicity (p<0.001). (c) Solvent-accessible surface area (SASA) analysis of predicted H3 loops. Values represent the difference in SASA between predicted and experimentally determined H3 structures using AF2 or H3-OPT. The SASA of AF2 models are significantly higher than those of H3-OPT models (p<0.001). (d) Comparison of the charged surface patches between H3-OPT and AF2 for target PDB ID: 5U3P. The surface maps compare the surface electrostatic potential of the CDR-H3 loop predicted by H3-OPT or AF2 with the native structure. Darker shading indicates greater difference in electrostatic potential. *p<0.05; **p<0.01; ***p<0.001.
Figure 8—figure supplement 1

Solvent-accessible surface area (SASA) analysis of predicted H3 loops.
The values represent the difference in SASA between H3 structures predicted by AF2 or H3-OPT and experimentally determined structures. Positive values indicate that the predicted structures have more exposed surface area compared to the native structures; negative values indicate less exposed surface area.
Figure 9 with 1 supplement
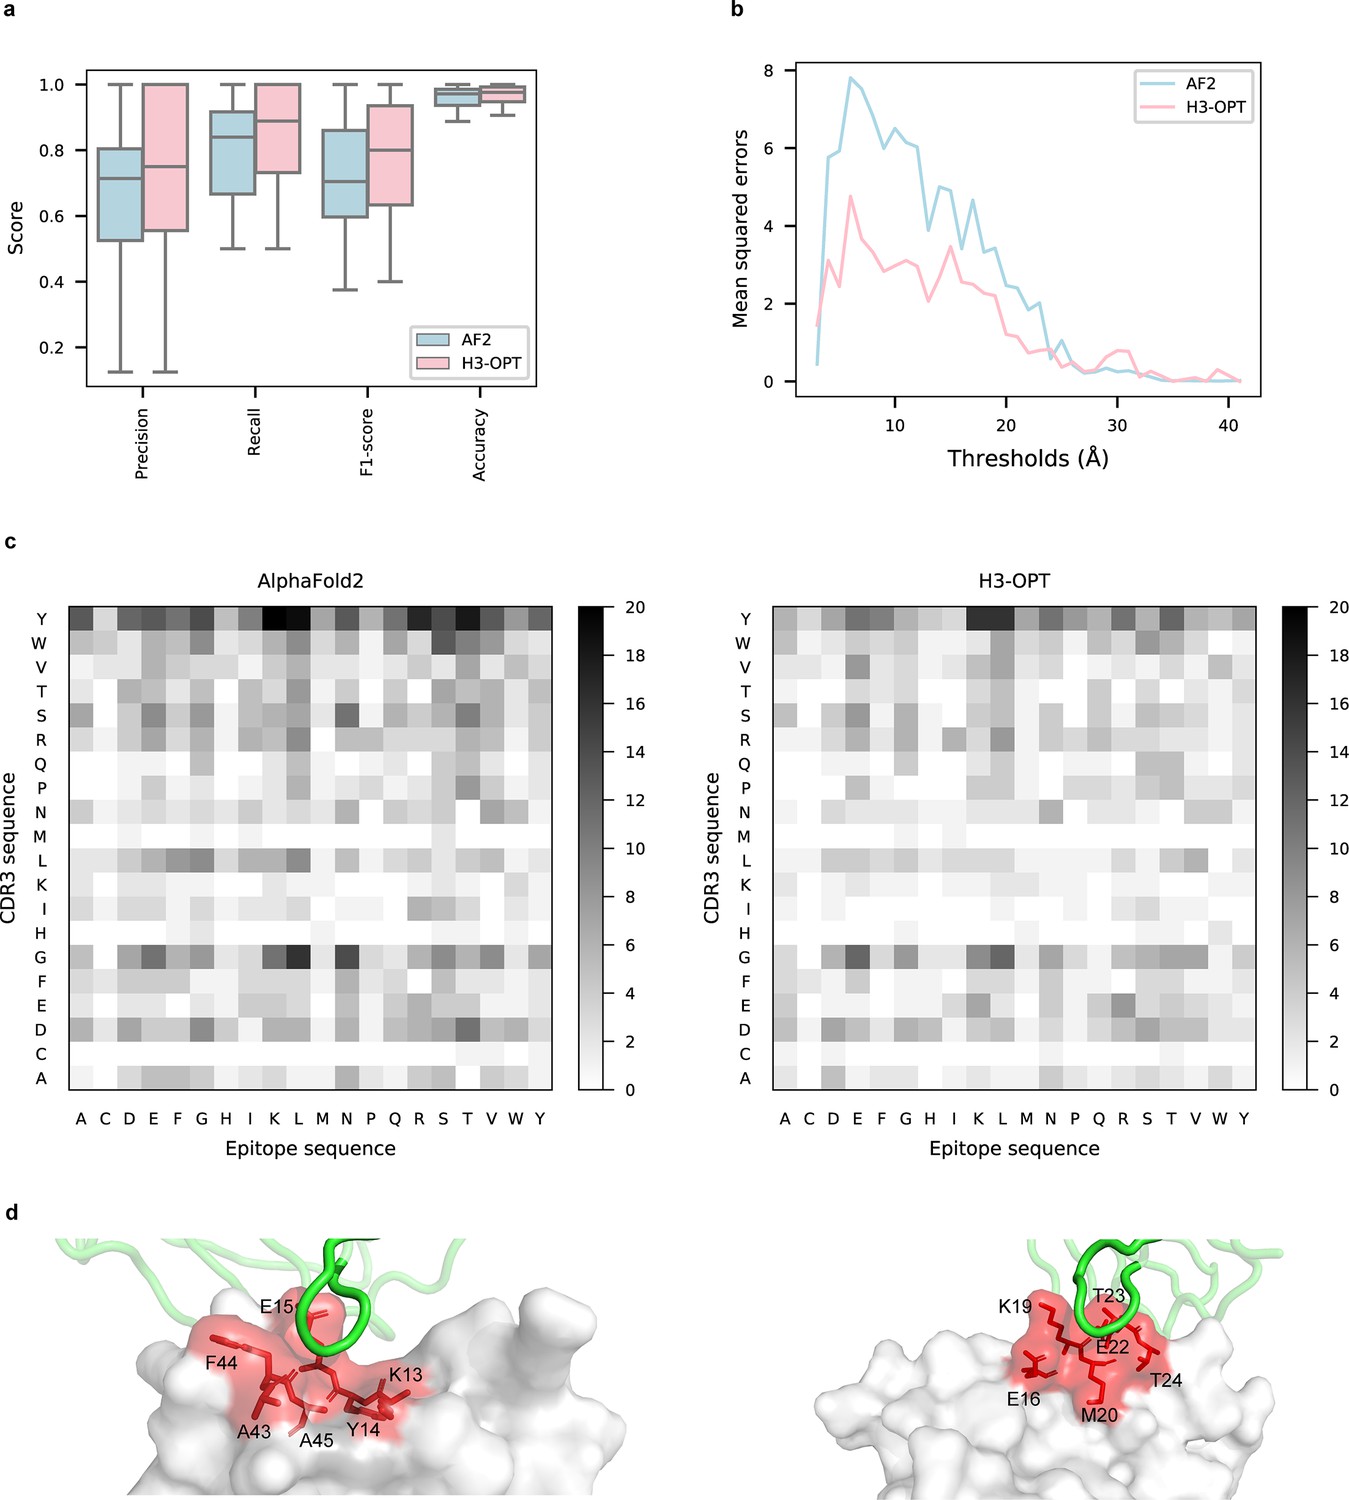
Accuracy of H3-OPT predictions of antibody–antigen interactions.
(a) Performance of H3-OPT in binding site prediction. comparison of prediction accuracy between H3-OPT and AF2 for antibody–antigen binding sites (n = 27). Box represents interquartile range (IQR); horizontal line in the center of the box shows median. (b) Comparison of the mean squared errors of residue pairs between H3-OPT and AF2 under different distance thresholds. The x-axis represents the experimentally determined distance between pairs of contacting residues at the binding site in the native structure. Y-axis shows mean squared errors of H3-OPT and AF2. (c) Heatmaps of the frequency of pairwise residue–residue contacts across antibody–antigen interfaces. This analysis compares contact frequency of H3 loops predicted by AF2 or H3-OPT with the native structure. Darker shading indicates greater difference in contact frequency. (d) The predicted H3 loops of two targets interacting with antigens (PDB: 2YC1, 6O9H). The epitopes are highlighted in red and antibody chains are green. H3-OPT could identify the epitopes of different antigens that form the complementary binding interface(s) for the CDR-H3 of antibodies.
Figure 9—figure supplement 1
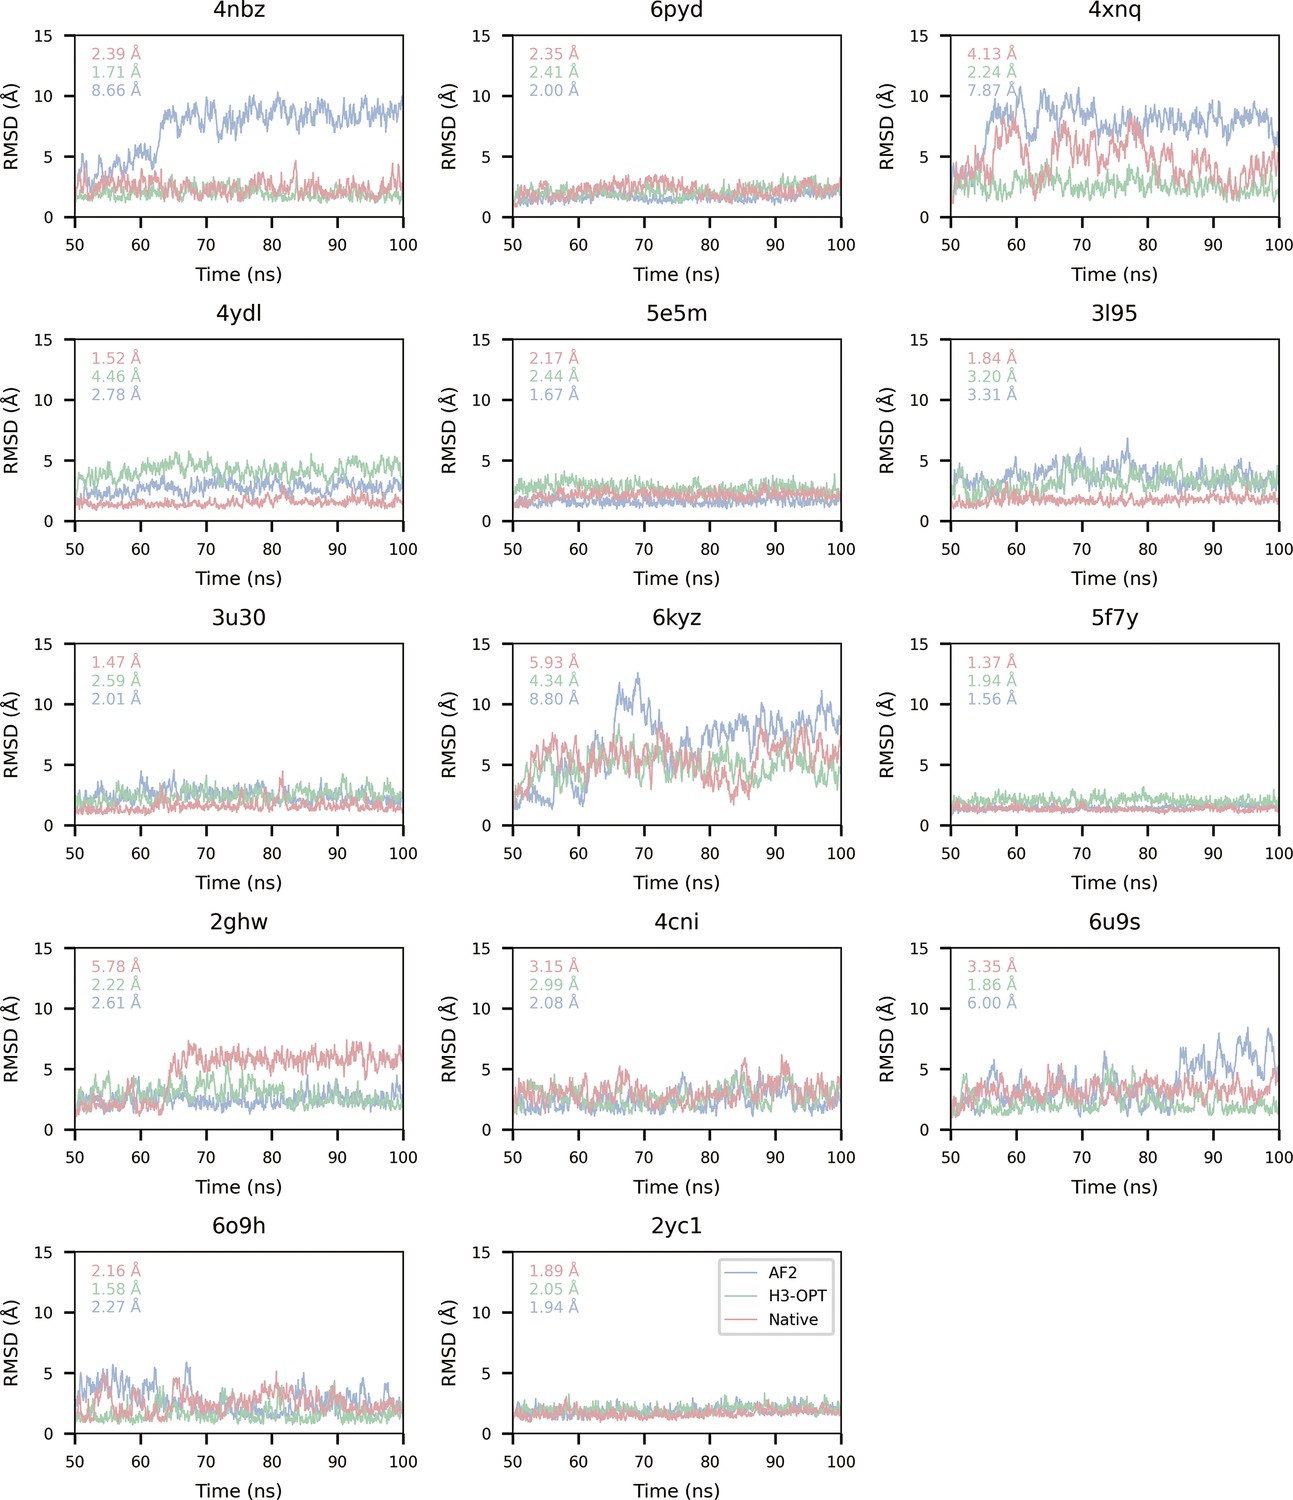
RMSDbackbone during production runs.
Author response image 1

Author response image 2
Author response image 3

Tables
Table 1
The root mean square deviation (RMSD) results of PM6D3 level re-ranking method on 14 same CDR-H3 antibodies.
| PDB ID | Ranked 0 RMSD | Lowest energy RMSD | Lowest RMSD | ΔRMSD* | ||
|---|---|---|---|---|---|---|
| 4kmt | 1.06 | 1.14 | 1.05 | –0.08 | ||
| 5i19 | 2.16 | 1.91 | 1.77 | 0.25 | ||
| 5i1l | 3.80 | 3.20 | 3.19 | 0.60 | ||
| 5i17 | 2.86 | 3.71 | 2.86 | –0.85 | ||
| 5i1d | 2.10 | 2.10 | 2.02 | 0.00 | ||
| 5i1c | 2.43 | 1.66 | 1.45 | 0.77 | ||
| 5i1a | 2.37 | 0.85 | 0.59 | 1.52 | ||
| 5i1i | 3.72 | 3.51 | 3.51 | 0.21 | ||
| 5i15 | 2.16 | 1.94 | 1.35 | 0.22 | ||
| 5i16 | 3.19 | 1.70 | 1.39 | 1.49 | ||
| 5i18 | 2.88 | 2.88 | 2.88 | 0.00 | ||
| 5i1e | 1.62 | 1.13 | 0.92 | 0.49 | ||
| 5i1g | 2.08 | 2.08 | 2.00 | 0.00 | ||
| 5i1h | 1.58 | 1.84 | 1.32 | –0.26 | ||
-
*
ΔRMSD was calculated by subtracting the RMSD of predicted model from the RMSD of Ranked_0 model.
Table 2
Accuracy of quantum mechanics (QM)-based re-ranking methods.
| Method | Freeze terminal Cα | CDR* | Phase | Ranked 0 RMSD | Lowest energy RMSD | Lowest RMSD | ΔRMSD |
|---|---|---|---|---|---|---|---|
| PM6D3 | Y | H3 | Gas | 2.64 | 2.76 | 2.16 | –0.12 |
| PM6D3 | N | H3 | Gas | 2.53 | 2.67 | 2.03 | –0.14 |
| PM6D3 | N | H1, H2, H3 | Gas | 2.50 | 2.64 | 2.00 | –0.14 |
| B3LYP | N | H3 | Gas | 2.66 | 2.87 | 2.30 | –0.21 |
| B3LYP | N | H3 | Water | 2.66 | 2.68 | 2.30 | –0.02 |
-
RMSD = root mean square deviation.
-
*
CDR means the energy of which loop is used to re-rank AF2 models.
Table 3
Accuracy of quantum mechanics (QM)-based optimization methods.
| Method | Freeze terminal Cα | Structure generation method | Phase | Ranked 0 RMSD | Lowest energy RMSD/opted RMSD | Lowest RMSD | ΔRMSD |
|---|---|---|---|---|---|---|---|
| PM6D3 | Y | / | Gas | 1.69 | 1.74/1.87 | 1.37 | –0.05 |
| B3LYP | N | / | Gas | 1.63 | 1.65/2.55 | 1.38 | –0.02 |
| B3LYP | N | / | Water | 1.63 | 1.58/2.25 | 1.38 | 0.05 |
| B3LYP | N | Boltzmann | Gas | 1.56 | 2.05 | 1.28 | –0.49 |
| B3LYP | N | Boltzmann | Water | 1.56 | 1.81 | 1.28 | –0.25 |
| B3LYP | N | Boltzmann, minimized | Gas | 1.56 | 1.96 | 1.28 | –0.40 |
| B3LYP | N | Boltzmann, minimized | Water | 1.56 | 1.84 | 1.28 | –0.28 |
-
RMSD = root mean square deviation.
Table 4
The accuracy of molecular dynamics (MD)-based CDR-H3 loop optimization in the 10 worst cases of AF2.
| PDB ID | Cα-RMSDRanked_0 | Cα-RMSDMD_opt | ΔCα-RMSD |
|---|---|---|---|
| 7n0r | 10.92 | 5.62 ± 0.97 | 5.30 |
| 3juy | 6.37 | 5.71 ± 0.23 | 0.66 |
| 5y80 | 6.61 | 7.59 ± 0.47 | –0.98 |
| 7a4t | 6.19 | 7.48 ± 0.29 | –1.29 |
| 4nzr | 6.57 | 7.73 ± 0.26 | –1.16 |
| 6xzu | 7.45 | 6.34 ± 0.94 | 1.11 |
| 6x05 | 6.32 | 7.48 ± 0.63 | –1.16 |
| 3c08 | 6.68 | 7.01 ± 0.11 | –0.33 |
| 4z9k | 9.04 | 8.01 ± 0.37 | 1.03 |
| 6oca | 7.61 | 8.01 ± 0.34 | –0.40 |
-
RMSD = root mean square deviation.
Table 5
Performance of H3-OPT with different protein language models (PLMs).
| RMSDCα (Å) | |
|---|---|
| H3-OPT | 2.24 ± 1.05 |
| AF2 | 2.85 ± 0.69 |
| ESM2 | 2.31 ± 1.13 |
| Without PLM | 2.41 ± 1.26 |
| AntiBERTy | 2.49 ± 1.42 |
| ProtTrans-T5 | 2.40 ± 1.28 |
-
RMSD = root mean square deviation.
Table 6
Comparison of binding affinities obtained from molecular dynamics (MD) simulations using AF2 and H3-OPT.
| PDB ID | AF2 (kcal/mol) | AF2 RMSDCα (Å) | H3-OPT (kcal/mol) | H3-OPT RMSDCα (Å) | AF2 (kcal/mol) | H3-OPT (kcal/mol) | |||||
|---|---|---|---|---|---|---|---|---|---|---|---|
| MM/GBSA | MM/PBSA | MM/GBSA | MM/PBSA | |ΔMM/GBSA*| | |ΔMM/PBSA| | |ΔMM/GBSA| | |ΔMM/PBSA| | ||||
| 2ghw | –29.20 | –33.36 | 2.7 | –14.70 | –21.36 | 3.0 | 8.63 | 2.42 | 23.13 | 14.42 | |
| 2yc1 | –38.85 | –37.73 | 2.3 | –43.80 | –48.72 | 1.5 | 6.80 | 18.67 | 1.85 | 7.68 | |
| 3l95 | –29.59 | –53.35 | 2.5 | –47.22 | –68.86 | 2.5 | 23.60 | 11.44 | 5.97 | 4.07 | |
| 3u30 | –37.31 | –42.41 | 2.6 | –44.94 | –50.07 | 2.5 | 9.64 | 2.18 | 2.01 | 5.48 | |
| 4cni | –36.96 | –42.93 | 1.0 | –31.92 | –40.39 | 1.3 | 8.54 | 7.44 | 3.50 | 4.89 | |
| 4nbz | –36.59 | –43.79 | 1.9 | –59.61 | –54.23 | 0.6 | 10.17 | 3.30 | 12.85 | 13.74 | |
| 4xnq | –13.55 | –17.47 | 2.7 | –31.51 | –30.94 | 0.5 | 15.40 | 12.32 | 2.57 | 1.15 | |
| 4ydl | –52.51 | –74.25 | 4.8 | –49.17 | –73.57 | 3.6 | 6.82 | 6.53 | 10.15 | 7.21 | |
| 5e5m | –59.72 | –71.15 | 3.0 | –41.29 | –53.70 | 7.3 | 0.50 | 5.79 | 18.93 | 11.66 | |
| 5f7y | –61.76 | –69.46 | 2.7 | –60.33 | –69.43 | 1.4 | 3.95 | 6.38 | 5.38 | 6.41 | |
| 6kyz | –12.66 | –20.32 | 4.0 | –9.36 | –17.13 | 3.7 | 17.63 | 17.21 | 20.93 | 20.40 | |
| 6o9h | –39.53 | –43.45 | 2.8 | –52.27 | –57.51 | 0.6 | 10.45 | 13.31 | 2.29 | 0.74 | |
| 6pyd | –45.87 | –58.71 | 1.0 | –35.75 | –45.28 | 1.1 | 6.29 | 13.50 | 3.83 | 0.06 | |
| 6u9s | –36.54 | –48.66 | 1.0 | –39.79 | –44.80 | 1.3 | 14.35 | 10.42 | 11.11 | 14.28 | |
| Average | / | / | 2.6 | / | / | 2.4 | 10.20 | 9.35 | 8.89 | 8.01 | |
-
*
ΔMM/GBSA (or ΔMM/PBSA) was calculated by subtracting the MM/GBSA (or MM/PBSA) of predicted model from the MM/GBSA· (or MM/PBSA) of experimental structure.
Table 7
Features of the model.
Nres is the number of residues (Jumper et al., 2021).
| Feature and shape | Description |
|---|---|
| Amino acid type [Nres, 21] | One-hot representation of the input amino acid sequence (including 20 amino acids and unknown). |
| 3D coordinates [Nres, 3] | Cα coordinates of all AlphaFold2-predicted residues |
| Backbone torsion angles [Nres, 6] | Sine and cosine encoding of all predicted three backbone torsion angles. |
| Torsion angles mask [Nres, 3] | A mask indicating if the angle was presented in the predicted structure. |
| H3 residue mask [Nres, 1] | A mask indicating if the residue was located in H3 loop. |
| Pairwise distances [Nres, Nres, 39] | One hot representation of residue alpha carbon atoms distance. The pairwise distances ranging from 3.25 Å to 50.75 Å were put into 38 bins equally and the last bin contained any larger distances. |
| Pairwise amino acid type [Nres, Nres, 21] | One-hot representation of the input amino acid sequence. |
Table 8
Hyperparameters for H3-OPT models.
| Model | 2 | 5 | 1 | 3 | Best |
|---|---|---|---|---|---|
| Initial learning rate | 1–4 | 5–4 | 1–3 | 5–4 | 1–4 |
| Hidden layers | 64 | 64 | 64 | 64 | 64 |
| Iterations numbers of Evoformer-like layer | 6 | 6 | 4 | 4 | 4 |
| Average RMSDCα (Å) | 2.42 | 2.36 | 2.35 | 2.33 | 2.24 |
-
RMSD = root mean square deviation.
Table 9
Average Cα-RMSDs of our test set under different confidence cutoffs.
| Cutoff | Cα-RMSD (Å) |
|---|---|
| 0.70 | 2.46 |
| 0.75 | 2.30 |
| 0.80 | 2.24 |
| 0.85 | 2.17 |
| 0.90 | 2.29 |
| 0.95 | 2.28 |
-
RMSD = root mean square deviation.
Author response table 1
| PDBID | AF2(kcal//mol) | AF2 RMSD_(Cu) (A) | H3-OPT(kcal//mol) | AF2(kcal//mol) | H3-OPT(kcal//mol) | |||||
|---|---|---|---|---|---|---|---|---|---|---|
| MM/ GBSA | MM/ PBSA | MM/ GBSA | MM/ PBSA | ("Å") | |/_\MM//GBSA^(**)| | | /_\MM//PBSA∣ | [ /_\MM//GBSA] | |/_\MM//PBSA| | ||
| 2ghw | -29.20 | -33.36 | 2.7 | -14.70 | -21.36 | 3.0 | 8.63 | 2.42 | 23.13 | 14.42 |
| 2yc1 | -38.85 | -37.73 | 2.3 | -43.80 | -48.72 | 1.5 | 6.80 | 18.67 | 1.85 | 7.68 |
| 3195 | -29.59 | -53.35 | 2.5 | -47.22 | -68.86 | 2.5 | 23.60 | 11.44 | 5.97 | 4.07 |
| 3u30 | -37.31 | -42.41 | 2.6 | -44.94 | -50.07 | 2.5 | 9.64 | 2.18 | 2.01 | 5.48 |
| 4cni | -36.96 | -42.93 | 1.0 | -31.92 | -40.39 | 1.3 | 8.54 | 7.44 | 3.50 | 4.89 |
| 4nbz | -36.59 | -43.79 | 1.9 | -59.61 | -54.23 | 0.6 | 10.17 | 3.30 | 12.85 | 13.74 |
| 4xx nq | -13.55 | -17.47 | 2.7 | -31.51 | -30.94 | 0.5 | 15.40 | 12.32 | 2.57 | 1.15 |
| 4ydl | -52.51 | -74.25 | 4.8 | -49.17 | -73.57 | 3.6 | 6.82 | 6.53 | 10.15 | 7.21 |
| 5e5m | -59.72 | -71.15 | 3.0 | -41.29 | -53.70 | 7.3 | 0.50 | 5.79 | 18.93 | 11.66 |
| 577 y | -61.76 | -69.46 | 2.7 | -60.33 | -69.43 | 1.4 | 3.95 | 6.38 | 5.38 | 6.41 |
| 6kyz | -12.66 | -20.32 | 4.0 | -9.36 | -17.13 | 3.7 | 17.63 | 17.21 | 20.93 | 20.40 |
| 609h | -39.53 | -43.45 | 2.8 | -52.27 | -57.51 | 0.6 | 10.45 | 13.31 | 2.29 | 0.74 |
| 6pyd | -45.87 | -58.71 | 1.0 | -35.75 | -45.28 | 1.1 | 6.29 | 13.50 | 3.83 | 0.06 |
| 6u9s | -36.54 | -48.66 | 1.0 | -39.79 | -44.80 | 1.3 | 14.35 | 10.42 | 11.11 | 14.28 |
| Average | 1 | I | 2.6 | l | 1 | 2.4 | 10.20 | 9.35 | 8.89 | 8.01 |
Additional files
Download links
A two-part list of links to download the article, or parts of the article, in various formats.
Downloads (link to download the article as PDF)
Open citations (links to open the citations from this article in various online reference manager services)
Cite this article (links to download the citations from this article in formats compatible with various reference manager tools)
Accurate prediction of CDR-H3 loop structures of antibodies with deep learning
eLife 12:RP91512.
https://doi.org/10.7554/eLife.91512.4


