Sensorimotor mechanisms selective to numerosity derived from individual differences
- Department of Neuroscience, Psychology, Pharmacology and Child Health, University of Florence, Italy
- School of Psychology, University of Sydney, Camperdown NSW, Australia
- Institute of Neuroscience, CNR, Italy
Figures
Figure 1
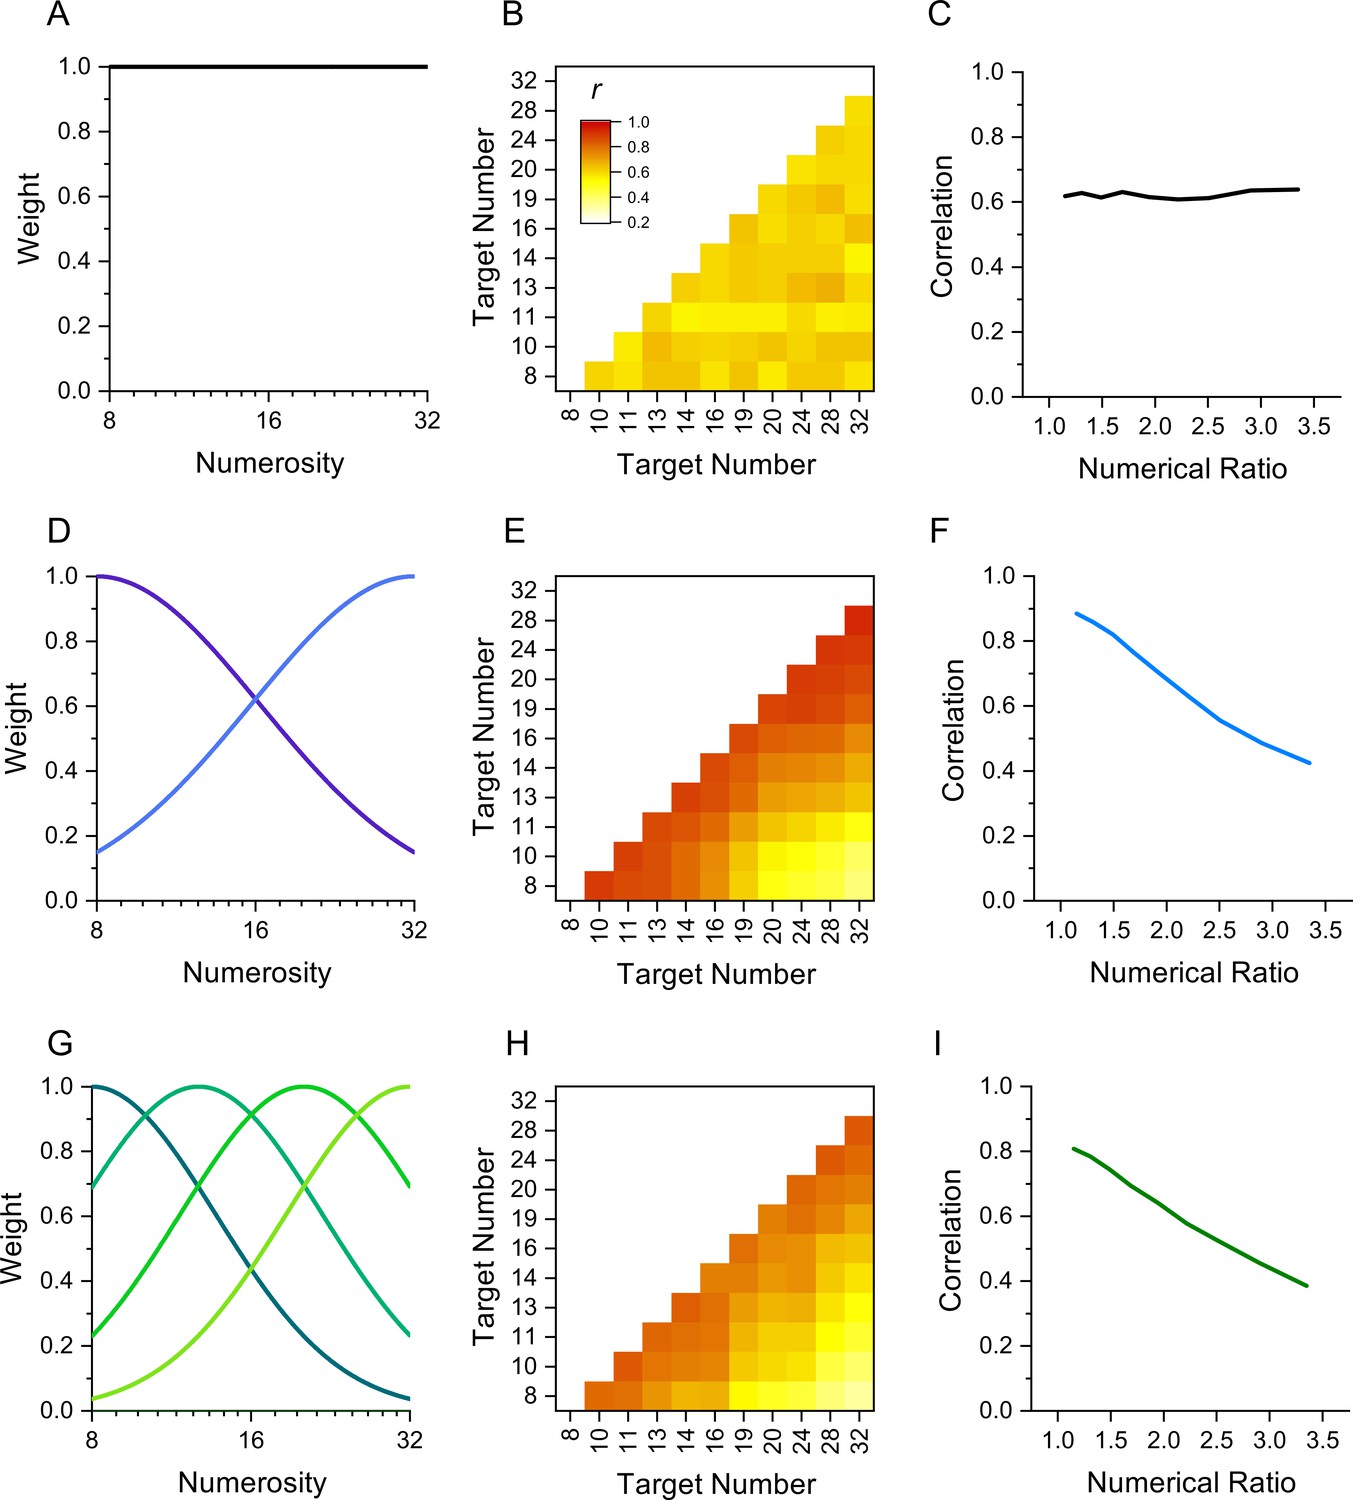
Simulation of behavior with 1, 2, or 4 channels mediating numerosity judgments.
(A) 1-channel model shown as a flat tuning function. (B) Predicted correlation matrix between all pairs of numerosities. There is no systematic variability, only random variations induced by the noise. (C) Average correlation as function of numerical ratio of dot pairs, showing no dependency. (D) Two-channel model centred at numerosities 8 and 32, with full bandwidth of 1.45 octaves. (E) Correlation matrix, showing higher correlations near the identity line. (F) Correlation as function of numerical ratio, showing a systematic falloff with numerical ratio. (G–I) Same as D-F for a four-channel model with channels equally spaced in the range between 8 and 32 with full bandwidth of 1.10 octaves. Correlation matrices were obtained by simulating 1000 experiments with cohorts of 29–30 observers to yield the best fit (R2).
Figure 2
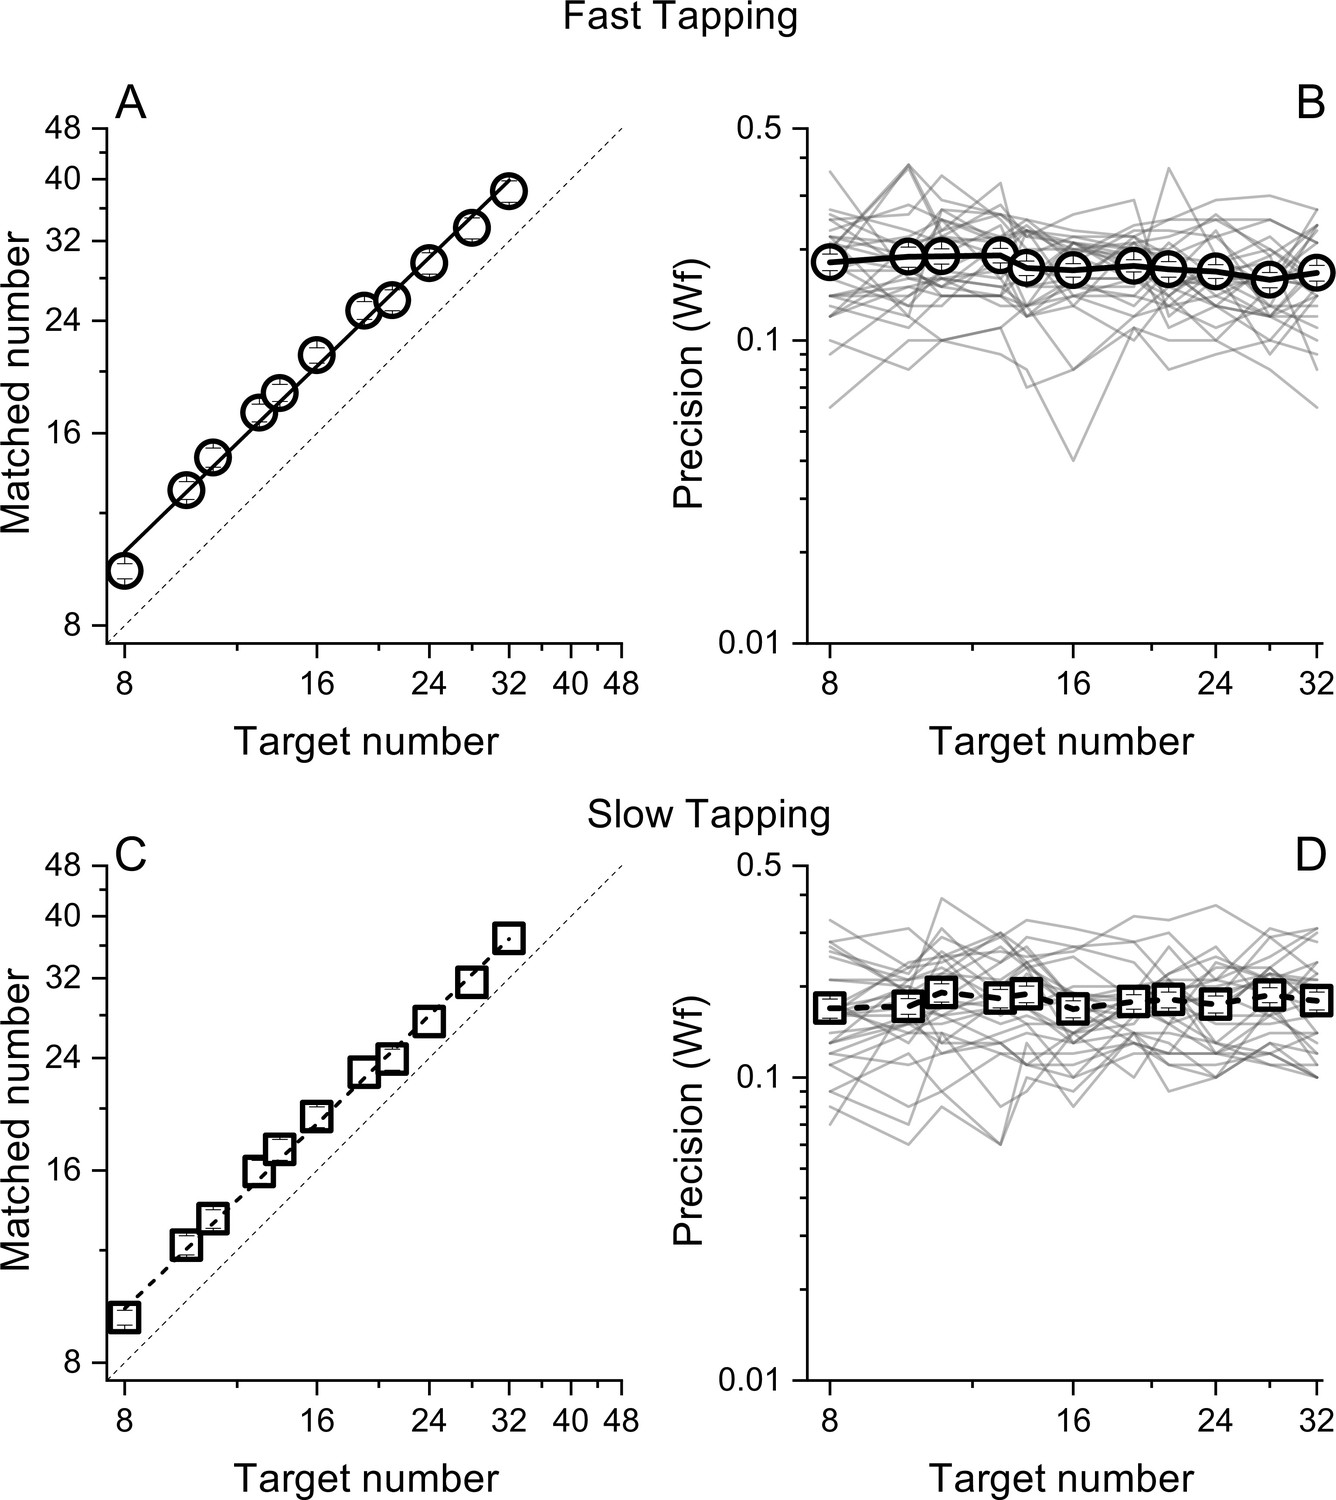
Matched number (A and B) and Weber Fractions (B and &C) as a function of target number, separated for the fast (circles) and slow (squares) tapping conditions.
Lines through the data in panels A and C show best linear fits. Thin lines in panel B&D show individual data. Symbols represent means (N30 and N29 for fast and slow tapping respectively), Error bars are ±1 s.e.m., across participants.
Figure 3
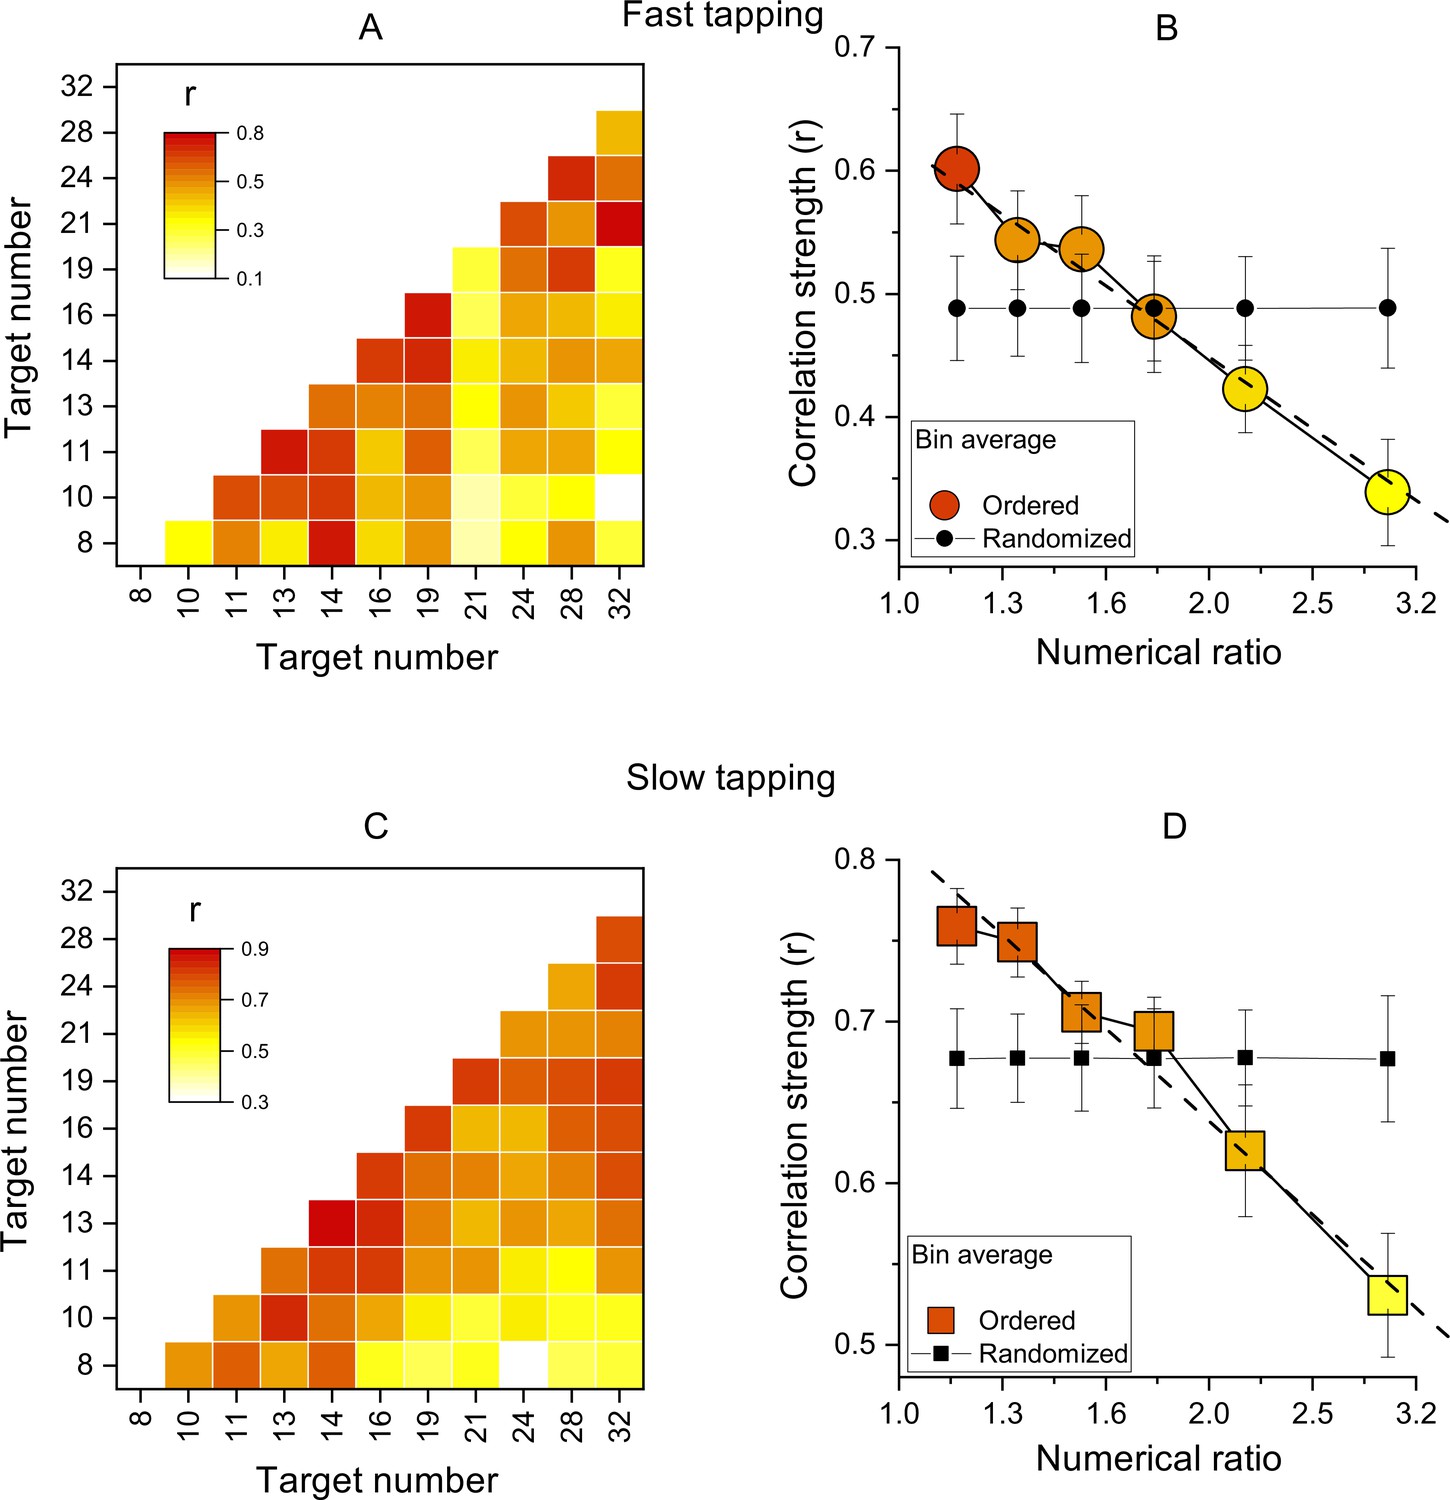
Inter-participant correlations.
(A) Correlation matrices of Wfs for all pairs of target numbers for the slow-tapping condition. (B) Correlation strength as a function of numerical ratio, for the slow-tapping condition. Small black filled symbols show bootstrapped average correlation strengths of randomized Wfs matrices. Dashed lines are the best linear fit on unbinned data and error bars are ±1 s.e.m. Symbols represent means (N30 and N29 for fast and slow tapping respectively), best linear fit slopes were: –0.58±0.11 and –0.57±0.07 for fast and slow respectively, both different from zero p<0.001. C&D. Like A and B, for the slow-tapping condition.
Figure 4
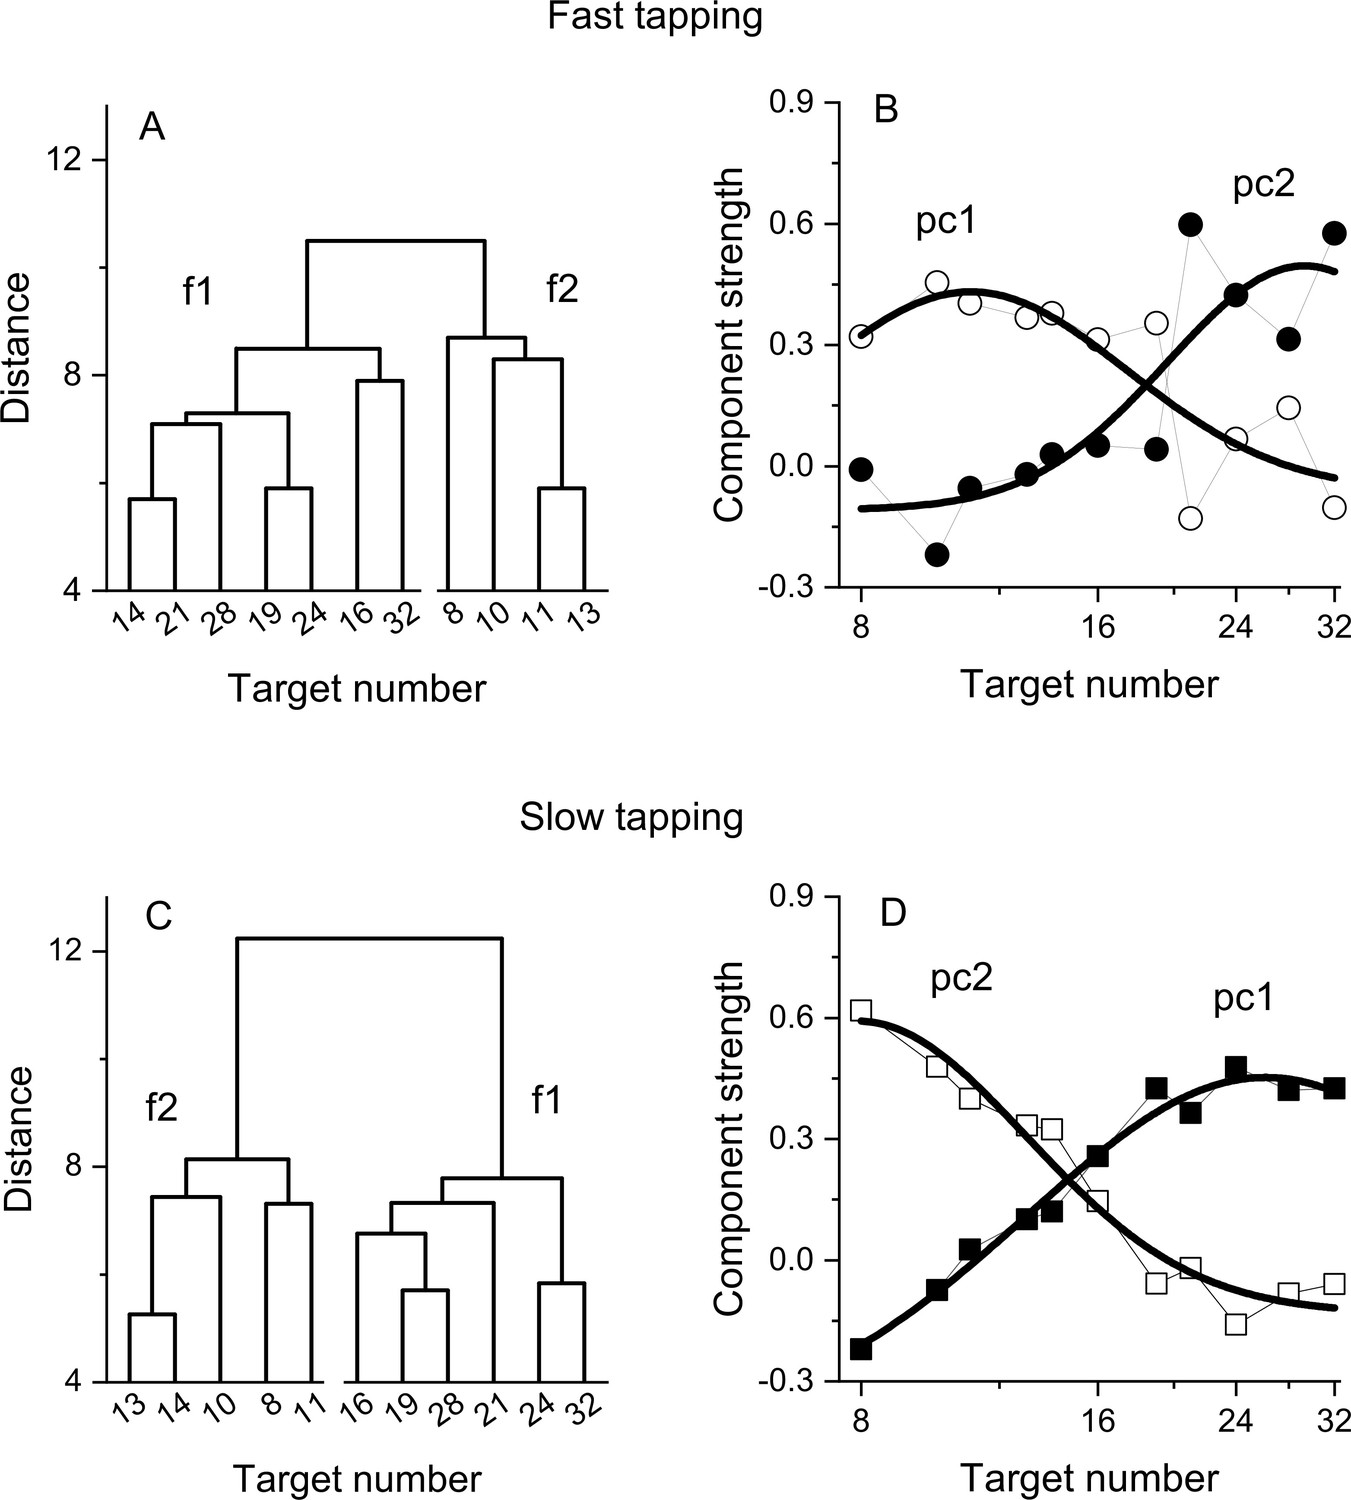
Dendrograms from hierarchical clustering on Wfs in the fast (A) and slow (C) tapping conditions.
Panels B and D show the strength of the first two principal components from a PCA on the Wfs measured in the fast (B) and slow (D) tapping conditions (N30 and N29 respectively). The strength of these components is shown as a function of the different numerical target levels. The smooth curves are logGaussian fits to the component strengths.
Figure 5
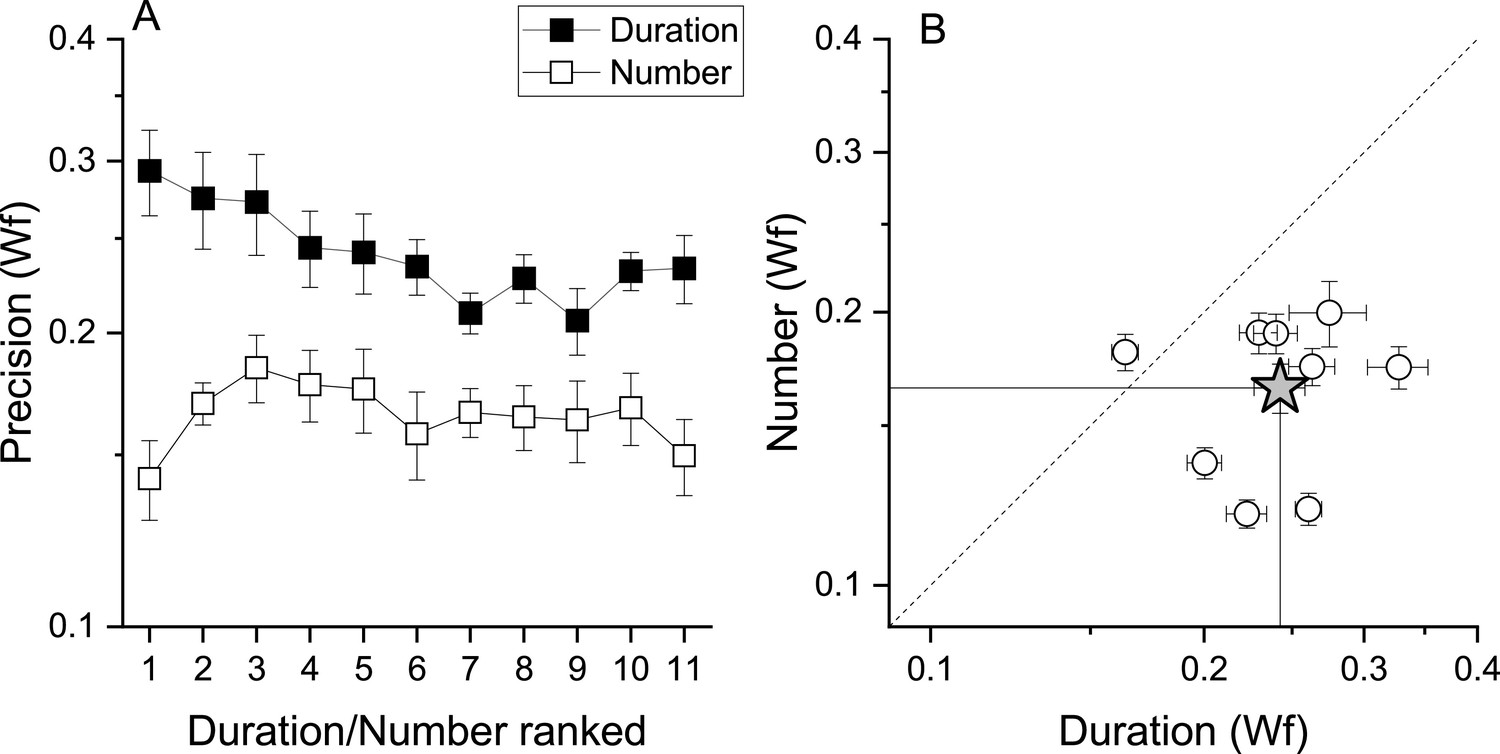
Number and duration matching tasks.
(A) Average (across participant, N9) Weber fraction for the number (filled squares) and duration (empty squares) matching tasks, as a function of ranked target stimulus (visual digits for the number task, and the corresponding auditory tones durations for the duration task, see Methods for details). (B) Individual Weber fractions for the number task plotted against those for the duration task, averaged across stimulus intensity. The star symbol reports average across participants. Error bars are±1s.e.m. Weber fractions in the duration task were higher compared to those measured in the number task (RM ANOVA, p=0.002).
Tables
Table 1
Responses duration (in seconds) tested in in the control duration task for each one of the nine participants (S1-S9).
| S1 | S2 | S3 | S4 | S5 | S6 | S7 | S8 | S9 |
|---|---|---|---|---|---|---|---|---|
| 3 | 4.1 | 7.3 | 3.5 | 2.2 | 5 | 2.4 | 2.6 | 2.3 |
| 4 | 6.3 | 9.2 | 4.9 | 3.8 | 6.3 | 3.3 | 2.8 | 2.9 |
| 4.4 | 7 | 10.5 | 5.4 | 4.2 | 6.5 | 3.5 | 3 | 3.2 |
| 5.1 | 7.9 | 11.3 | 6.2 | 5 | 8.3 | 4.2 | 3.8 | 4 |
| 5.7 | 9.3 | 12.5 | 7 | 5.4 | 8.6 | 4.3 | 4 | 4.4 |
| 6.8 | 10 | 15.3 | 8.2 | 6 | 9.5 | 5.4 | 4.4 | 5 |
| 7.8 | 11.7 | 17 | 9.9 | 6.9 | 11.5 | 6.4 | 5.3 | 5.8 |
| 8.8 | 13.7 | 17.4 | 10.6 | 7 | 13.2 | 7.4 | 5.7 | 6 |
| 10.2 | 15.8 | 21 | 12.2 | 8.6 | 15.3 | 8.1 | 6 | 7.4 |
| 12 | 17.8 | 23.3 | 13.3 | 9.2 | 17.7 | 9.6 | 7.2 | 8.8 |
| 12.9 | 21.7 | 29.2 | 16 | 10.8 | 20.6 | 11.1 | 8.2 | 9.4 |
Additional files
Download links
A two-part list of links to download the article, or parts of the article, in various formats.
Downloads (link to download the article as PDF)
Open citations (links to open the citations from this article in various online reference manager services)
Cite this article (links to download the citations from this article in formats compatible with various reference manager tools)
Sensorimotor mechanisms selective to numerosity derived from individual differences
eLife 12:RP92169.
https://doi.org/10.7554/eLife.92169.3


