Evolution of hind limb morphology of Titanosauriformes (Dinosauria, Sauropoda) analyzed via 3D geometric morphometrics reveals wide-gauge posture as an exaptation for gigantism
- Scientific Computation Research Institute (SCRIUR), Universidad de La Rioja, Spain
- Centro de Interpretación Paleontológica de La Rioja, Spain
- Grupo de Biología Evolutiva (GBE), Universidad Nacional de Educación a Distancia, Spain
- Instituto Dom Luiz, Faculdade de Ciências, Universidade de Lisboa, Portugal
Figures
Figure 1
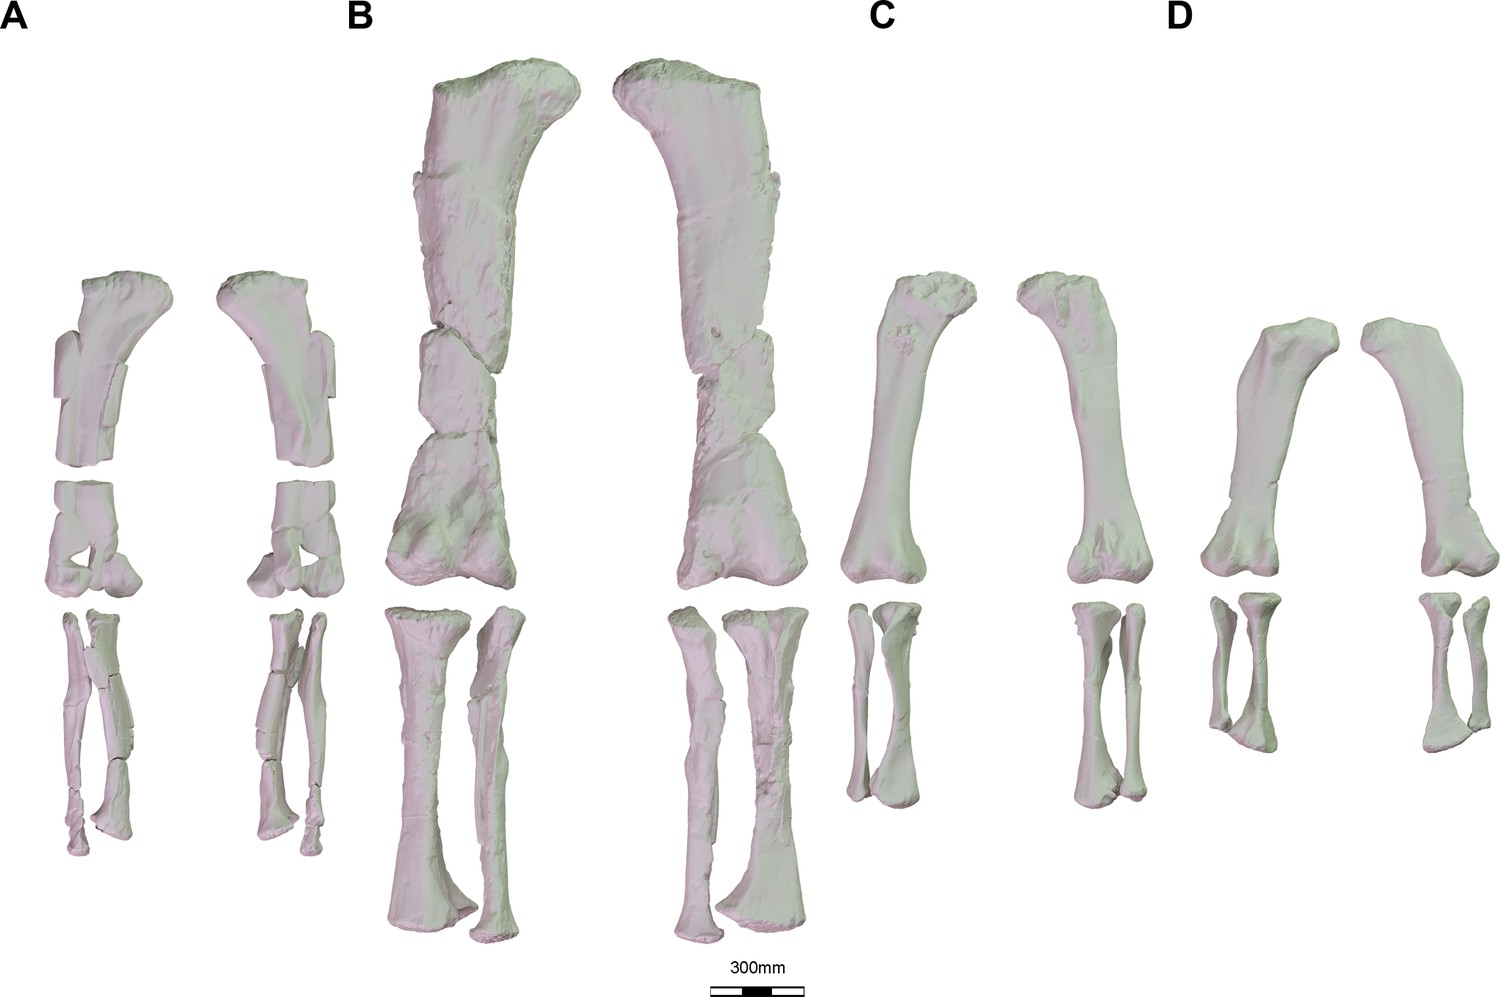
Sample of several 3D reconstruction of macronarian hind limbs used in this study.
(A) Oceanotitan dantasi in anterior and posterior view; (B) Ligabuesarusu leanzai in posterior and anterior view; (C) Lohuecotitan pandafilandi in anterior and posterior view; (D) Saltasaurus loricatus in posterior and anterior view.
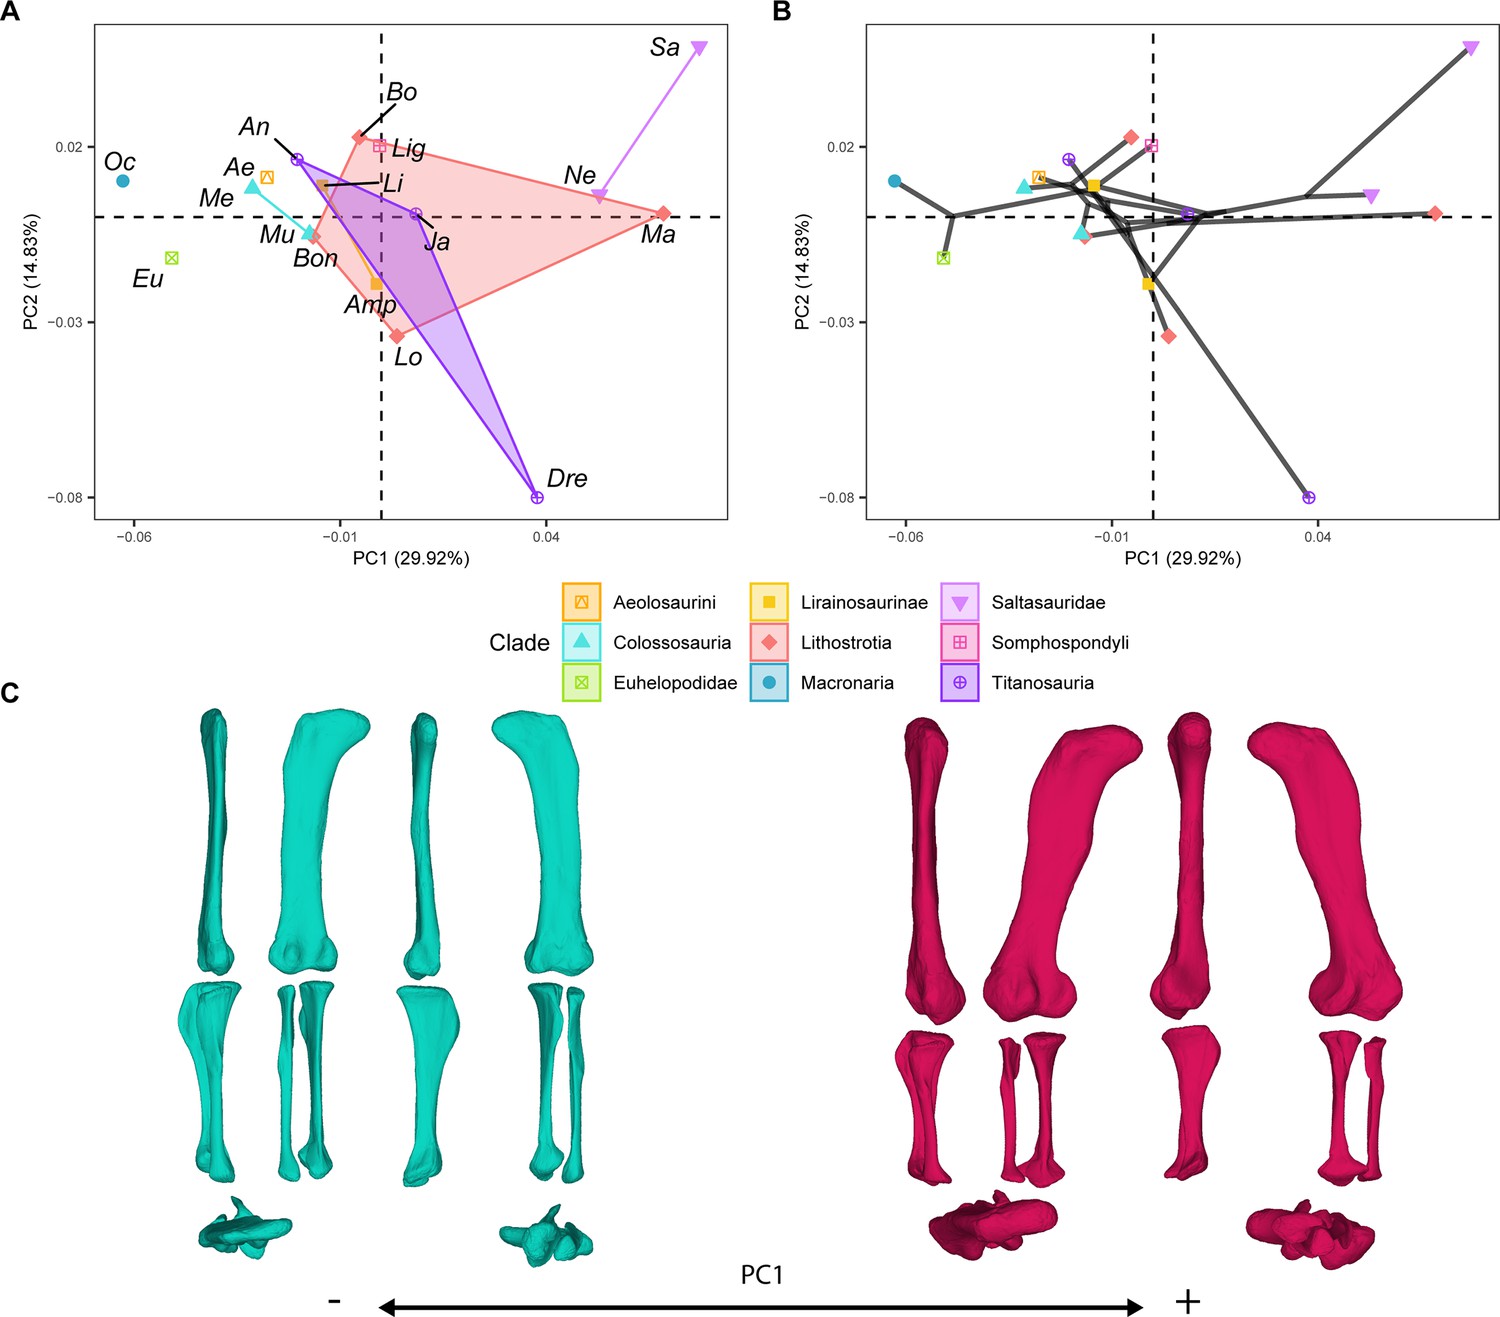
Figure 2
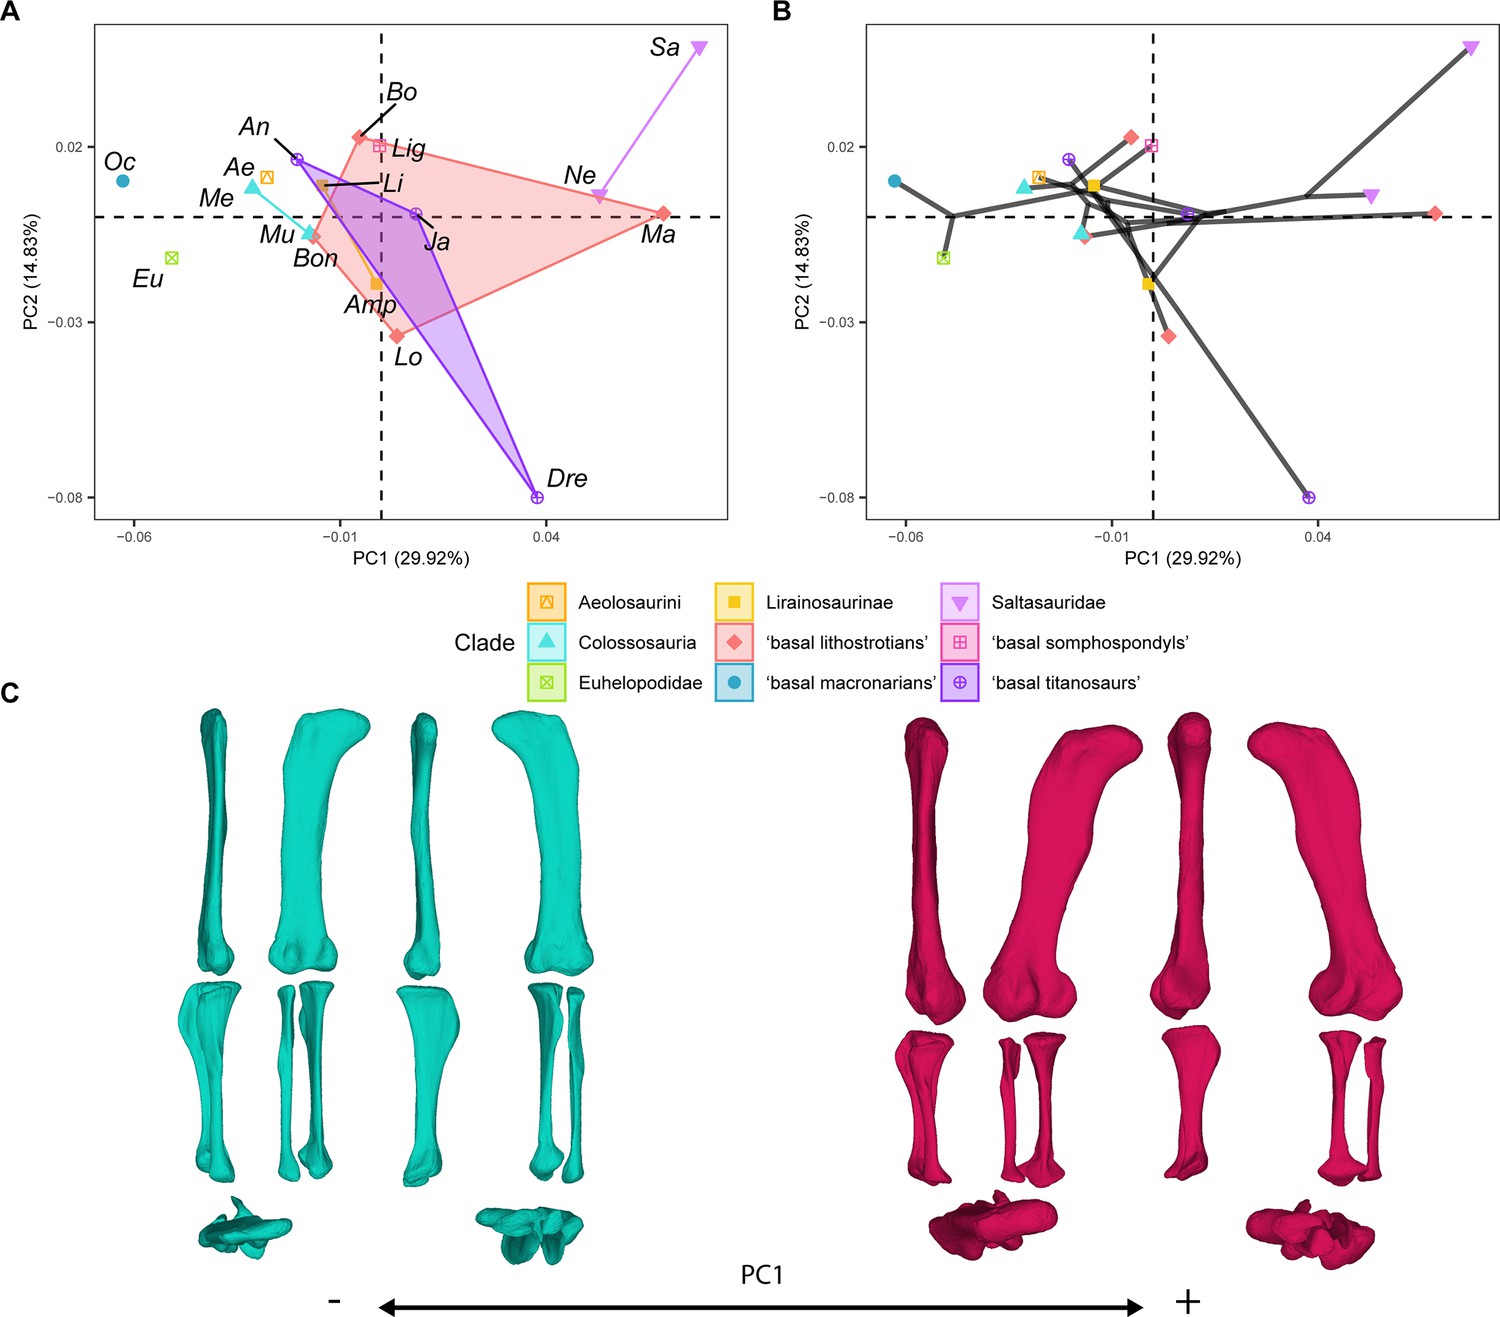
PCA results on the GPA aligned landmark and semilandmark curves of the hind limb.
(A) PC1-PC2 biplot. (B) PC1-PC2 phylomorphospace with projected phylogenetic tree. (C) Representation of the shape change along PC1, blue are negative scores, red are positive scores. Percentage of variance of each PC in brackets under corresponding axis. Ae – Aeolosaurus, Amp – Ampelosaurus, An – Antarctosaurus, Bo – Bonatitan, Bon – Bonitasaura, Dre – Dreadnoughuts, Eu – Euhelopus, Ja – Jainosaurus, Li – Lirainosaurus, Lig – Ligabuesaurus, Lo – Lohuecotitan, Ma – Magyarosaurus, Me – Mendozasaurus, Mu – Muyelensaurus, Ne – Neuquensaurus, Sa – Saltasaurus.
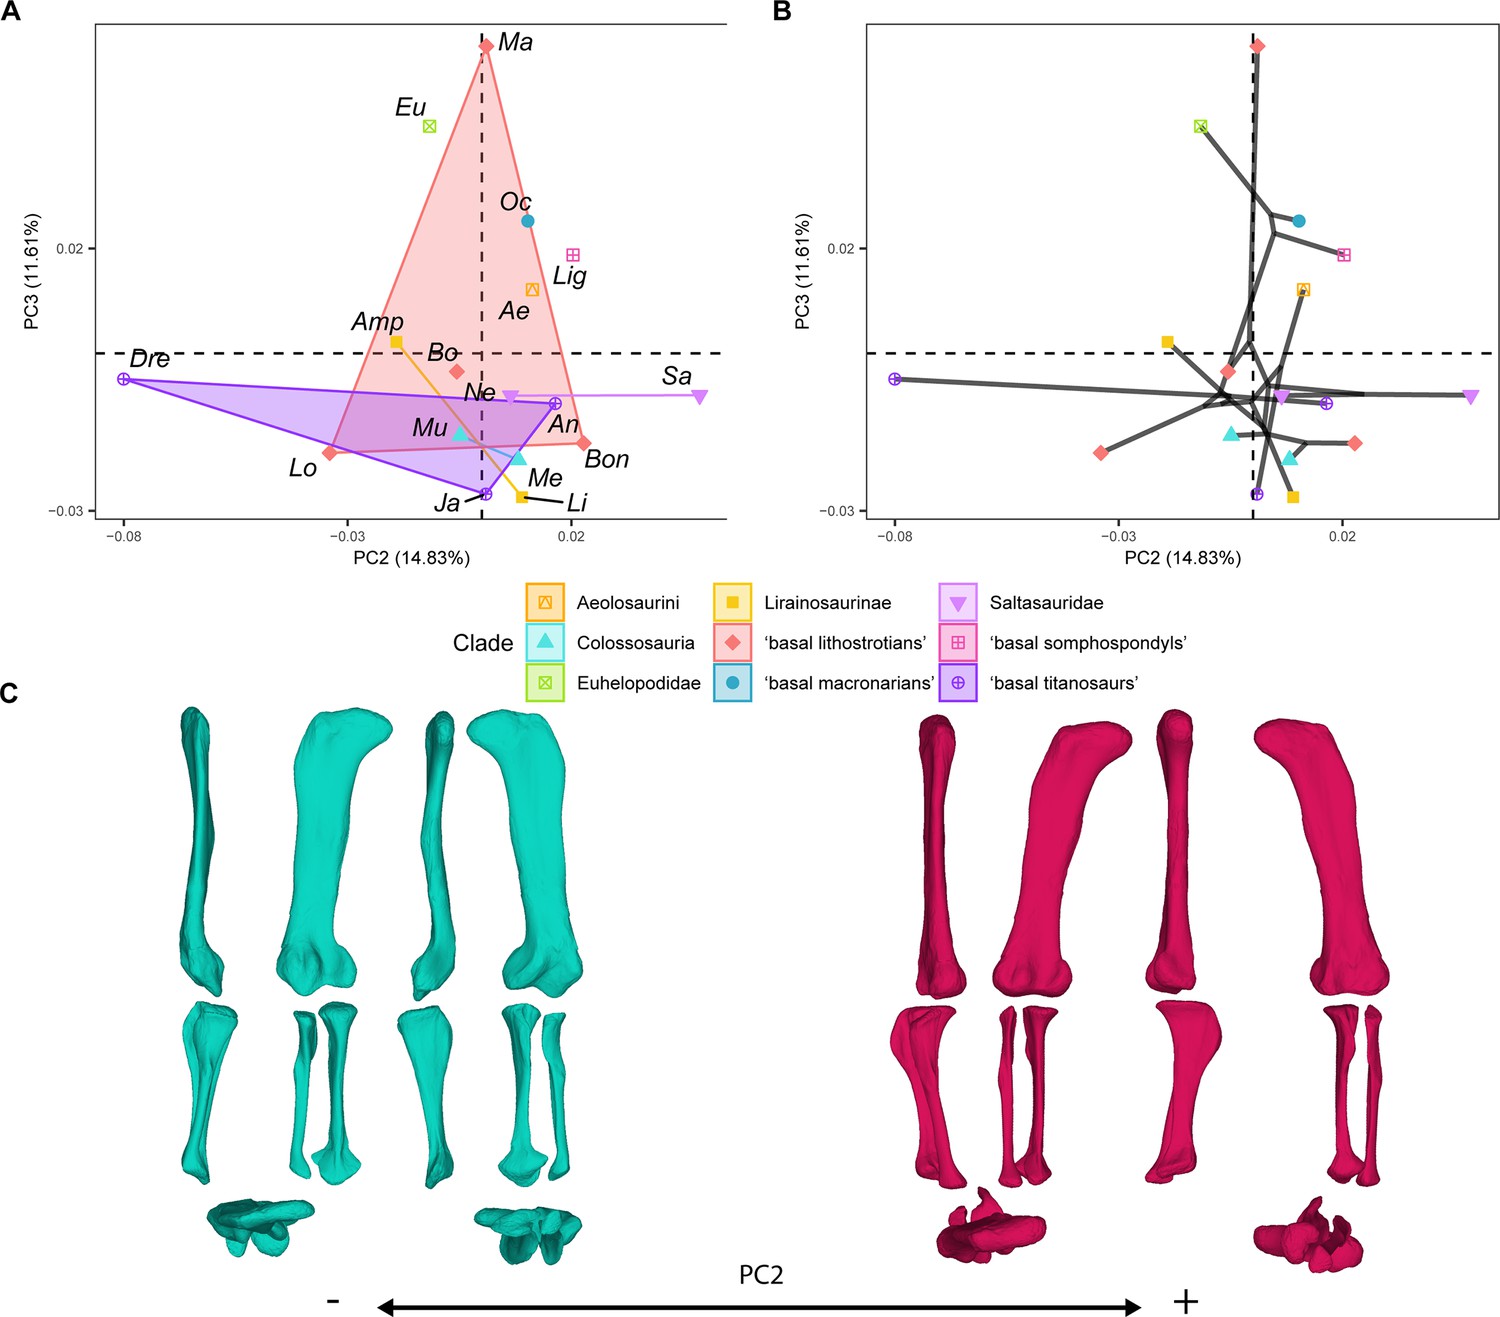
Figure 3
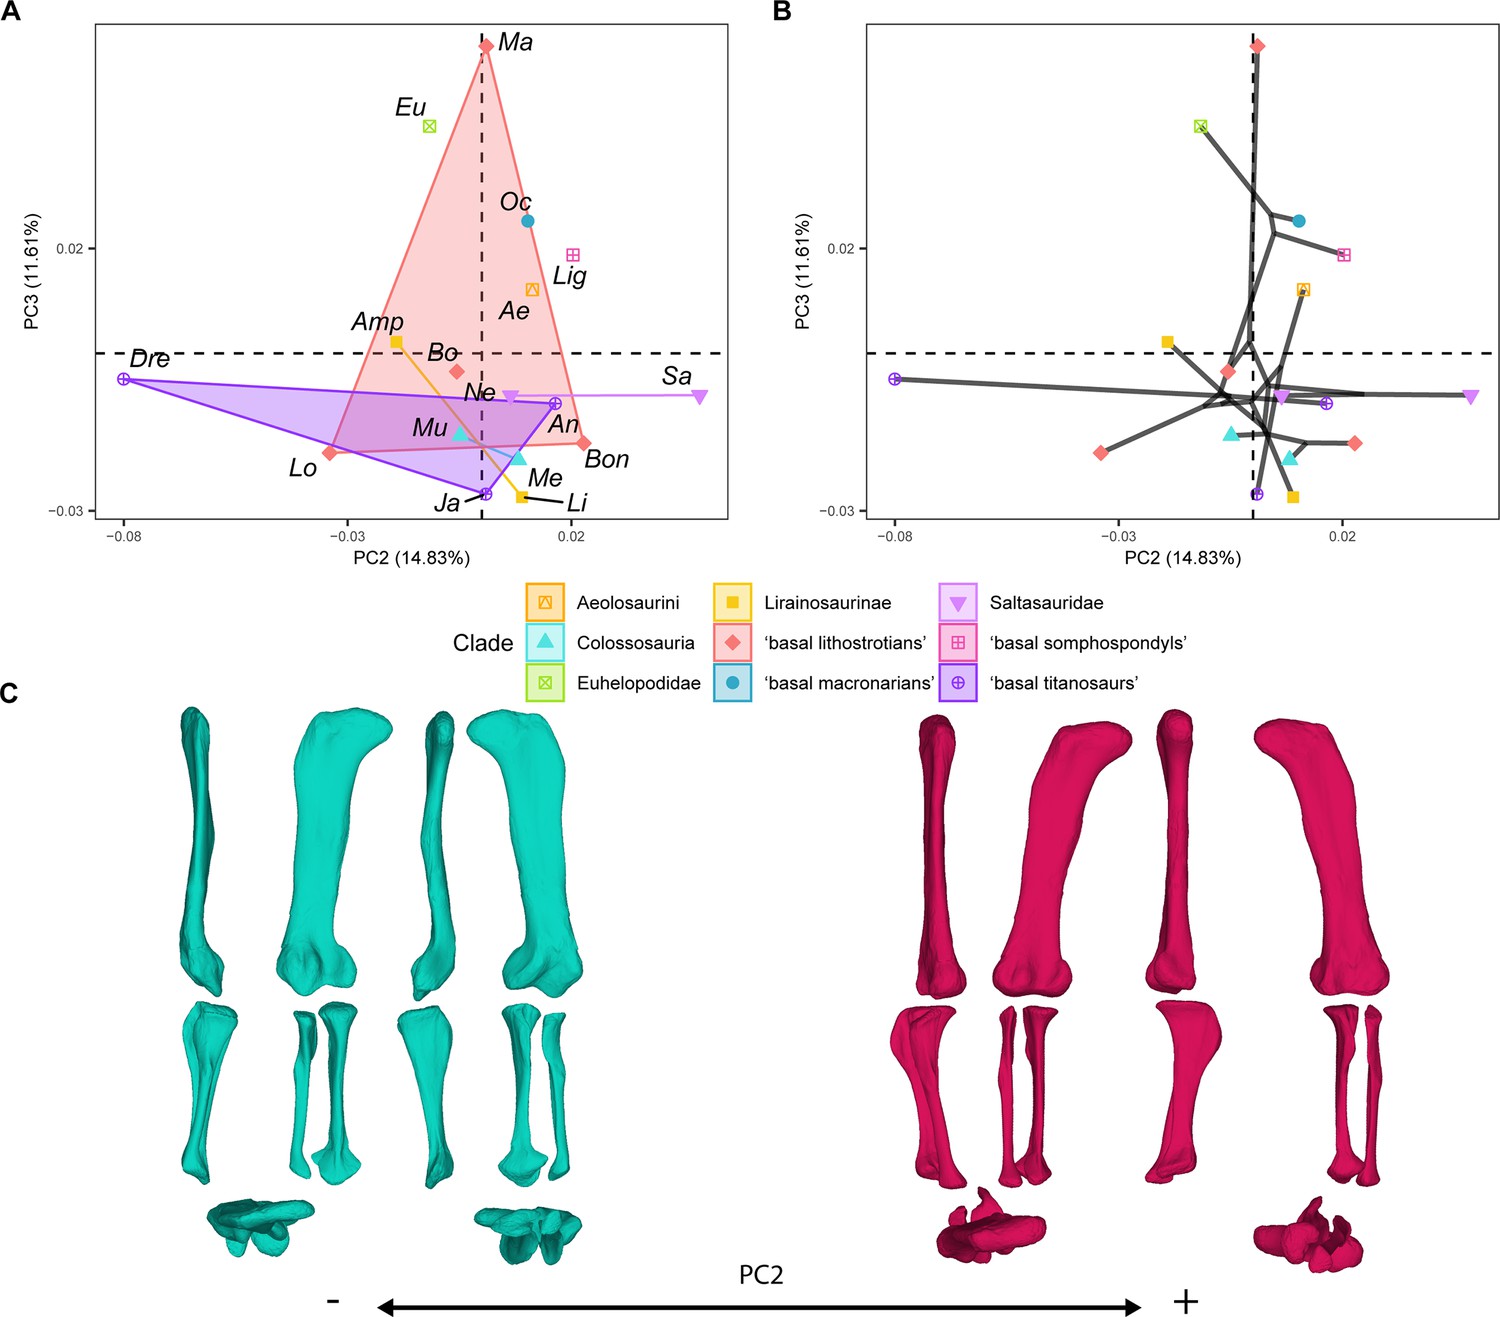
PCA results for the GPA aligned landmark and semilandmark curves of the hind limbs.
(A) PC2-PC3 biplot. (B) PC2-PC3 phylomorphospace with projected phylogenetic tree. (C) Representation of the shape change along PC2, blue are negative scores, red are positive scores. Percentage of variance of each PC in brackets under corresponding axis. Ae – Aeolosaurus, Amp – Ampelosaurus, An – Antarctosaurus, Bo – Bonatitan, Bon – Bonitasaura, Dre – Dreadnoughuts, Eu – Euhelopus, Ja – Jainosaurus, Li – Lirainosaurus, Lig – Ligabuesaurus, Lo – Lohuecotitan, Ma – Magyarosaurus, Me – Mendozasaurus, Mu – Muyelensaurus, Ne – Neuquensaurus, Sa – Saltasaurus.
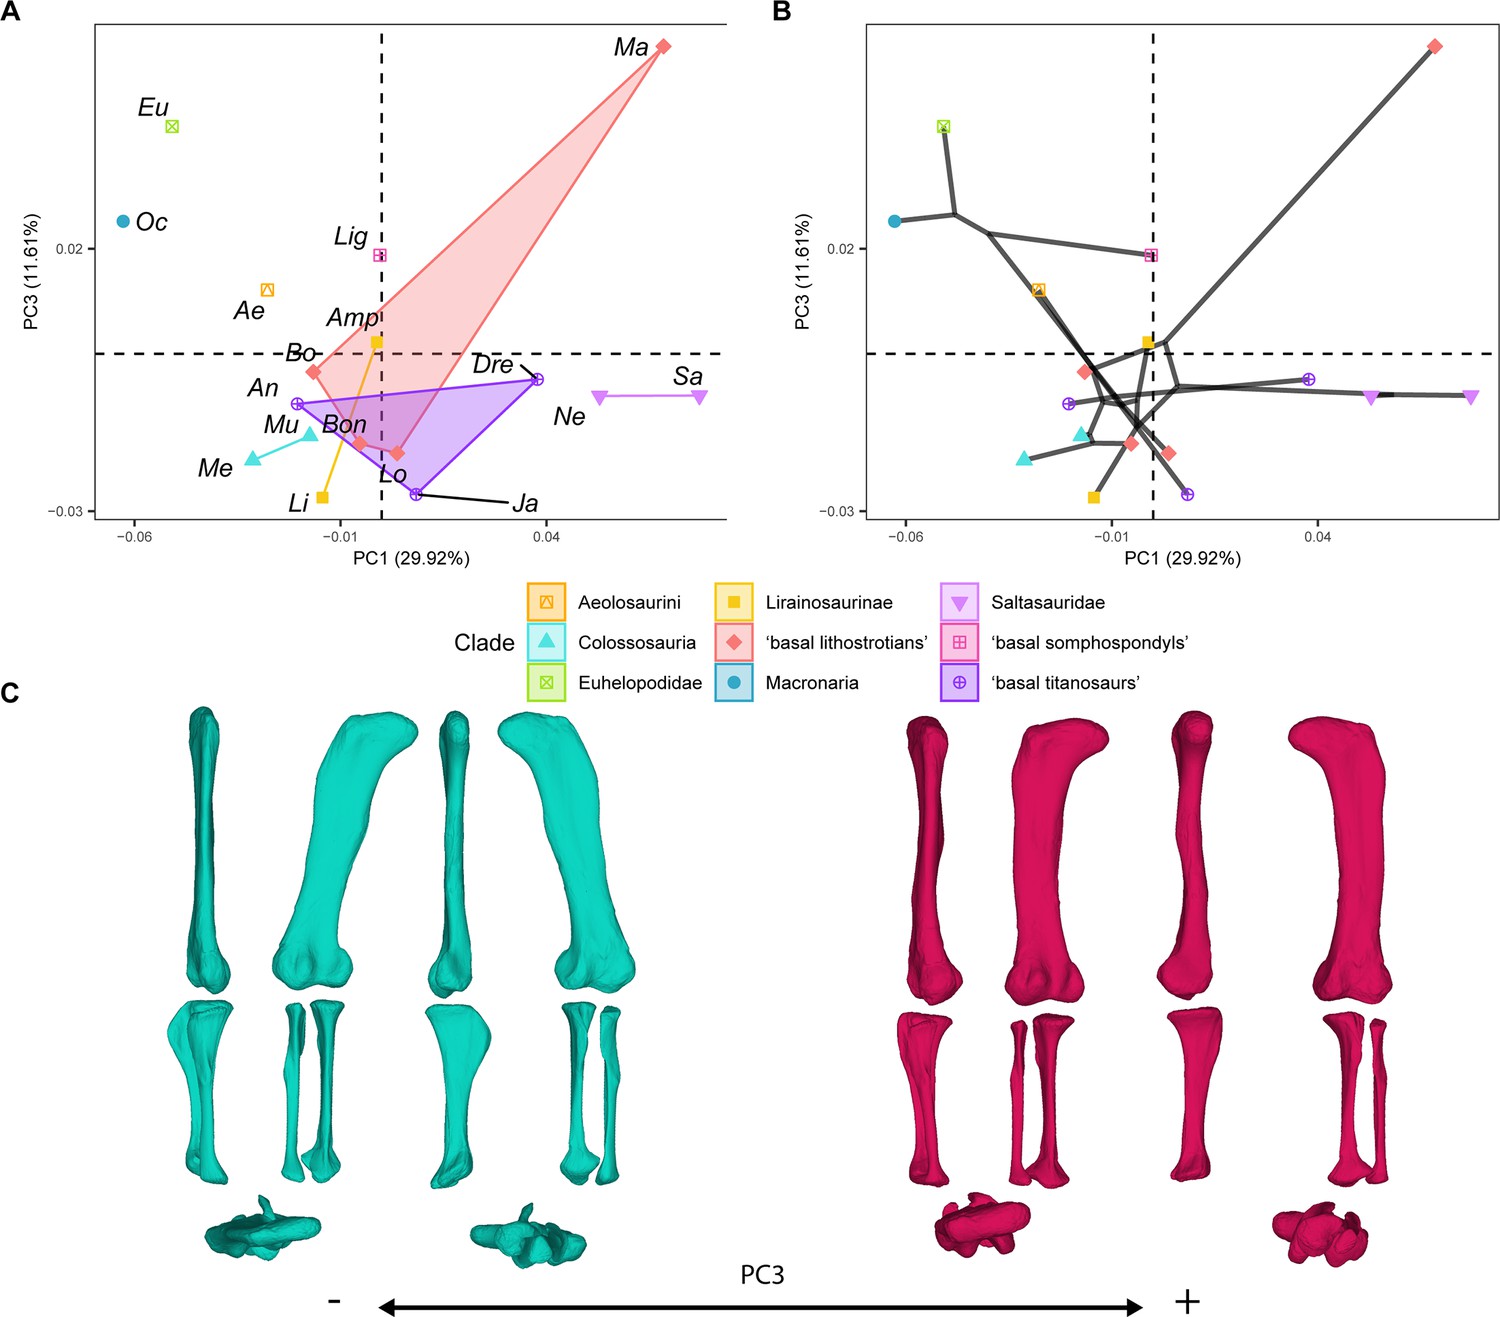
Figure 4
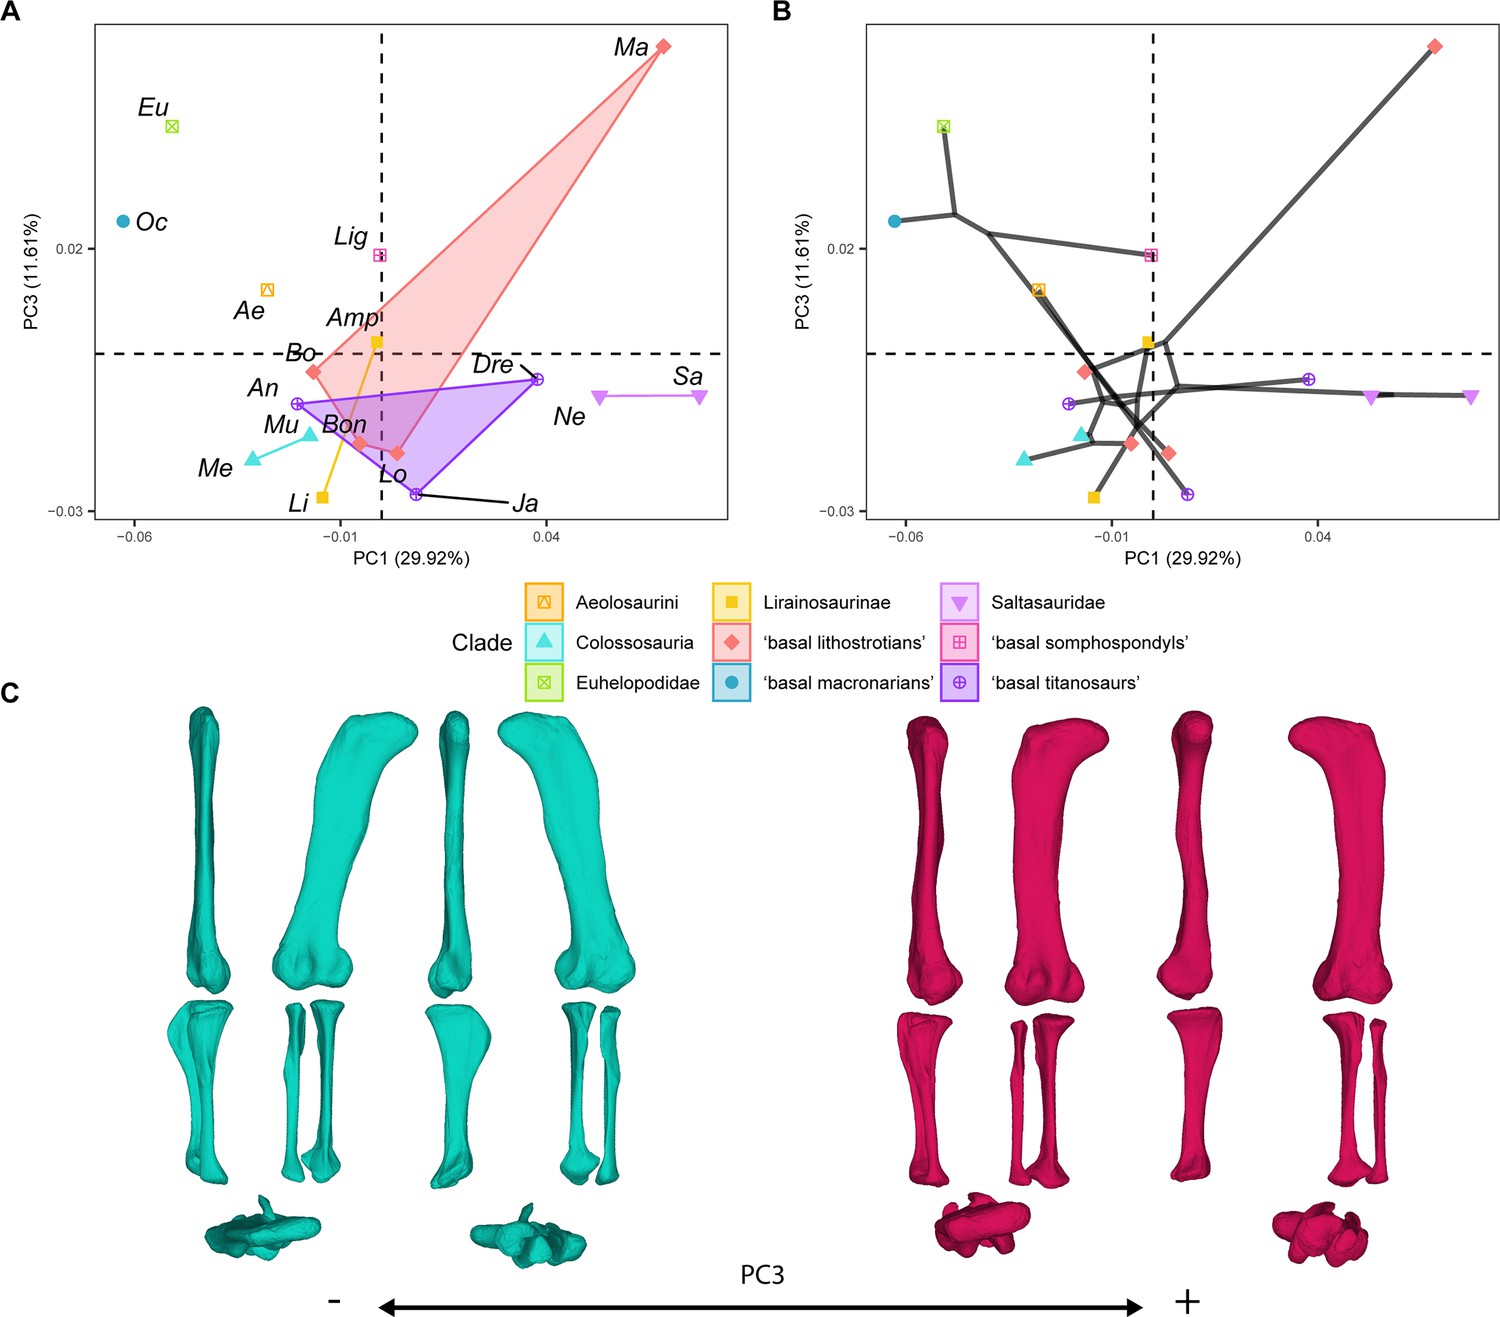
PCA results for the GPA aligned landmark and semilandmark curves of the hind limbs.
(A) PC1-PC3 biplot. (B) PC1-PC3 phylomorphospace with projected phylogenetic tree. (C) Representation of the shape change along PC3, blue are negative scores, red are positive scores. Percentage of variance of each PC in brackets under corresponding axis. Ae – Aeolosaurus, Amp – Ampelosaurus, An – Antarctosaurus, Bo – Bonatitan, Bon – Bonitasaura, Dre – Dreadnoughtus, Eu – Euhelopus, Ja – Jainosaurus, Li – Lirainosaurus, Lig – Ligabuesaurus, Lo – Lohuecotitan, Ma – Magyarosaurus, Me – Mendozasaurus, Mu – Muyelensaurus, Ne – Neuquensaurus, Sa – Saltasaurus.
Figure 5
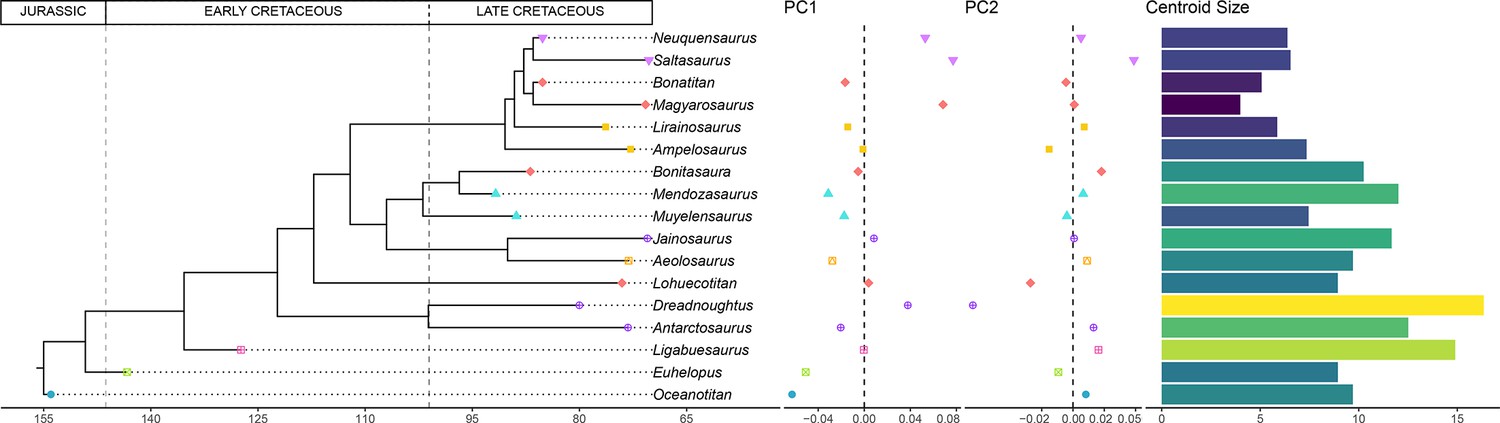
Time-calibrated supertree with PC1-PC2 results and hind limb centroid size for each sauropod.
Figure 6
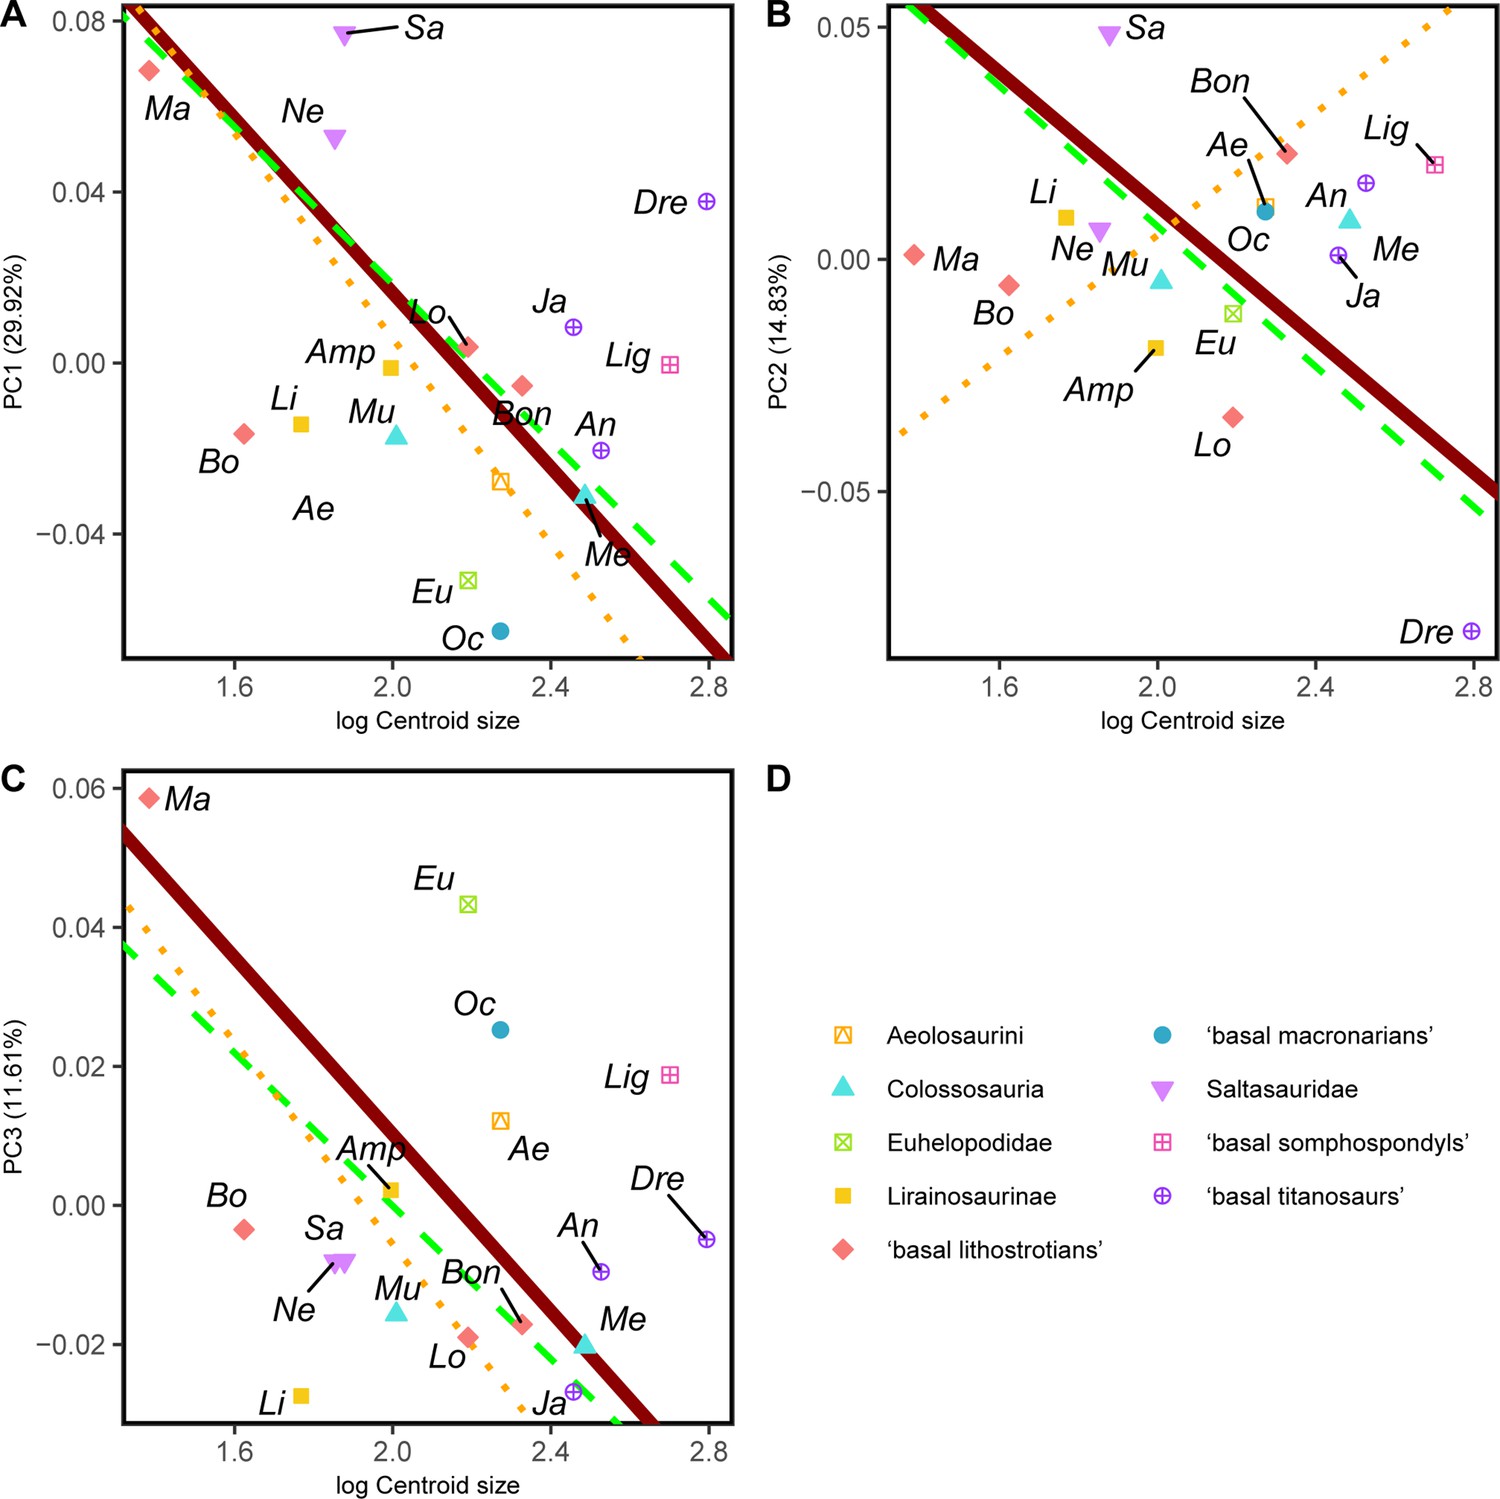
RMA results of the first three shape PCs against the logarithm of the hind limb centroid size.
(A) PC1 against log-Centroid size, all taxa RMA in dark red: intercept = 0.221, slope = –0.102, r2=0.105, p=0.204; Titanosauria only partial RMA in dashed green: intercept = 0.203, slope = –0.092, r2=0.118, p=0.229; Lithostrotia only partial RMA in dotted orange: intercept = 0.246, slope = –0.120, r2=0.319, p=0.07; (B) PC2 against log-Centroid size, all taxa RMA in dark red: intercept = 0.155, slope = –0.072, r2=0.054, p=0.371; Titanosauria only partial RMA in dashed green: intercept = 0.158, slope = –0.075, r2=0.117, p=0.232; Lithostrotia only partial RMA in dotted orange: intercept = –0.127, slope = 0.066, r2=0, p=0.952; (C) PC3 against log-Centroid size (Csize), all taxa RMA in dark red: intercept = 0.137, slope = –0.064, r2=0.055, p=0.363; Titanosauria only partial RMA in dashed green: intercept = 0.110, slope = –0.055, r2=0.236, p=0.078; Lithostrotia only partial RMA in dotted orange: intercept = 0.140, slope = –0.073, r2=0.313, p=0.074. Ae – Aeolosaurus, Amp – Ampelosaurus, An – Antarctosaurus, Bo – Bonatitan, Bon – Bonitasaura, Dre – Dreadnoughtus, Eu – Euhelopus, Ja – Jainosaurus, Li – Lirainosaurus, Lig – Ligabuesaurus, Lo – Lohuecotitan, Ma – Magyarosaurus, Me – Mendozasaurus, Mu – Muyelensaurus, Ne – Neuquensaurus, Sa – Saltasaurus.
Figure 7
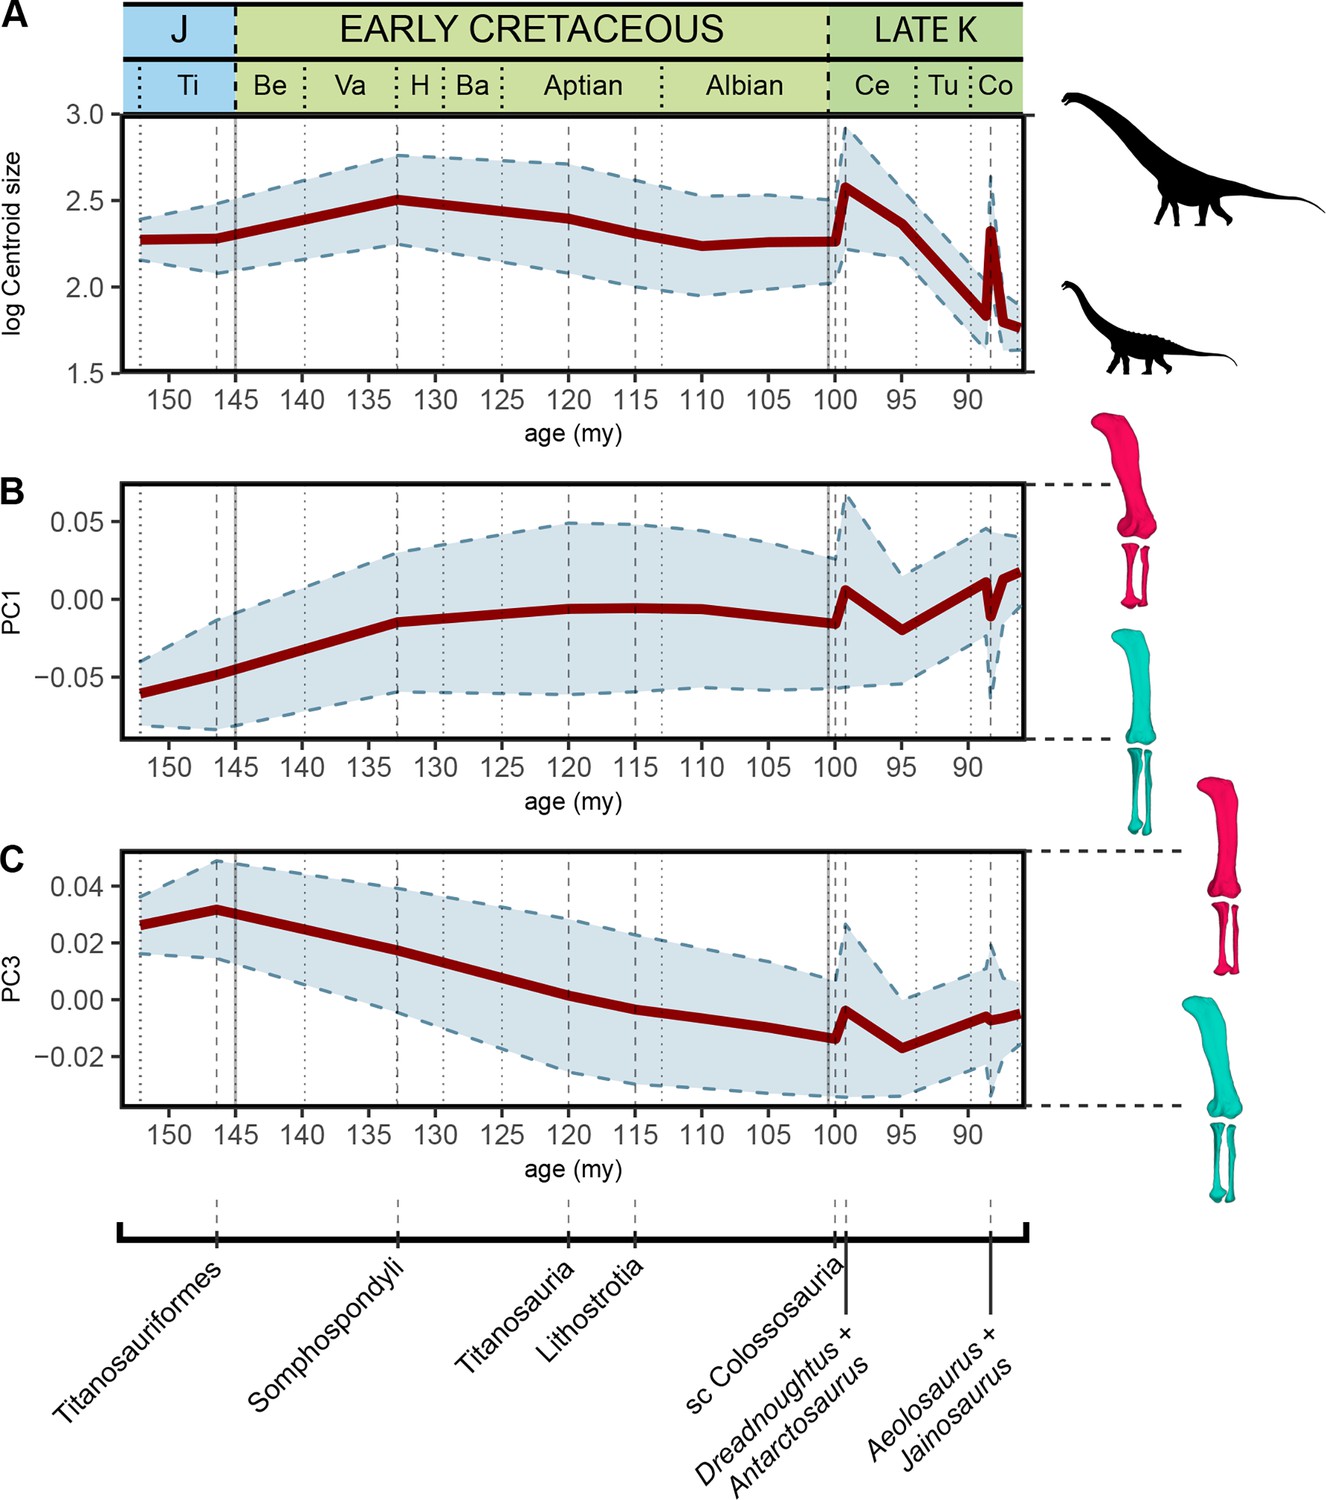
Evolution of log-transformed hind limb centroid size, shape PC1, and PC3 according to our sample and time-calibrated supertree topology.
Ba – Barremian, Be – Berriasian, Ce – Cenomanian, Co – Conacian, H – Hauterivian, J – Jurassic, Late-K – Late Cretaceous, Ti – Tithonian, Tu – Turonian, Va – Valanginian. my – million years from present, sc – subclade Colossosauria + Bonitasaura.
Appendix 1—figure 1
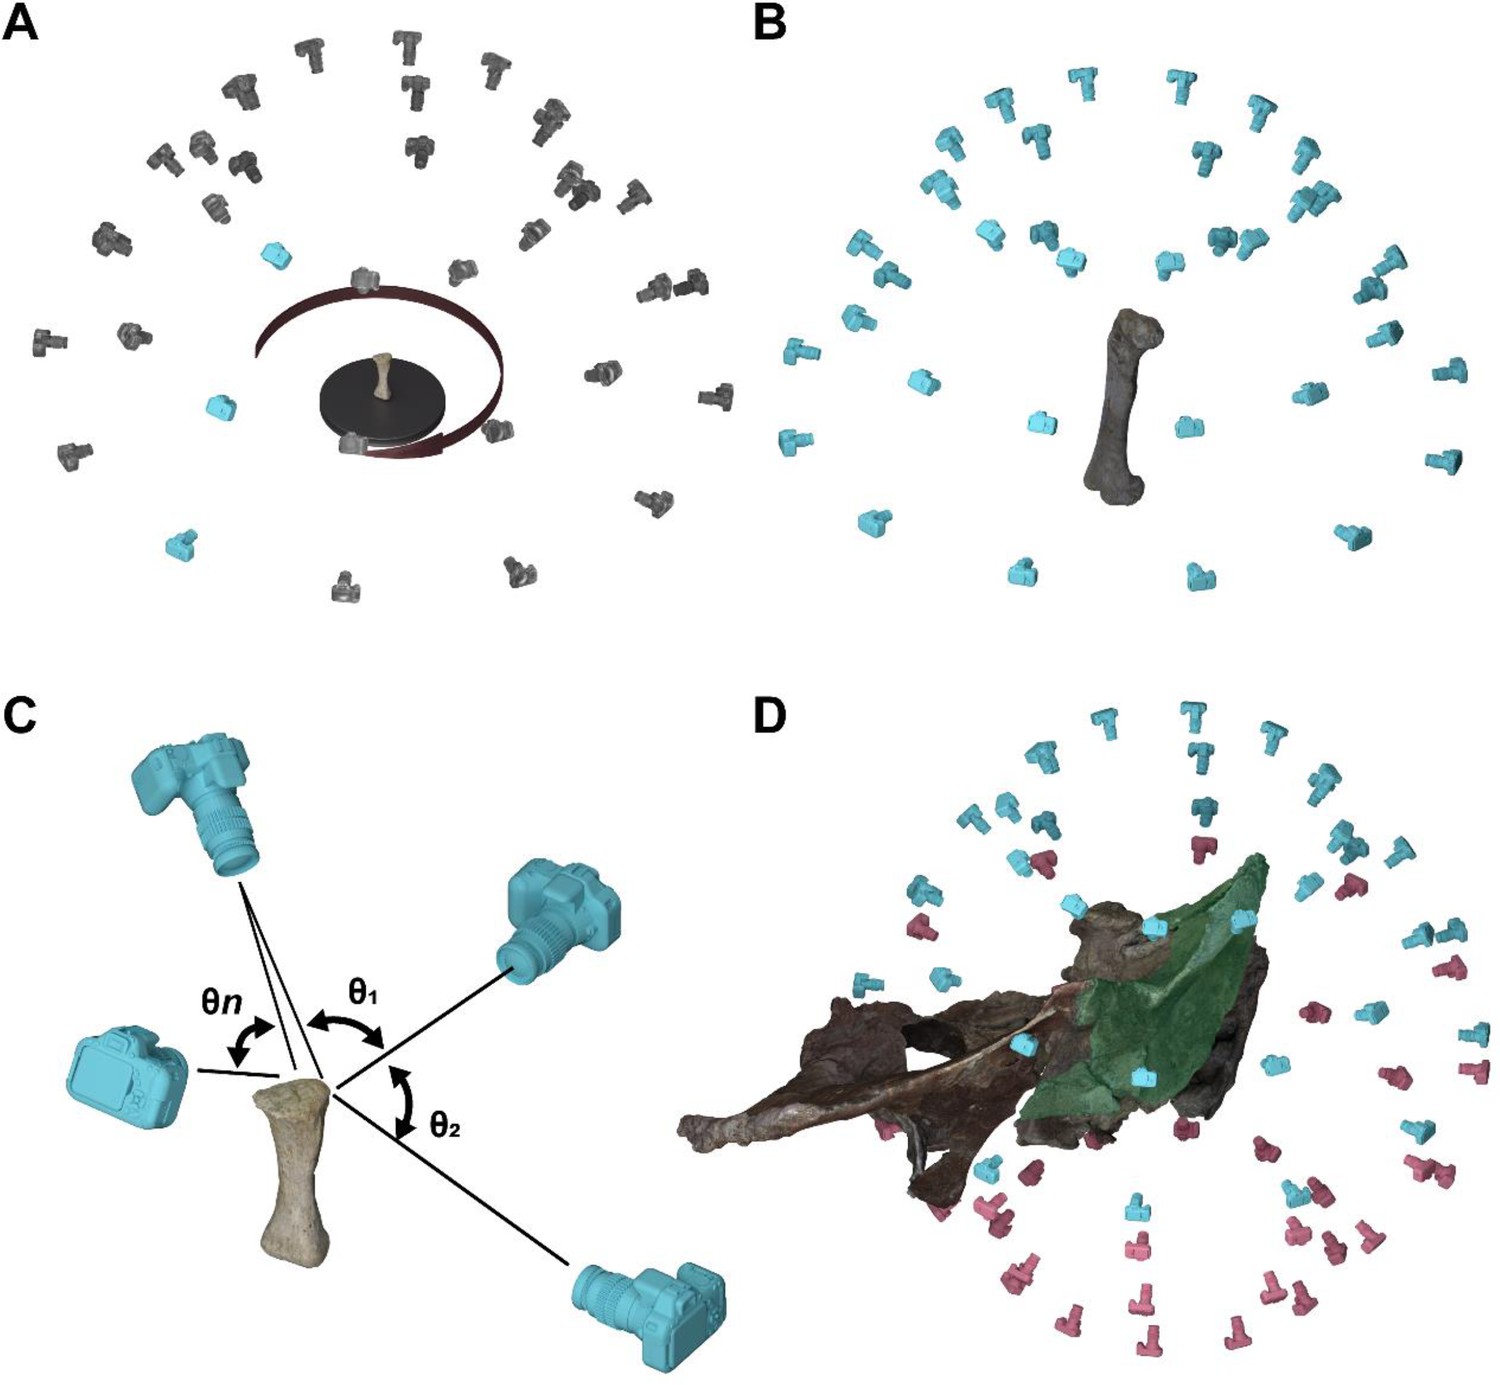
Stereophotogrammetry protocol.
(A) Turntable method of photographing the specimen for small specimens. (B) Turn-around method for larger specimens. (C) Angles between different pictures to recreate the pixel point-cloud in 3D space in the software. (D) Partial digitizing of separated fragments of the same specimen.
Appendix 1—figure 2
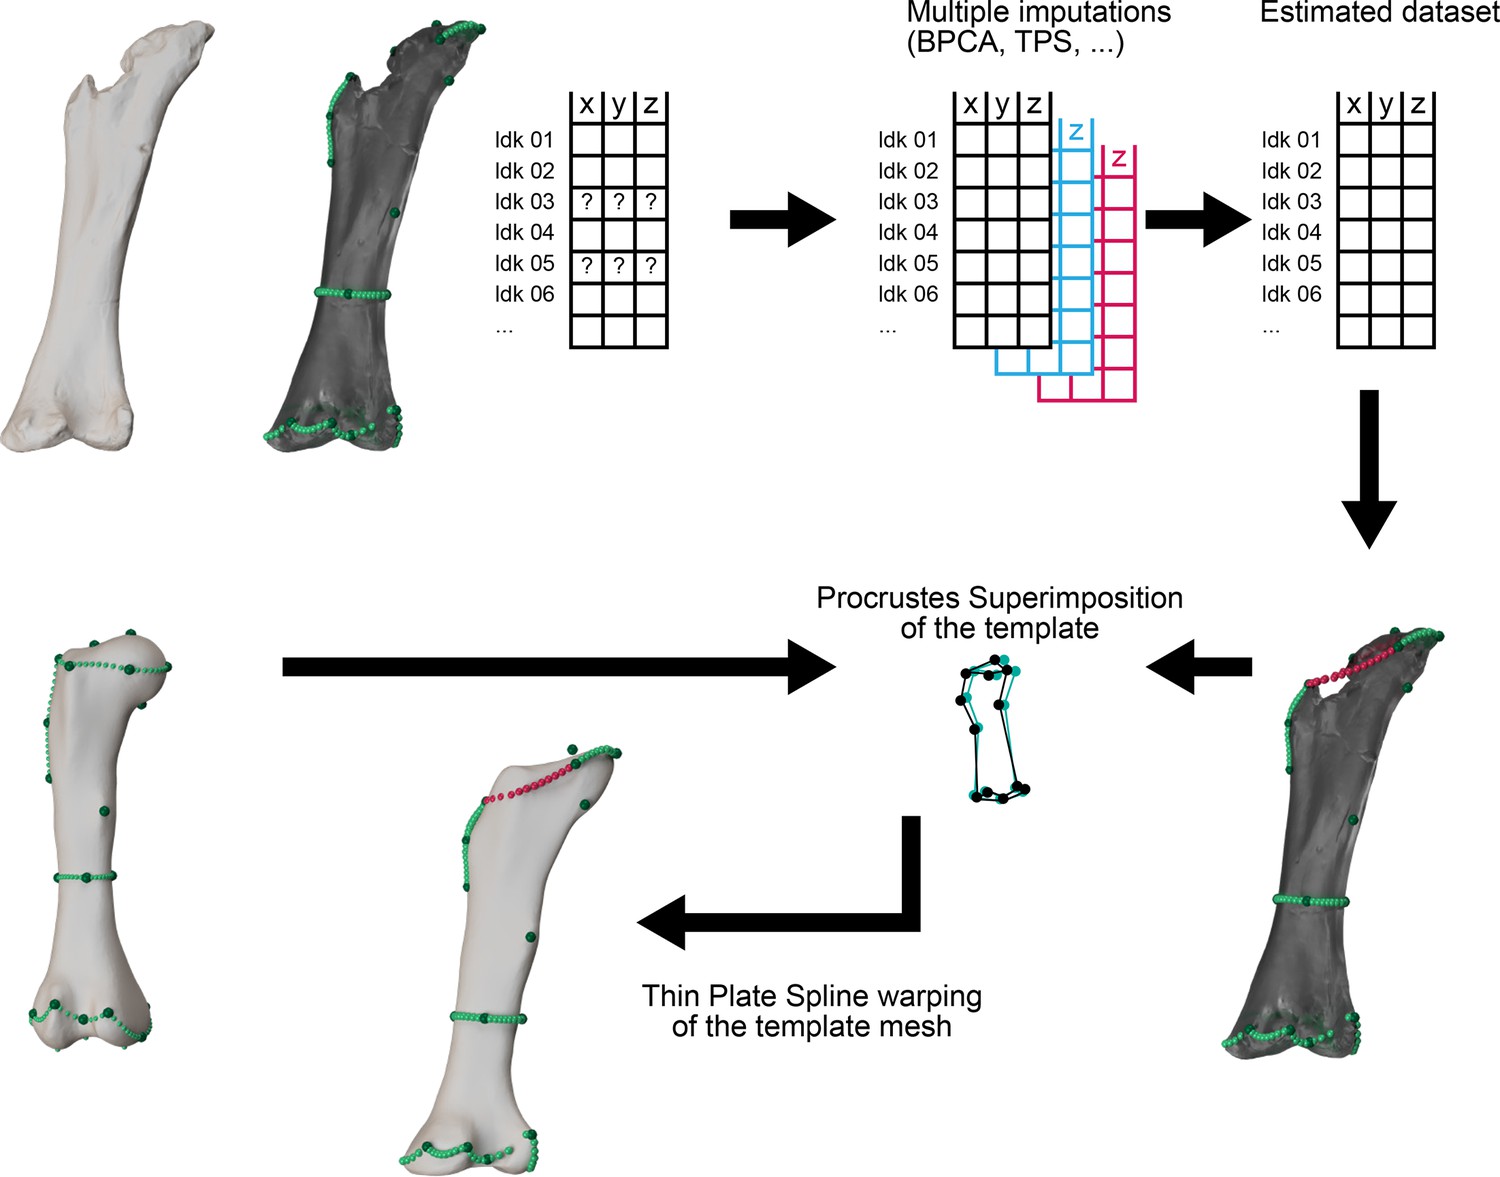
Separate specimen Statistical Virtual Restoration workflow as in Páramo et al., 2020.
(A) Initial 3D specimen reconstruction landmark sampling. (B) Multiple imputation methods (TPS in this case). (C) Procrustes superimposition of the template mesh and the estimated landmark configuration in order to obtain a reconstructed specimen 3D mesh for anatomical mount.
Appendix 1—figure 3
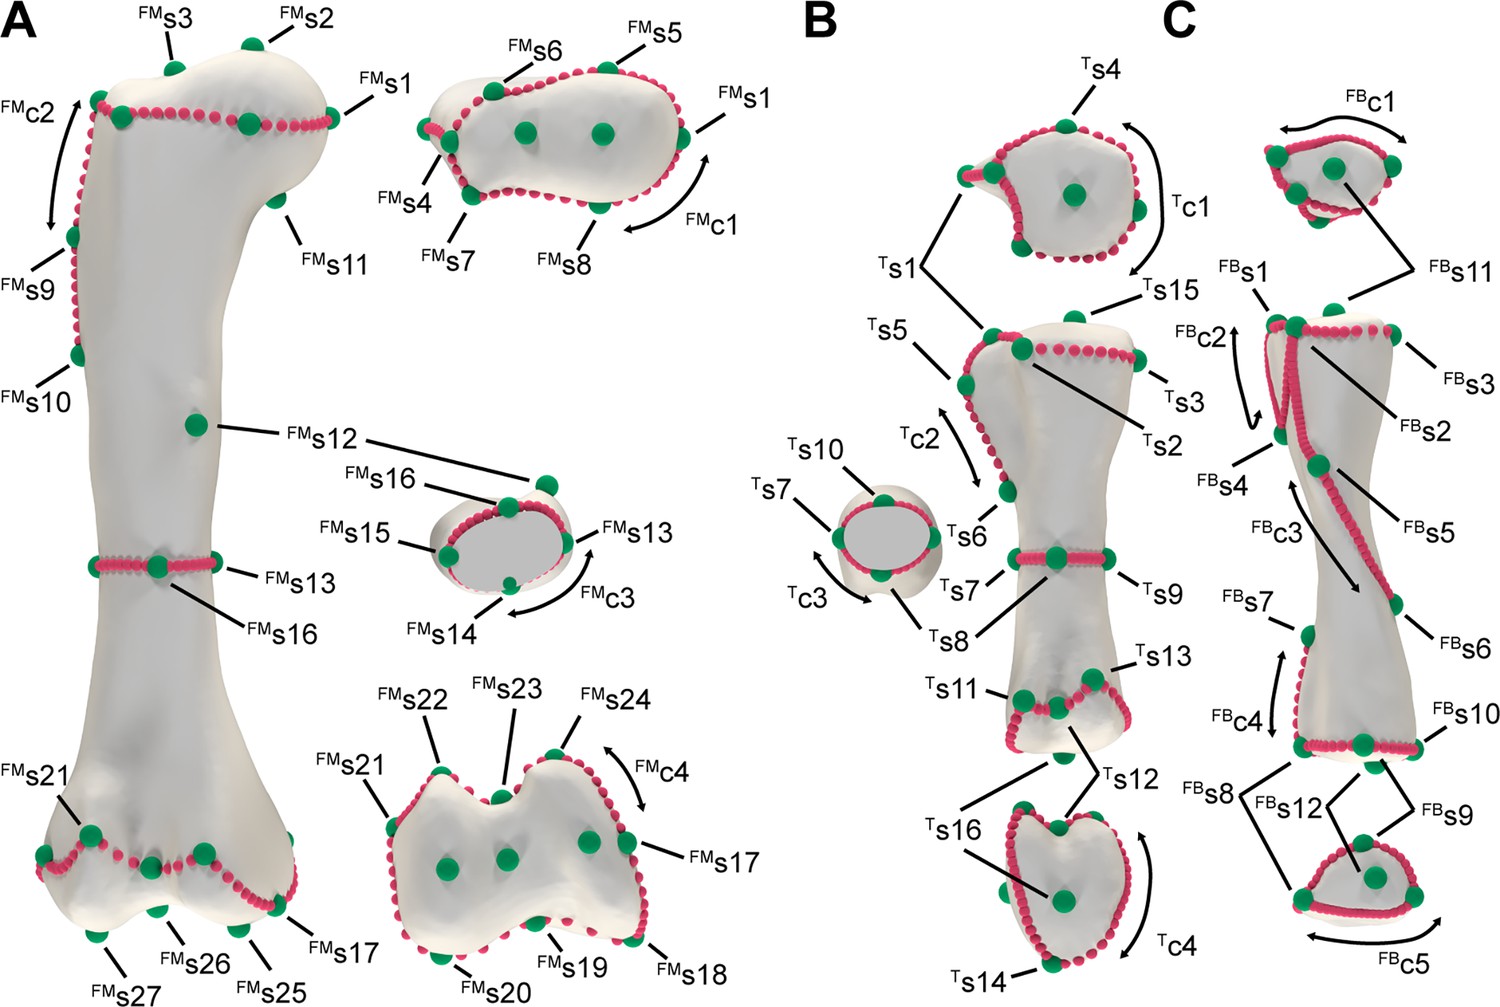
Landmarks and semilandmark curves used for the separated specimen prior landmark estimation during Statistical Virtual Restoration procedure.
(A) Femur. (B) Tibia (C). Fibula.
Appendix 1—figure 4
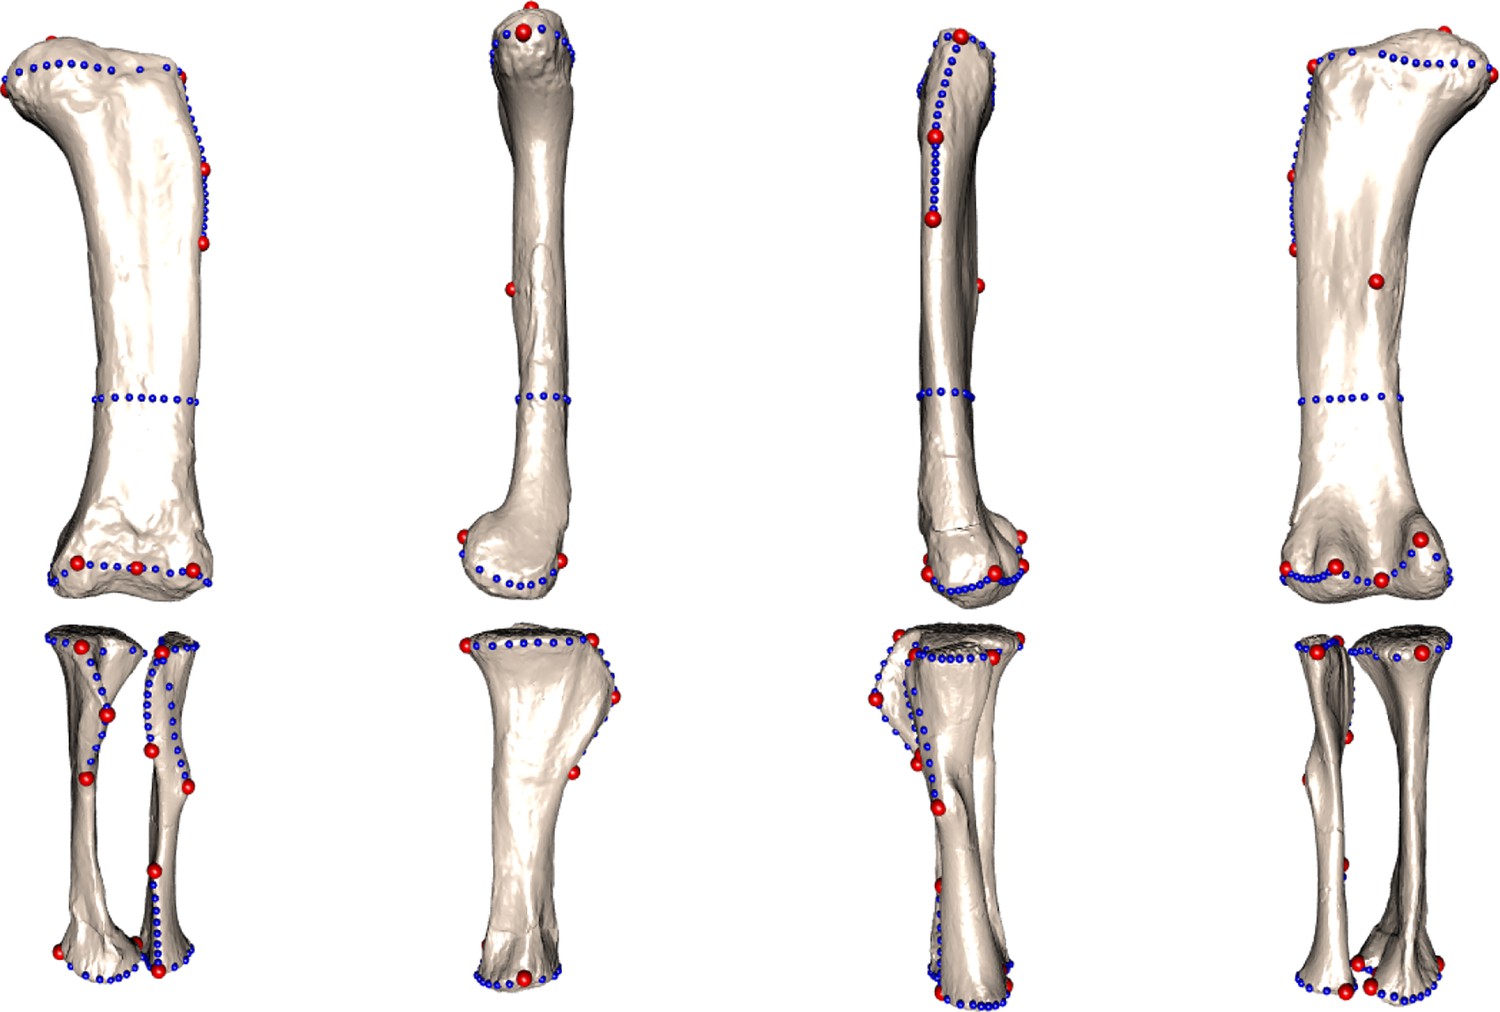
Landmark and semilandmark curves used in this study for the entire hind limb.
Anterior, medial, lateral, and posterior view.
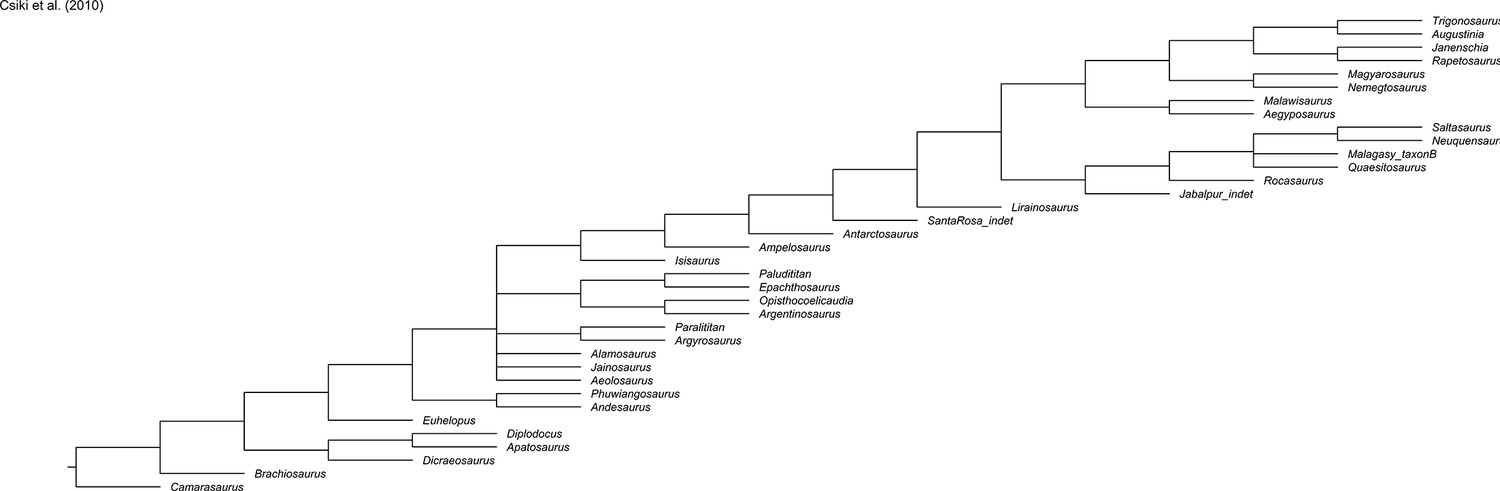
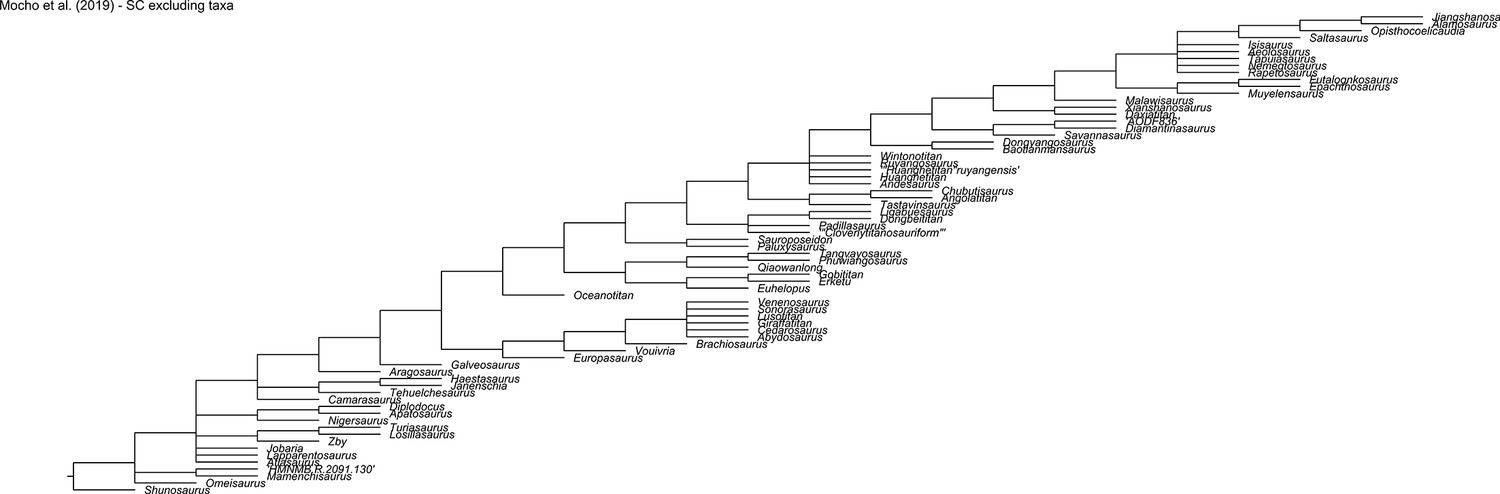
Appendix 1—figure 5
Phylogenetic trees used for MRP supertree estimation.
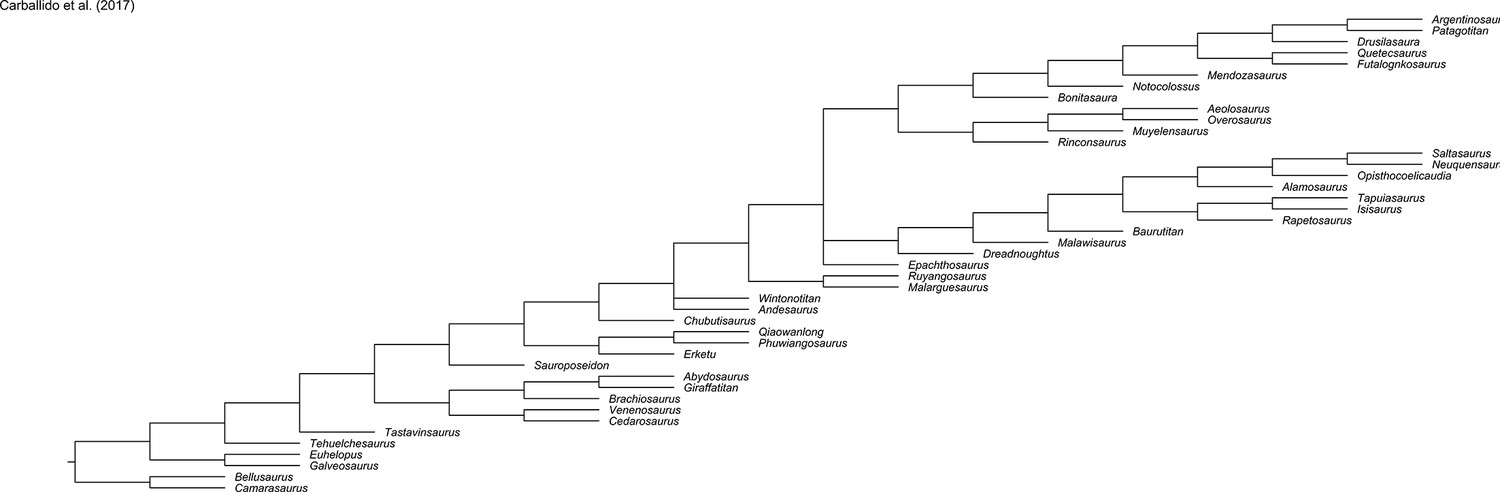
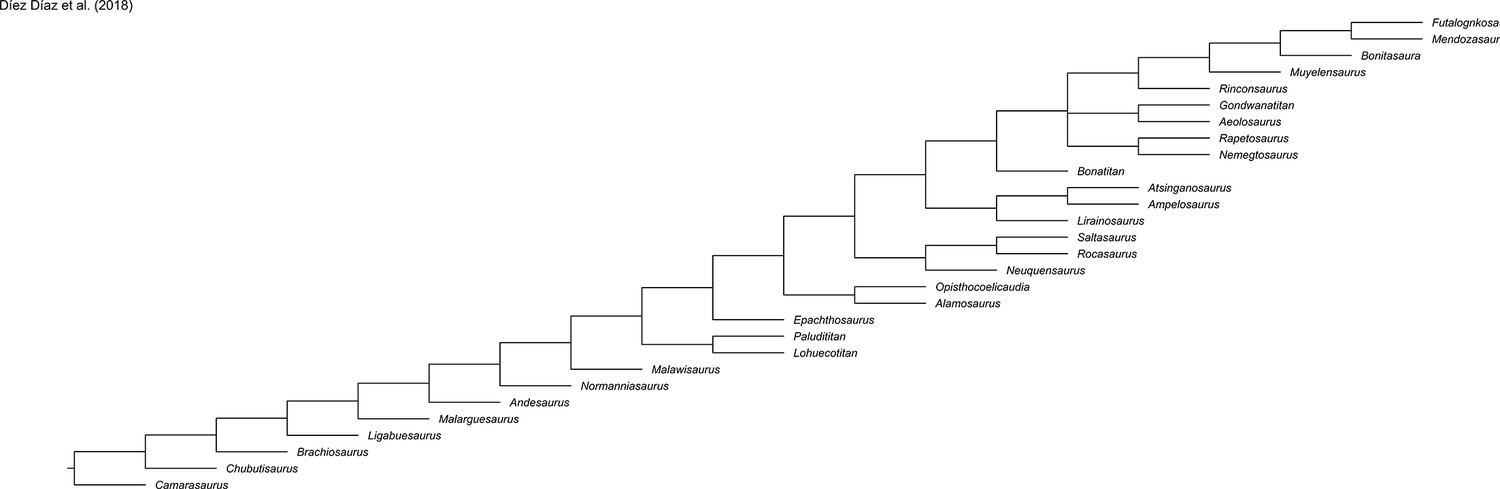
Appendix 1—figure 6
Phylogenetic trees used for MRP supertree estimation (continued).
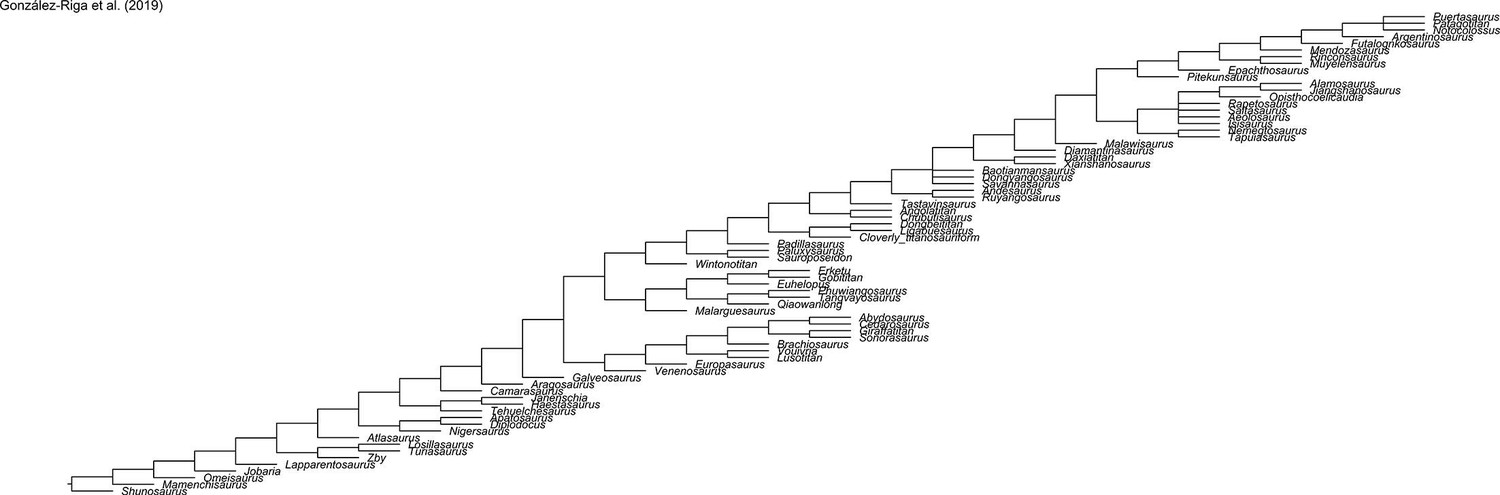
Appendix 1—figure 7
Phylogenetic trees used for MRP supertree estimation (continued).
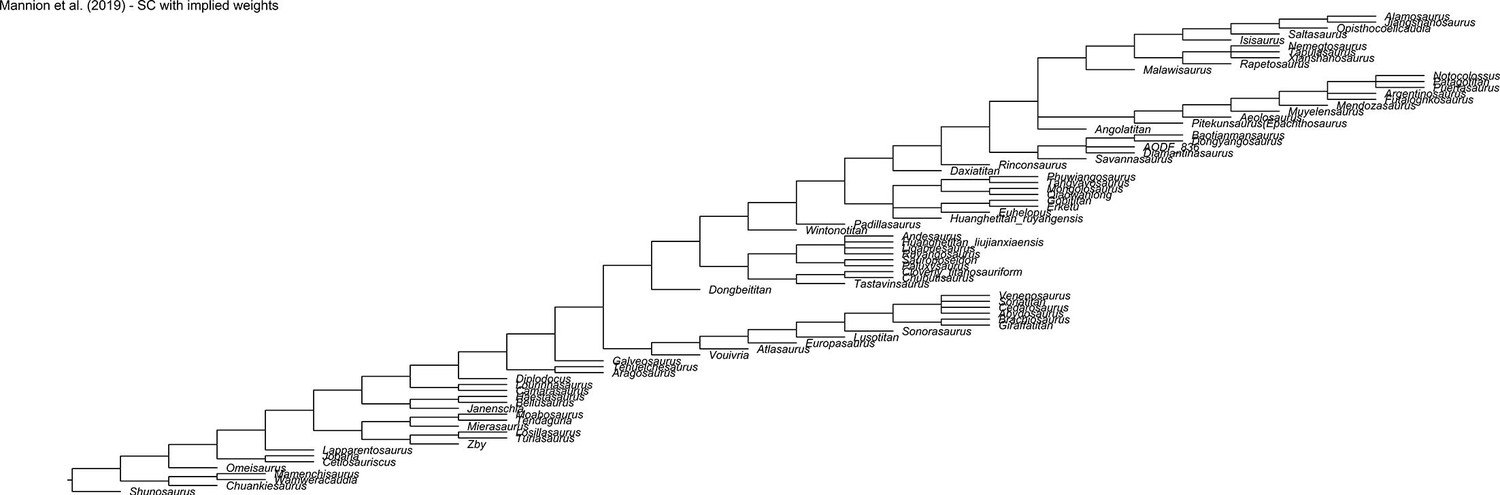
Appendix 1—figure 8
Phylogenetic trees used for MRP supertree estimation (continued).
Appendix 1—figure 9
Phylogenetic trees used for MRP supertree estimation (continued).
Appendix 1—figure 10
Phylogenetic trees used for MRP supertree estimation.
Appendix 1—figure 11
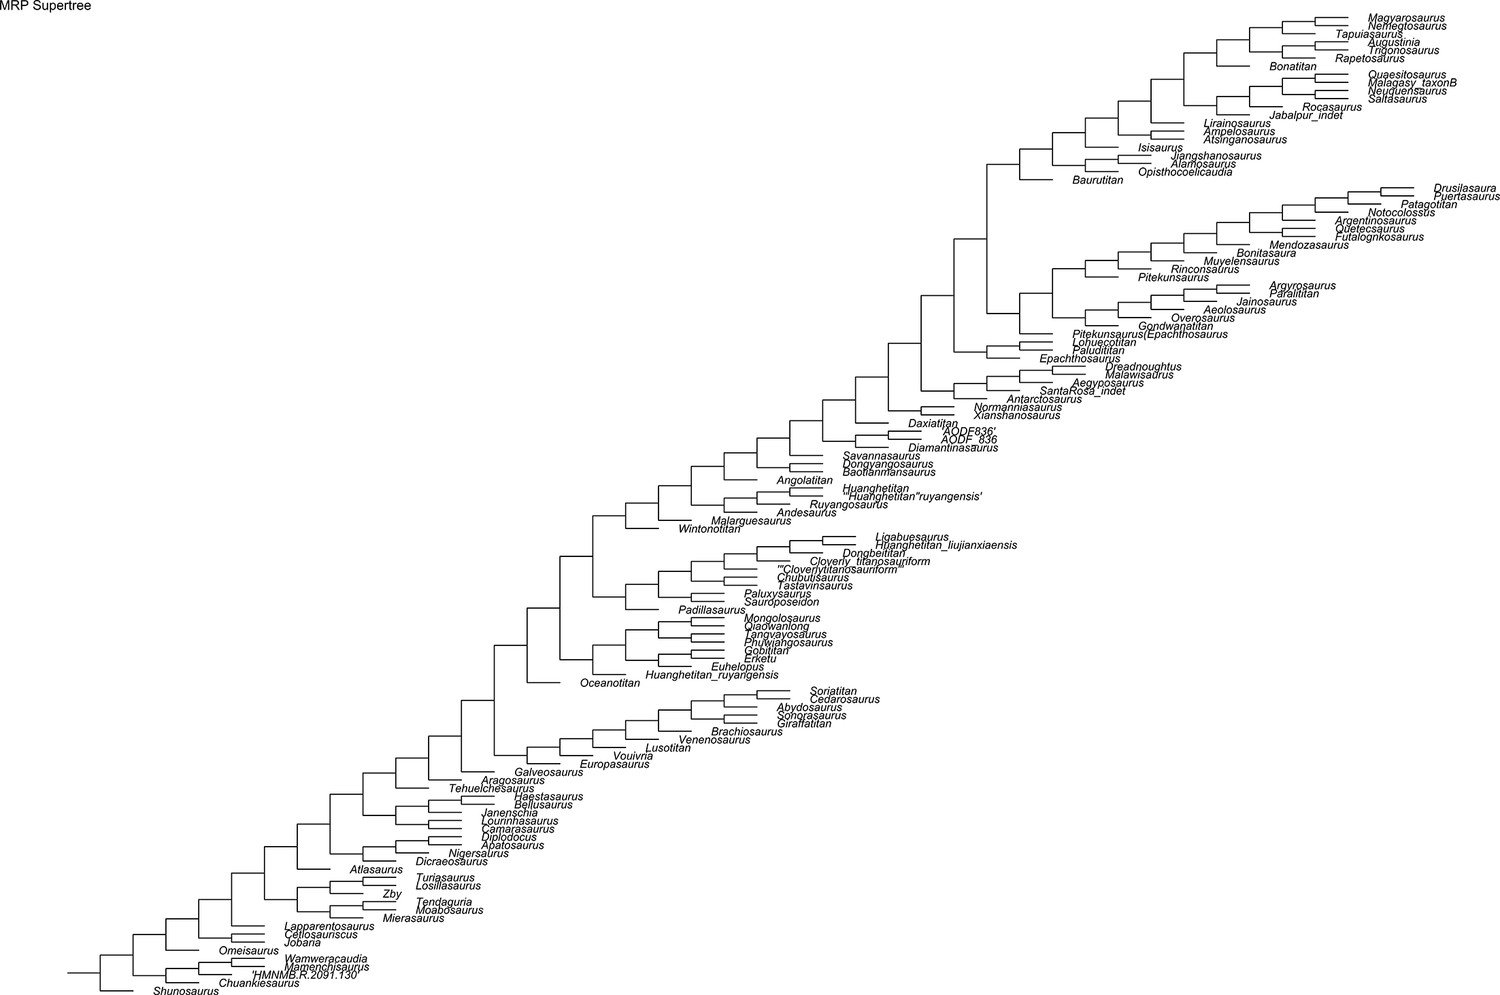
Resulting supertree.
Appendix 1—figure 12
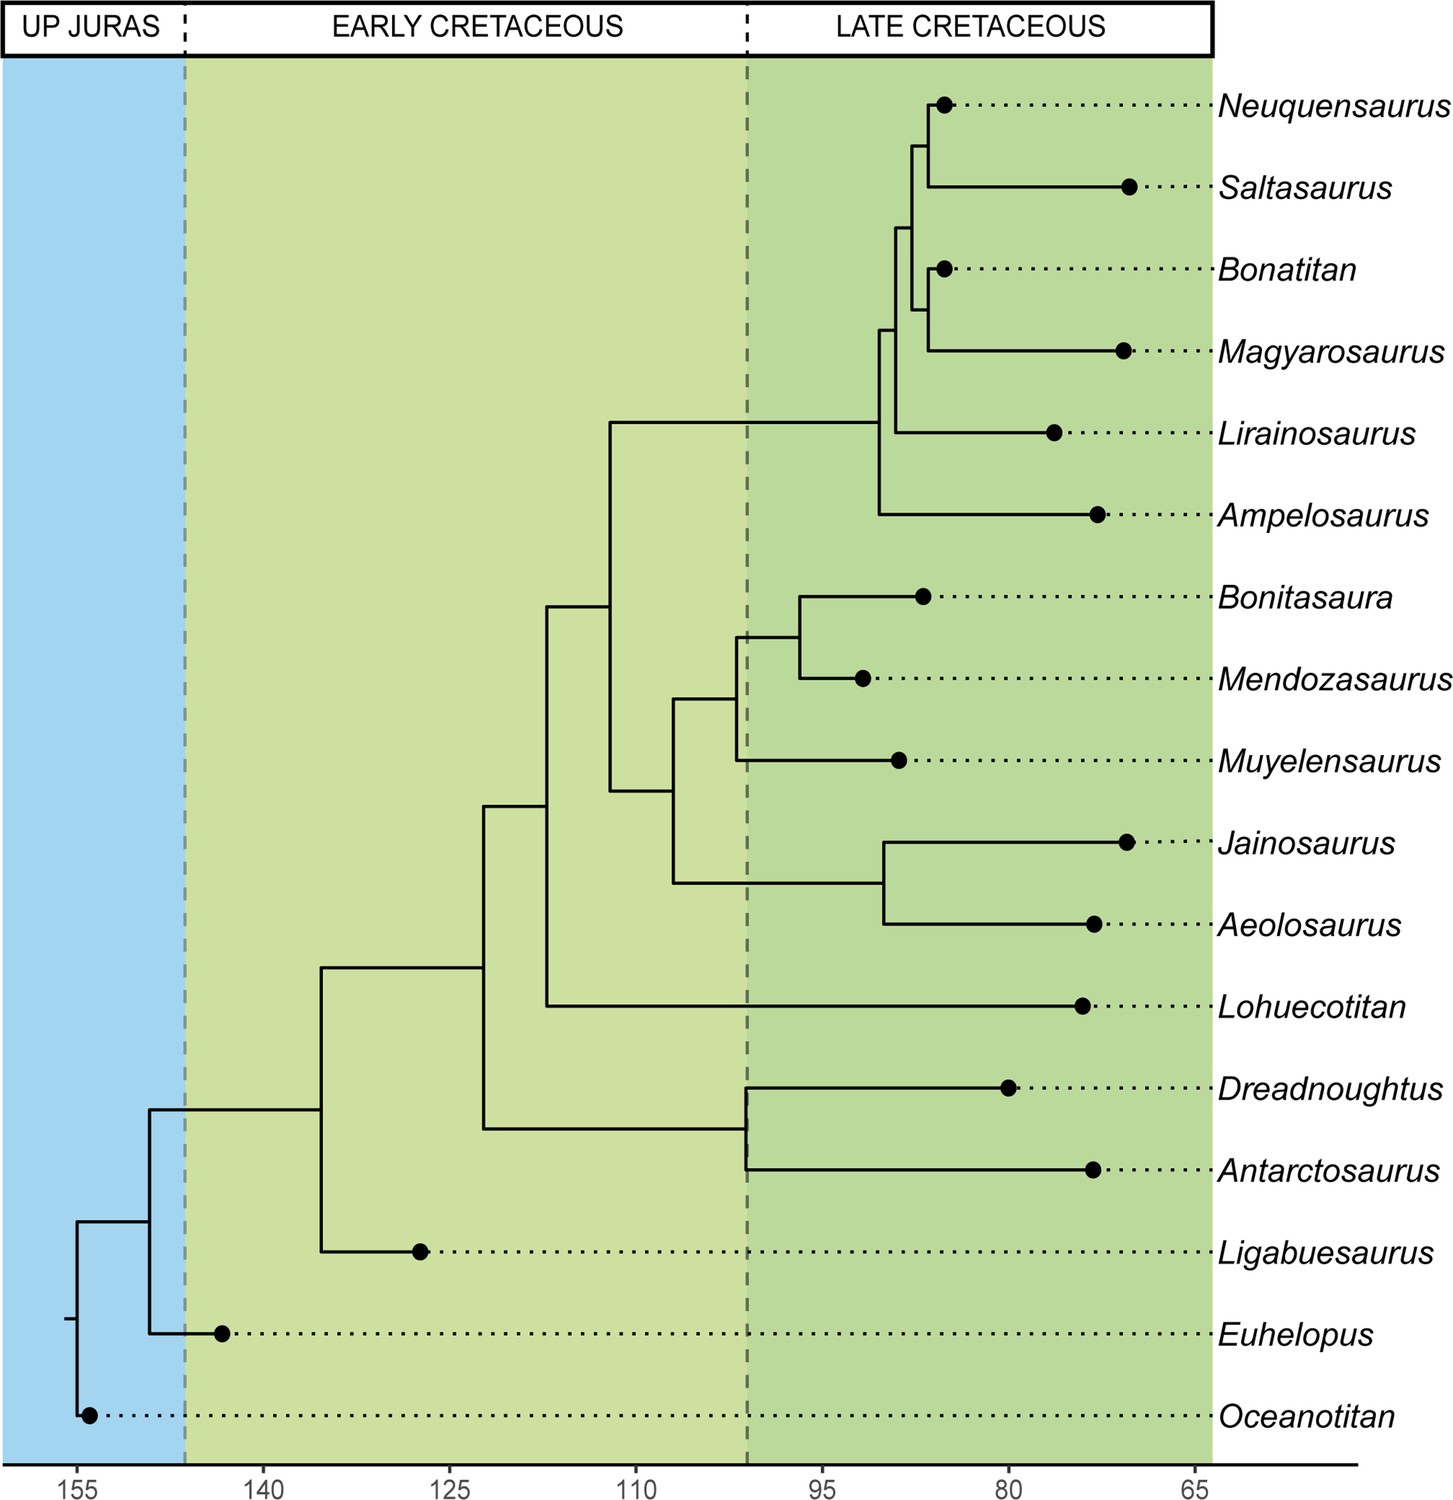
Time-calibrated supertree, tips limited to our current sample.
Appendix 2—figure 1
PCA results on the GPA aligned landmark and semilandmark curves of the hind limb.
(a) PC1-PC2 biplot. (b) PC1-PC2 phylomorphospace with projected phylogenetic tree. (c) Representation of the shape change along PC1, blue are negative scores, red are positive scores. Percentage of variance of each PC in brackets under corresponding axis. Ae – Aeolosaurus, Amp – Ampelosaurus, An – Antarctosaurus, Bo – Bonatitan, Bon – Bonitasaura, Dre – Dreadnoughuts, Eu – Euhelopus, Ja – Jainosaurus, Li – Lirainosaurus, Lig – Ligabuesaurus, Lo – Lohuecotitan, Ma – Magyarosaurus, Me – Mendozasaurus, Mu – Muyelensaurus, Ne – Neuquensaurus, Sa – Saltasaurus.
Appendix 2—figure 2
PCA results on the GPA aligned landmark and semilandmark curves of the hind limb.
(a) PC2-PC3 biplot. (b) PC2-PC3 phylomorphospace with projected phylogenetic tree. (c) Representation of the shape change along PC2, blue are negative scores, red are positive scores. Percentage of variance of each PC in brackets under corresponding axis. Ae – Aeolosaurus, Amp – Ampelosaurus, An – Antarctosaurus, Bo – Bonatitan, Bon – Bonitasaura, Dre – Dreadnoughuts, Eu – Euhelopus, Ja – Jainosaurus, Li – Lirainosaurus, Lig – Ligabuesaurus, Lo – Lohuecotitan, Ma – Magyarosaurus, Me – Mendozasaurus, Mu – Muyelensaurus, Ne – Neuquensaurus, Sa – Saltasaurus.
Appendix 2—figure 3
PCA results on the GPA aligned landmark and semilandmark curves of the hind limb.
(a) PC1-PC3 biplot. (b) PC1-PC3 phylomorphospace with projected phylogenetic tree. (c) Representation of the shape change along PC3, blue are negative scores, red are positive scores. Percentage of variance of each PC in brackets under corresponding axis. Ae – Aeolosaurus, Amp – Ampelosaurus, An – Antarctosaurus, Bo – Bonatitan, Bon – Bonitasaura, Dre – Dreadnoughtus, Eu – Euhelopus, Ja – Jainosaurus, Li – Lirainosaurus, Lig – Ligabuesaurus, Lo – Lohuecotitan, Ma – Magyarosaurus, Me – Mendozasaurus, Mu – Muyelensaurus, Ne – Neuquensaurus, Sa – Saltasaurus.
Appendix 2—figure 4
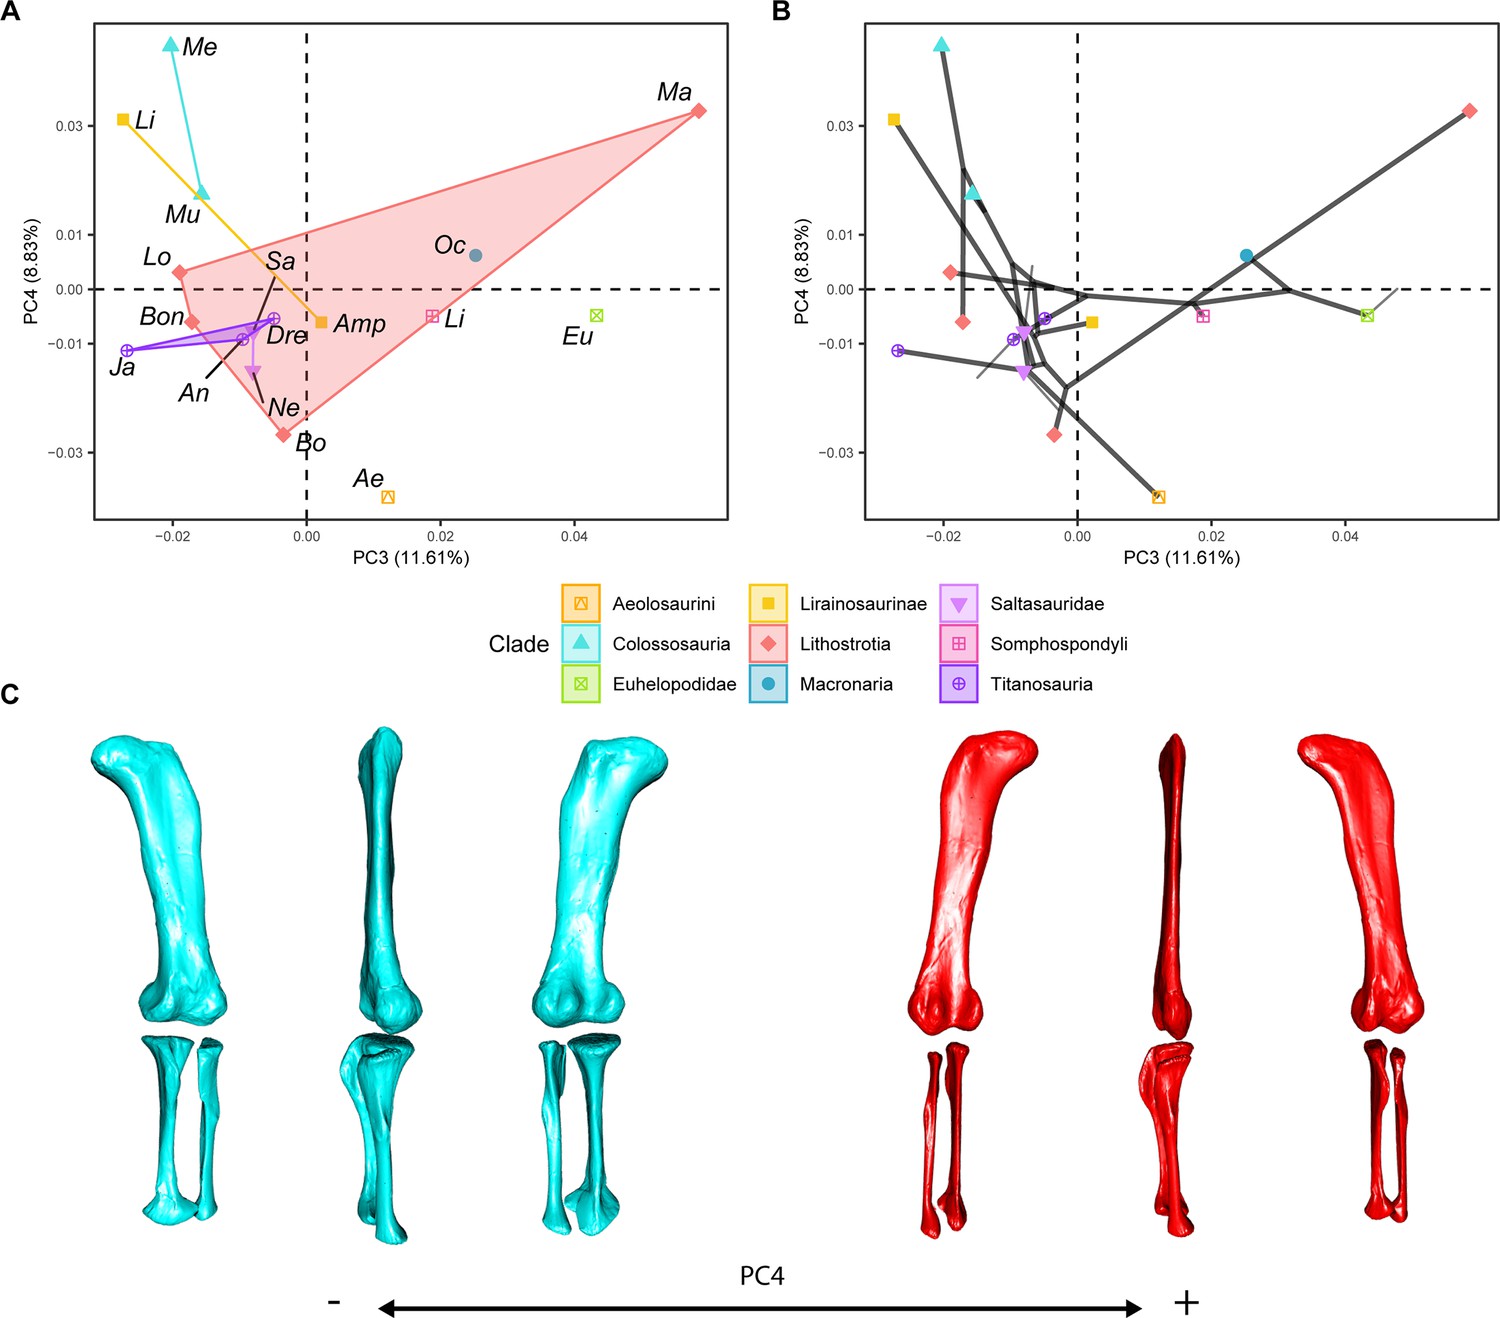
PCA results on the GPA aligned landmark and semilandmark curves of the hind limb.
(a) PC3-PC4 biplot. (b) PC3-PC4 phylomorphospace with projected phylogenetic tree. (c) Representation of the shape change along PC4, blue are negative scores, red are positive scores. Percentage of variance of each PC in brackets under corresponding axis. Ae – Aeolosaurus, Amp – Ampelosaurus, An – Antarctosaurus, Bo – Bonatitan, Bon – Bonitasaura, Dre – Dreadnoughuts, Eu – Euhelopus, Ja – Jainosaurus, Li – Lirainosaurus, Lig – Ligabuesaurus, Lo – Lohuecotitan, Ma – Magyarosaurus, Me – Mendozasaurus, Mu – Muyelensaurus, Ne – Neuquensaurus, Sa – Saltasaurus.
Appendix 2—figure 5
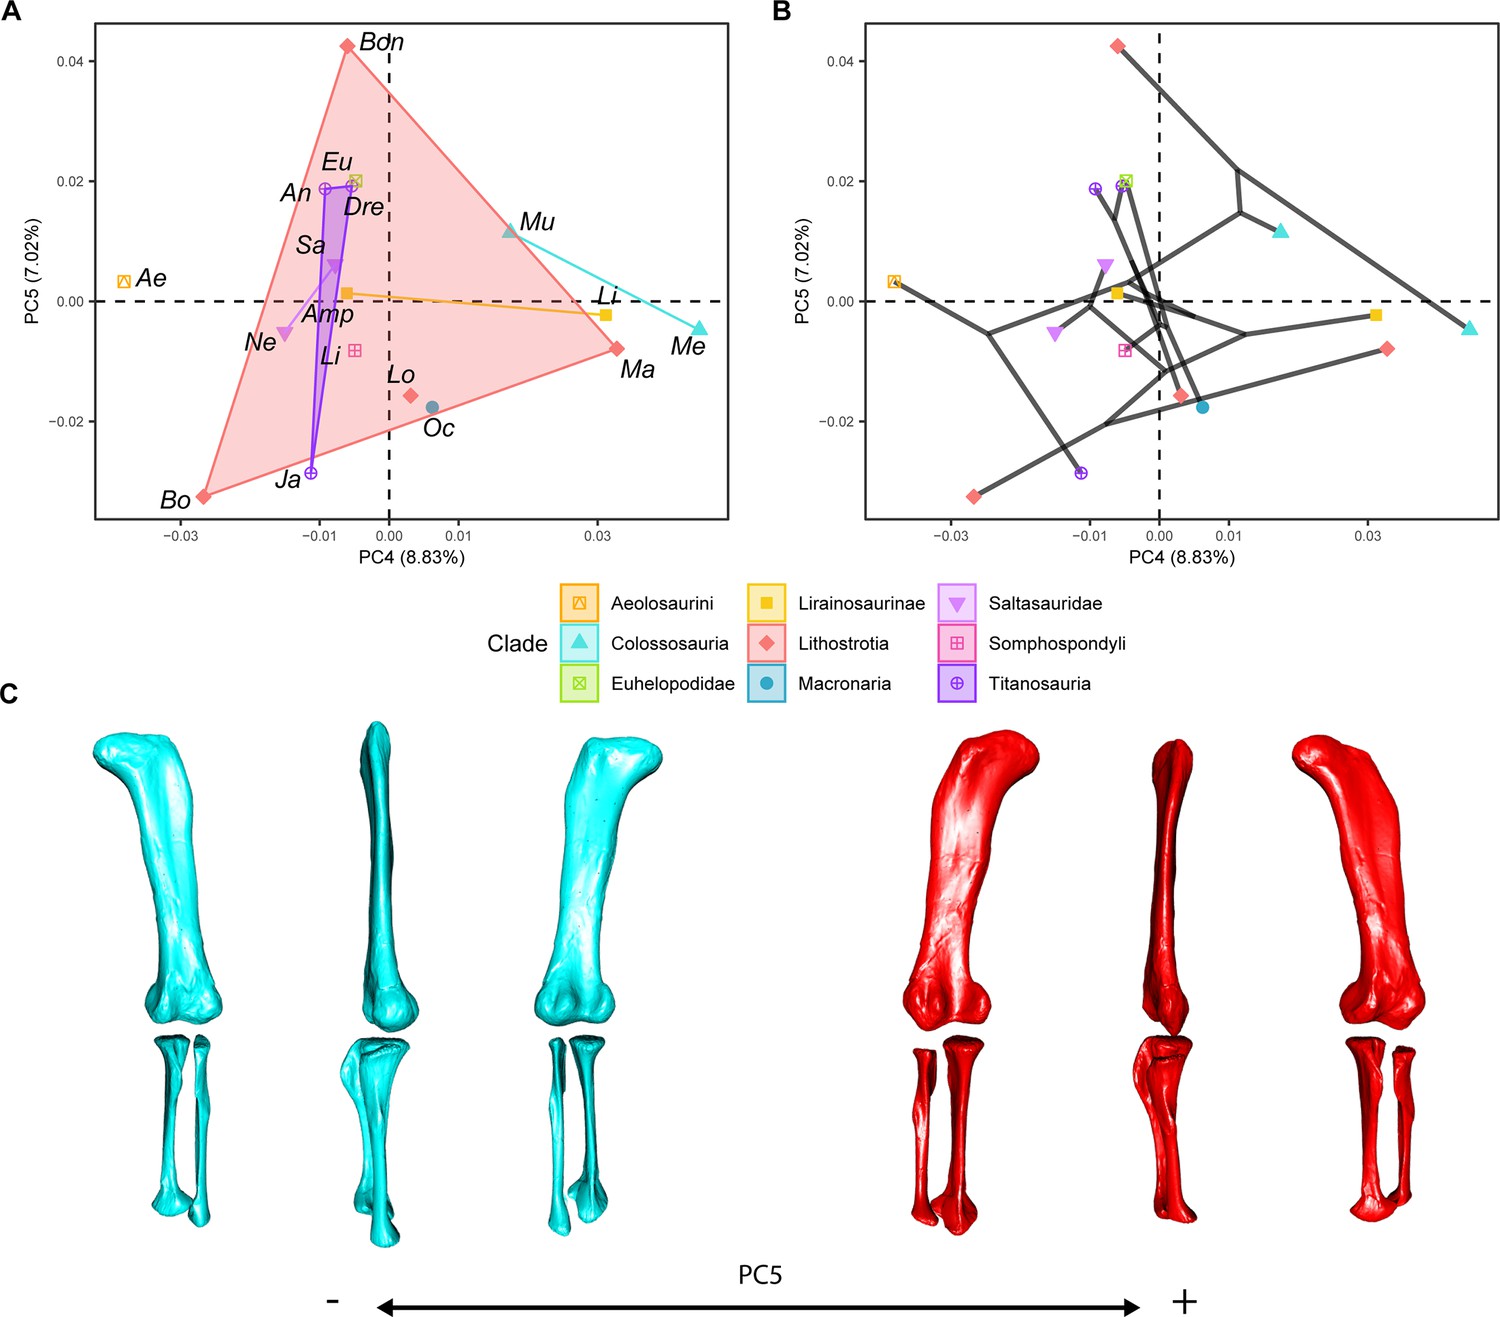
PCA results on the GPA aligned landmark and semilandmark curves of the hind limb.
(a) PC4-PC5 biplot. (b) PC4-PC5 phylomorphospace with projected phylogenetic tree. (c) Representation of the shape change along PC5, blue are negative scores, red are positive scores. Percentage of variance of each PC in brackets under corresponding axis. Ae – Aeolosaurus, Amp – Ampelosaurus, An – Antarctosaurus, Bo – Bonatitan, Bon – Bonitasaura, Dre – Dreadnoughtus, Eu – Euhelopus, Ja – Jainosaurus, Li – Lirainosaurus, Lig – Ligabuesaurus, Lo – Lohuecotitan, Ma – Magyarosaurus, Me – Mendozasaurus, Mu – Muyelensaurus, Ne – Neuquensaurus, Sa – Saltasaurus.
Appendix 2—figure 6
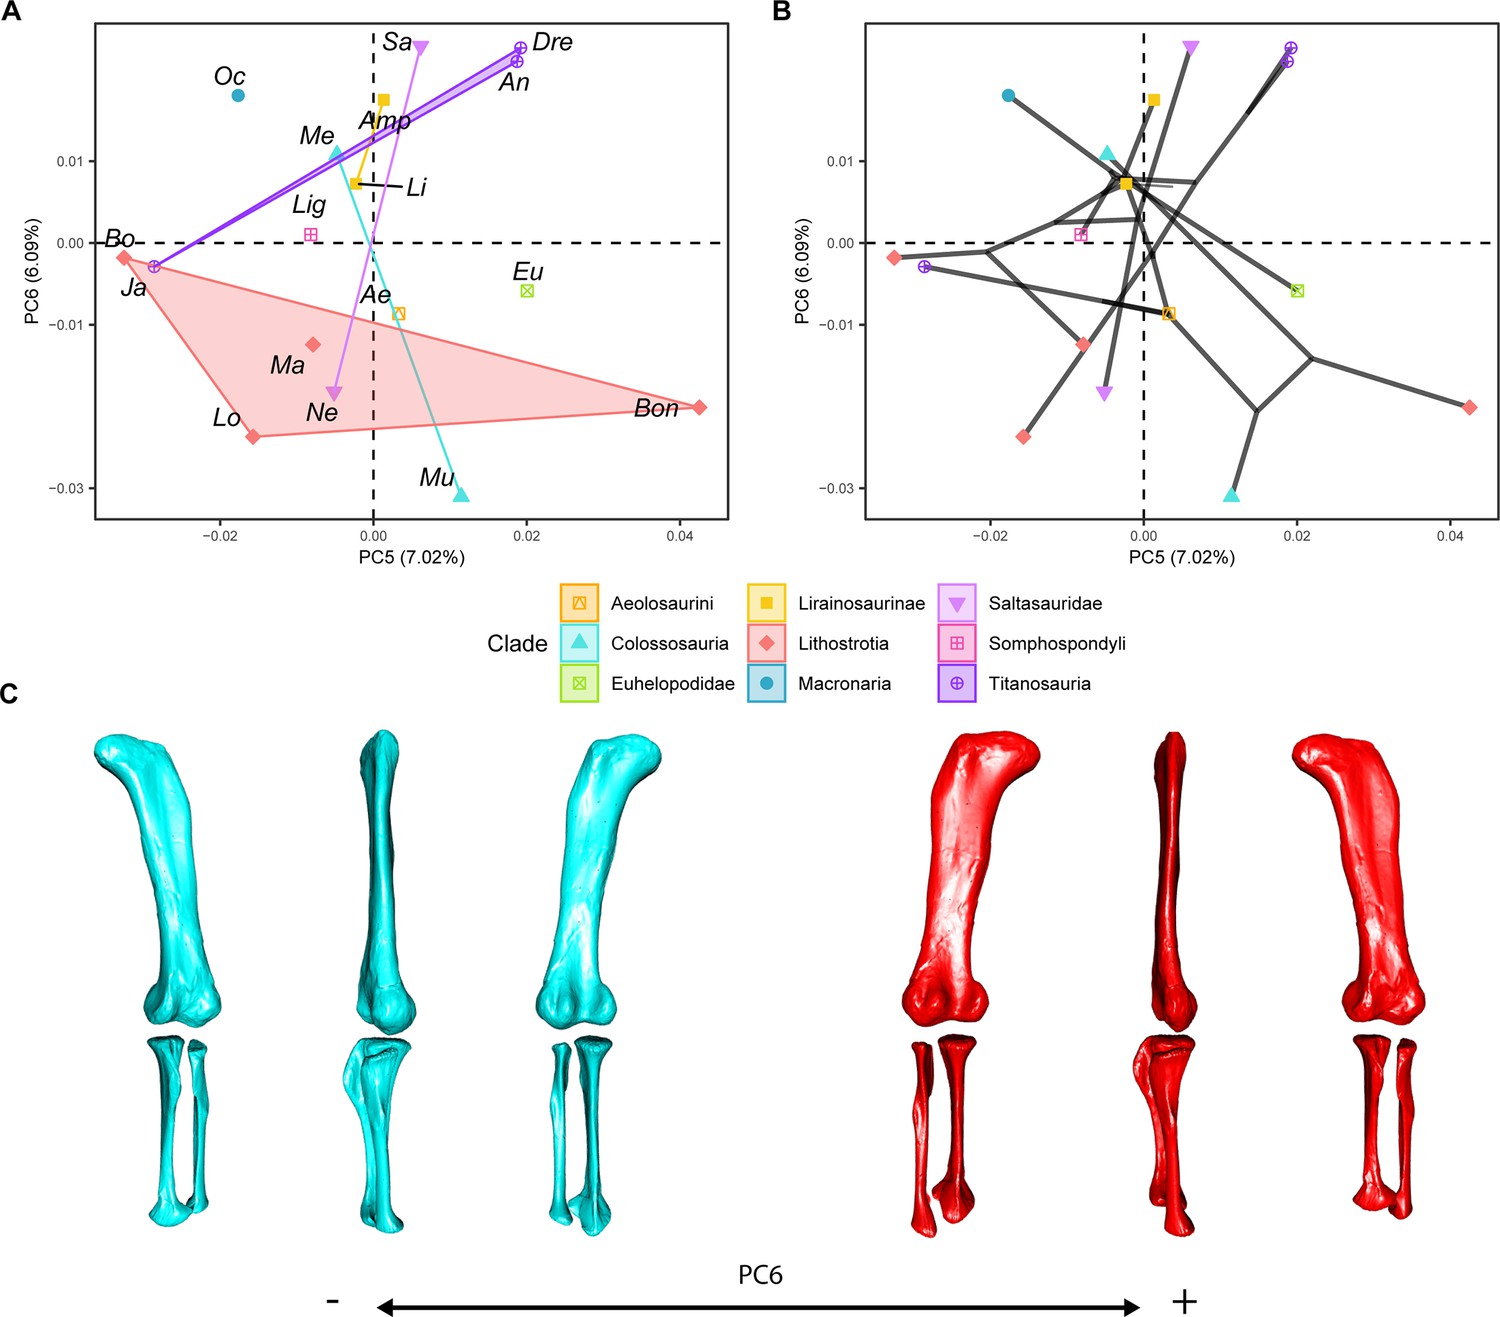
PCA results on the GPA aligned landmark and semilandmark curves of the hind limb.
(a) PC5-PC6 biplot. (b) PC5-PC6 phylomorphospace with projected phylogenetic tree. (c) Representation of the shape change along PC6, blue are negative scores, red are positive scores. Percentage of variance of each PC in brackets under corresponding axis. Ae – Aeolosaurus, Amp – Ampelosaurus, An – Antarctosaurus, Bo – Bonatitan, Bon – Bonitasaura, Dre – Dreadnoughuts, Eu – Euhelopus, Ja – Jainosaurus, Li – Lirainosaurus, Lig – Ligabuesaurus, Lo – Lohuecotitan, Ma – Magyarosaurus, Me – Mendozasaurus, Mu – Muyelensaurus, Ne – Neuquensaurus, Sa – Saltasaurus.
Appendix 2—figure 7
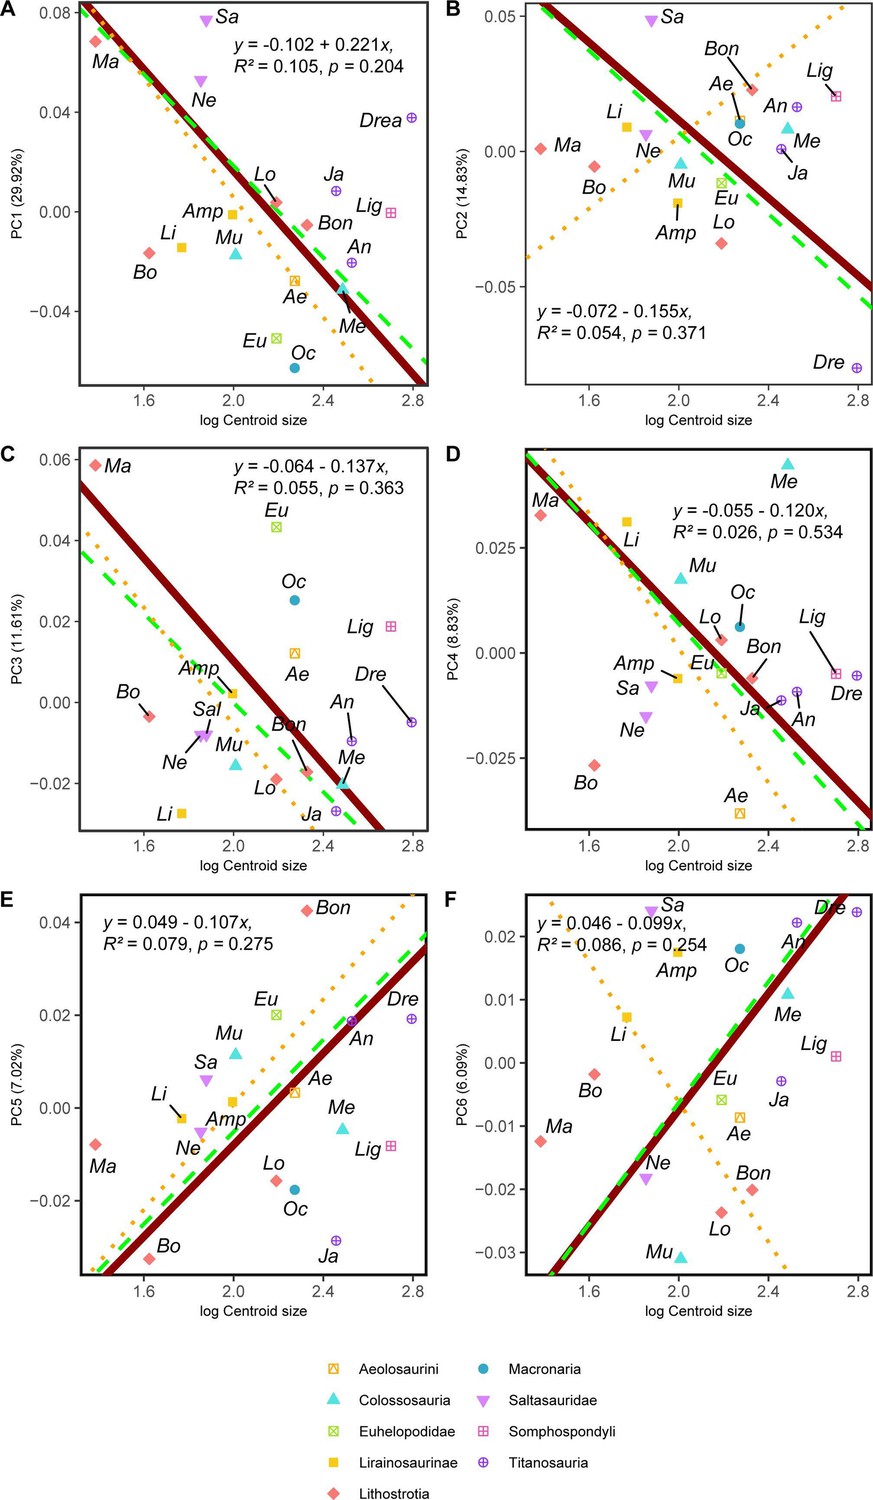
RMA results of the first three shape PCs against the logarithm of the hind limb centroid size.
(a) PC1 against log-Centroid size, all taxa RMA in dark red: intercept = 0.221, slope = –0.102, r2=0.105, p=0.204; Titanosauria only partial RMA in dashed green: intercept = 0.203, slope = –0.092, r2=0.118, p=0.229; Lithostrotia only partial RMA in dotted orange: intercept = 0.246, slope = –0.120, r2=0.319, p=0.07; (b) PC2 against log-Centroid size, all taxa RMA in dark red: intercept = 0.155, slope = –0.072, r2=0.054, p=0.371; Titanosauria only partial RMA in dashed green: intercept = 0.158, slope = –0.075, r2=0.117, p=0.232; Lithostrotia only partial RMA in dotted orange: intercept = –0.127, slope = 0.066, r2=0, p=0.952; (c) PC3 against log-Centroid size (Csize), all taxa RMA in dark red: intercept = 0.137, slope = –0.064, r2=0.055, p=0.363; Titanosauria only partial RMA in dashed green: intercept = 0.110, slope = –0.055, r2=0.236, p=0.078; Lithostrotia only partial RMA in dotted orange: intercept = 0.140, slope = –0.073, r2=0.313, p=0.074. (d) PC4 against log-Centroid size (Csize), all taxa RMA in dark red: intercept = 0.120, slope = –0.055, r2=0.026, p=0.534; Titanosauria only partial RMA in dashed green: intercept = 0.126, slope = –0.060, r2=0.025, p=0.592; Lithostrotia only partial RMA in dotted orange: intercept = 0.161, slope = –0.080, r2=0.002, p=0.903. (e) PC5 against log-Centroid size (Csize), all taxa RMA in dark red: intercept = –0.107, slope = 0.049, r2=0.079, p=0.275; Titanosauria only partial RMA in dashed green: intercept = –0.104, slope = –0.050, r2=0.1506, p=0.171; Lithostrotia only partial RMA in dotted orange: intercept = –0.113, slope = 0.057, r2=0.204, p=0.163. (f) PC6 against log-Centroid size (Csize), all taxa RMA in dark red: intercept = –0.100, slope = 0.046, r2=0.086, p=0.254; Titanosauria only partial RMA in dashed green: intercept = –0.102, slope = –0.048, r2=0.089, p=0.302; Lithostrotia only partial RMA in dotted orange: intercept = 0.105, slope = –0.055, r2=0.003, p=0.871. Ae – Aeolosaurus, Amp – Ampelosaurus, An – Antarctosaurus, Bo – Bonatitan, Bon – Bonitasaura, Dre – Dreadnoughtus, Eu – Euhelopus, Ja – Jainosaurus, Li – Lirainosaurus, Lig – Ligabuesaurus, Lo – Lohuecotitan, Ma – Magyarosaurus, Me – Mendozasaurus, Mu – Muyelensaurus, Ne – Neuquensaurus, Oc – Oceanotitan, Sa – Saltasaurus.
Appendix 2—figure 8
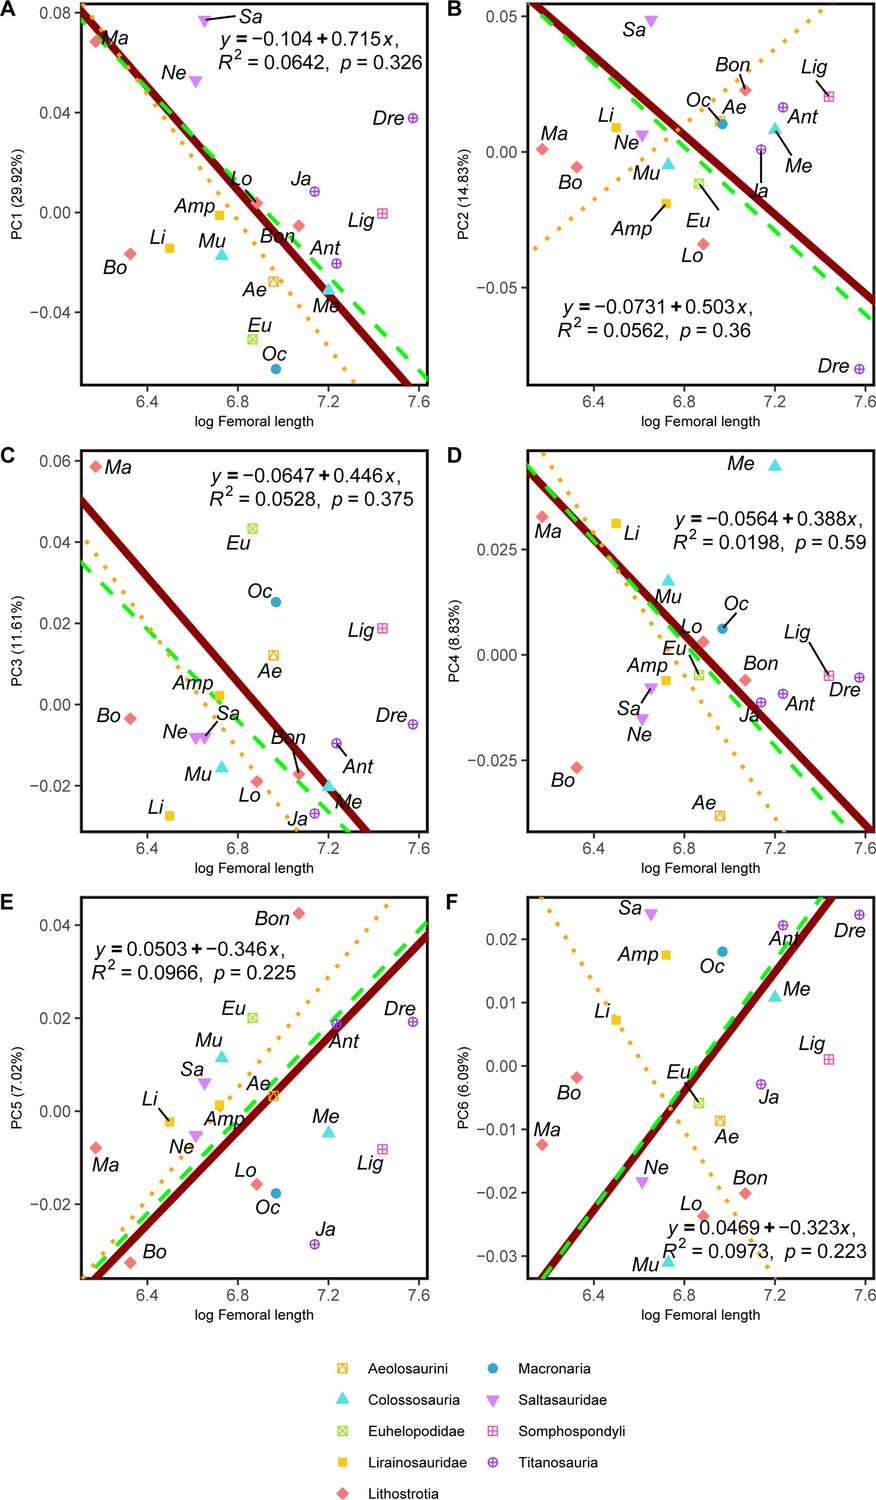
RMA results of the first three shape PCs against the logarithm of the hind limb femoral length in mm.
(a) PC1 against log-femoral length, all taxa RMA in dark red: intercept = 0.715, slope = –0.104, r2=0.064, p=0.326; Titanosauria only partial RMA in dashed green: intercept = 0.651, slope = –0.094, r2=0.177, p=0.337; Lithostrotia only partial RMA in dotted orange: intercept = 0.856, slope = –0.126, r2=0.252, p=0.115; (b) PC2 against log-Femoral length, all taxa RMA in dark red: intercept = 0.503, slope = –0.073, r2=0.056, p=0.36; Titanosauria only partial RMA in dashed green: intercept = 0.526, slope = –0.077, r2=0.125, p=0.215; Lithostrotia only partial RMA in dotted orange: intercept = –0.461, slope = 0.069, r2=0.006, p=0.823; (c) PC3 against log-Femoral length, all taxa RMA in dark red: intercept = 0.446, slope = –0.065, r2=0.053, p=0.375; Titanosauria only partial RMA in dashed green: intercept = 0.378, slope = –0.056, r2=0.207, p=0.102; Lithostrotia only partial RMA in dotted orange: intercept = 0.509, slope = –0.076, r2=0.296, p=0.084. (d) PC4 against log-Femoral length, all taxa RMA in dark red: intercept = 0.388, slope = –0.056, r2=0.02, p=0.59; Titanosauria only partial RMA in dashed green: intercept = 0.416, slope = –0.061, r2=0.018, p=0.647; Lithostrotia only partial RMA in dotted orange: intercept = 0.569, slope = –0.084, r2=0.000, p=0.972. (e) PC5 against log-Femoral length, all taxa RMA in dark red: intercept = –0.346, slope = 0.05, r2=0.097, p=0.225; Titanosauria only partial RMA in dashed green: intercept = –0.346, slope = 0.051, r2=0.186, p=0.124; Lithostrotia only partial RMA in dotted orange: intercept = –0.401, slope = 0.06, r2=0.252, p=0.116. (f) PC6 against log-Femoral length, all taxa RMA in dark red: intercept = –0.323, slope = 0.047, r2=0.097, p=0.223; Titanosauria only partial RMA in dashed green: intercept = –0.336, slope = –0.049, r2=0.104, p=0.261; Lithostrotia only partial RMA in dotted orange: intercept = 0.386, slope = –0.058, r2=0.002, p=0.903. Ae – Aeolosaurus, Amp – Ampelosaurus, An – Antarctosaurus, Bo – Bonatitan, Bon – Bonitasaura, Dre – Dreadnoughuts, Eu – Euhelopus, Ja – Jainosaurus, Li – Lirainosaurus, Lig – Ligabuesaurus, Lo – Lohuecotitan, Ma – Magyarosaurus, Me – Mendozasaurus, Mu – Muyelensaurus, Ne – Neuquensaurus, Oc – Oceanotitan, Sa – Saltasaurus.
Appendix 2—figure 9
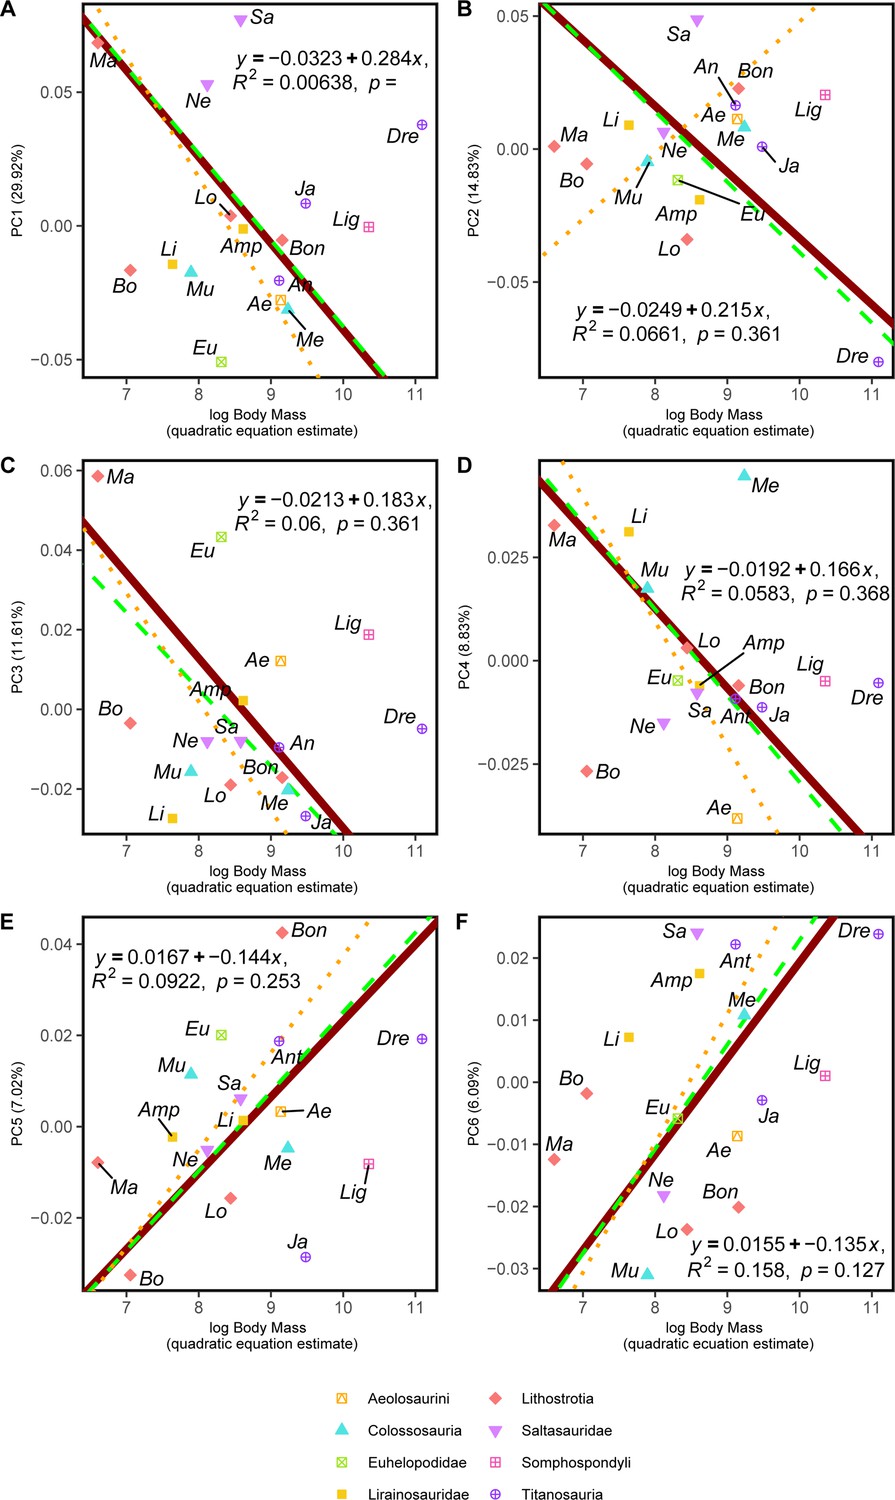
RMA results of the first three shape PCs against the logarithm of the body mass in kilograms, estimated via quadratic equation method (Campione, 2017; Campione, 2017).
(a) PC1 against log-body mass, all taxa RMA in dark red: intercept = 0.284, slope = –0.032, r2=0.006, p=0.769; Titanosauria only partial RMA in dashed green: intercept = 0.285, slope = –0.032, r2=0.012, p=0.712; Lithostrotia only partial RMA in dotted orange: intercept = 0.379, slope = –0.045, r2=0.119, p=0.299; (b) PC2 against log-Body mass, all taxa RMA in dark red: intercept = 0.215, slope = –0.025, r2=0.066, p=0.336; Titanosauria only partial RMA in dashed green: intercept = 0.226, slope = –0.026, r2=0.119, p=0.18; Lithostrotia only partial RMA in dotted orange: intercept = –0.2, slope = 0.025 r2=0,053, p=0.496; (c) PC3 against log-Body mass, all taxa RMA in dark red: intercept = 0.183, slope = –0.021, r2=0.06, p=0.361; Titanosauria only partial RMA in dashed green: intercept = 0.159, slope = –0.019, r2=0.158, p=0.159; Lithostrotia only partial RMA in dotted orange: intercept = 0.22, slope = –0.027, r2=0.239, p=0.127. (d) PC4 against log-Body mass, all taxa RMA in dark red: intercept = 0.166, slope = –0.019, r2=0.058, p=0.368; Titanosauria only partial RMA in dashed green: intercept = 0.18, slope = –0.021, r2=0.059, p=0.401; Lithostrotia only partial RMA in dotted orange: intercept = 0.25, slope = –0.03, r2=0.038, p=0.566. (e) PC5 against log-Body mass, all taxa RMA in dark red: intercept = –0.144, slope = 0.017, r2=0.092, p=0.253; Titanosauria only partial RMA in dashed green: intercept = –0.149, slope = 0.017, r2=0.178, p=0.133; Lithostrotia only partial RMA in dotted orange: intercept = –0.176, slope = 0.021, r2=0.289, p=0.088. (f) PC6 against log-Body mass, all taxa RMA in dark red: intercept = –0.100, slope = 0.046, r2=0.086, p=0.254; Titanosauria only partial RMA in dashed green: intercept = –0.145, slope = 0.017, r2=0.173, p=0.139; Lithostrotia only partial RMA in dotted orange: intercept = –0.176, slope = 0.021, r2=0.025, p=0.642. Ae – Aeolosaurus, Amp – Ampelosaurus, An – Antarctosaurus, Bo – Bonatitan, Bon – Bonitasaura, Dre – Dreadnoughtus, Eu – Euhelopus, Ja – Jainosaurus, Li – Lirainosaurus, Lig – Ligabuesaurus, Lo – Lohuecotitan, Ma – Magyarosaurus, Me – Mendozasaurus, Mu – Muyelensaurus, Ne – Neuquensaurus, Oc – Oceanotitan, Sa – Saltasaurus.
Appendix 2—figure 10
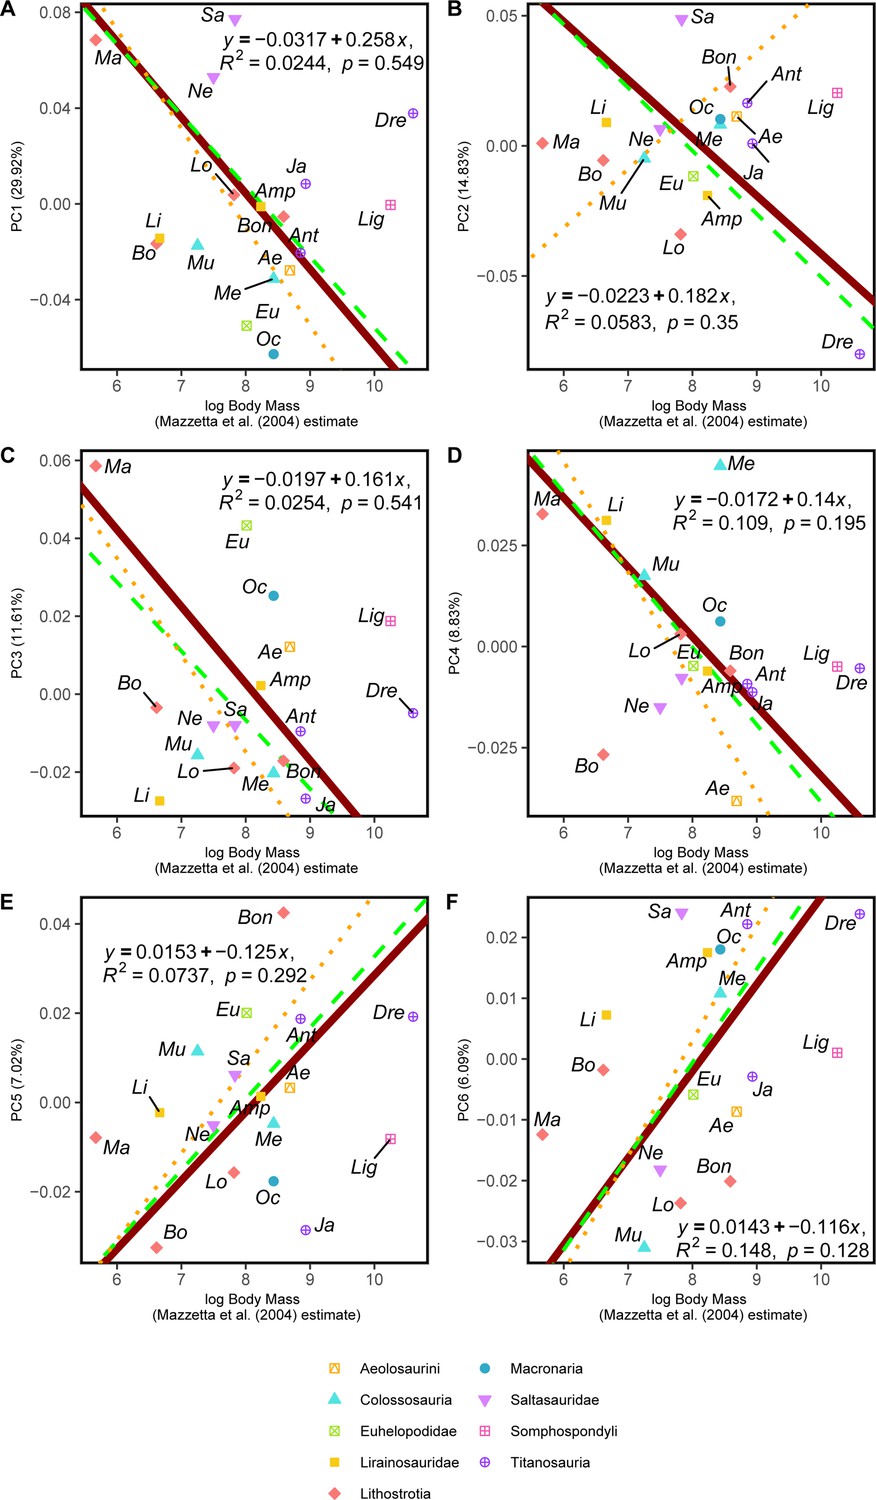
RMA results of the first three shape PCs against the logarithm of the body mass in kilograms, estimated via hind limb multiple regression proposed by Mazzetta et al., 2004.
(a) PC1 against log-body mass, all taxa RMA in dark red: intercept = 0.258, slope = –0.032, r2=0.024, p=0.549; Titanosauria only partial RMA in dashed green: intercept = 0.244, slope = –0.03, r2=0.024, p=0.597; Lithostrotia only partial RMA in dotted orange: intercept = 0.319, slope = –0.041, r2=0.147, p=0.245; (b) PC2 against log-Centroid size, all taxa RMA in dark red: intercept = 0.182, slope = –0.022, r2=0.025, p=0.35; Titanosauria only partial RMA in dashed green: intercept = 0.192, slope = –0.024, r2=0.149, p=0.173; Lithostrotia only partial RMA in dotted orange: intercept = –0.167, slope = 0.023, r2=0.023, p=0.657; (c) PC3 against log-Body mass, all taxa RMA in dark red: intercept = 0.161, slope = –0.02, r2=0.025, p=0.541; Titanosauria only partial RMA in dashed green: intercept = 0.135, slope = –0.018, r2=0.148, p=0.174; Lithostrotia only partial RMA in dotted orange: intercept = 0.184, slope = –0.025, r2=0.215, p=0.151. (d) PC4 against log-Body mass, all taxa RMA in dark red: intercept = 0.14, slope = –0.017, r2=0.109, p=0.195; Titanosauria only partial RMA in dashed green: intercept = 0.153, slope = –0.019, r2=0.122, p=0.221; Lithostrotia only partial RMA in dotted orange: intercept = 0.21, slope = –0.027, r2=0.117, p=0.302. (e) PC5 against log-Body mass, all taxa RMA in dark red: intercept = –0.125, slope = 0.015, r2=0.074, p=0.292; Titanosauria only partial RMA in dashed green: intercept = –0.127, slope = 0.016, r2=0.169, p=0.145; Lithostrotia only partial RMA in dotted orange: intercept = –0.147, slope = 0.019, r2=0.242, p=0.125. (f) PC6 against log-Body mass, all taxa RMA in dark red: intercept = –0.116, slope = 0.014, r2=0.148, p=0.128; Titanosauria only partial RMA in dashed green: intercept = –0.124, slope = 0.015, r2=0.17, p=0.142; Lithostrotia only partial RMA in dotted orange: intercept = –0.149, slope = –0.053, r2=0.015, p=0.716. Ae – Aeolosaurus, Amp – Ampelosaurus, An – Antarctosaurus, Bo – Bonatitan, Bon – Bonitasaura, Dre – Dreadnoughtus, Eu – Euhelopus, Ja – Jainosaurus, Li – Lirainosaurus, Lig – Ligabuesaurus, Lo – Lohuecotitan, Ma – Magyarosaurus, Me – Mendozasaurus, Mu – Muyelensaurus, Ne – Neuquensaurus, Oc – Oceanotitan, Sa – Saltasaurus.
Appendix 2—figure 11
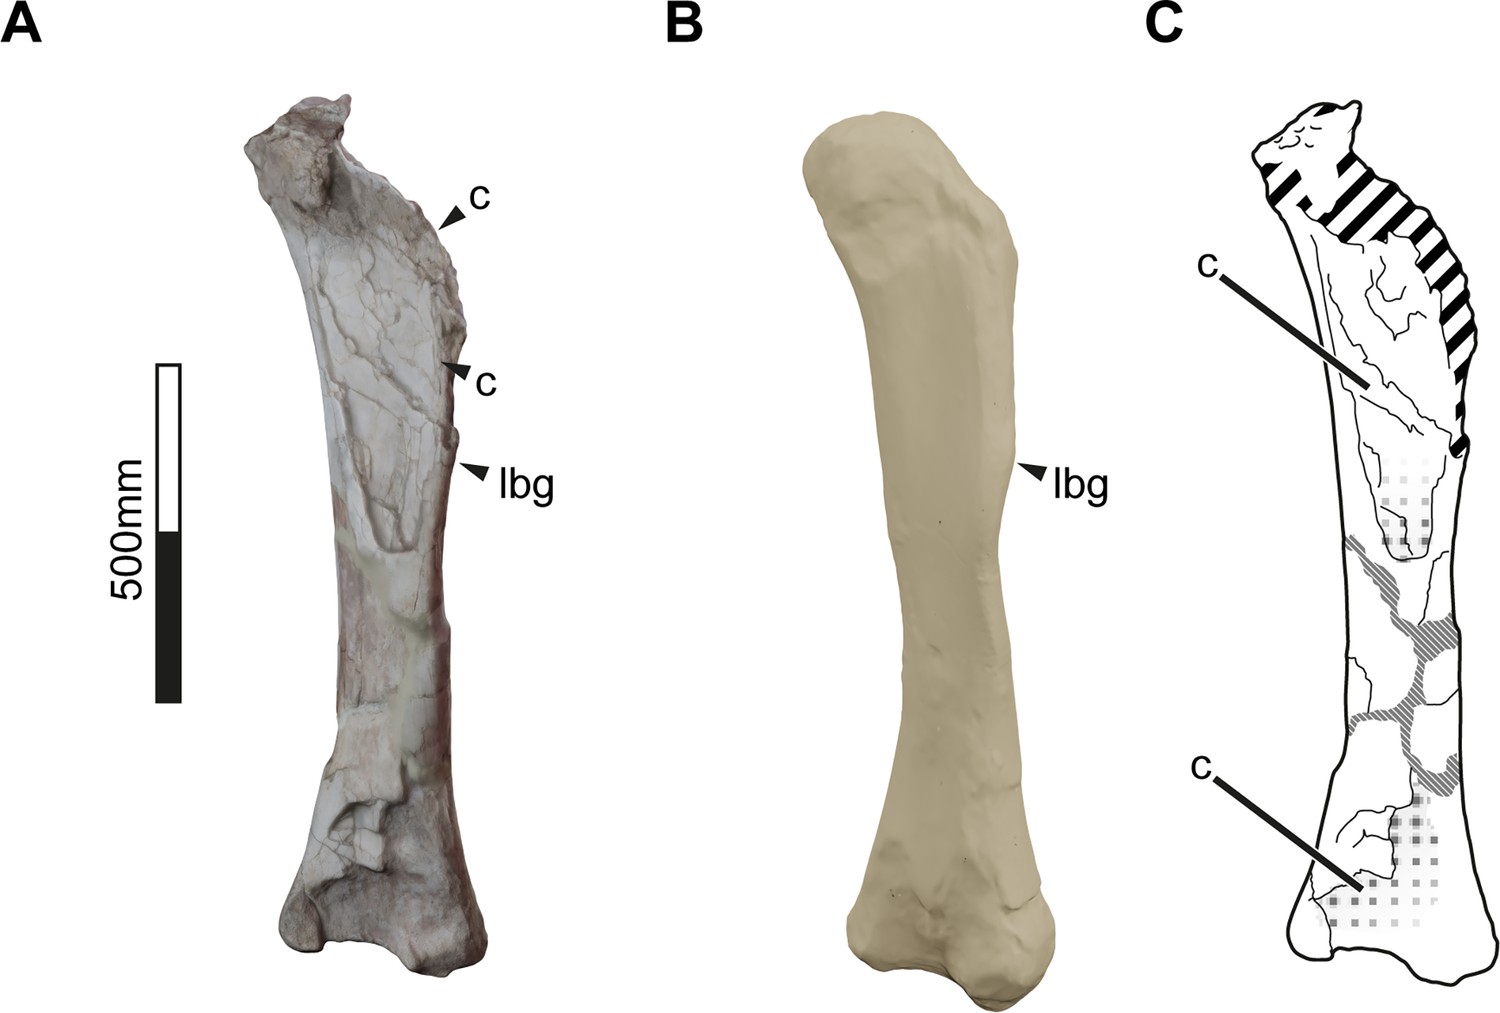
3D reconstruction of Bonitasaura salgadoi holotype (MPCA-460) left femur in anteolateral view.
(A) Original specimen 3D reconstruction. (B) Complete femur as reconstructed by the statistical virtual restoration method. (C) Diagram indicating the partial collapse of the anterior view of the shaft and the fragmentary proximal end. Abbreviations: c – collapse, lbg – lateral bulge. Discontinued lines/fill indicate fracture.
Appendix 2—figure 12
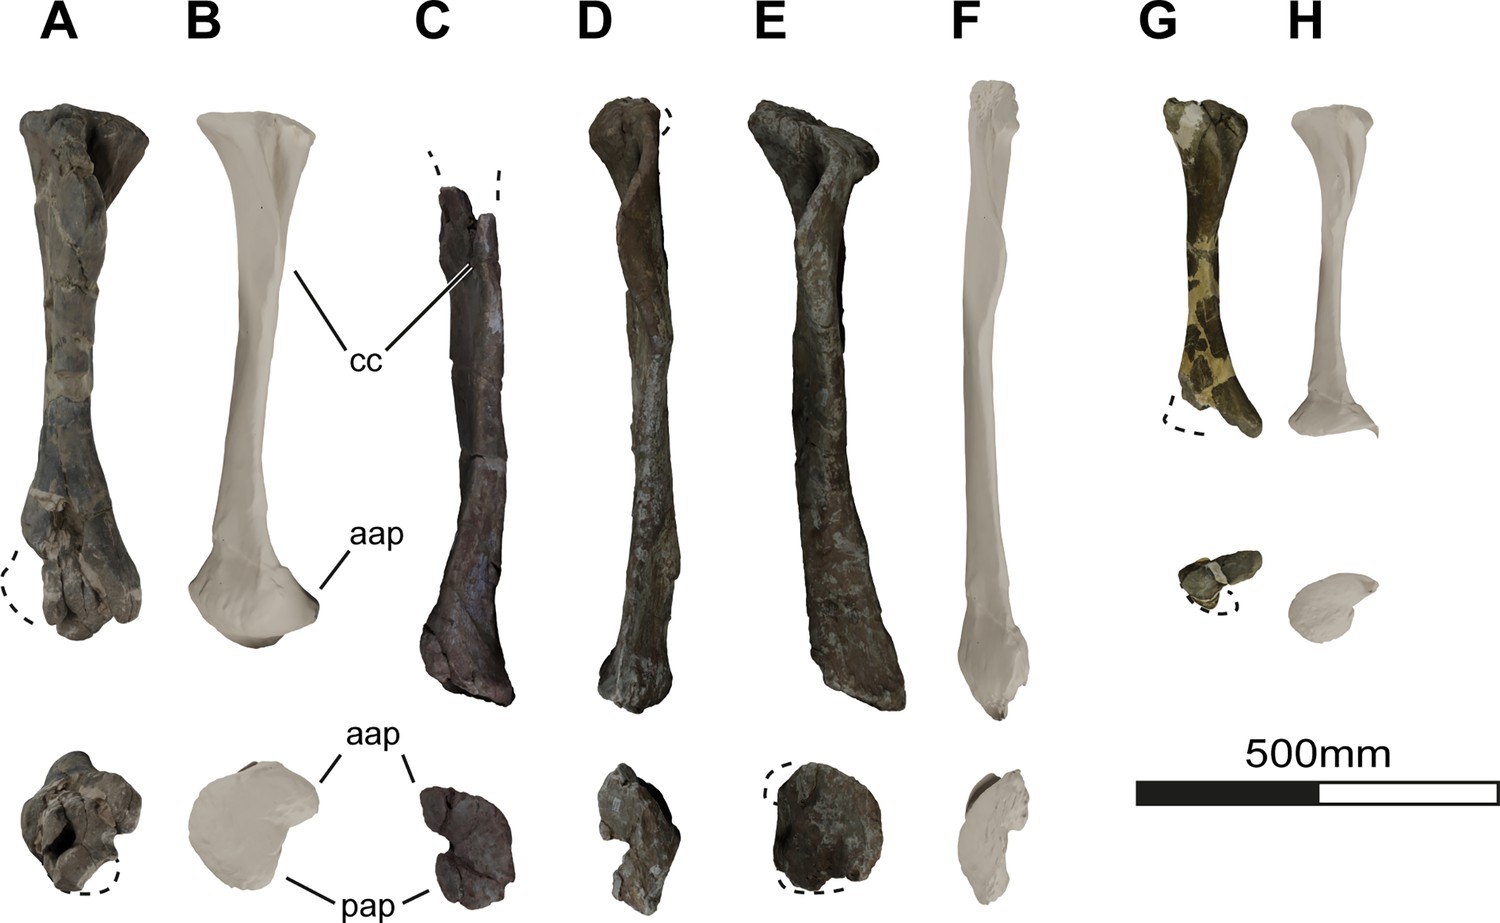
Comparison between tibial specimens and their corresponding 3D virtual statistical restorations.
Aeolosaurus sp. (A) Left tibia MPCA-27100–8 in anterior and distal views, (B) Complete tibia as reconstructed by the statistical virtual restoration method in anterior and distal views. Mendozasaurus neguyelap: (C) Right tibia IANIGLA-73–2 in anterior and distal views, (D). Right tibia IANIGLA-73–3 in anterior and distal views, (E) Right tibia IANIGLA-74–1 in anterior and distal views, (F) Complete tibia as reconstructed by the statistical virtual restoration method in anterior and distal views. Magyarosaurus spp. (G) Left tibia NHM-R3853 in anterior and distal views, (H) Complete tibia as reconstructed by the statistical virtual restoration method in anterior and distal views. Abbreviations: aap – anterior ascending process, cc – cnemial crest, pap – posterior ascending process. Discontinued lines/fill indicate fracture.
Tables
Table 1
Specimen sample used in this study.
Proximodistal hind limb length measured in mm.
| Clade | Hind limb length (mm) | |
|---|---|---|
| Aeolosaurus | Aeolosaurini | 1839 |
| Ampelosaurus | Lirainosaurinae | 1411 |
| Antarctosaurus | Titanosauria | 2351 |
| Bonatitan | Lithostrotia | 963 |
| Bonitasaura | Lithostrotia | 1987 |
| Dreadnoughtus | Titanosauria | 3184 |
| Euhelopus | Euhelopodidae | 1683 |
| Jainosaurus | Titanosauria | 2188 |
| Ligabuesaurus | Somphospondyli | 2866 |
| Lirainosaurus | Lirainosaurinae | 1074 |
| Lohuecotitan | Lithostrotia | 1120 |
| Magyarosaurus | Lithostrotia | 750 |
| Mendozasaurus | Colossosauria | 2334 |
| Muyelensaurus | Colossosauria | 1450 |
| Neuquensaurus | Saltasauridae | 1200 |
| Oceanotitan | Macronaria | 1892 |
| Saltasaurus | Saltasauridae | 1230 |
Table 2
PCA results over GPA-aligned coordinates.
Variance explained by each shape PC.
| Explained variance (%) | Cumulative variance (%) | |
|---|---|---|
| PC1 | 29.92 | 29.92 |
| PC2 | 14.83 | 44.75 |
| PC3 | 11.61 | 56.36 |
| PC4 | 8.83 | 65.19 |
| PC5 | 7.02 | 72.21 |
| PC6 | 6.09 | 78.3 |
| PC7 | 4.18 | 82.48 |
| PC8 | 3.75 | 86.23 |
| PC9 | 3.12 | 89.35 |
| PC10 | 2.19 | 91.53 |
| PC11 | 2.15 | 93.68 |
| PC12 | 1.95 | 95.64 |
| PC13 | 1.56 | 97.19 |
| PC14 | 1.18 | 98.38 |
| PC15 | 0.92 | 99.29 |
| PC16 | 0.71 | 100 |
Table 3
Kruskal-Wallis test on shape PCA variables between the most inclusive subclades analyzed.
| Chi-sq | p-value | p-adjusted | |
|---|---|---|---|
| PC1 | 11.954 | 0.153 | 1 |
| PC2 | 5.592 | 0.693 | 1 |
| PC3 | 7.886 | 0.445 | 1 |
| PC4 | 9.647 | 0.291 | 1 |
| PC5 | 5.17 | 0.739 | 1 |
| PC6 | 7.618 | 0.472 | 1 |
| PC7 | 8.915 | 0.35 | 1 |
| PC8 | 8.941 | 0.347 | 1 |
| PC9 | 10.206 | 0.251 | 1 |
| PC10 | 10.422 | 0.237 | 1 |
| PC11 | 4.768 | 0.782 | 1 |
| PC12 | 5.66 | 0.685 | 1 |
| PC13 | 8.886 | 0.352 | 1 |
| PC14 | 9.856 | 0.275 | 1 |
| PC15 | 10.248 | 0.248 | 1 |
| PC16 | 4.578 | 0.802 | 1 |
Table 4
Phylogenetic ANOVA test on shape PCA variables between the most inclusive subclades studied.
| Df | SS | MS | R2 | F | Z | Pr(>F) | ||
|---|---|---|---|---|---|---|---|---|
| PC1 | ~Clade | 8 | 0.073 | 0.009 | 0.466 | 0.872 | –0.105 | 0.531 |
| Residuals | 8 | 0.083 | 0.010 | 0.533 | - | - | - | |
| Total | 16 | 0.157 | - | - | - | - | - | |
| PC2 | ~Clade | 8 | 0.001 | 1.50E+04 | 0.685 | 0.218 | 0.573 | 0.313 |
| Residuals | 8 | 5.52E+04 | 6.90E+09 | 0.314 | - | - | - | |
| Total1 | 16 | 0.002 | - | - | - | - | - | |
| PC3 | ~Clade | 8 | 1.54E+04 | 1.93E+09 | 0.285 | 0.399 | –0.925 | 0.82 |
| Residuals | 8 | 3.86E+04 | 4.83E+08 | 0.714 | - | - | - | |
| Total | 16 | 5.40E+04 | - | - | - | - | - | |
| PC4 | ~Clade | 8 | 1.49E+04 | 1.87E+09 | 0.3534 | 0.546 | –0.496 | 0.658 |
| Residuals | 8 | 2.73E+04 | 3.41E+09 | 0.646 | - | - | - | |
| Total | 16 | 4.22E+04 | - | - | - | - | - | |
| PC5 | ~Clade | 8 | 3.77E+04 | 4.72E+09 | 0.556 | 125.362 | 0.121 | 0.452 |
| Residuals | 8 | 3.01E+04 | 3.77E+09 | 0.443 | - | - | - | |
| Total | 16 | 6.79E+04 | - | - | - | - | - | |
| PC6 | ~Clade | 8 | 3.24E+04 | 4.06E+09 | 0.590 | 144.158 | 0.590 | 0.264 |
| Residuals | 8 | 2.25E+04 | 2.82E+09 | 0.409 | - | - | - | |
| Total | 16 | 5.50E+04 | - | - | - | - | - | |
| ~Clade | 8 | 1.63E+04 | 2.05E+09 | 0.434 | 0.768 | –0.315 | 0.625 | |
| Residuals | 8 | 2.13E+04 | 2.66E+09 | 0.565 | - | - | - | |
| Total | 16 | 3.76E+04 | - | - | - | - | - |
Table 5
RMA models of the shape PCs against log-transformed Centroid size.
CI – confidence interval.
| intercept | slope | CI 2.5% Slope | CI 97.5% Slope | r2 | P | |
|---|---|---|---|---|---|---|
| PC1 | 0.221 | –0.102 | –0.168 | –0.062 | 0.105 | 0.204 |
| PC2 | 0.155 | –0.072 | –0.12 | –0.043 | 0.054 | 0.371 |
| PC3 | 0.137 | –0.064 | –0.106 | –0.038 | 0.055 | 0.363 |
| PC4 | 0.12 | –0.055 | –0.093 | –0.033 | 0.026 | 0.534 |
| PC5 | –0.107 | 0.049 | 0.03 | 0.082 | 0.079 | 0.275 |
| PC6 | –0.1 | 0.046 | 0.028 | 0.076 | 0.086 | 0.254 |
Table 6
Estimated phylogenetic signal via Pagel’s lambda.
p value of log-likelihood ratio test after 1000 simulations. * Indicates significant relationships for an alpha of 0.05. log-Csize – Log-transformed hind limb centroid size.
| Lambda | p | |
|---|---|---|
| log-Csize | 0.982 | 0.003* |
| PC1 | 0.715 | 0.000* |
| PC2 | 0 | 1 |
| PC3 | 0.76 | 0.002* |
| PC4 | 0 | 1 |
| PC5 | 0.778 | 0.031* |
| PC6 | 0.697 | 0.01* |
Table 7
Results of pairwise ancestor-descendant comparisons for log-transformed centroid size in macronarian sauropods in our time-calibrated supertree (17 terminal taxa).
n=ingroup internal nodes + terminal taxa. *=accepted as significant with alpha <0.05. °=Lithostrotia + Antarctosaurus.
| Clade | Mean | Sum | Skew | Median | n | Positive changes | Negative changes | χ2 | p |
|---|---|---|---|---|---|---|---|---|---|
| Titanosauriformes | –0.127 | –3.819 | –0.223 | –0.032 | 30 | 12 | 18 | 1.2 | 0.273 |
| Somphospondyli | –0.366 | –10.252 | –0.148 | –0.256 | 28 | 4 | 24 | 14.286 | 0.000* |
| Titanosauria | –0.288 | –7.488 | –0.088 | –0.182 | 26 | 5 | 21 | 9.846 | 0.002* |
| Lithostrotia° | –0.283 | –6.22 | –0.193 | –0.307 | 22 | 5 | 17 | 6.545 | 0.011* |
Table 8
Results of ancestor-descendant pairwise comparisons for shape PC1 in macronarian sauropods in our time-calibrated supertree (17 terminal taxa).
n=ingroup internal nodes + terminal taxa. *=accepted as significant with alpha <0.05. °=Lithostrotia + Antarctosaurus.
| Clade | Mean | Sum | Skew | Median | n | Positive changes | Negative changes | χ2 | p |
|---|---|---|---|---|---|---|---|---|---|
| Titanosauriformes | 0.051 | 1.518 | 0.98 | 0.043 | 30 | 29 | 1 | 26.133 | 0.000* |
| Somphospondyli | 0.019 | 0.538 | 1.158 | 0.012 | 28 | 20 | 7 | 6.259 | 0.012* |
| Titanosauria | 0.011 | 0.291 | 1.076 | 0.003 | 26 | 14 | 10 | 0.667 | 0.414 |
| Lithostrotia° | 0.011 | 0.24 | 1.079 | 0.002 | 22 | 11 | 10 | 0.048 | 0.827 |
Table 9
Results of ancestor-descendant pairwise comparisons for shape PC3 in macronarian sauropods in our time-calibrated supertree (17 terminal taxa).
n=ingroup internal nodes +terminal taxa. *=accepted s significant with alpha <0.05. °=Lithostrotia + Antarctosaurus.
| Clade | Mean | Sum | Skew | Median | n | Positive changes | Negative changes | χ2 | p |
|---|---|---|---|---|---|---|---|---|---|
| Titanosauriformes | –0.035 | –1.047 | 1.697 | –0.038 | 30 | 2 | 28 | 22.533 | 0.000* |
| Somphospondyli | –0.023 | –0.639 | 2.174 | –0.024 | 28 | 2 | 26 | 20.571 | 0.000* |
| Titanosauria | –0.008 | –0.21 | 2.483 | –0.009 | 26 | 3 | 23 | 15.385 | 0.000* |
| Lithostrotia° | –0.003 | –0.074 | 2.323 | –0.004 | 22 | 4 | 17 | 8.048 | 0.005* |
Additional files
-
MDAR checklist
- https://cdn.elifesciences.org/articles/92498/elife-92498-mdarchecklist1-v1.docx
-
Supplementary file 1
Sauropod sample dataset and landmarks.
- https://cdn.elifesciences.org/articles/92498/elife-92498-supp1-v1.zip
-
Supplementary file 2
Study test results.
- https://cdn.elifesciences.org/articles/92498/elife-92498-supp2-v1.xlsx
-
Source code 1
Source code for the geometric morphometric and evolutionary analyses.
- https://cdn.elifesciences.org/articles/92498/elife-92498-code1-v1.zip
Download links
A two-part list of links to download the article, or parts of the article, in various formats.
Downloads (link to download the article as PDF)
Open citations (links to open the citations from this article in various online reference manager services)
Cite this article (links to download the citations from this article in formats compatible with various reference manager tools)
Evolution of hind limb morphology of Titanosauriformes (Dinosauria, Sauropoda) analyzed via 3D geometric morphometrics reveals wide-gauge posture as an exaptation for gigantism
eLife 13:RP92498.
https://doi.org/10.7554/eLife.92498.3


