Reliable protein–protein docking with AlphaFold, Rosetta, and replica exchange
- Department of Chemical and Biomolecular Engineering, The Johns Hopkins University, United States
- Program in Molecular Biophysics, The Johns Hopkins University, United States
- Data Science and AI Institute, Johns Hopkins University, United States
Figures
Figure 1 with 2 supplements
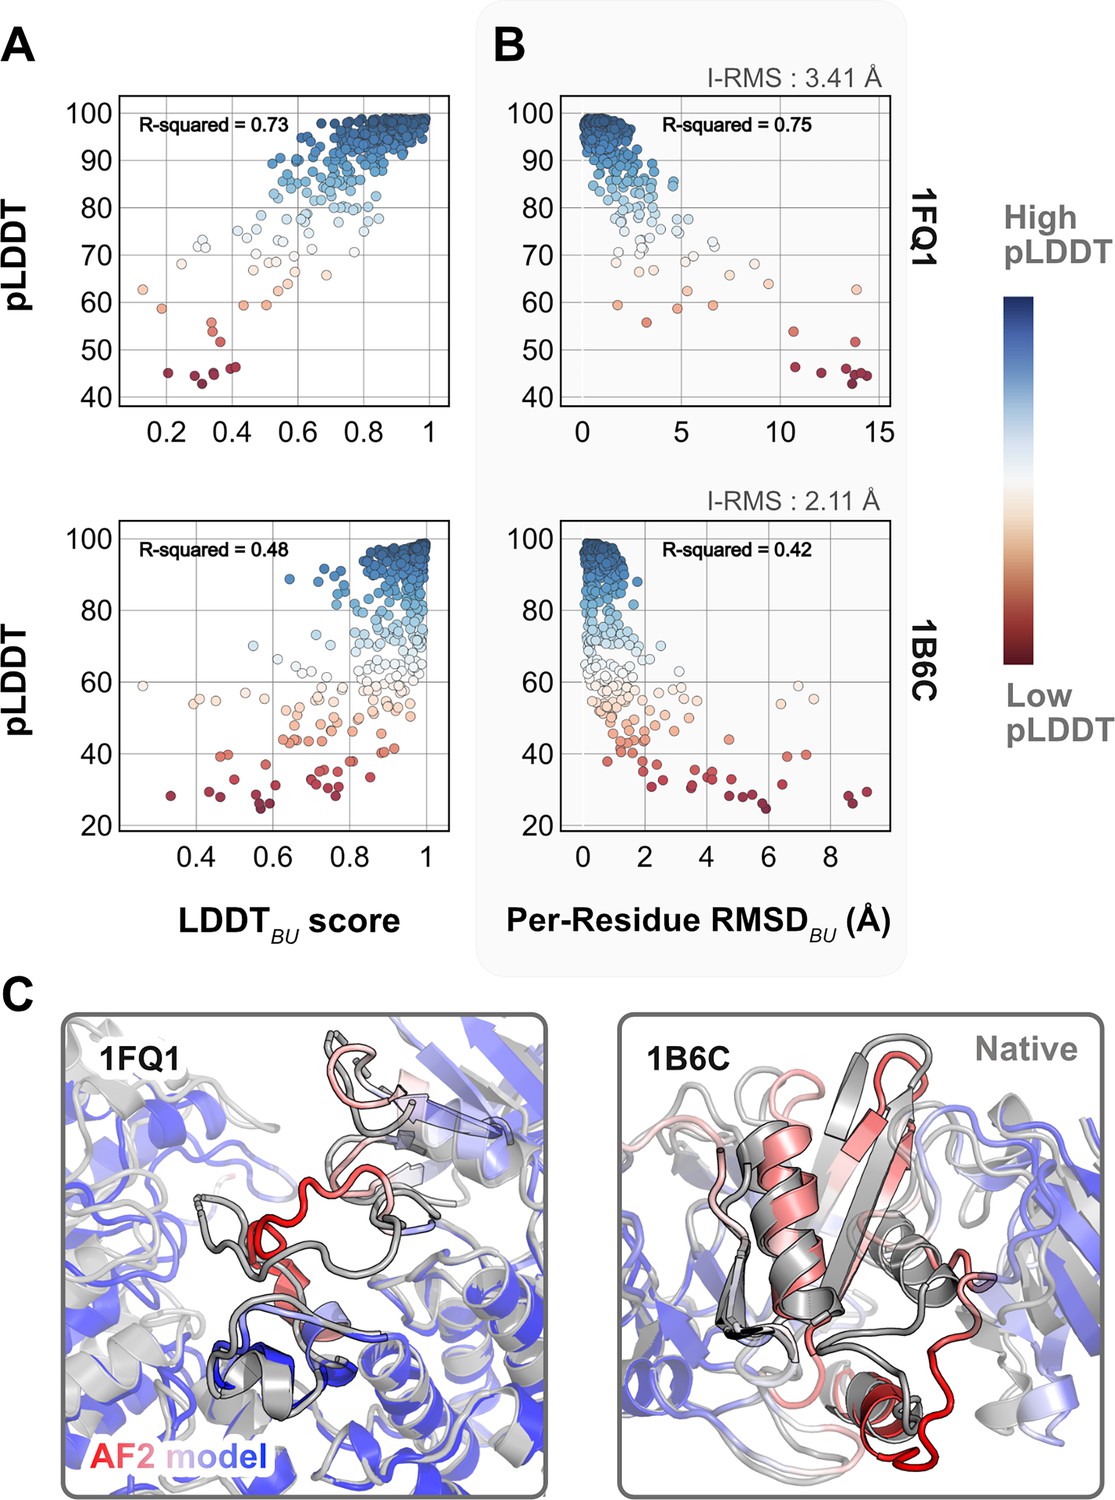
Comparison of AlphaFold-multimer (AFm) predicted local-distance difference test (pLDDT) with structural metrics.
(A) AlphaFold pLDDT plotted against LDDTBU. LDDTBU is calculated by comparing the unbound and bound environment for each residue. High scores correlate with high pLDDT (red). (B) Per-residue root-mean-square-deviation between unbound–bound structures (Per-Residue RMSDBU) vs. AlphaFold pLDDT for two example complex structures. Higher RMSDs correlate with lower pLDDT. (C) Structures for two targets (PDB ID: 1B6C and 1FQ1) with the experimental bound form (gray) and the AlphaFold-multimer predicted model (red–white–blue in A and B). In both cases, the residues with low pLDDT scores (red) are the residues with incorrect conformation and more conformational change.
Figure 1—figure supplement 1
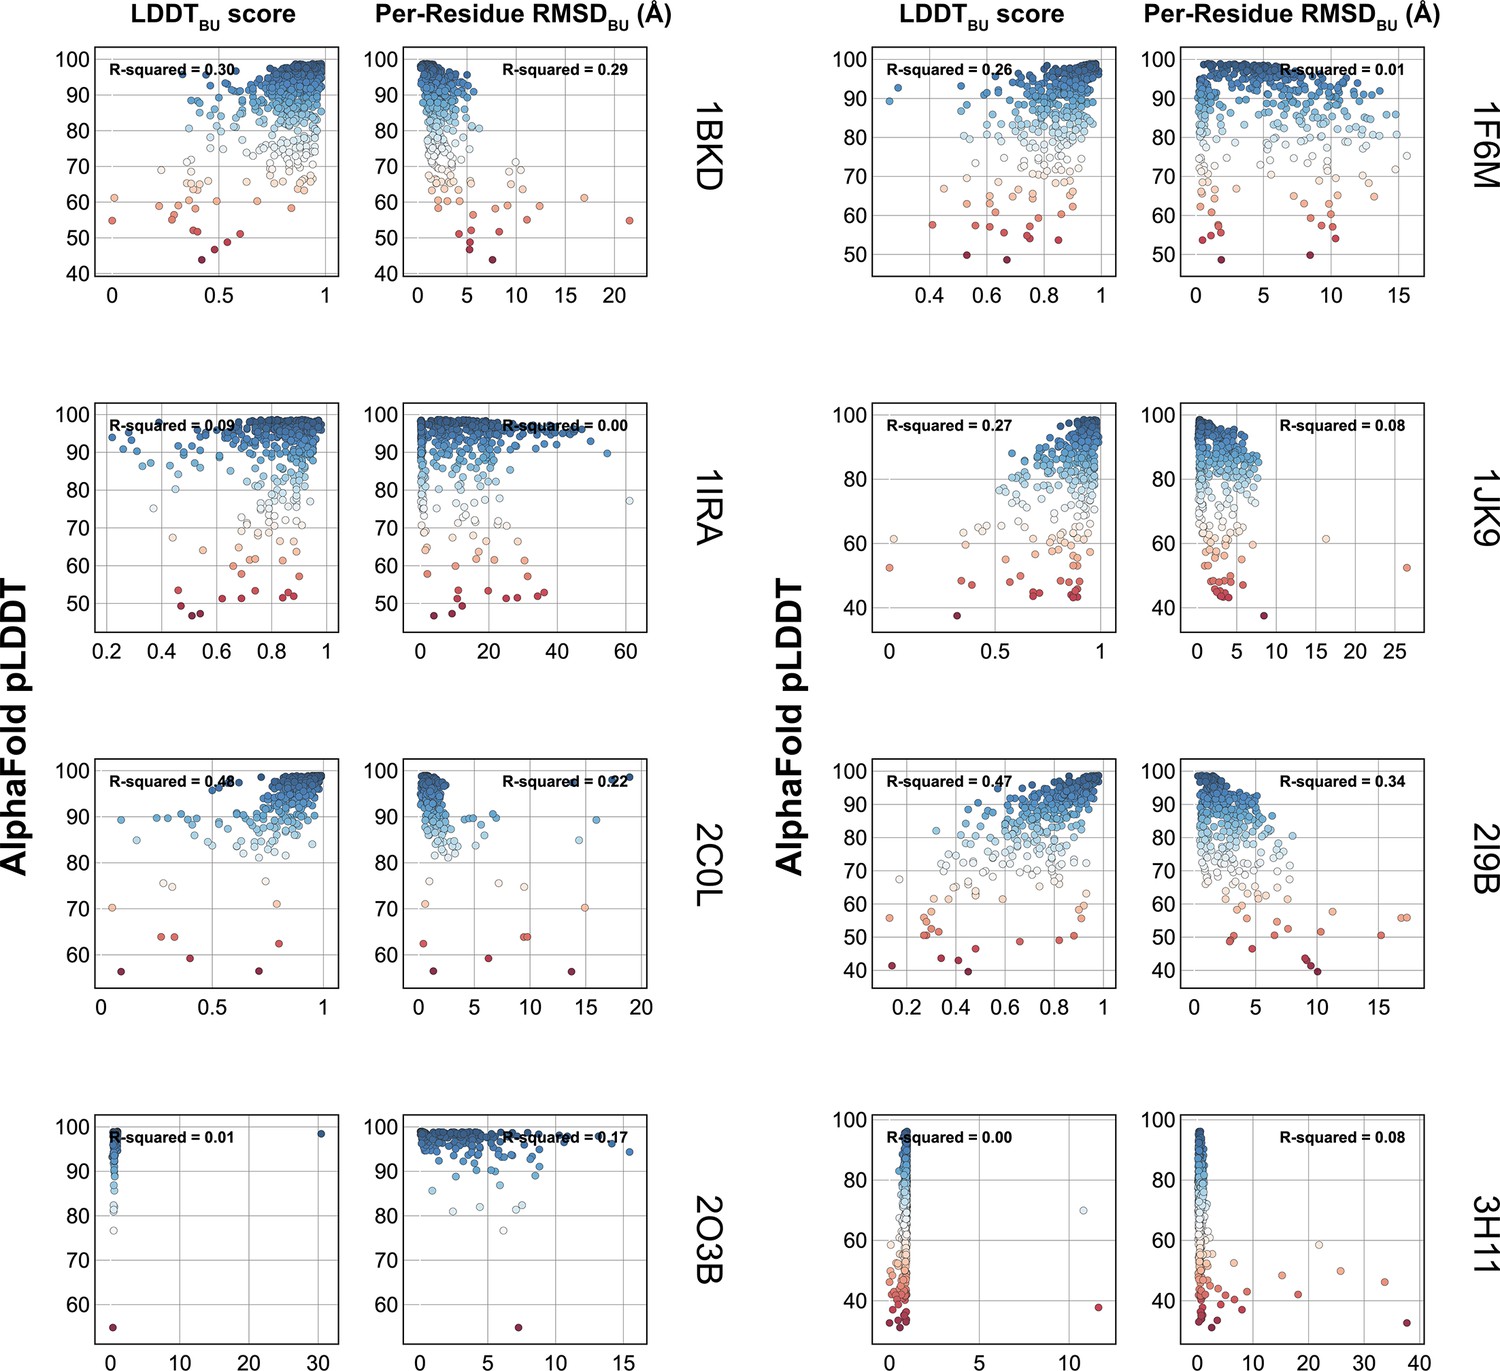
Comparison of AlphaFold-multimer (AFm) predicted local-distance difference test (pLDDT) with structural metrics.
Figure 1—figure supplement 2
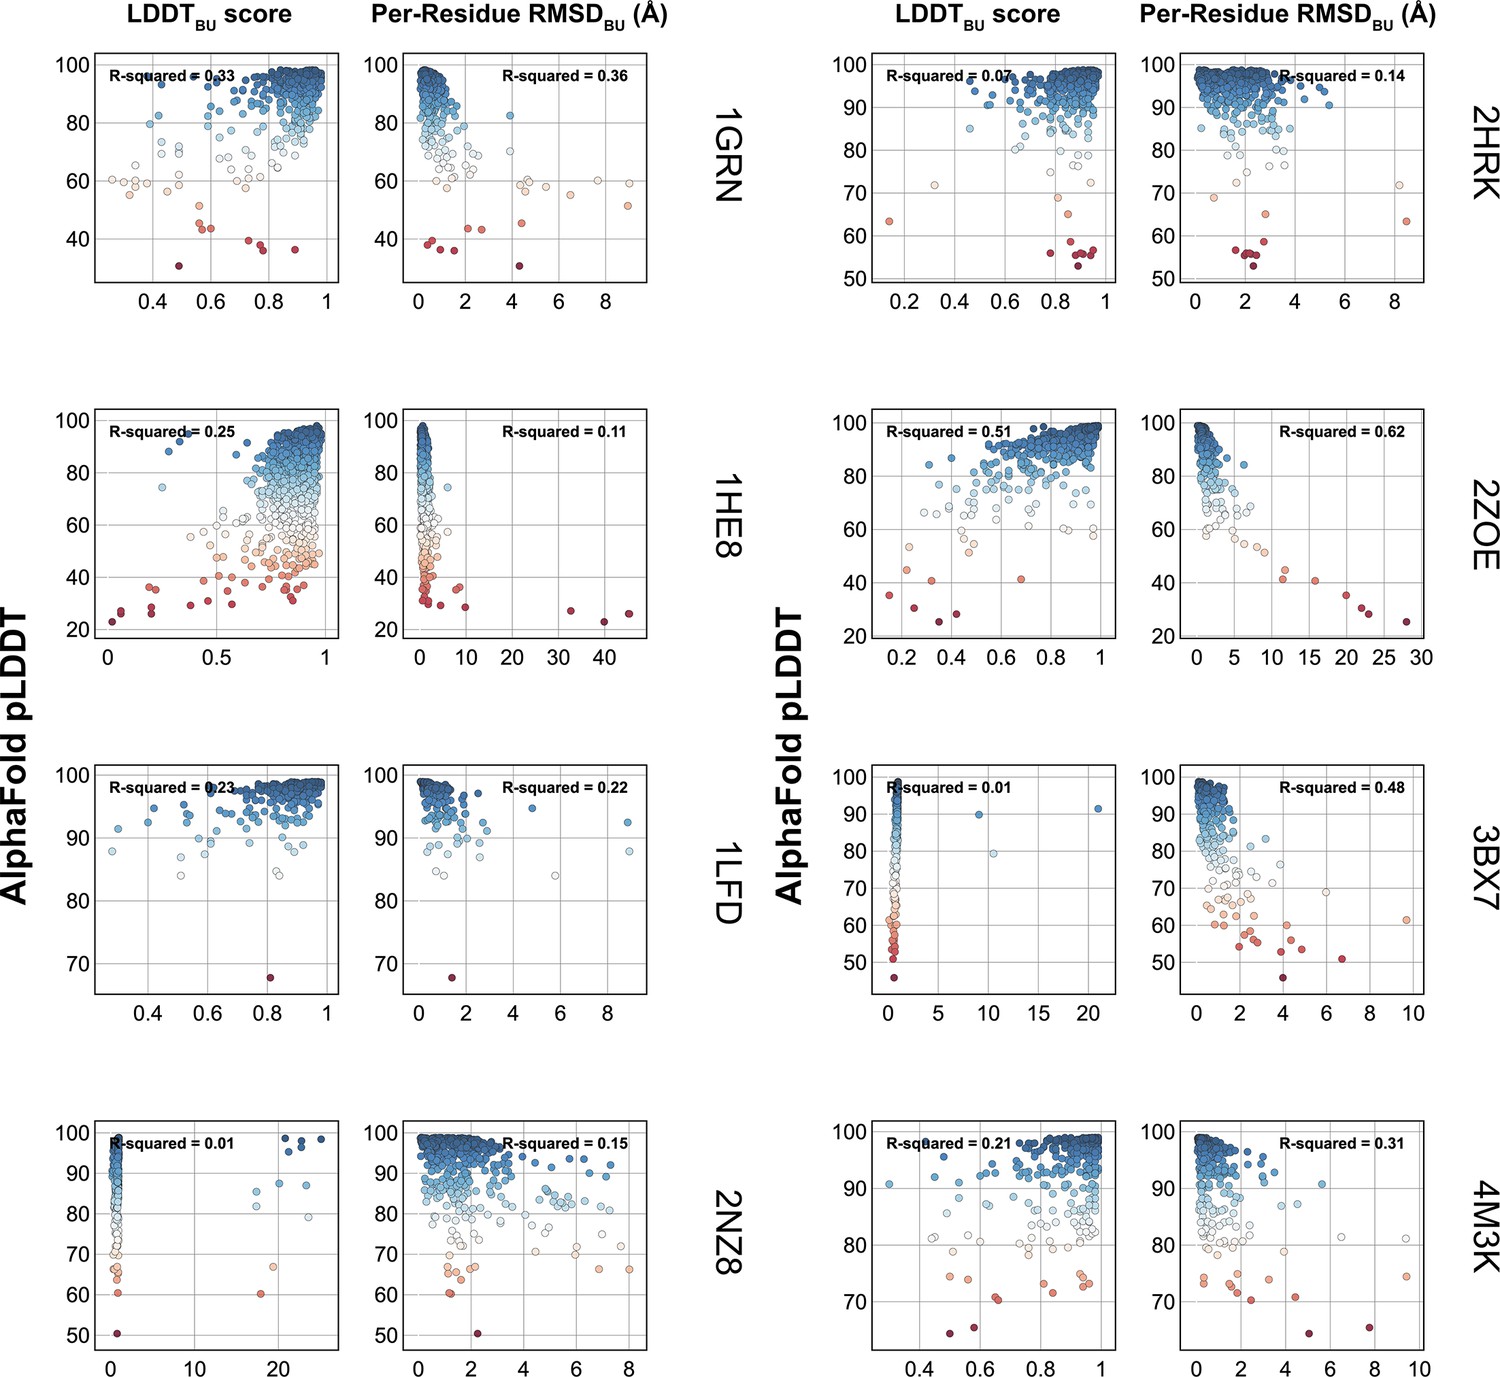
Comparison of AlphaFold-multimer (AFm) predicted local-distance difference test (pLDDT) with structural metrics.
Figure 2
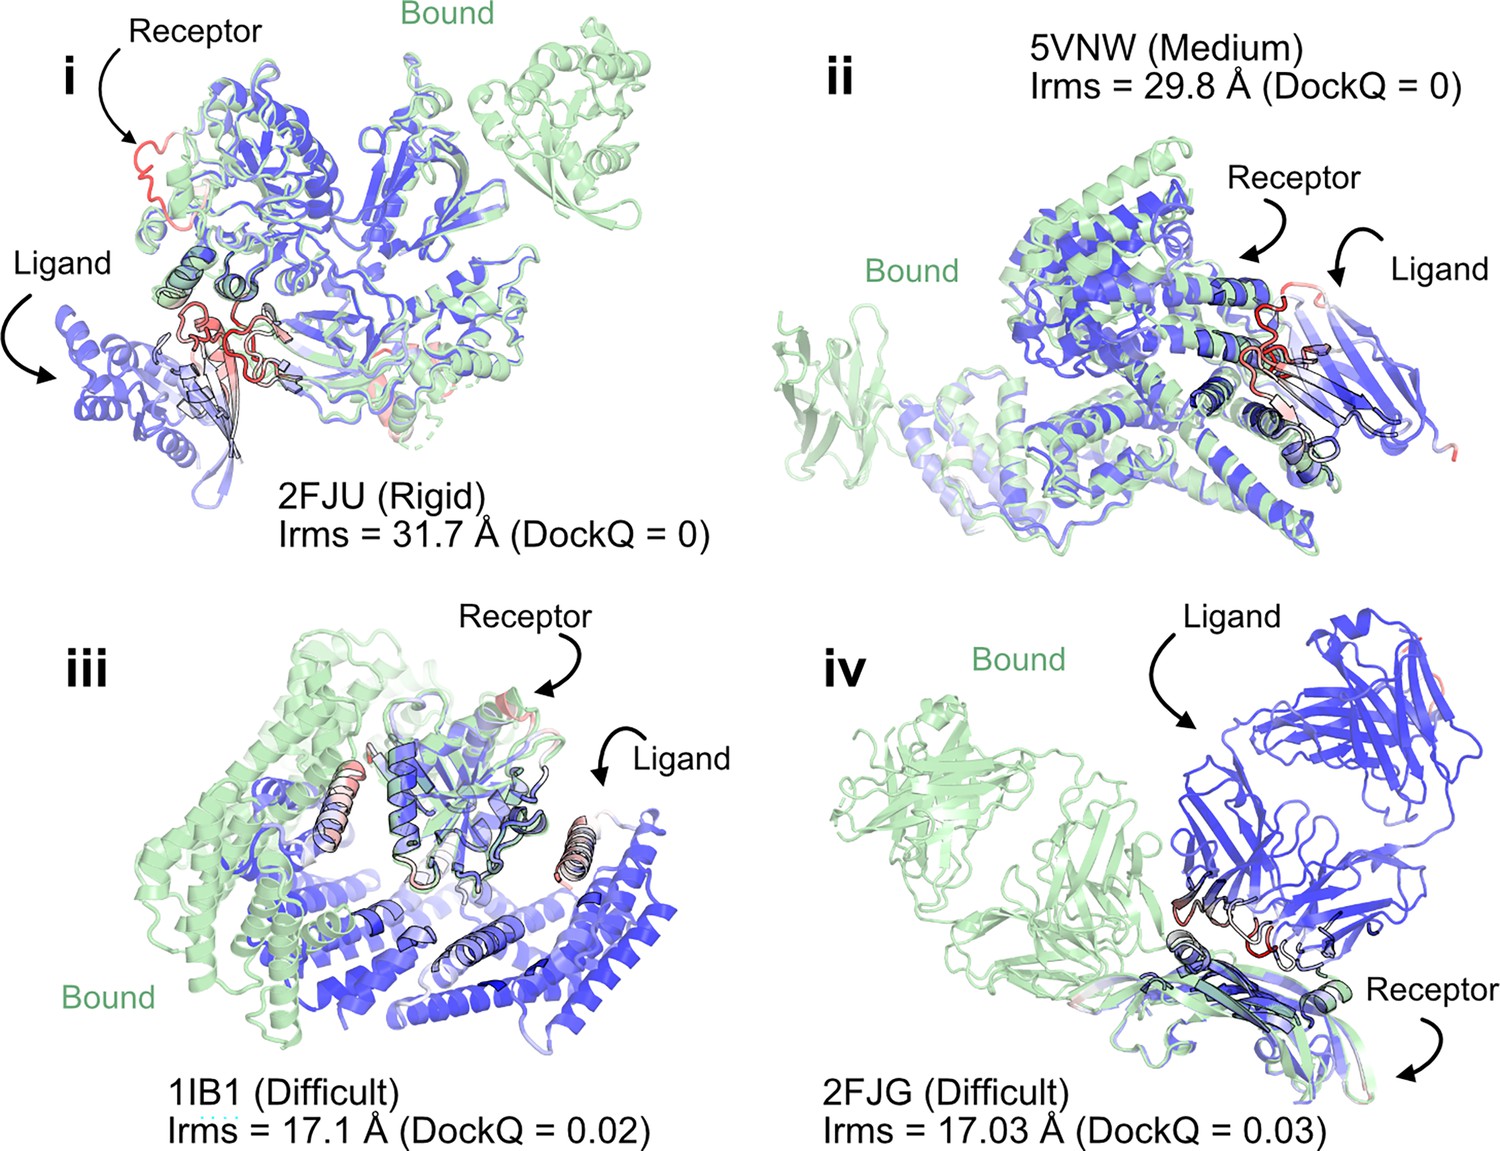
AlphaFold multimer predictions with reference to bound experimentally characterized structures.
Four targets with poor DockQ scores and high interface root mean square deviations (RMSDs): (i) activated Rac1 bound to phospholipase Cβ2 (2FJU) – rigid target (RMSDUB = 1.04 Å); (ii) nanobody bound to serum albumin (5VNW) – medium target (RMSDUB = 1.49 Å); (iii) 14-3-3 zeta Isoform:serotonin N-acetyltransferase complex (1IB1) – difficult target (RMSDUB = 2.09 Å)l and (iv) G6 antibody in complex with the VEGF antigen – difficult target (RMSDUB = 2.51 Å). Bound structure in green and AlphaFold prediction colored by residue-wise pLDDT in red → blue (low confidence → high confidence).
Figure 3
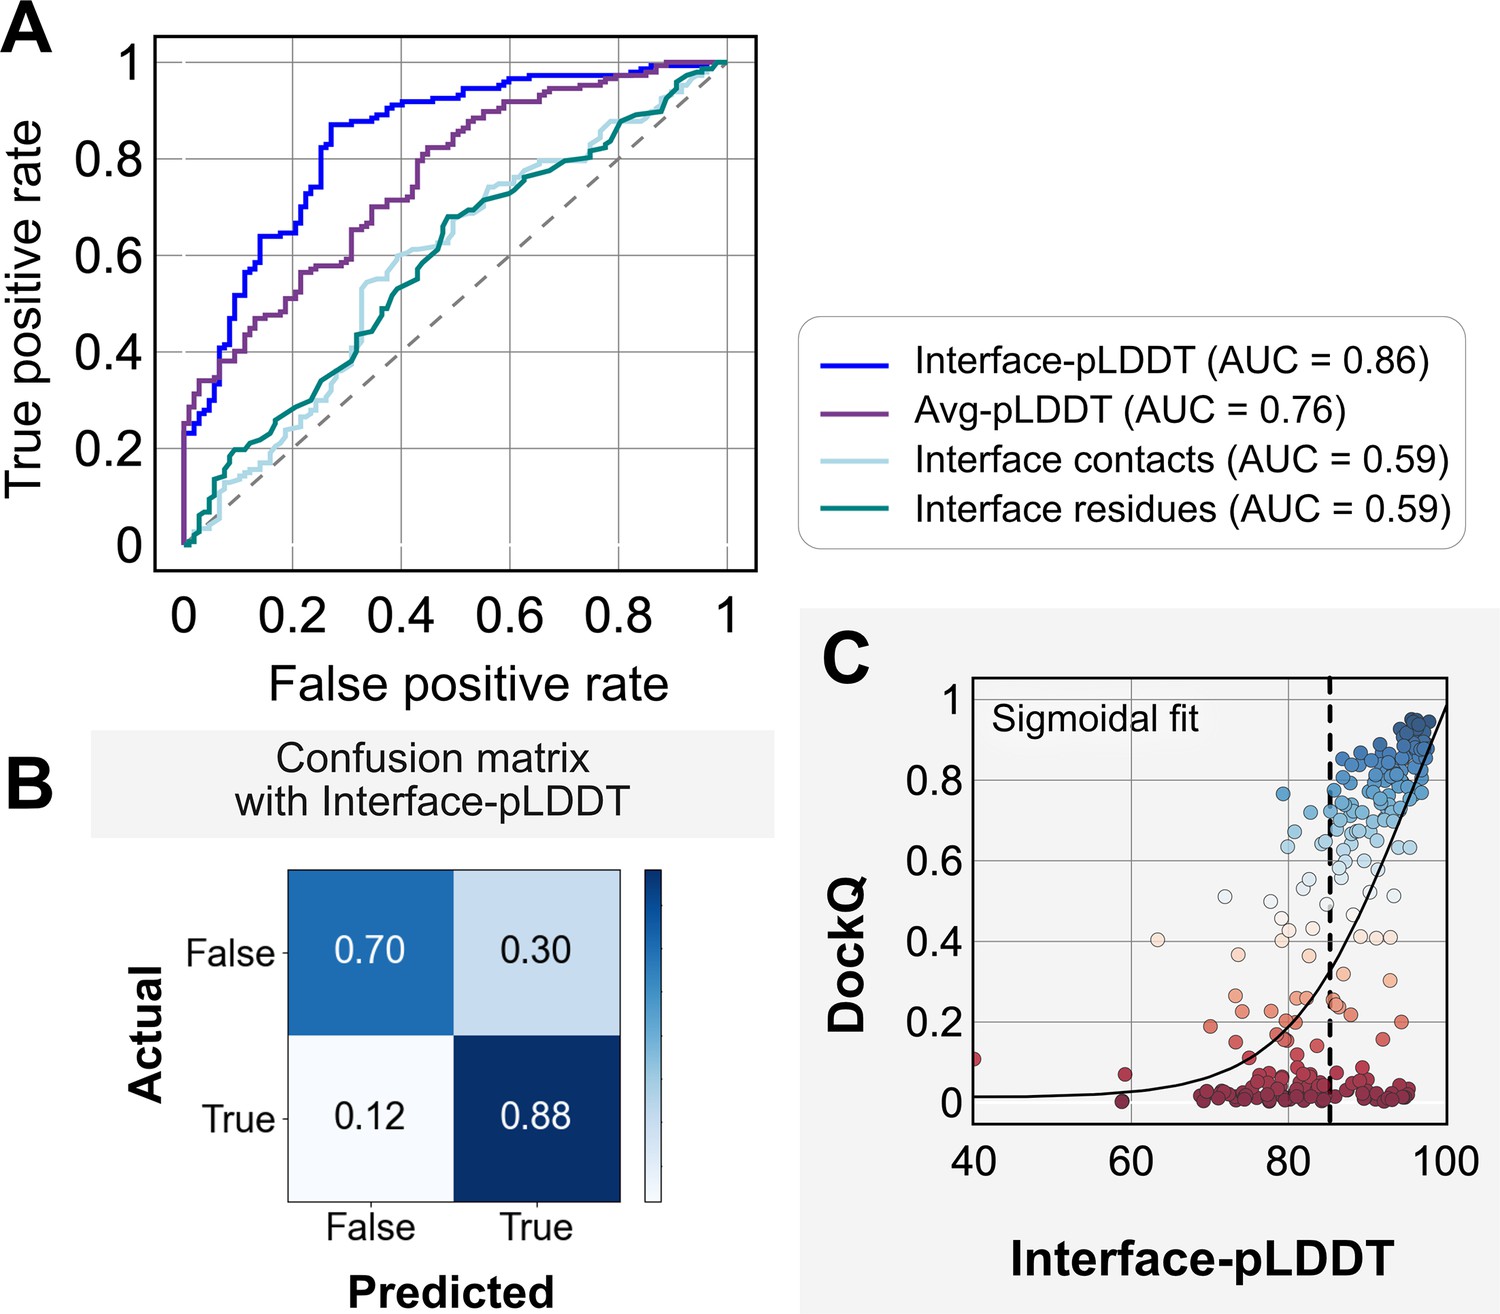
Interface predicted local-distance difference test (interface-pLDDT) is the best indicator of model docking quality.
(A) Receiver-operator characteristics (ROC) curve as a function of different metrics for the docking dataset (n = 254). Interface residues are defined based on whether atoms of residues on one partner are within 8 Å from atom/s on another partner. Interface-pLDDT is the average pLDDT of interface residues. Avg-pLDDT corresponds to the average pLDDT across all the residues in the predicted model. Interface contacts and interface residues are the counts of the interface contacts and interface residues respectively. Interface-pLDDT has the highest area under curve (AUC) score of 0.86. (B) Confusion matrix with an interface-pLDDT threshold between labels predicted false (<85) and true (≥85) and an interface-RMSD threshold between labels actually true (≤4 Å) and false(>4 Å) actual labels. (C) Interface-pLDDT versus DockQ for all protein targets in the benchmark set. DockQ is calculated from the predicted AlphaFold structure and the experimental bound structure in the PDB. We fit a sigmoidal curve to this available data.
Figure 4
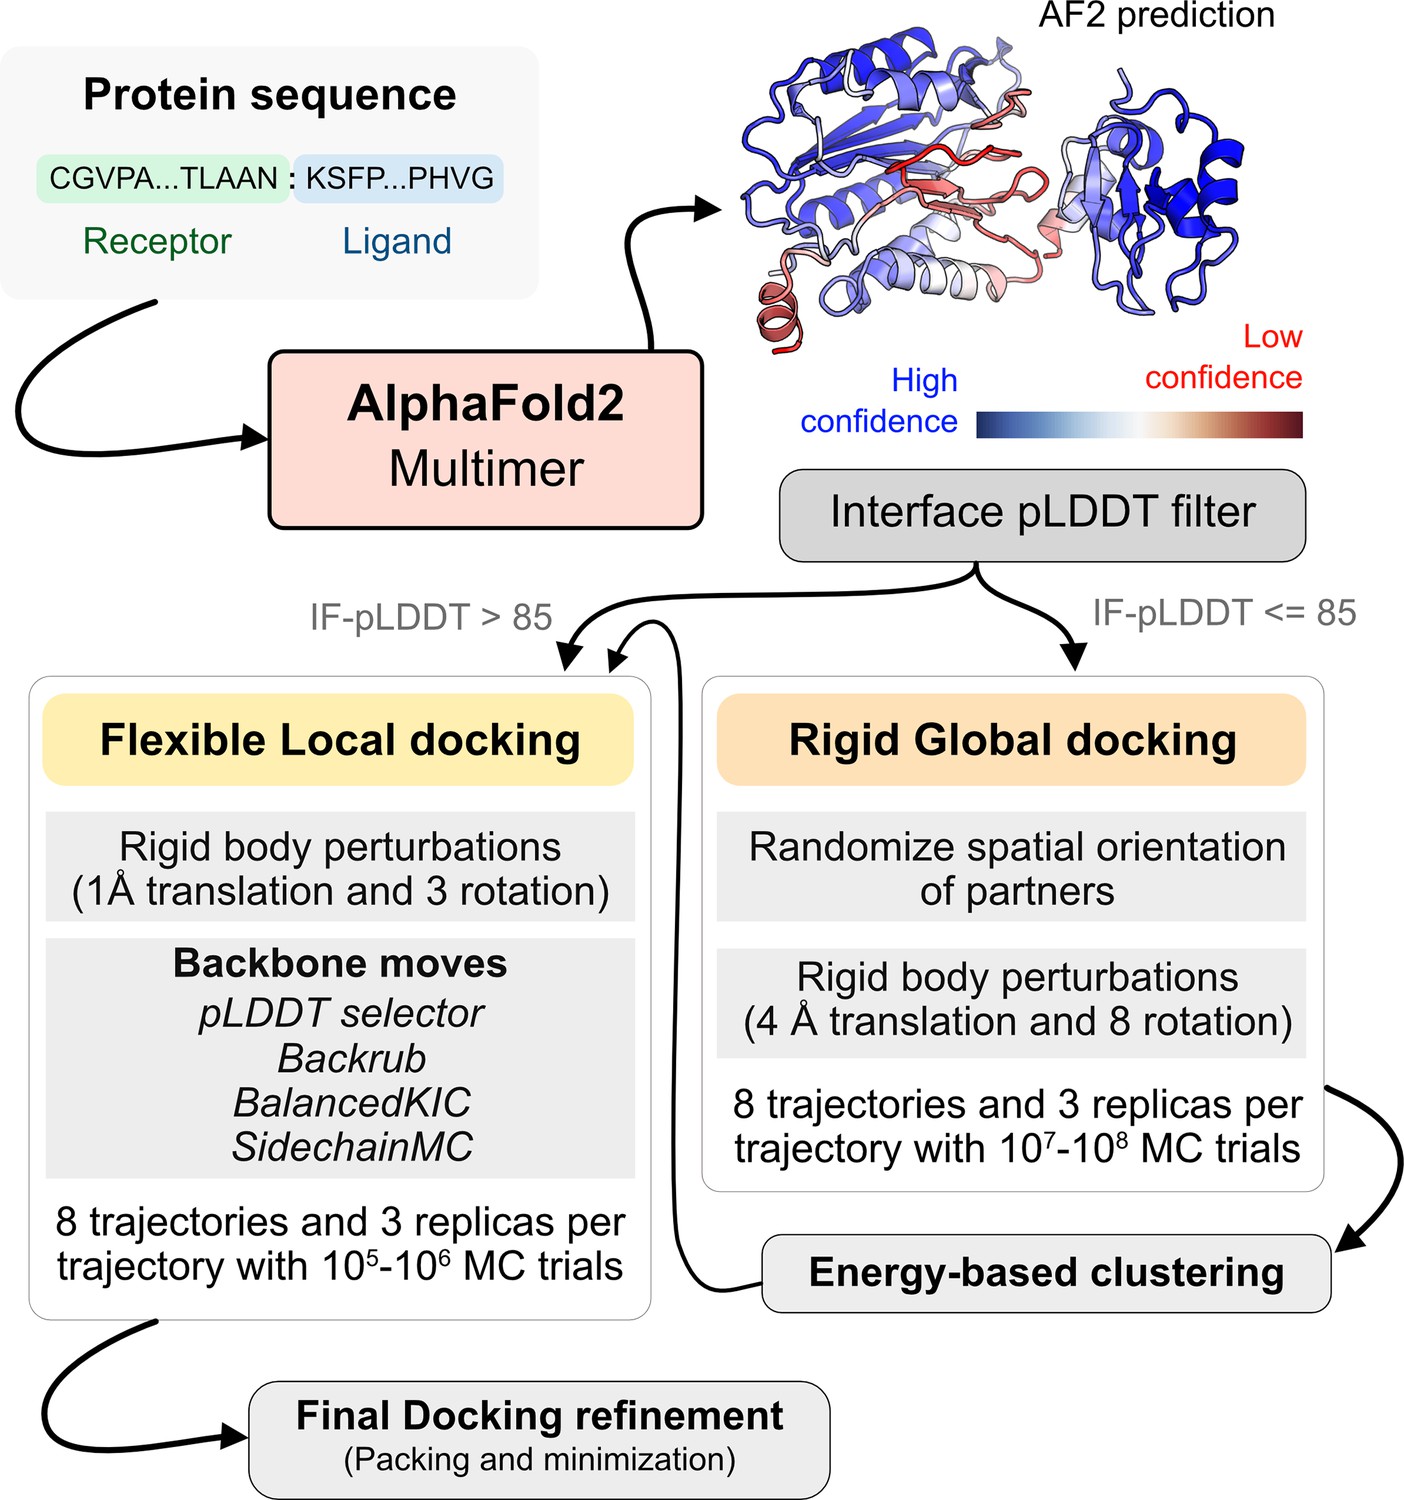
AlphaFold-initiated Replica Exchange Docking (AlphaRED) protein docking pipeline.
Starting with protein sequences of putative complexes, we obtain predicted models from AlphaFold. Each model is accompanied with predicted local-distance difference test (pLDDT) scores, and based on the interface pLDDT we either initiate global rigid-body docking (interface pLDDT < 85), or flexible local docking refinement(interface pLDDT ≥ 85). For global rigid-body docking, the protein partners are first randomized in Cartesian coordinates and then docked with rigid-backbones using temperature replica exchange docking within ReplicaDock2 (Harmalkar et al., 2022). Decoy structures are clustered based on energy before flexible local docking refinement. In flexible local docking, we use the directed induced-fit strategy in ReplicaDock2. With mobile residues selected by the AlphaFold residue-wise pLDDT scores (threshold of 80). The protocol moves the backbones with Rosetta’s Backrub or Balanced Kinematic Closure movers. Output structures are refined and top-scoring structures are selected based on interface energy.
Figure 5
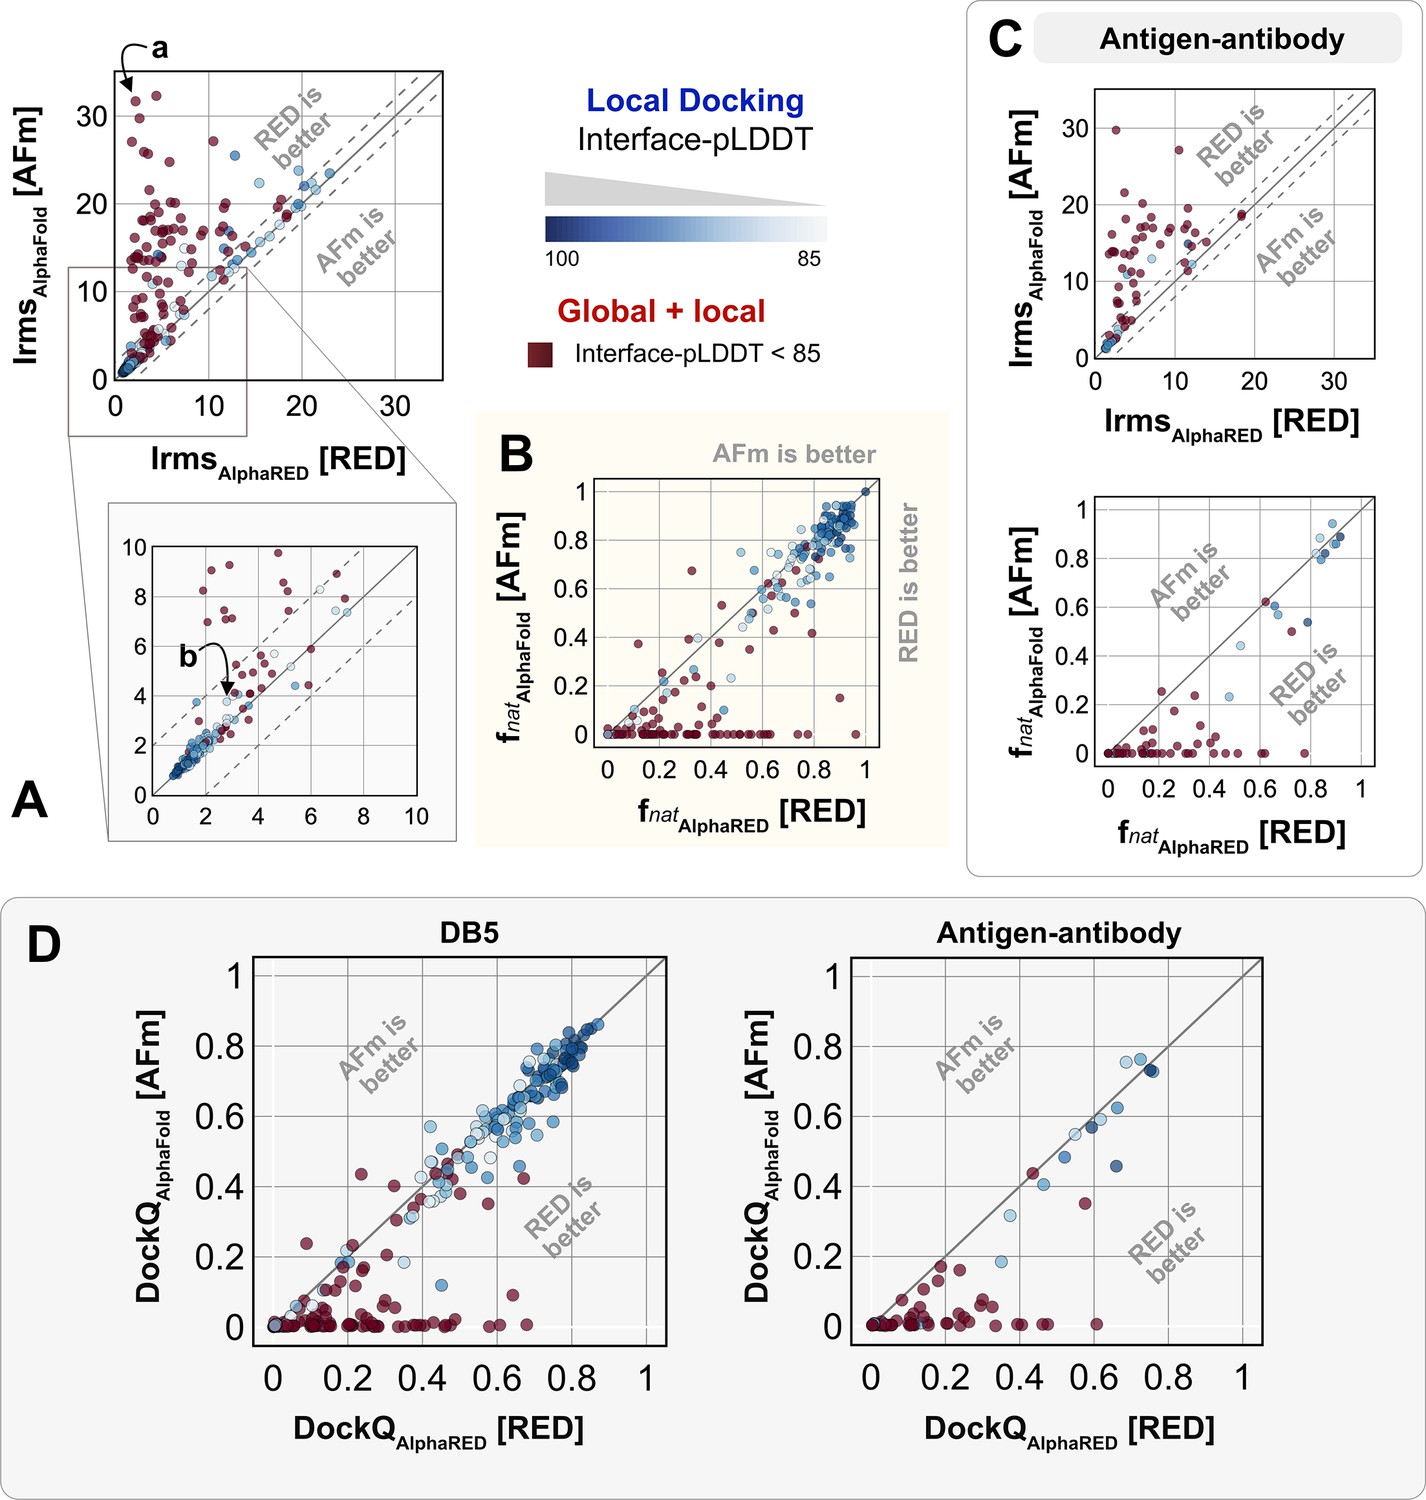
Docking performance.
Targets with interface-predicted local-distance difference test (Interface-pLDDT) ≤ 85 passed first to global rigid docking (red) where targets with interface-pLDDT > 85 proceeded directly to local flexible backbone docking refinement (colored based on their interface-pLDDT scores; in shades of blue). (A) Interface-RMSD from AlphaFold-multimer (AFm) predicted models (y-axis) in comparison with AlphaFold-initiated Replica Exchange Docking (AlphaRED) models (x-axis). (B) Fraction of native-like contacts for models from AFm and AlphaRED, respectively. (a) and (b) indicate two targets (global and local docking) highlighted in Figure 6. (C) Performance on the subset of antigen–antibody targets in DB5.5. (D) DockQ scores for the benchmark targets (DB5) and antibody–antigen complexes.
-
Figure 5—source data 1
Performance of AlphaFold-initiated Replica Exchange Docking (AlphaRED) and AlphaFold-multimer (AFm) on Docking Benchmark Set 5.5.
- https://cdn.elifesciences.org/articles/94029/elife-94029-fig5-data1-v1.xlsx
Figure 6
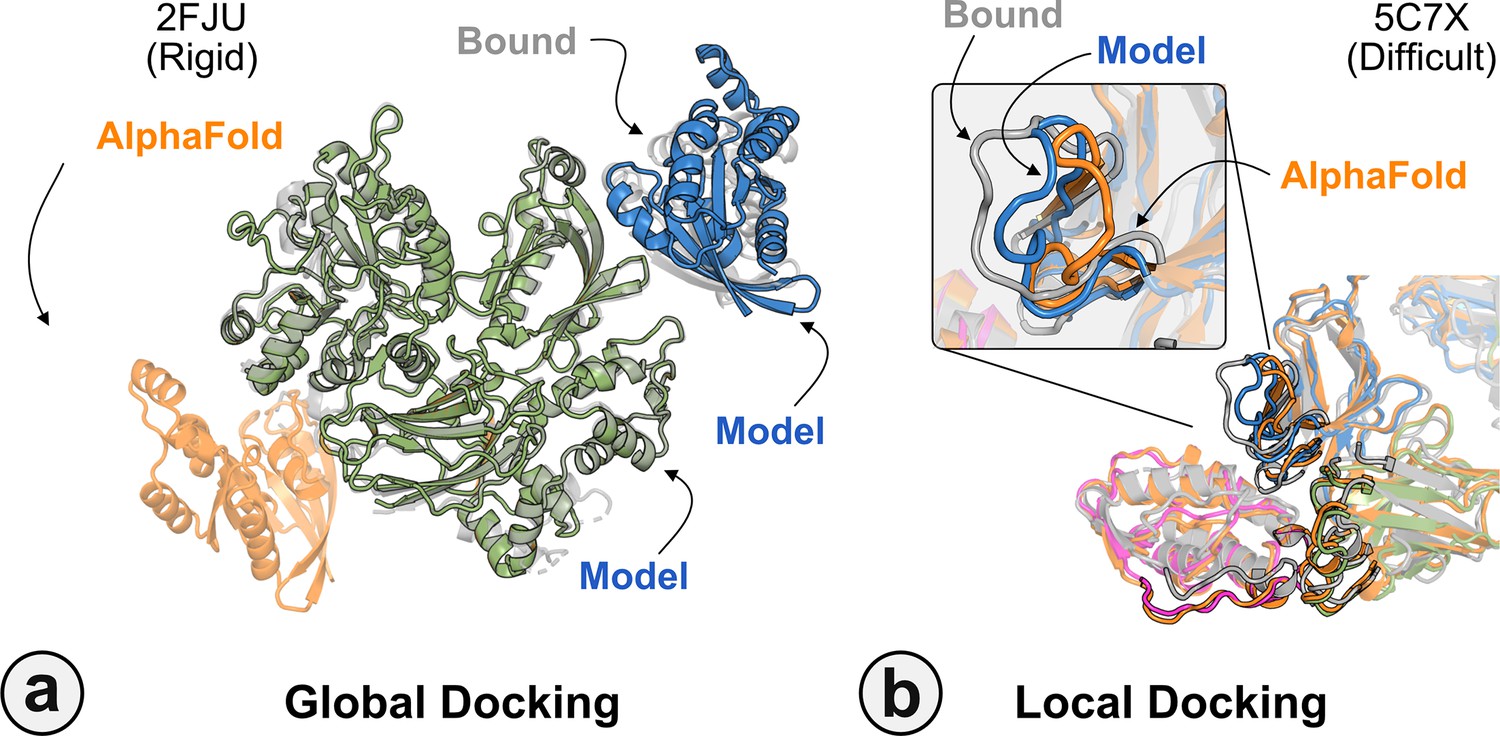
Global and local docking performance.
Docking performance for targets (a) activated Rac1 bound to phospholipase Cβ2 (2FJU), and (b) neutralizing anti-human antibody Fab fragment in complex with human GM-CSF (5C7X).Starting from the AlphaFold-multimer (AFm) model (orange), global docking performance on 2FJU shows native-like binding site (gray) and sampled AlphaFold-initiated Replica Exchange Docking (AlphaRED) decoy (blue). For local docking, backbone sampling on mobile residues predicted by residue pLDDT (outlined cartoon) shows AlphaRED decoy (blue) moves backbone toward the bound form (gray).
Figure 7
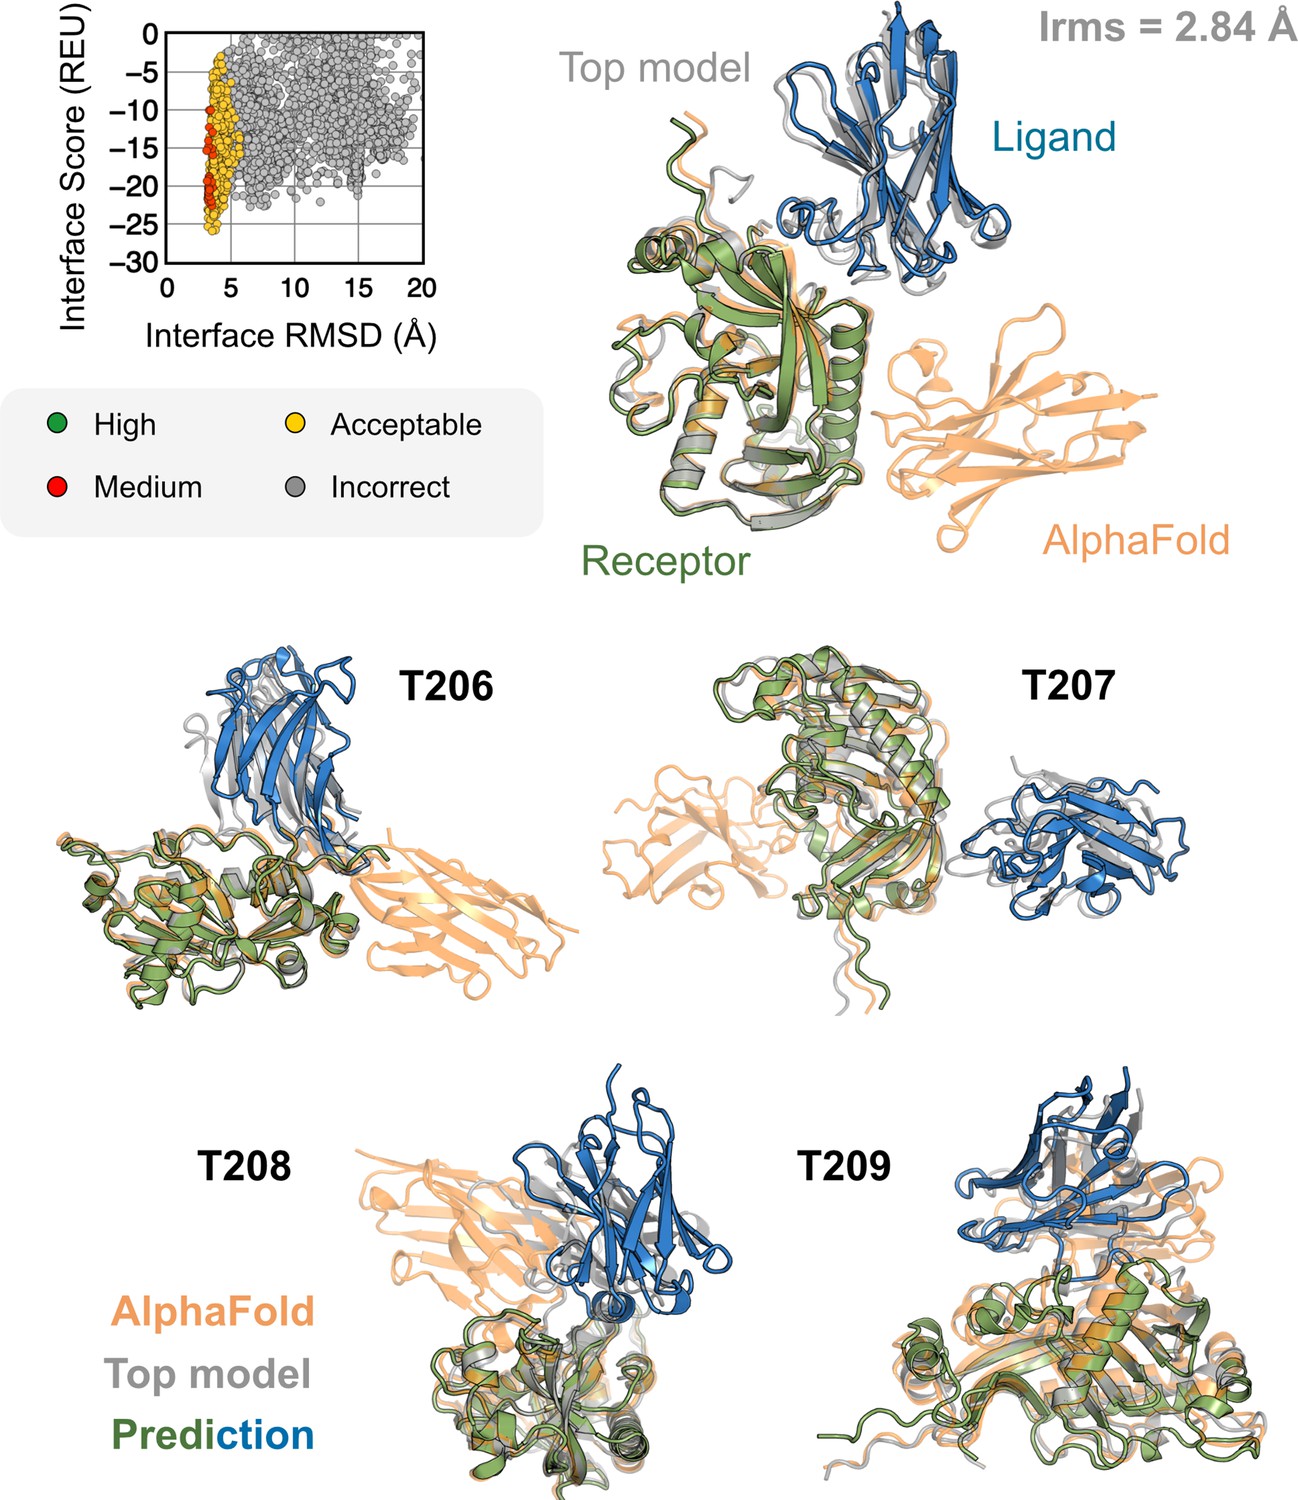
AlphaFold-multimer (AFm) and AlphaFold-initiated Replica Exchange Docking (AlphaRED) performance on CASP15 targets.
Docking performance for CASP targets T205-T209. (Top) T205. Interface score (Rosetta Energy Units, REU) vs. Interface root mean square deviation (RMSD) (Å) for candidate docking structures generated by the AlphaRED docking pipeline. (Top-right) The top-scoring AlphaRED model (green-blue) recapitulates the native interface (gray) and has an interface RMSD of 2.84 Å. The distinction between the predicted model with respect to the AFm model (orange) is evident (bottom) Top-scoring AlphaRED predictions for targets T206, T207, T208, and T209, respectively.
Figure 8
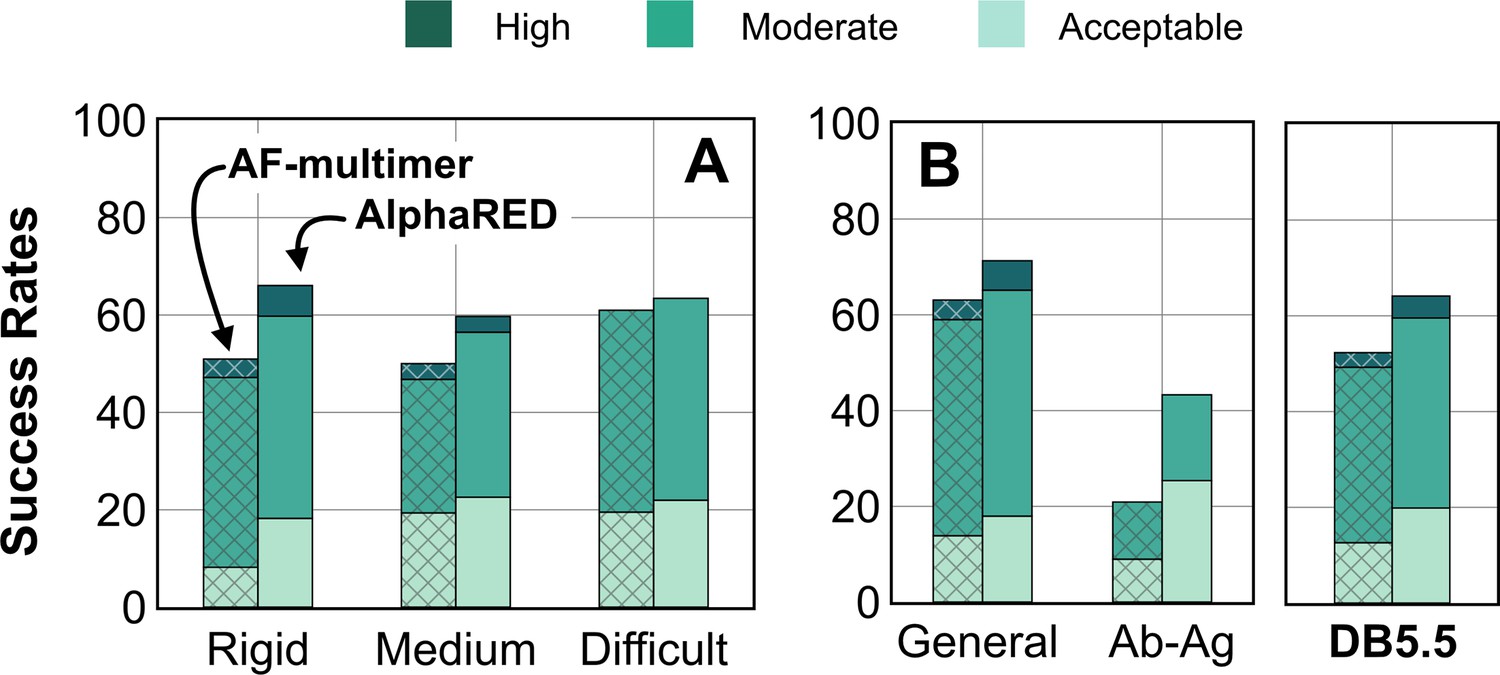
Docking prediction success with AlphaFold-multimer (AFm) and AlphaFold-initiated Replica Exchange Docking (AlphaRED).
Comparison of AFm (hashed) and AlphaRED performance for DB5.5 benchmark set. Success rates evaluated based on DockQ criteria: incorrect: DockQ < 0.23; acceptable: DockQ ∈(0.23,0.49]; medium: DockQ ∈(0.49,0.8]; high: DockQ ≥0.8. (A) Classification based on the scale of flexibility: difficult (35 targets); medium (60 targets); rigid (159 targets). (B) Performance on the antibody–antigen complexes (67 targets) and other (non-antibody targets).
Appendix 1—figure 1
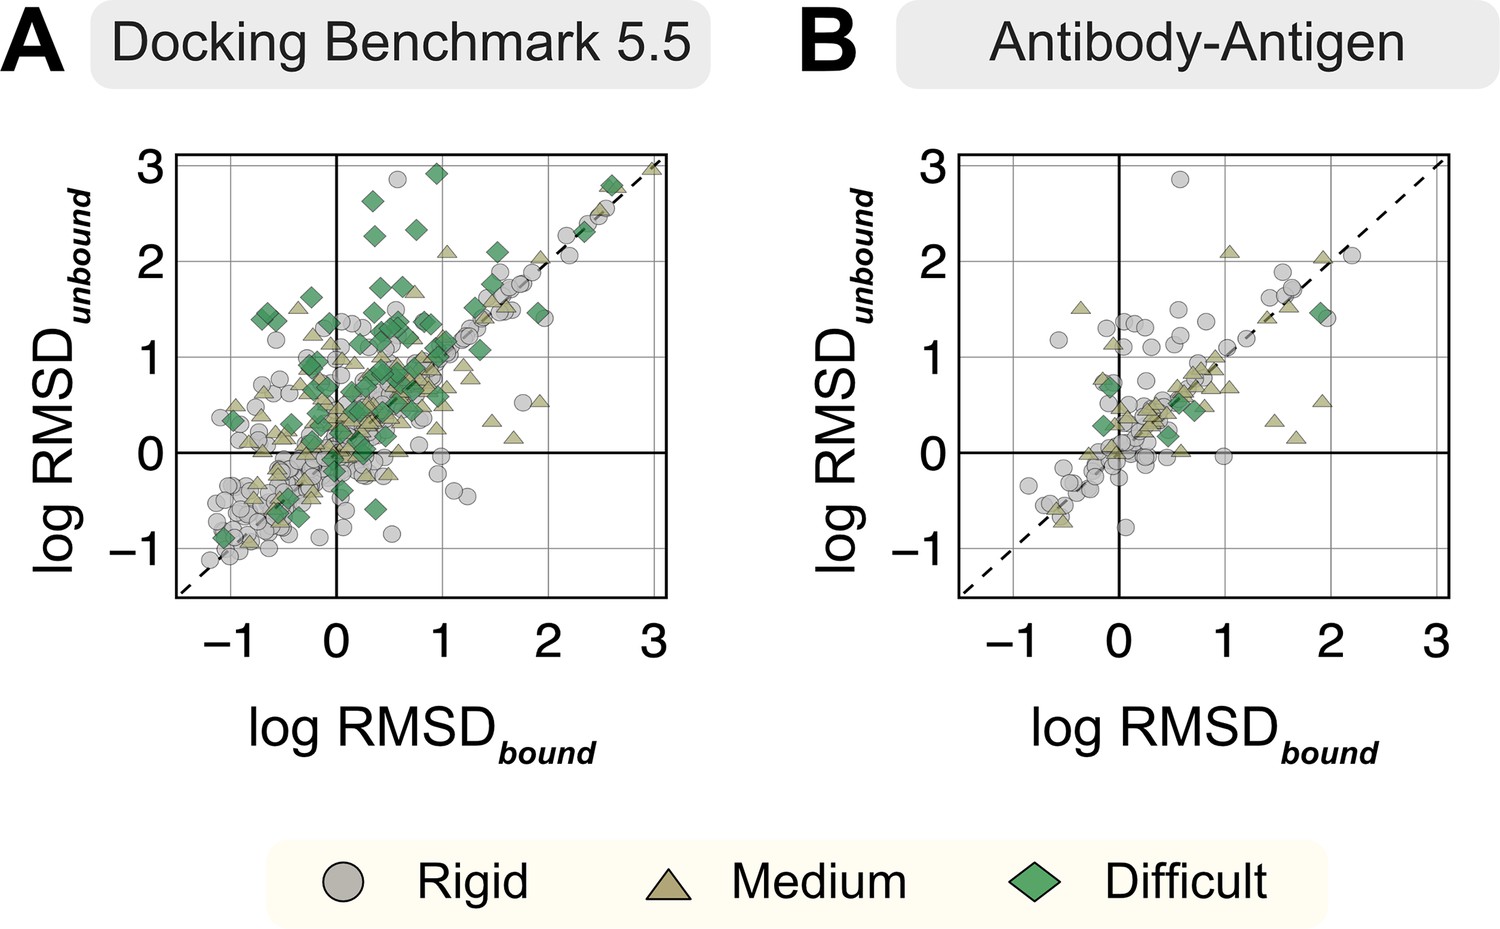
Root mean square deviations (RMSDs) of AlphaFold-multimer structures from experimental unbound and bound structures.
Distribution of the RMSD between the AlphaFold-multimer prediction top-ranked model and the experimental unbound and bound structures. For each target, the protein partners are split into receptor and ligand respectively for comparison. Each symbol represents a category of flexibility (rigid, medium, and flexible). (A) Dockground Benchmark set 5.5; (B) antibody/nanobody–antigen targets from the benchmark.
Appendix 1—figure 2
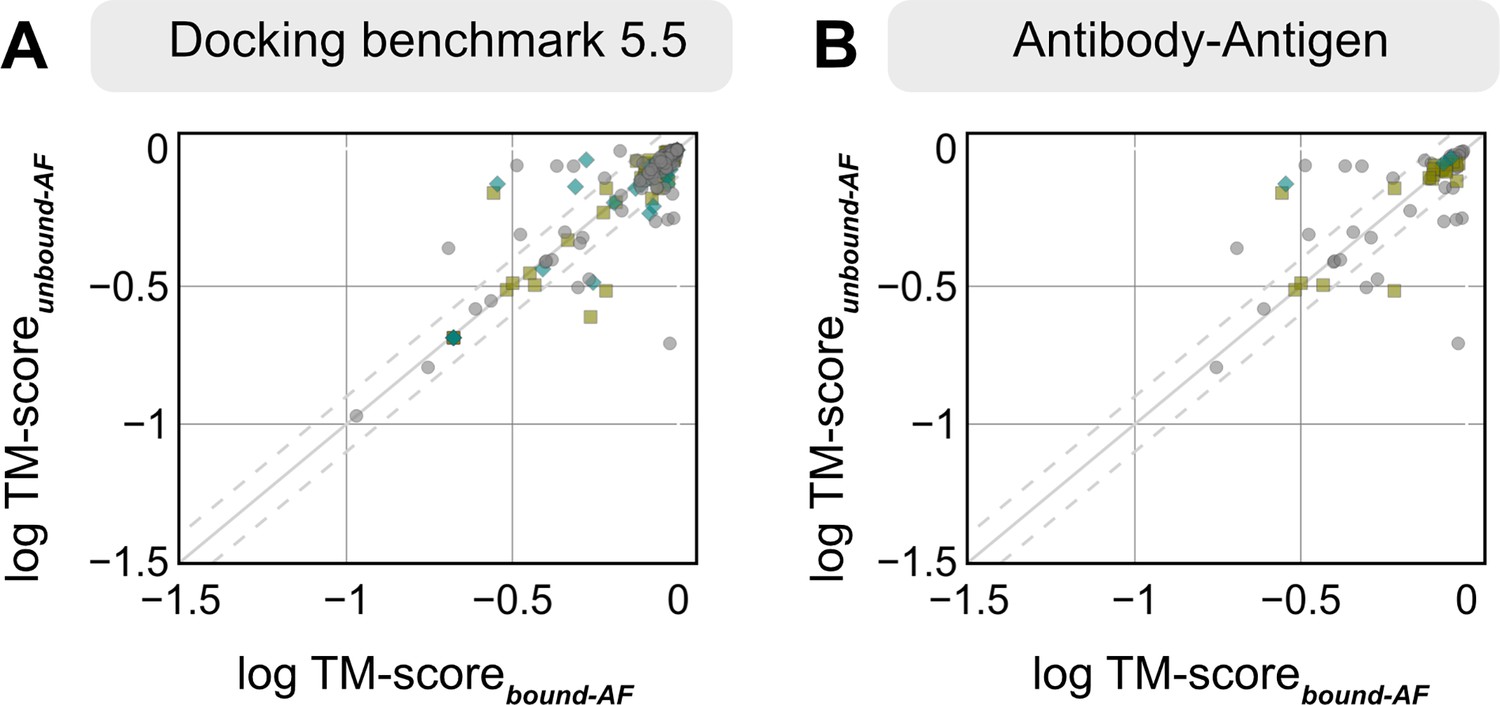
TM-scores of AlphaFold-multimer structures from experimental unbound and bound structures.
Distribution of the TM-score between the AlphaFold-multimer prediction top-ranked model and the experimental unbound and bound structures. For each target, the protein partners are split into receptor and ligand respectively for comparison. Each symbol represents a category of flexibility (rigid, medium, and flexible). (A) Dockground Benchmark set 5.5; (B) antibody/nanobody–antigen targets from the benchmark.
Additional files
Download links
A two-part list of links to download the article, or parts of the article, in various formats.
Downloads (link to download the article as PDF)
Open citations (links to open the citations from this article in various online reference manager services)
Cite this article (links to download the citations from this article in formats compatible with various reference manager tools)
Reliable protein–protein docking with AlphaFold, Rosetta, and replica exchange
eLife 13:RP94029.
https://doi.org/10.7554/eLife.94029.3


