SntB triggers the antioxidant pathways to regulate development and aflatoxin biosynthesis in Aspergillus flavus
- Key Laboratory of Pathogenic Fungi and Mycotoxins of Fujian Province, Key Laboratory of Biopesticide and Chemical Biology of Education Ministry, Proteomic Research Center, and School of Life Sciences, Fujian Agriculture and Forestry University, China
- Institute of Edible Mushroom, Fujian Academy of Agricultural Sciences, China
- College of Animal Sciences, Fujian Agriculture and Forestry University, China
- State Key Laboratory of Pathogen and Biosecurity, Institute of Microbiology and Epidemiology, Academy of Military Medical Sciences (AMMS), China
Figures
Figure 1 with 2 supplements
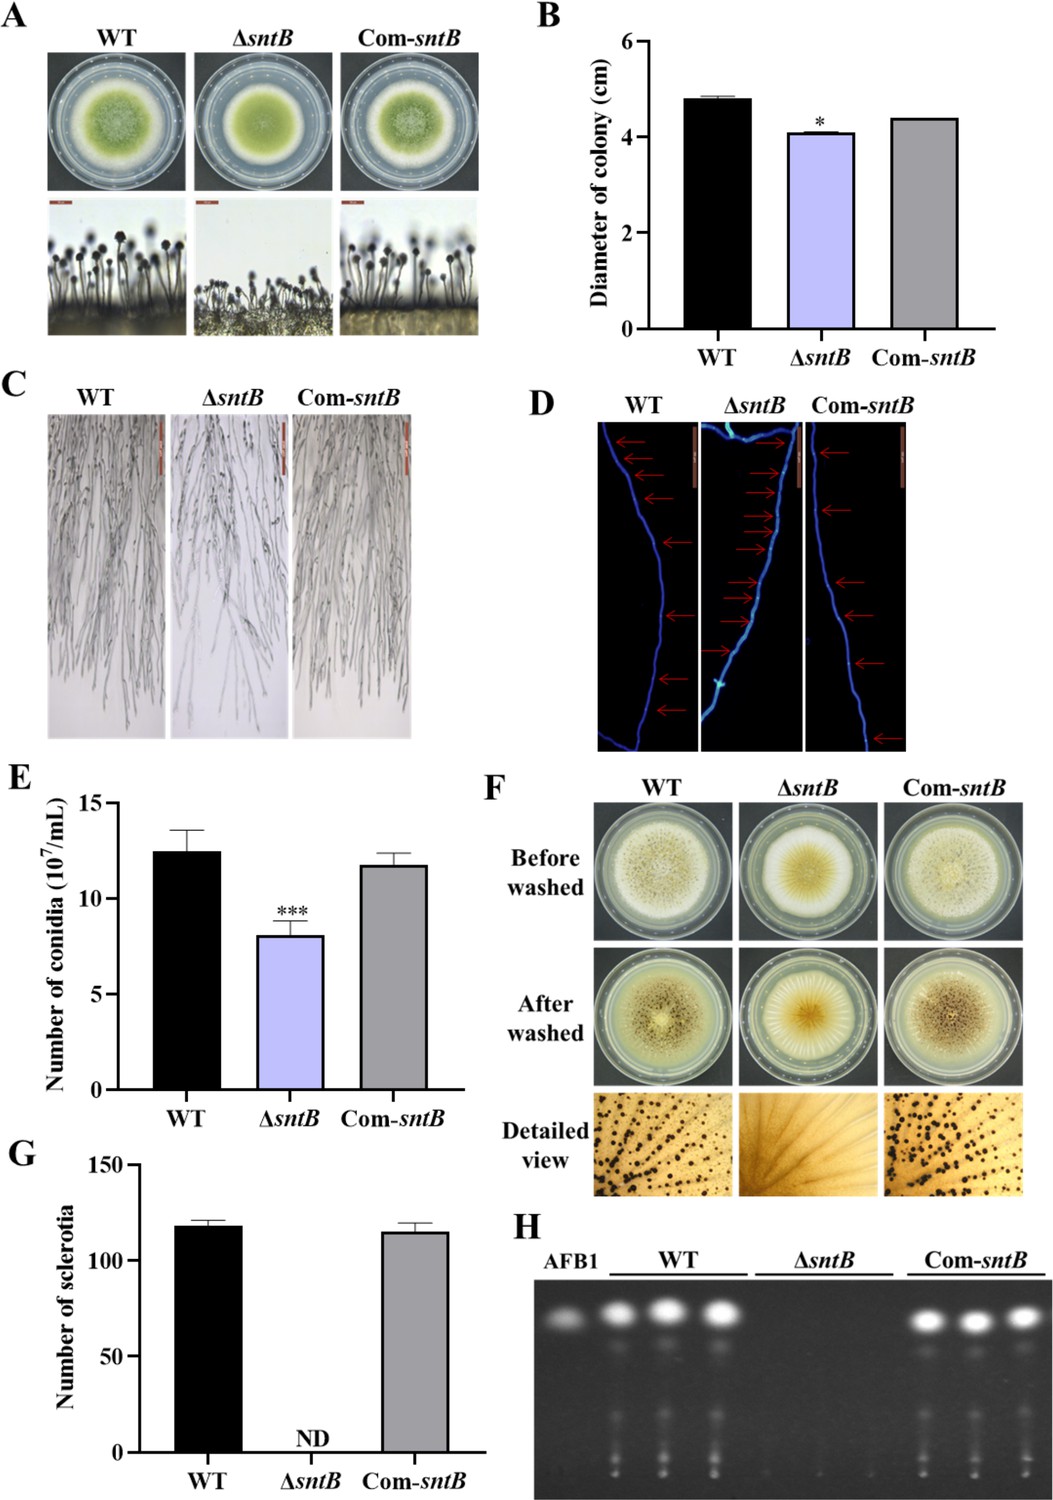
The functions of SntB in A. flavus.
(A) The colonies of wild-type (WT), ΔsntB, and Com-sntB strains grown on potato dextrose agar (PDA) at 37°C in dark for 4 days. (B) The colony diameter statistics of the above fungal strains. (C) Microscopic examination revealed the difference in mycelia of each fungi strain at 37℃ in dark, scale=200 μm. (D) Microscopic examination of the hyphal septum of each strain at 37℃ in dark, scale=50 μm. (E) The spore production statistics. (F) All the above fungal strains were point-inoculated on CM medium and grown for 7 days at 37℃. (G) The number of sclerotia of the above fungal strains. ND=Not detectable. (H) AFB1 production of the above fungal strains was detected by TLC after the strains incubating at 29℃ in PDB medium for 7 days.
Figure 1—figure supplement 1
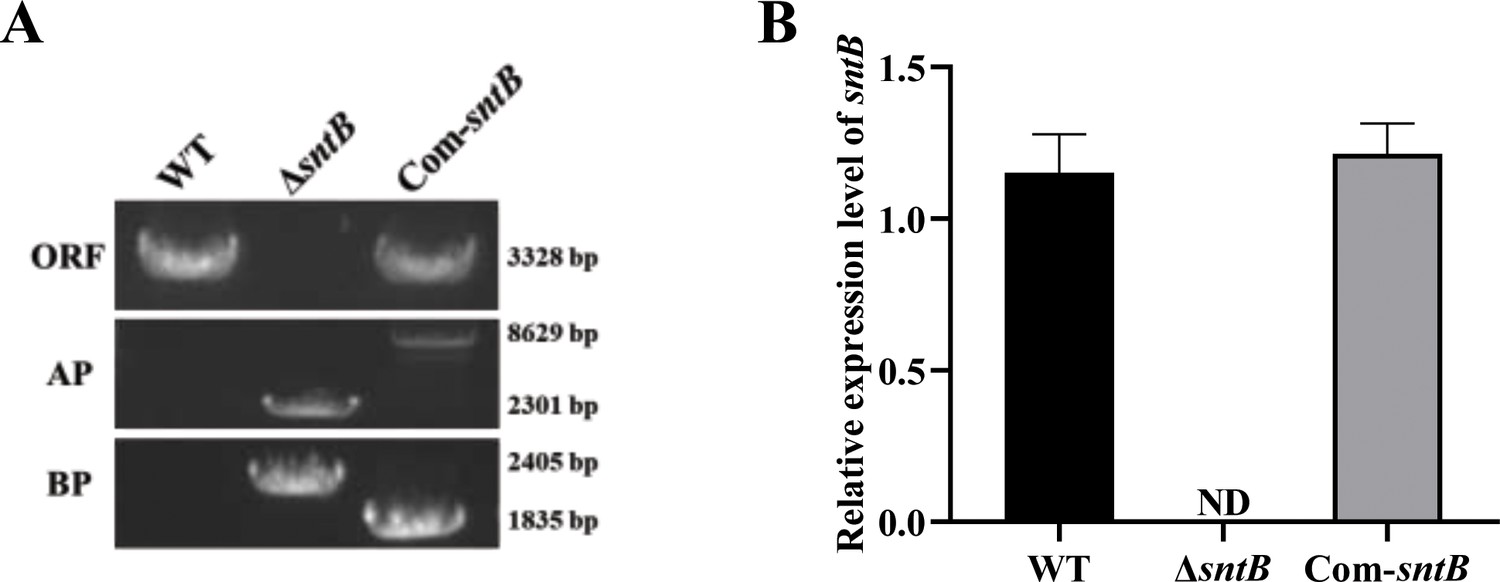
The construction of mutant strains.
(A) PCR verification of gDNA in wild-type (WT), ΔsntB, and Com-sntB strains (‘ORF’ represents the sntB gene fragment, ‘AP’ represents the amplification of the fusion fragment upstream with primers sntB-p1 and P801, and ‘BP’ represents the downstream of the fusion fragment from primers P1020 and sntB-p4). (B) Quantitative RT-PCR (qRT-PCR) verification of the expression level of the sntB gene in WT and sntB gene mutant strains.
-
Figure 1—figure supplement 1—source data 1
Original files for PCR verification of gDNA in wild-type (WT), ΔsntB, and Com-sntB strains in Figure 1—figure supplement 1.
- https://cdn.elifesciences.org/articles/94743/elife-94743-fig1-figsupp1-data1-v1.zip
-
Figure 1—figure supplement 1—source data 2
Original files for PCR verification of gDNA in wild-type (WT), ΔsntB, and Com-sntB strains in Figure 1—figure supplement 1, indicating the relevant bands and treatments.
- https://cdn.elifesciences.org/articles/94743/elife-94743-fig1-figsupp1-data2-v1.zip
Figure 1—figure supplement 2
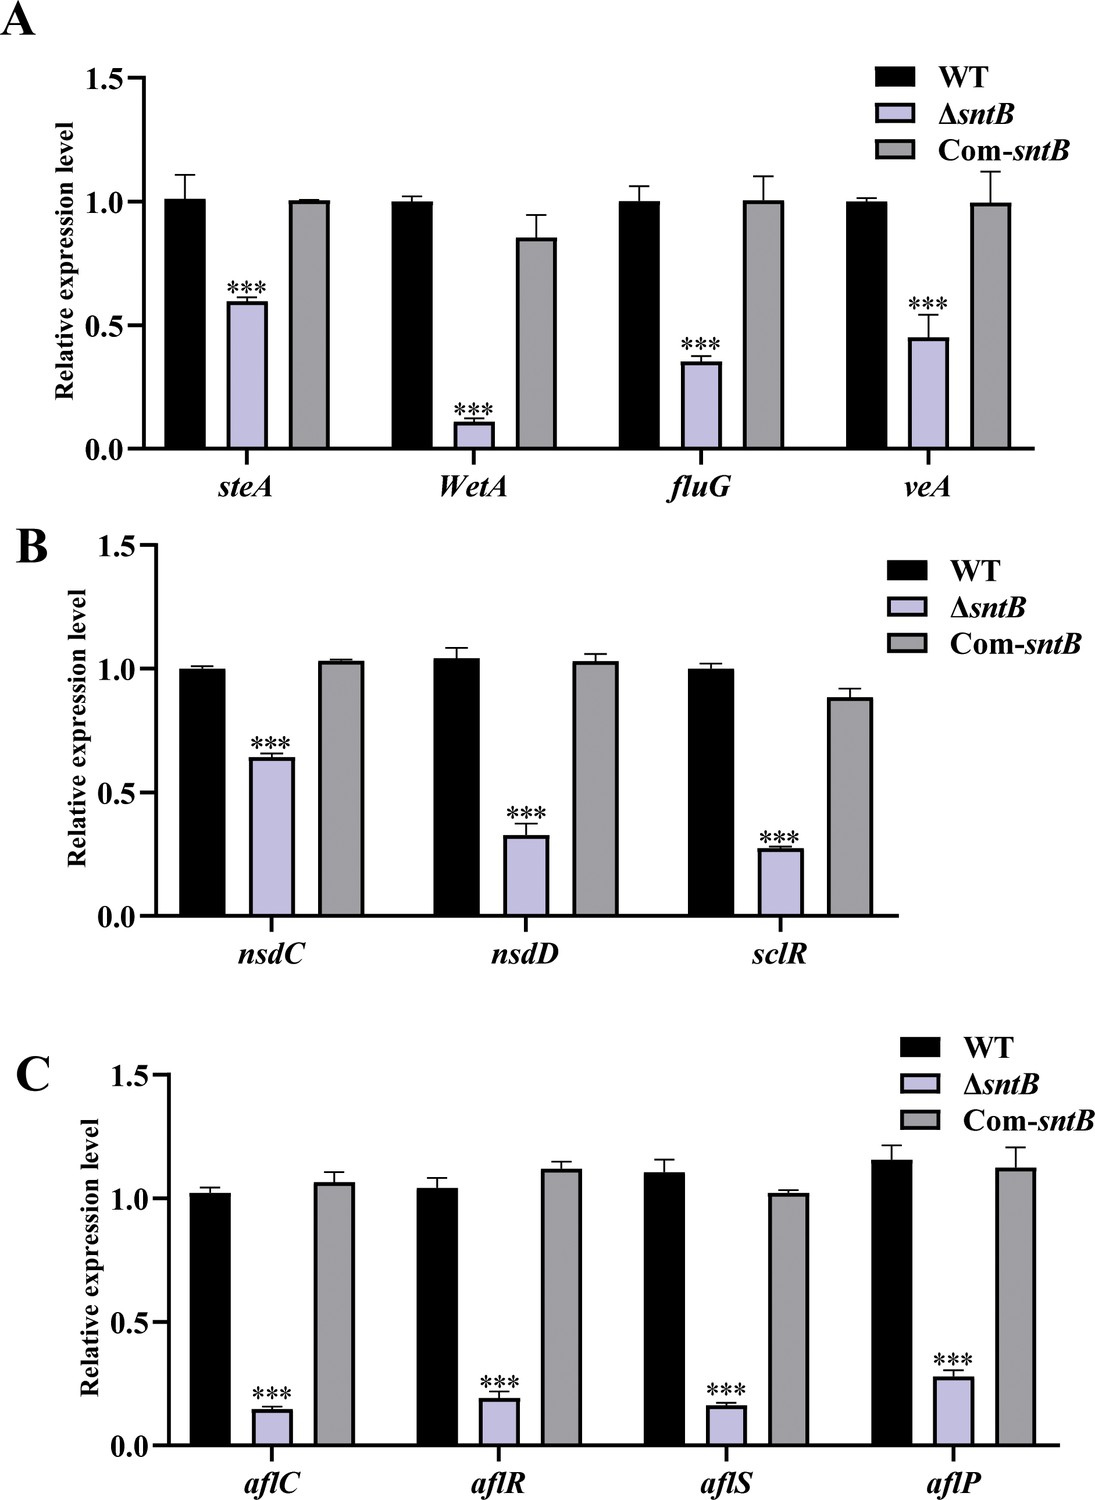
The expression of genes related to sporulation, sclerotia production, and aflatoxin synthesis.
(A) The expression of sporulation-related genes steA, WetA, fluG, and veA in each strain at 48 hr. (B) The expression of sclerotia-associated genes nsdC, nsdD, and sclR in each strain at 48 hr. (C) The expression of aflatoxin-associated genes in each strain at 48 hr. The asterisk *** above the bars represents significantly different (p<0.001).
Figure 2 with 1 supplement
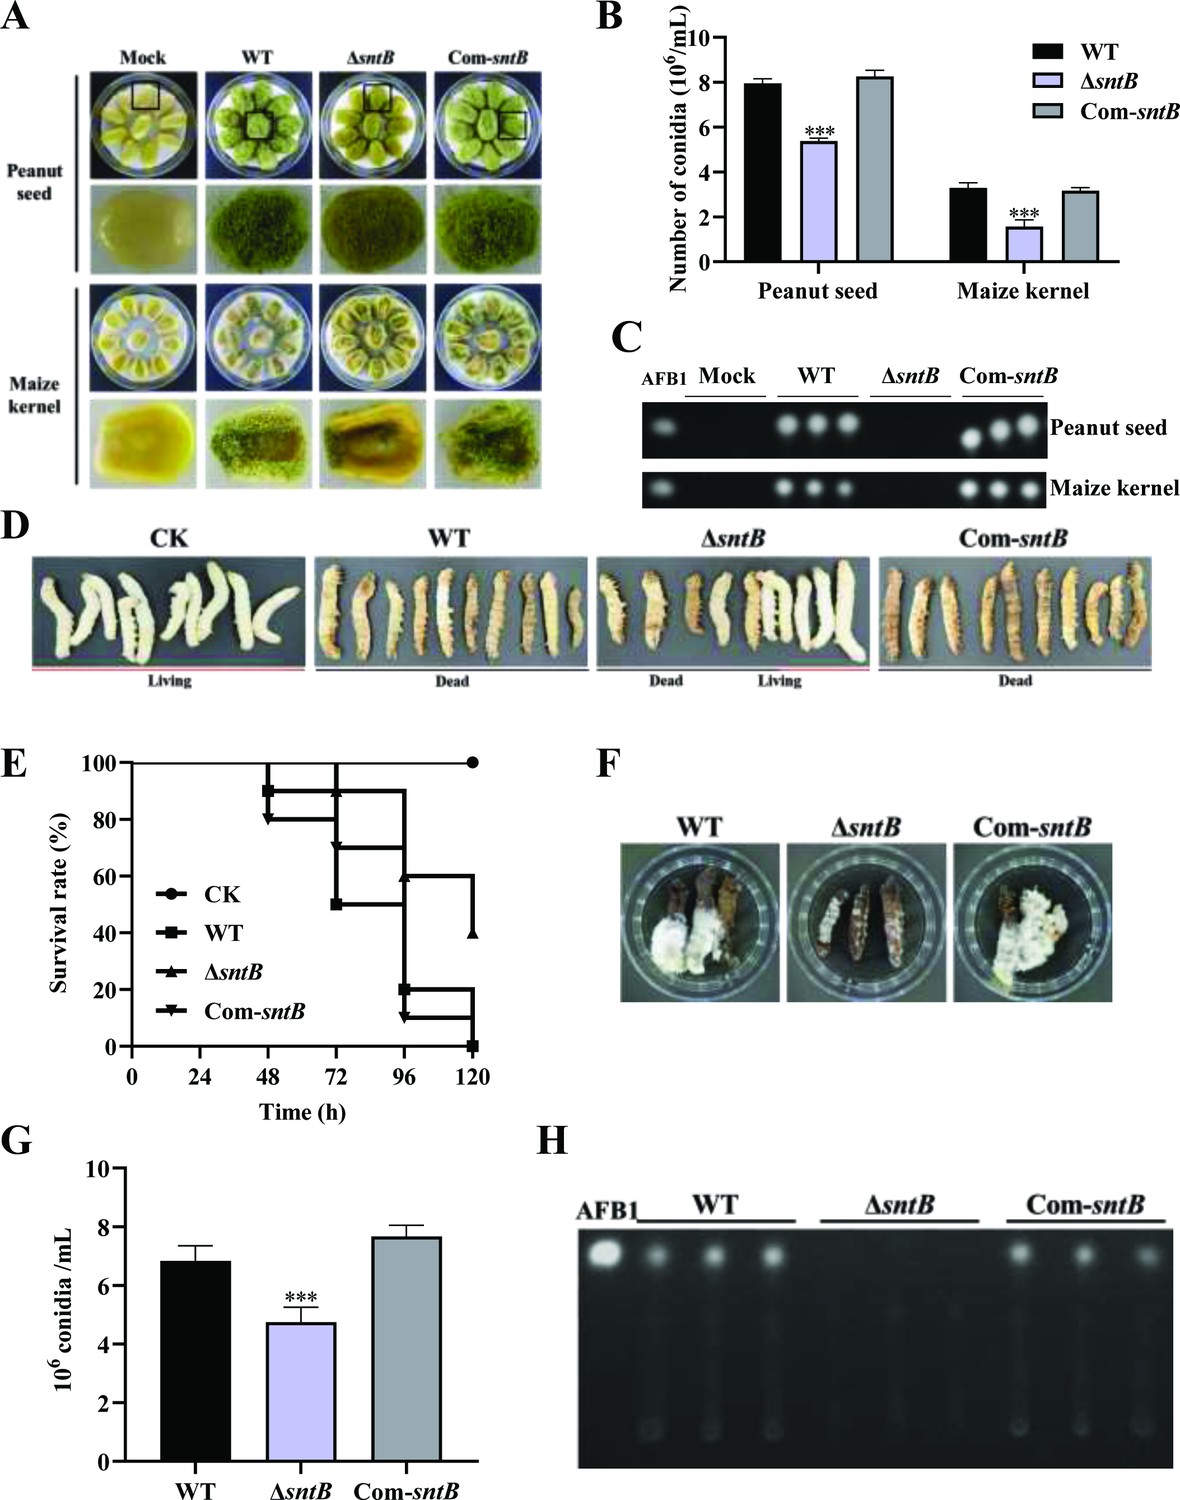
The role of SntB on the ability of A. flavus to colonize host.
(A) Phenotype of peanut and maize kernels colonized by ΔsntB, Com-sntB, and wild-type (WT) strains at 29°C in dark for 7 days. (B) Statistical of the number of conidia on the surface of peanut and maize kernels. (C) TLC analysis to detect the yield of AFB1 in kernels infected by the above fungal strains after 7 days incubation. (D) Photographs of the silkworms infected by the above fungal strains. (E) The survival rate of silkworms in 5 days after injection of the above strains. (F) Photographs of the dead silkworms infected by A. flavus after 6 days incubation. (G) The spore production statistics of the above fungal strains on the dead silkworms shown in (F). (H) TLC analysis of AFB1 levels produced in infected dead silkworms in (F).
Figure 2—figure supplement 1
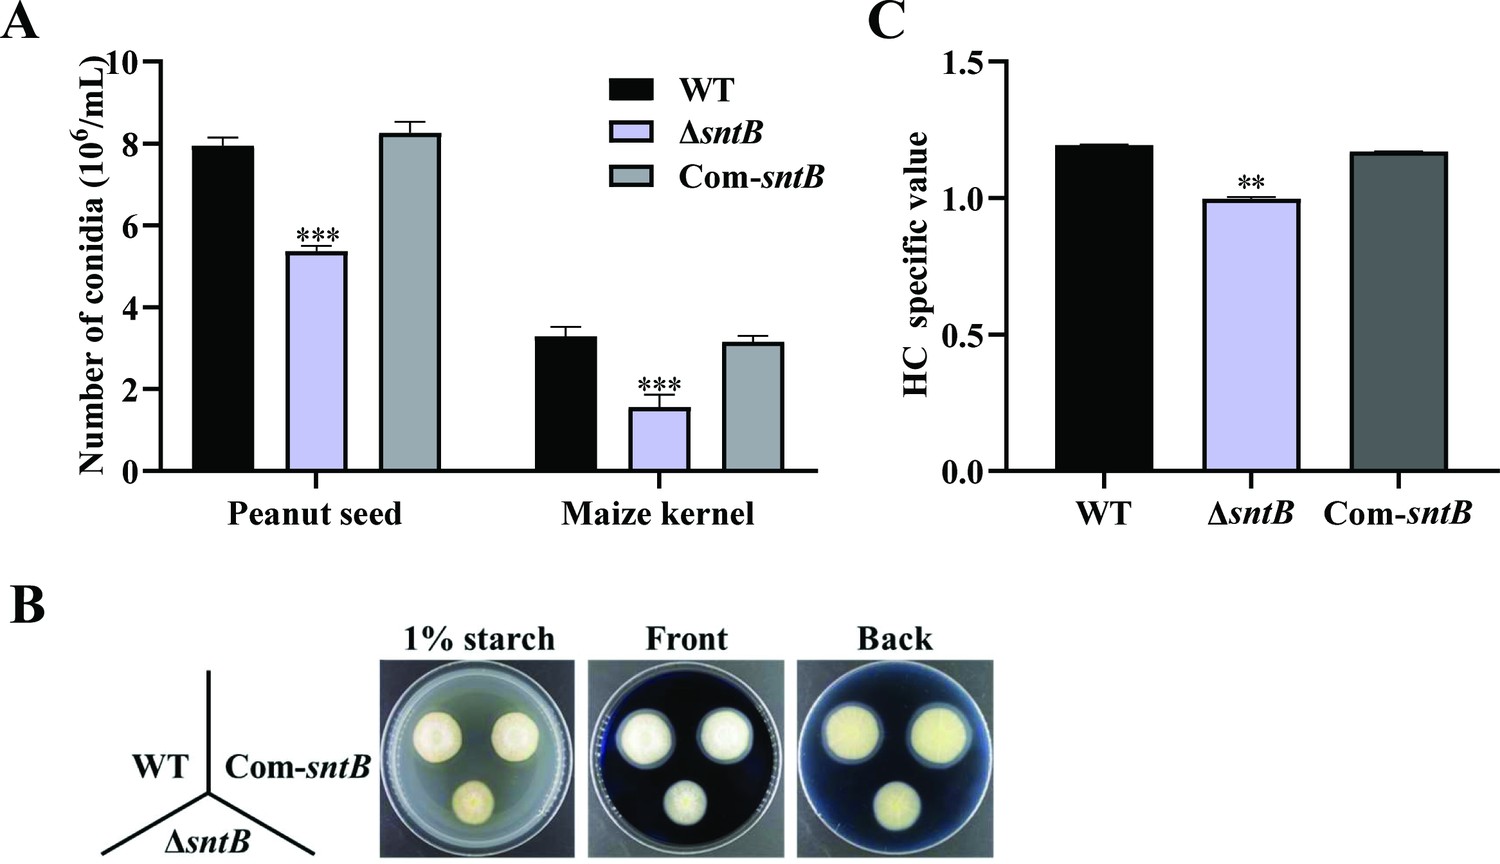
The changes of number of conidia, amylase, and lipase in wild-type (WT), ΔsntB, and Com-sntB strains.
(A) Statistics of the number of conidia on the corn seed. (B) The phenotype of each strain on starch screening medium supplemented with 0.1% of soluble starch in darkness at 29°C for 3 days, followed by the addition of iodine solution. (C) HC value of the clear circle (outer diameter/inner diameter) of the salient analysis of the map. The asterisk ** above the bars represents significantly different (p<0.01).
Figure 3 with 1 supplement
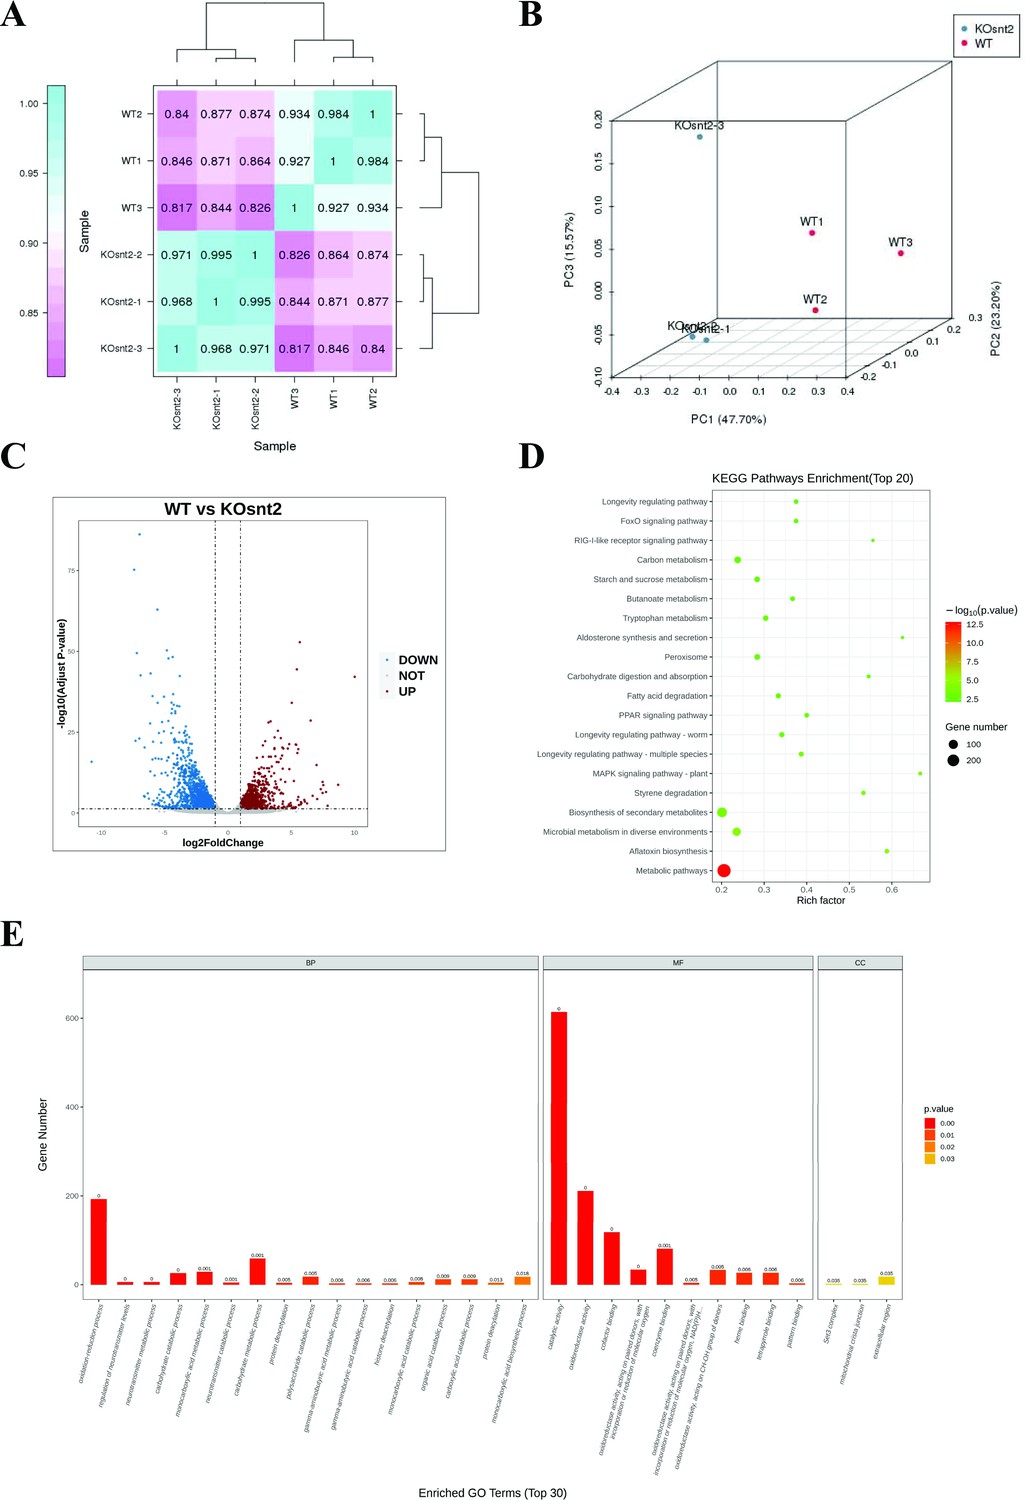
SntB chords global gene expression in A. flavus.
(A) The Pearson correlation results shown by heatmap. (B) Principal component analysis (PCA) on six fungal samples, including three ΔsntB (KOsnt2) and three wild-type (WT) samples. (C) Volcano map reflecting the distribution of the differentially expressed genes. (D) Kyoto encyclopedia of genes and genomes (KEGG) analyses of the differentially expressed genes. (E) Gene ontology (GO) analyses of the differentially expressed genes.
Figure 3—figure supplement 1

Heatmap of the differentially expressed genes (DEGs) related to oxidative response in transcriptome data drawn by TBtools.
Figure 4 with 1 supplement
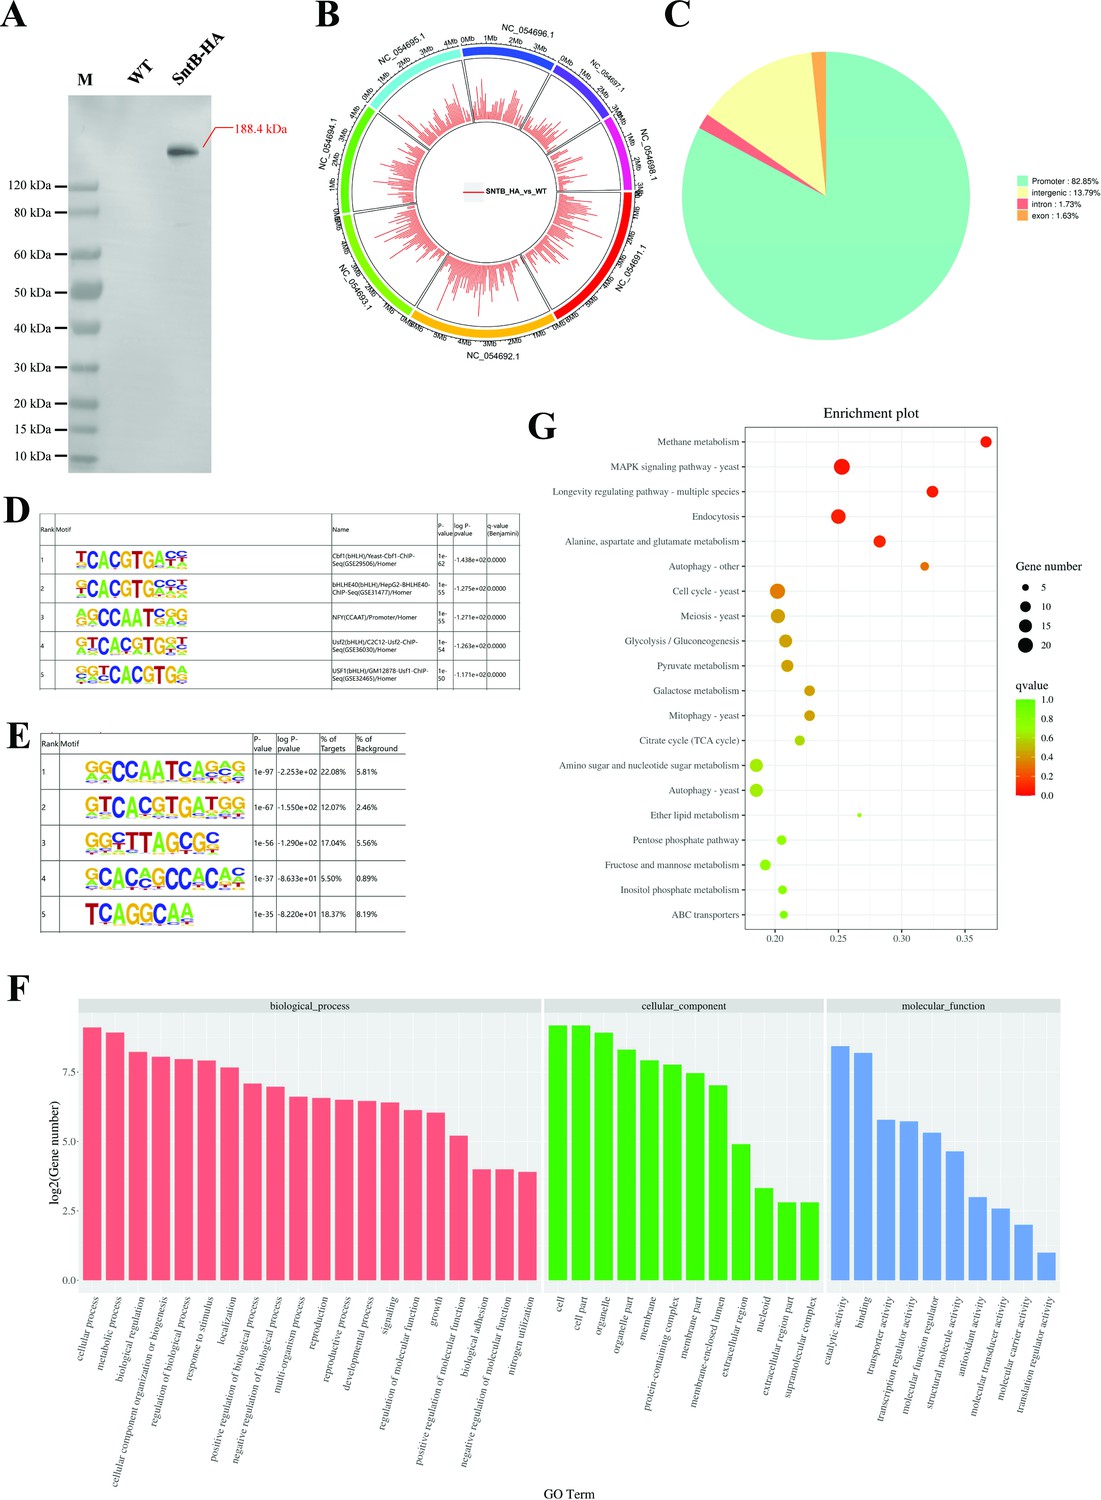
Characterization of the binding regions of SntB.
(A) Verification of the construction of sntB-HA strain using western blot. M means the protein marker of PAGE-MASTER Protein Standard Plus (GenScript USA, MM1397). (B) The distribution of differently accumulated peaks on the genome. (C) Vennpie map of the differently accumulated peaks distribution on gene functional elements. (D) Enrichment of known motifs showing the top-ranked motif logos. (E) Enrichment of de novo motifs showing the top-ranked motif logos. (F) Gene ontology (GO) analyses of the differently accumulated peak-related genes. (G) Kyoto encyclopedia of genes and genomes (KEGG) analyses of the differently accumulated peak-related genes.
-
Figure 4—source data 1
Original files for western blot analysis displayed in Figure 4A.
- https://cdn.elifesciences.org/articles/94743/elife-94743-fig4-data1-v1.zip
-
Figure 4—source data 2
Original files for western blot analysis displayed in Figure 4A, indicating the relevant bands and treatments.
- https://cdn.elifesciences.org/articles/94743/elife-94743-fig4-data2-v1.zip
Figure 4—figure supplement 1
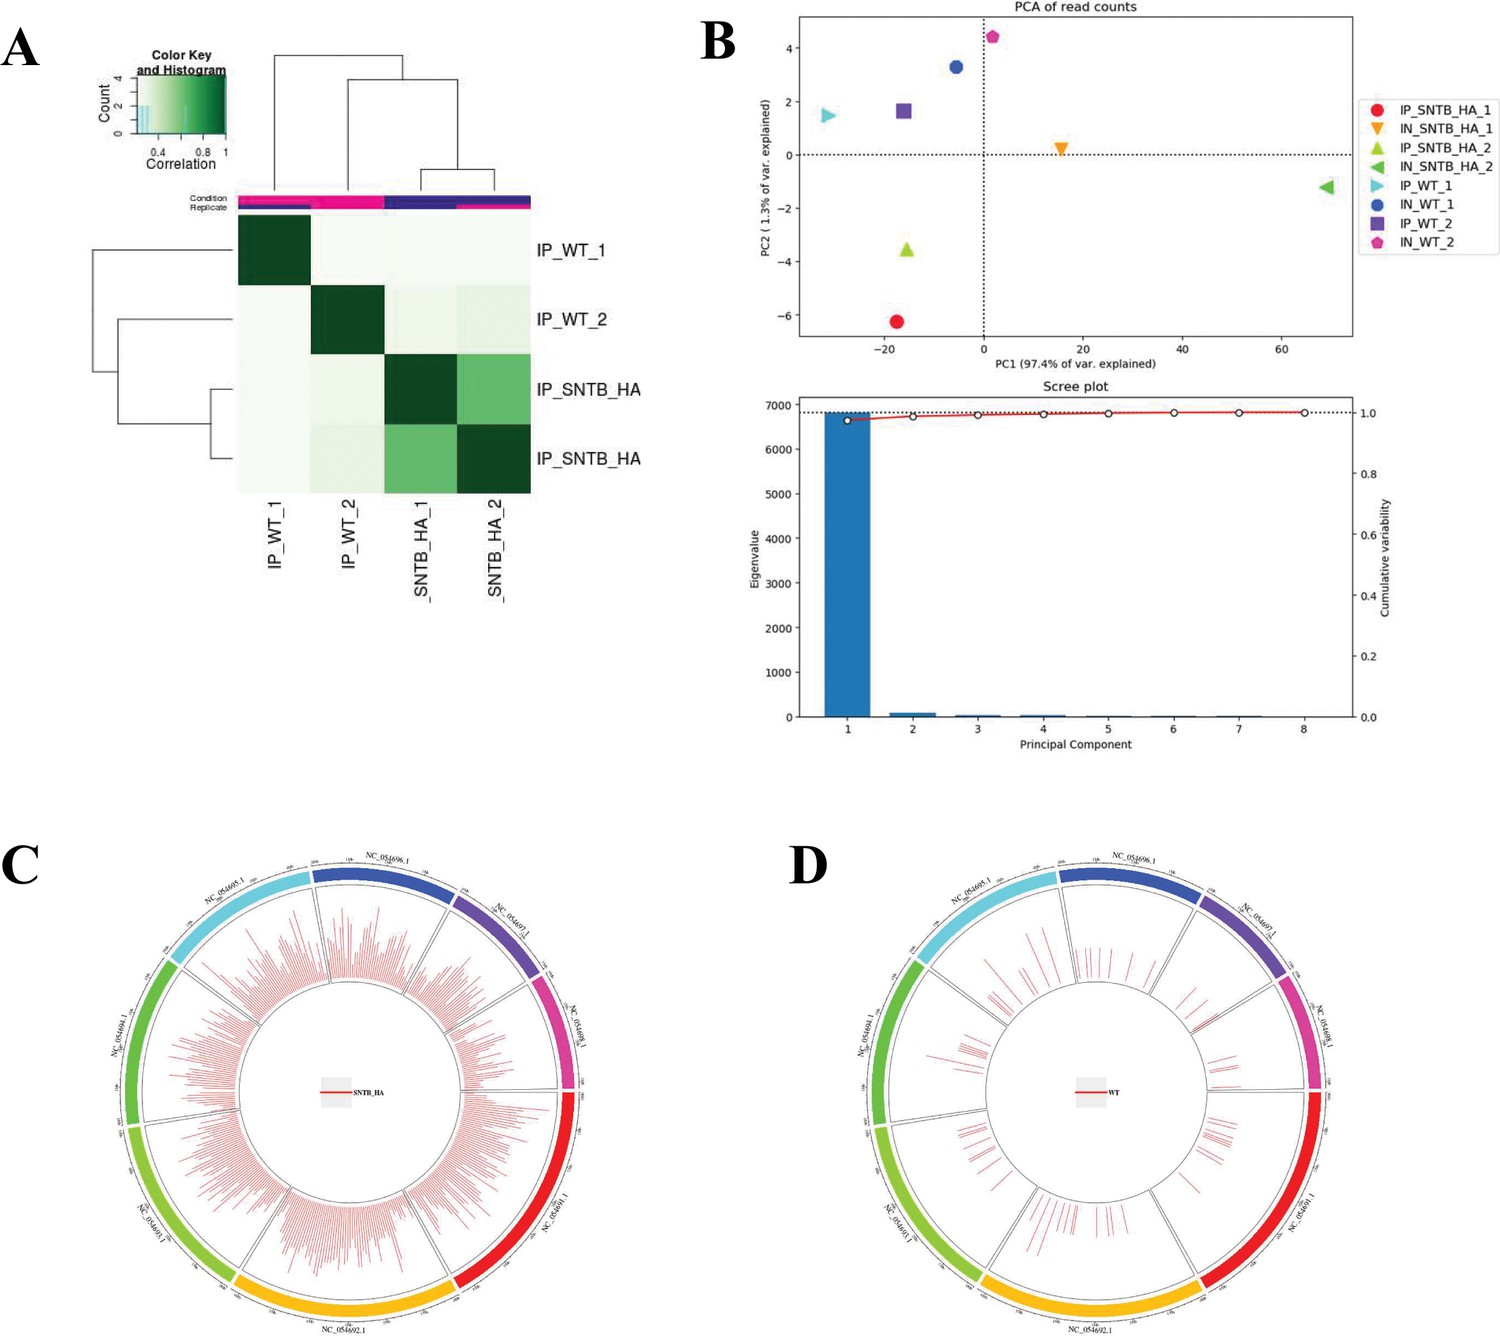
Sequence information of chromatin immunoprecipitation sequencing (ChIP-seq).
(A) Heatmap. (B) Principal component analysis (PCA). (C) Peak distribution on the genome of SNTB-HA group. (D) Peak distribution on the genome of wild-type (WT) group.
Figure 5
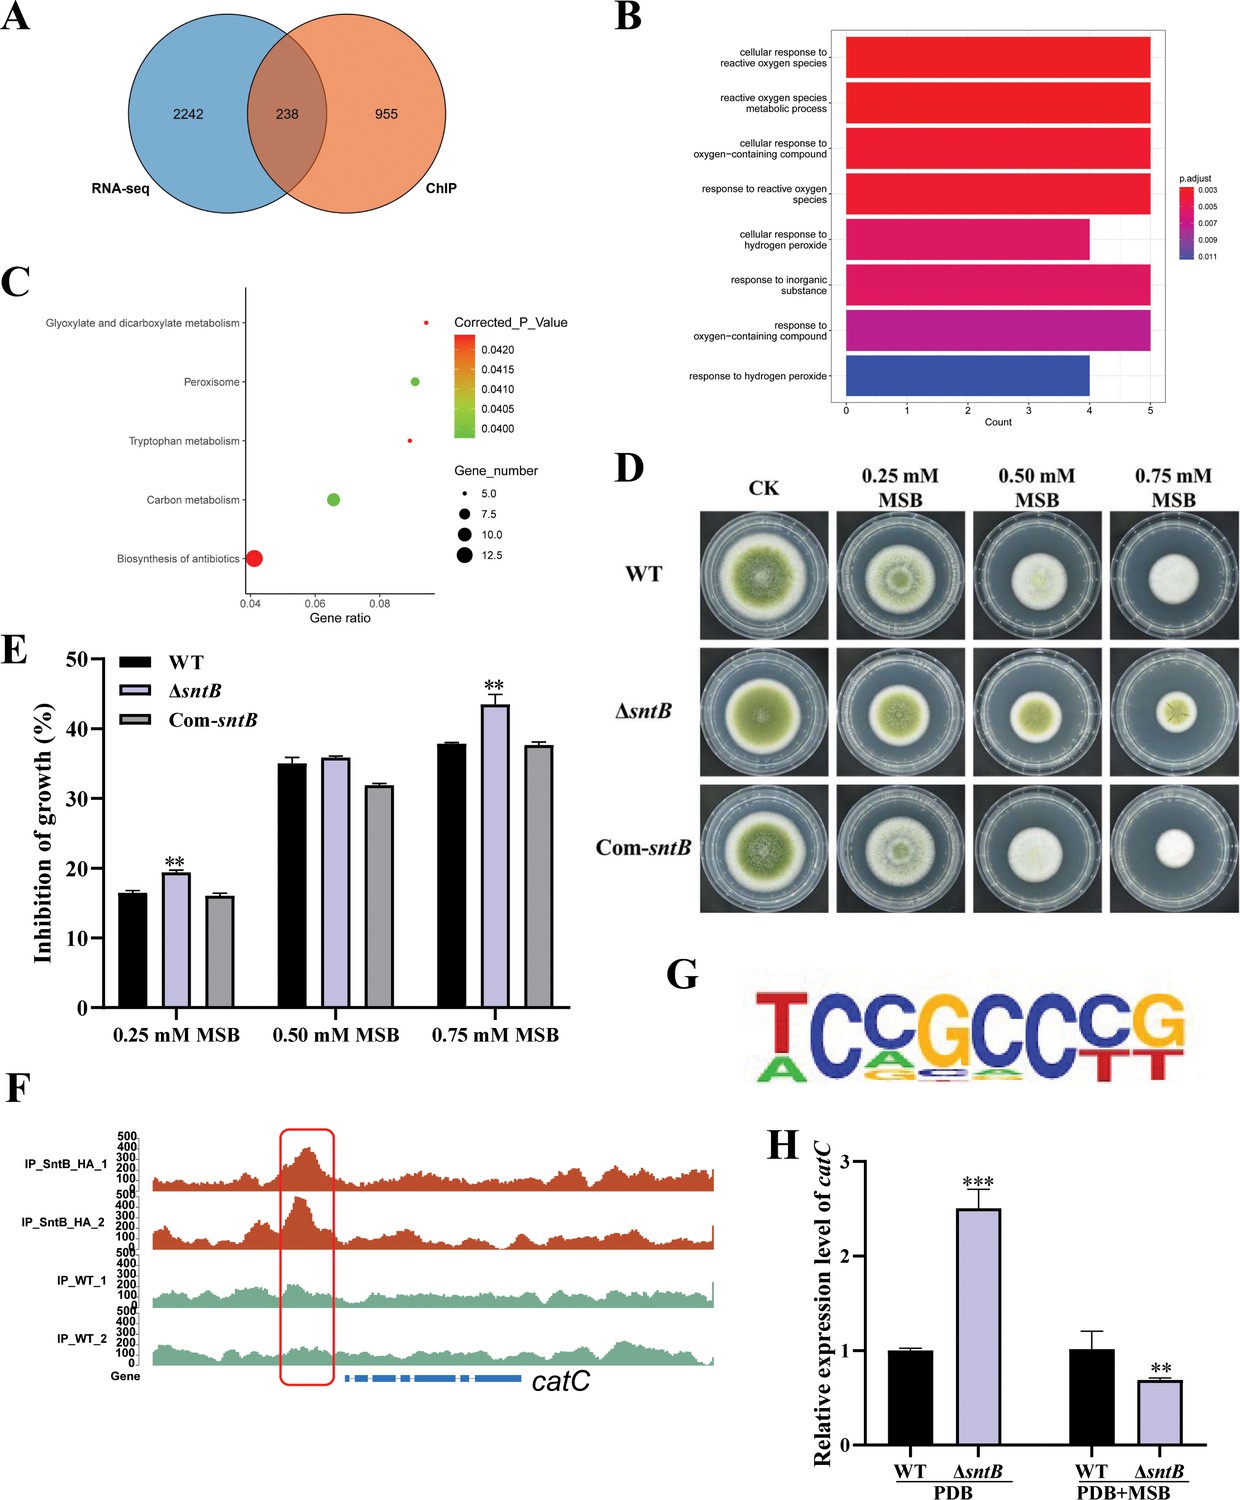
Integration of the results of chromatin immunoprecipitation sequencing (ChIP-seq) and RNA sequencing (RNA-seq) assays.
(A) Venn diagrams of ChIP-seq and RNA-seq. (B) Gene ontology (GO) analyses of the common genes. (C) Kyoto encyclopedia of genes and genomes (KEGG) analyses of the common genes. (D) The phenotype of wild-type (WT), ΔsntB, and Com-sntB strains cultured in PDA containing a series concentration of menadione sodium bisulfite (MSB) for 3 days. (E) Statistical analysis of the growth inhibition rate of MSB to all the above fungal strains according to Panel D. (F) Comparison of the enrich levels of the SntB binding region of catC gene between WT and sntB-HA strains. (G) The motif logo in the SntB binding region of catC gene. (H) The relative expression level of catC in WT and ΔsntB strains with or without MSB treatment.
Figure 6 with 2 supplements
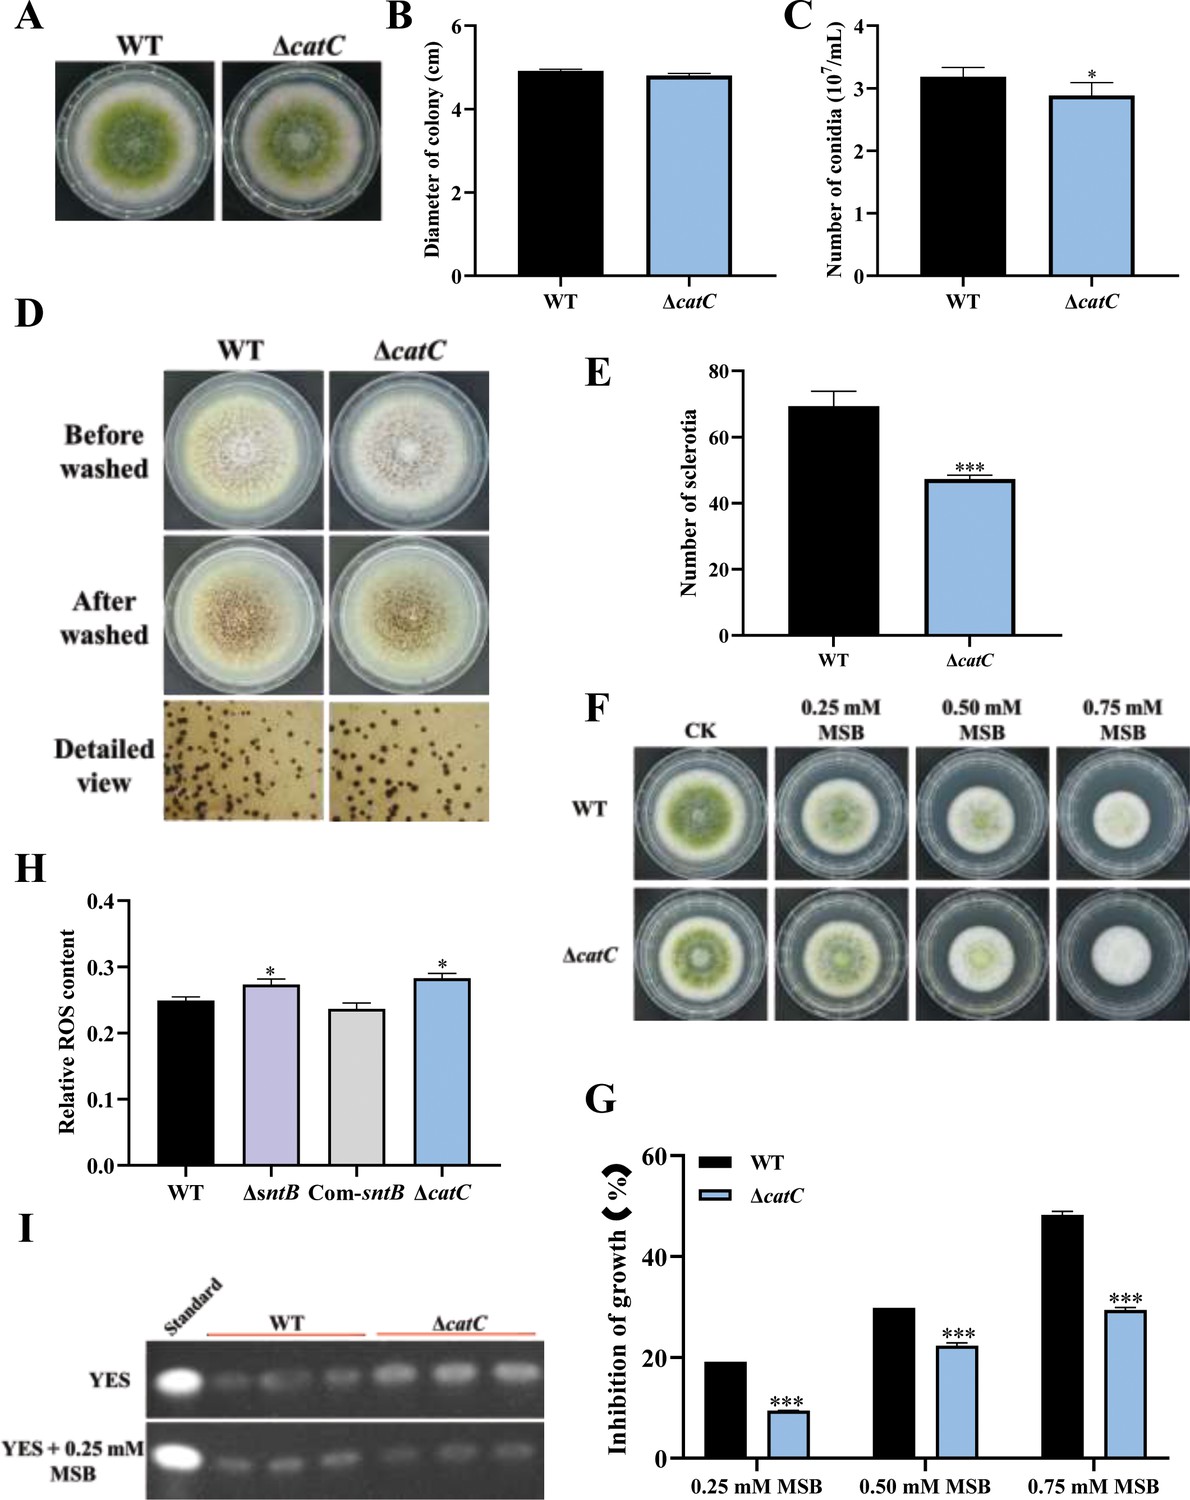
The functions of catC in A. flavus.
(A) The colonies of wild-type (WT) and ΔcatC strains grown on potato dextrose agar (PDA) at 37°C in dark for 4 days. (B) The colony diameter statistics of the above fungal strains. (C) The spore production statistics of the above fungal strains. (D) All above fungal strains were point-inoculated on complete medium (CM) and grown for 7 days at 37°C. (E) The number of sclerotia of the above fungal strains. (F) The phenotype of above strains cultured on PDA medium containing a series concentration of menadione sodium bisulfite (MSB) for 3 days. (G) Statistical analysis of the growth inhibition rate of MSB to all the above fungal strains according to (F). (H) Relative reactive oxygen species (ROS) levels in the WT, ∆sntB, Com-sntB, and ∆catC strains. (I) AFB1 production of the above fungal strains was detected by TLC after the strains incubating at 29°C in potato dextrose (PDB) medium for 7 days.
-
Figure 6—source data 1
Original files for TLC detection of AFB1 production displayed in Figure 6I.
- https://cdn.elifesciences.org/articles/94743/elife-94743-fig6-data1-v1.zip
-
Figure 6—source data 2
Original files for TLC detection of AFB1 production displayed in Figure 6I, indicating the relevant bands and treatments.
- https://cdn.elifesciences.org/articles/94743/elife-94743-fig6-data2-v1.zip
Figure 6—figure supplement 1

PCR verification of gDNA in wild-type (WT) and ΔcatC.
-
Figure 6—figure supplement 1—source data 1
Original files for PCR verification of gDNA in wild-type (WT), ΔcatC strains in Figure 6—figure supplement 1.
- https://cdn.elifesciences.org/articles/94743/elife-94743-fig6-figsupp1-data1-v1.zip
-
Figure 6—figure supplement 1—source data 2
Original files for PCR verification of gDNA in wild-type (WT), ΔcatC strains in Figure 6—figure supplement 1, indicating the relevant bands and treatments.
- https://cdn.elifesciences.org/articles/94743/elife-94743-fig6-figsupp1-data2-v1.zip
Figure 6—figure supplement 2
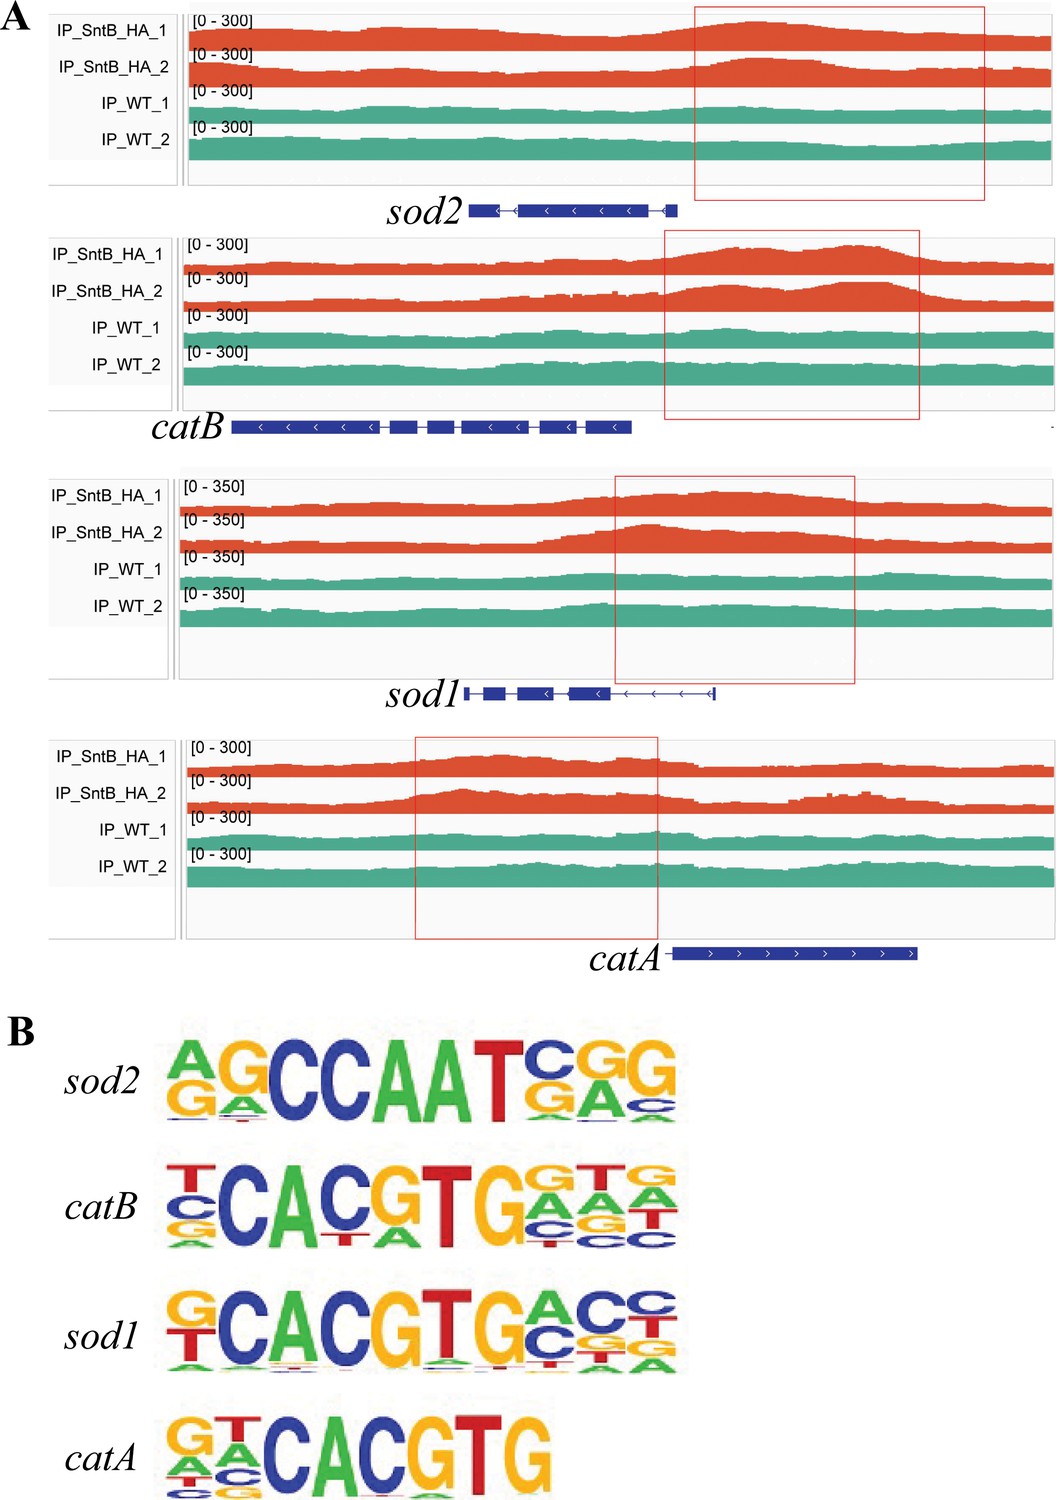
The binding region and motif of SntB on the catA, catB, sod1, and sod2 genes.
(A) Comparison of the enrich levels of the SntB binding region of catA, catB, sod1, and sod2 genes between wild-type (WT) and sntB-HA strains. (B) The motif logo in the SntB binding region of catA, catB, sod1, and sod2 genes.
Figure 7
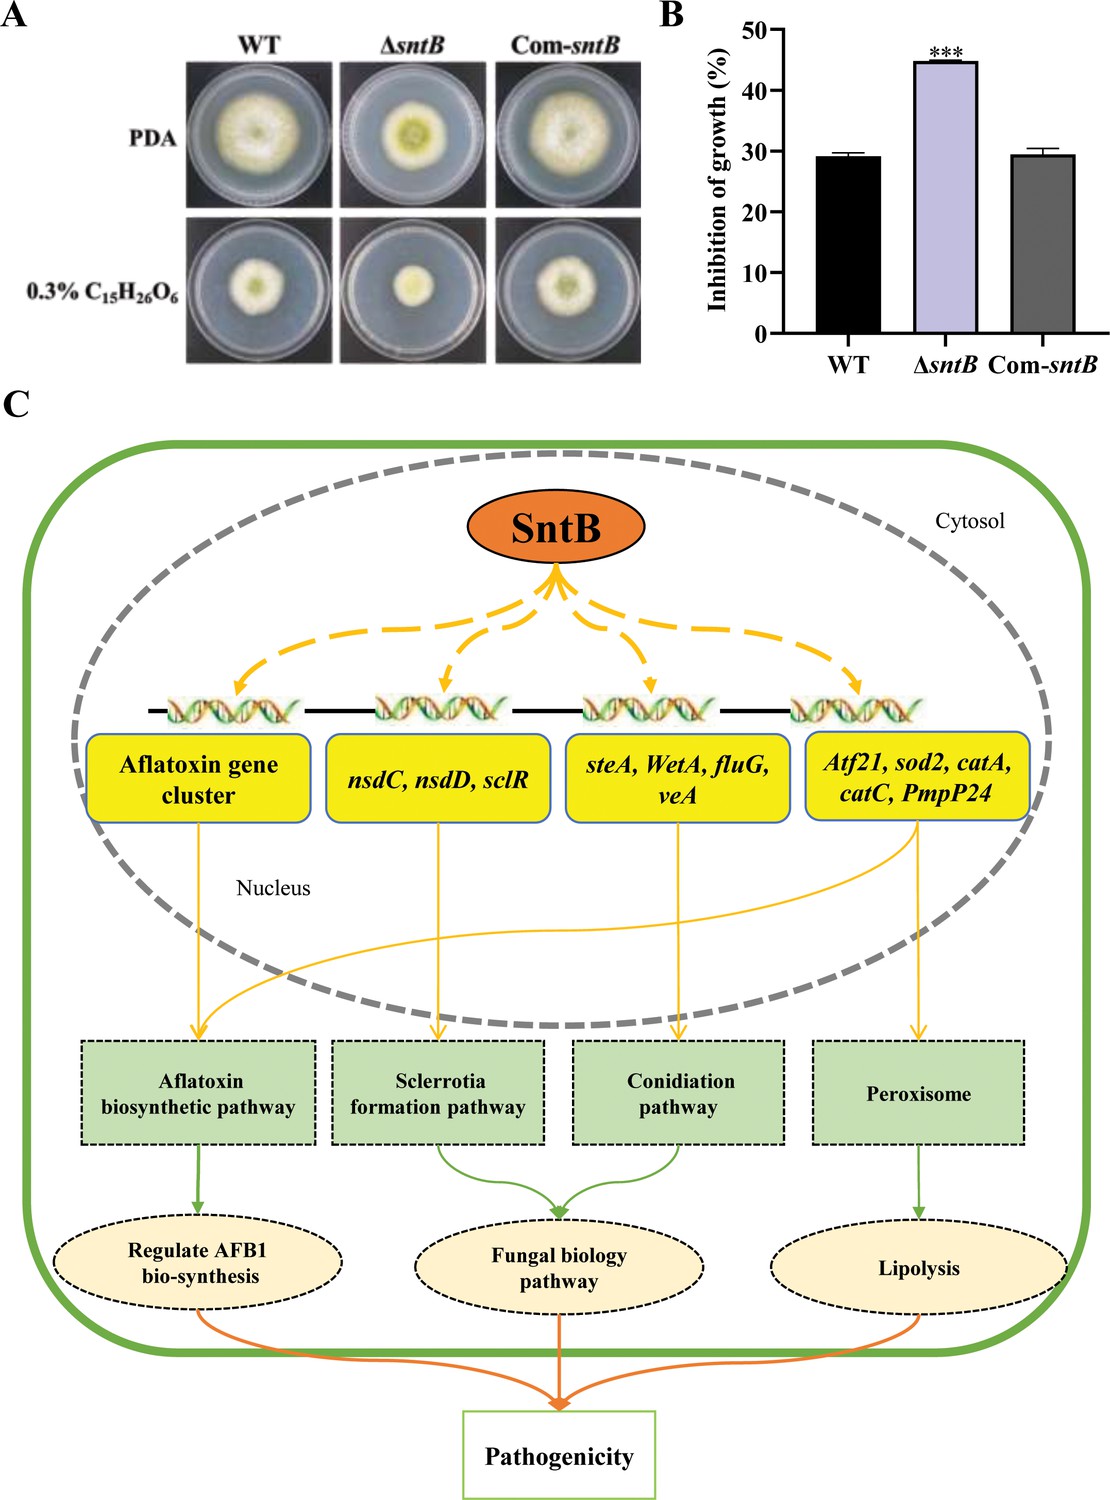
SntB regulate peroxisome biogenesis, fatty acid utilization, and fungal pathogenicity in A. flavus.
(A) The phenotype of each strain on PDA medium containing 0.3% tributyrin. (B) Statistics of inhibition rates. The asterisk *** above the bars represents significantly different (p<0.001). (C) Mechanistic diagram of the bio-functions of SntB in A. flavus.
Tables
Table 1
A. flavus strains used in this study.
| Strain name | Related genotype | Source |
|---|---|---|
| A. flavus CA14 | Δku70, ΔpyrG | Kindly presented from Prof. Chang (Chang et al., 2010) |
| Wild-type (WT) | Δku70, ΔpyrG::AfpyrG | This study |
| ΔsntB | Δku70, ΔsntB::AfpyrG | This study |
| Com-sntB | ∆ku70, ΔpyrG; ∆sntB::AfpyrG:: sntB | This study |
| sntB-HA | Δku70, sntB-HA::AfpyrG | This study |
| ΔcatC | Δku70, ΔcatC::AfpyrG | This study |
Table 2
Primers used for strain construction in this study.
| Primer name | Sequence (5’ → 3’) | Fragment amplified |
|---|---|---|
| sntB-p1 | CTTCTCGAATTCCCCTTCATGACACTCTCC | For the construction of knock-out strain |
| sntB-p2 | GCTAAATCAGGATGGGTTGGAGGGTGAC | |
| sntB-p3 | GCATCTCCTTTGTGTTGTTTGGACCGTGT | |
| sntB-p4 | CAACCAACCACTGACGTCGACCAC | |
| sntB-p5 | GTCACCCTCCAACCCATCCTGATTTAGCGCCTCAAACAATGCTCTTCACCC | |
| sntB-p6 | ACACGGTCCAAACAACACAAAGGAGATGCGTCTGAGAGGAGGCACTGATGC | |
| sntB-p7 | TAGATCACCCAGCGGGCCACAA | |
| sntB-p8 | GACTCAAATGGAAATCCCGTCGTGCC | |
| sntB-F | GCAGCAACACCACGTGAGGCCCAATTC | A fragment from sntB ORF |
| sntB-R | CCAGGTCACAGGGCATAGAACACACTCGTA | |
| P1020-F | ATCGGCAATACCGTCCAGAAGC | Verify the fragment of AfpyrG |
| P801-R | CAGGAGTTCTCGGGTTGTCG | |
| sntB-C-p2 | GGGTGAAGAGCATTGTTTGAGGCCCTCCAACCTTACTCCGTACACAATTCTAG | For the construction of complementary strain of sntB |
| sntB-C-p3 | GCATCAGTGCCTCCTCTCAGACGGCACGACGGGATTTCCATTTGAGTC | |
| sntB-C-p4 | CCAATTTCCTGATGATTGTGATGTGTGTCC | |
| SC-P-F | GCCTCAAACAATGCTCTTCACCC | |
| SC-P-R | GTCTGAGAGGAGGCACTGATGC | |
| sntB-HA-P1 | GAGATTTATCGACGACTATATGGC | For the construction of HA tag fused strain of sntB |
| sntB-HA-P2 | TGAACCTCCGCCACCACTACCTCCGCCACCAGAGAGTAAATTCTTGAGAGATGGG | |
| HA-linker-pyrG-F | TGGCGGAGGTAGTTACCCATACGACGTCCCAGACTACGCTTACCCATACGACGTCCCAGACTACGCTTACCCATACGACGTCCCAGACTACGCTTGAGCCTCAAACAATGCTCTTCACCC | |
| catC-P1 | CTTGAGACGCAGGACGAA | For the construction of knock-out strain of catC |
| catC-P2 | GGGTGAAGAGCATTGTTTGAGGCTGATGTGGGTTGTATGAATG | |
| catC-P3 | GCATCAGTGCCTCCTCTCAGACTGGATGCGGGTGAATACTG | |
| catC-P4 | ACAAGCTGTCATGCGTGG | |
| catC-P5 | TGGGAGTCTCGAACACAC | |
| catC-P6 | GAAAACCCCGCAACAGAC | |
| catC-F | AGCCTATTTCGGACCCCT | |
| catC-R | CAGTCTCCTTTCGGCATC |
Table 3
Primers used for RT-qPCR in this study.
| Primer name | Sequence (5’ → 3’) | Fragment amplified |
|---|---|---|
| sntB-qF | ACTCATCAGAGCCCCTATGGGCCAGTC | |
| sntB-qR | GCACTAAGAACGCGATCGACAGAATAGACAC | |
| catC-qF | GAAAGAGTTGTCCATGCCA | |
| catC-qR | CAGAAAACGGGTGTGTGAT | |
| brlA-F | GCCTCCAGCGTCAACCTTC | |
| brlA-R | TCTCTTCAAATGCTCTTGCCTC | |
| abaA-F | TCTTCGGTTGATGGATGATTTC | |
| abaA-R | CCGTTGGGAGGCTGGGT | |
| nsdC-F | GCCAGACTTGCCAATCAC | Sclerotium-related genes |
| nsdC-R | CATCCACCTTGCCCTTTA | |
| nsdD-F | GGACTTGCGGGTCGTGCTA | |
| nsdD-R | AGAACGCTGGGTCTGGTGC | |
| sclR-F | CAATGAGCCTATGGGAGTGG | |
| sclR-R | ATCTTCGCCCGAGTGGTT | |
| aflC-F | GTGGTGGTTGCCAATGCG | Toxin synthesis structure genes |
| aflC-R | CTGAAACAGTAGGACGGGAGC | |
| aflP-F | CGATGTCTATCTTCTCCGATCTATTC | |
| aflP-R | TCTCAGTCTCCAGTCTATTATCTACC | |
| aflO-F | CTTTCGGCAGTGACCTAACC | |
| aflO-R | TCTTGAACTATAAGGCGACCA | |
| aflR-F | AAAGCACCCTGTCTTCCCTAAC | Toxin synthesis regulatory genes |
| aflR-R | GAAGAGGTGGGTCAGTGTTTGTAG | |
| aflS-F | GCTCAGACTGACCGCCGCTC | |
| aflS-R | GCTCAGACTGACCGCCGCTC | |
| 18S rRNA-F | CTGAAGACTAACTACTGCGAAAGC | RNA extraction quality testing |
| 18S rRNA-R | GAGCGGGTCATCATAGAAACAC | |
| β-tublin-F | TTGAGCCCTACAACGCCACT | |
| β-tublin-R | TGGTTCAGGTCACCGTAAGAGG | |
| actin-F | ACGGTGTCGTCACAAACTGG | Internal reference gene |
| actin-R | CGGTTGGACTTAGGGTTGATAG |
Additional files
-
Supplementary file 1
The data of RNA-seq and ChIP-seq analysis.
(a) Sequencing data statistics in RNA-seq. (b) Alignment results of each sample in RNA-seq. (c) The information of differentially expressed genes (DEGs) in transcriptome data. (d) Gene ontology (GO) enriched in the DEGs in transcriptome data. (e) Kyoto encyclopedia of genes and genomes (KEGG) pathways enriched of the DEGs in transcriptome data. (f) Sequencing data statistics in chromatin immunoprecipitation sequencing (ChIP-seq). (g) Alignment results of each sample in ChIP-seq. (h) The information of up-regulated peak in ChIP-seq data. (i) Known motifs identified by HOMER motif enrichment analysis software. (j) GO enriched in the up-regulated genes in ChIP-seq data. (k) KEGG enriched in the up-regulated genes in ChIP-seq data. (l) GO enriched in the 238 common DEGs in RNA-seq and ChIP-seq data. (m) KEGG enriched in the 238 common DEGs in RNA-seq and ChIP-seq data. (n) The information of DEGs related to lipase activity in transcriptome data. (o) The information of DEGs related to oxidative response in transcriptome data.
- https://cdn.elifesciences.org/articles/94743/elife-94743-supp1-v1.xlsx
-
MDAR checklist
- https://cdn.elifesciences.org/articles/94743/elife-94743-mdarchecklist1-v1.docx
Download links
A two-part list of links to download the article, or parts of the article, in various formats.
Downloads (link to download the article as PDF)
Open citations (links to open the citations from this article in various online reference manager services)
Cite this article (links to download the citations from this article in formats compatible with various reference manager tools)
SntB triggers the antioxidant pathways to regulate development and aflatoxin biosynthesis in Aspergillus flavus
eLife 13:RP94743.
https://doi.org/10.7554/eLife.94743.5


