EPHA4 signaling dysregulation links abnormal locomotion and the development of idiopathic scoliosis
- Department of Orthopedic Surgery, State Key Laboratory of Complex Severe and Rare Diseases, Peking Union Medical College Hospital, Peking Union Medical College and Chinese Academy of Medical Sciences, China
- Beijing Key Laboratory of Big Data Innovation and Application for Skeletal Health Medical Care, China
- Key Laboratory of Big Data for Spinal Deformities, Chinese Academy of Medical Sciences, China
- Department of Orthopaedic Surgery, Qilu Hospital of Shandong University, Cheeloo College of Medicine, Shandong University, China
- Department of Molecular and Human Genetics, Baylor College of Medicine, United States
- Institute of Evolution & Marine Biodiversity, College of Marine Life Science, Ocean University of China, China
- Center for Pediatric Bone Biology and Translational Research, Scottish Rite for Children, United States
- Laboratory for Statistical and Translational Genetics, RIKEN Center for Integrative Medical Sciences, Japan
- Laboratory for Bone and Joint Diseases, RIKEN Center for Integrative Medical Sciences, Japan
- Department of Pediatric Endocrine and Metabolism, Maternal and Child Health Hospital of Guangxi Zhuang Autonomous Region, China
- Department of Newborn Screening Center, Beijing Obstetrics and Gynecology Hospital, Capital Medical University, Beijing Maternal and Child Health Care Hospital, China
- Department of Central Laboratory, Peking Union Medical College Hospital, Peking Union Medical College and Chinese Academy of Medical Sciences, China
- Department of Medical Genetics, Institute of Basic Medical Sciences, Chinese Academy of Medical Sciences and Peking Union Medical College, China
- Baylor Genetics, United States
- Departments of Pediatrics, Texas Children’s Hospital and Baylor College of Medicine, United States
- Texas Children’s Hospital, United States
- Human Genome Sequencing Center, Baylor College of Medicine, United States
- Department of Orthopaedics, University of Texas Southwestern Medical Center, United States
- McDermott Center for Human Growth and Development, University of Texas Southwestern Medical Center, United States
Figures
Figure 1 with 2 supplements
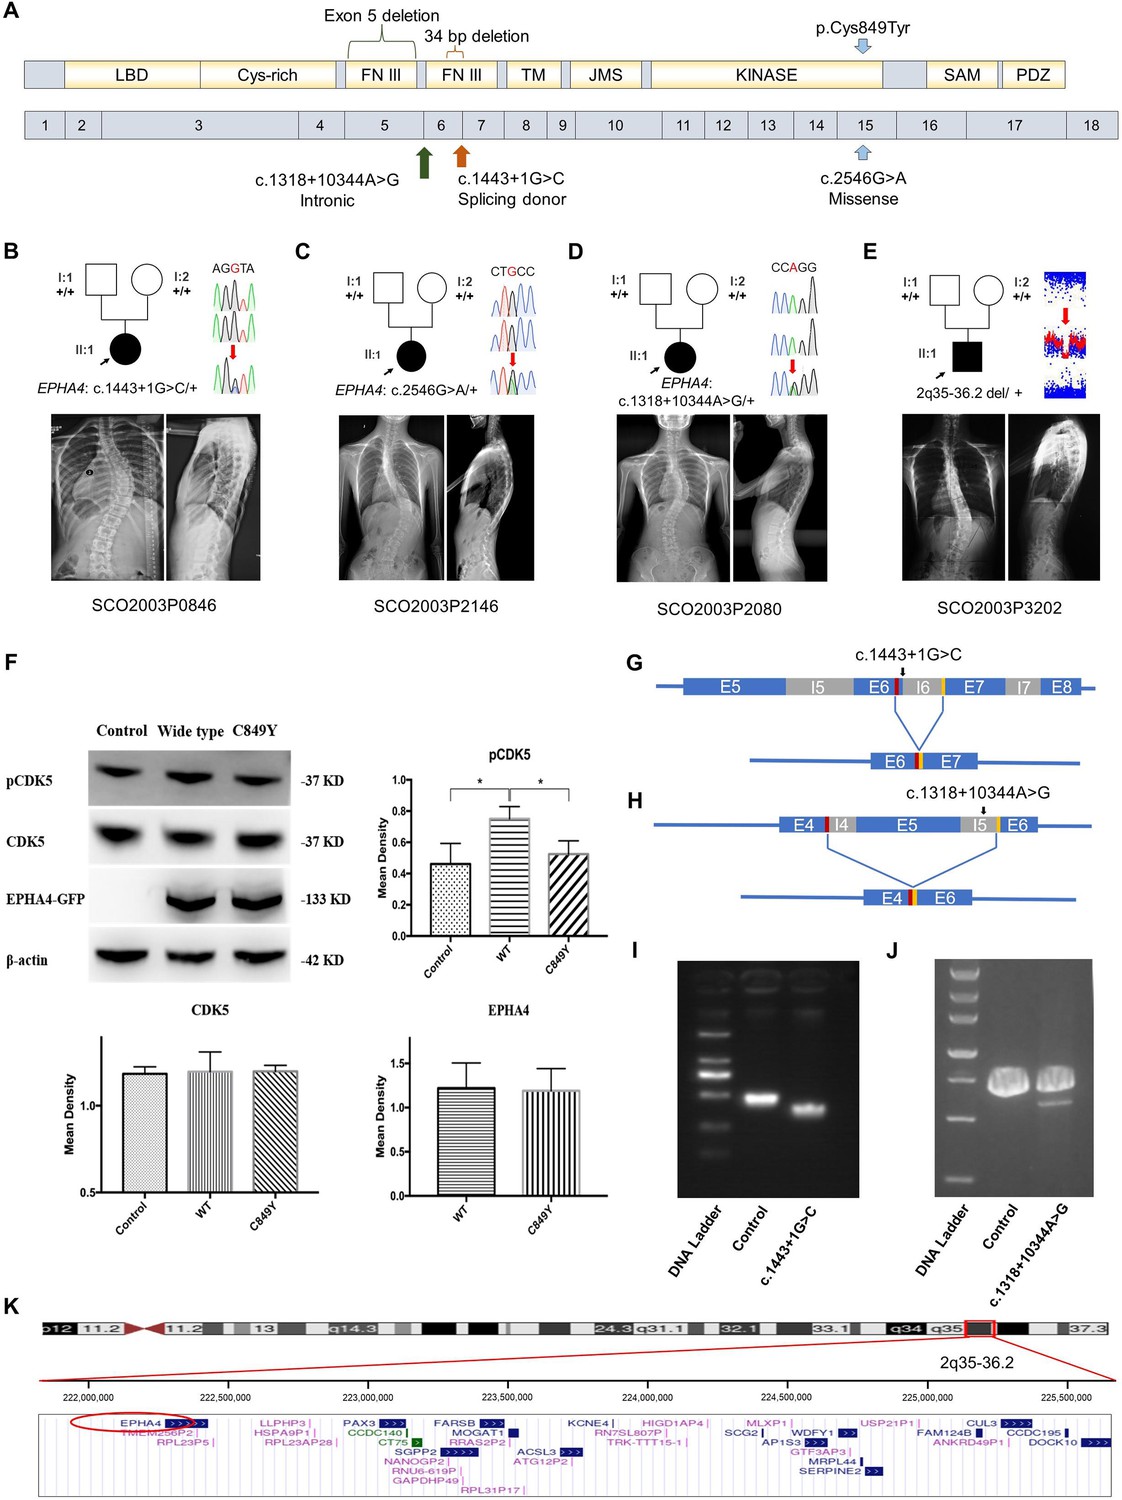
Clinical and genetic information on idiopathic scoliosis (IS) patients and functional effect of EPHA4 variants.
(A) Locations of three EPHA4 single-nucleotide variants relative to the protein domains (top panel) and exons 1–18 (bottom panel). (B-E) Pedigrees and spinal radiographs of four probands with dominant gene variants. Sanger sequencing confirmed the variants. The arrows indicate the probands. The term +/+ denotes the wild-type, and cDNA change/+ denotes the heterozygous variant. (F) Western blot analysis of EPHA4-c.2546G>A variant showing the protein expression levels of EPHA4 and CDK5 and the amount of phosphorylated CDK5 (pCDK5) in HEK293T cells transfected with EPHA4-mutant or EPHA4-WT plasmid. WT: wild-type. Data represent three independent experiments. Error bars show mean ± SD. P<0.05 was considered statistically significant. (G) Schematic representation of the effect of the EPHA4-c.1443+1G>C mutation on the splicing process. This variant induced a new splicing site (red box). The yellow box indicates the splicing acceptor. (H) Schematic representation of the effect of the EPHA4-c.1318+10344A>G mutation on the splicing process. This variant induced a new splicing site (red box). The yellow box indicates the splicing acceptor. (I) The minigene assay result showed that the c.1443+1G>C variant introduced a new splicing site, resulting in a 36 bp in-frame deletion in exon 6. (J) The nested PCR showed that the c.1318+10344A>G variant induced exon 5 skipping, resulting in a 339 bp in-frame deletion. (K) NCBI RefSeq genes included in 2q35-q36.2 from UCSC Genome Browser. EPHA4 is shown by the red oval.
-
Figure 1—source data 1
Original western blots for Figure 1F.
- https://cdn.elifesciences.org/articles/95324/elife-95324-fig1-data1-v1.docx
Figure 1—figure supplement 1
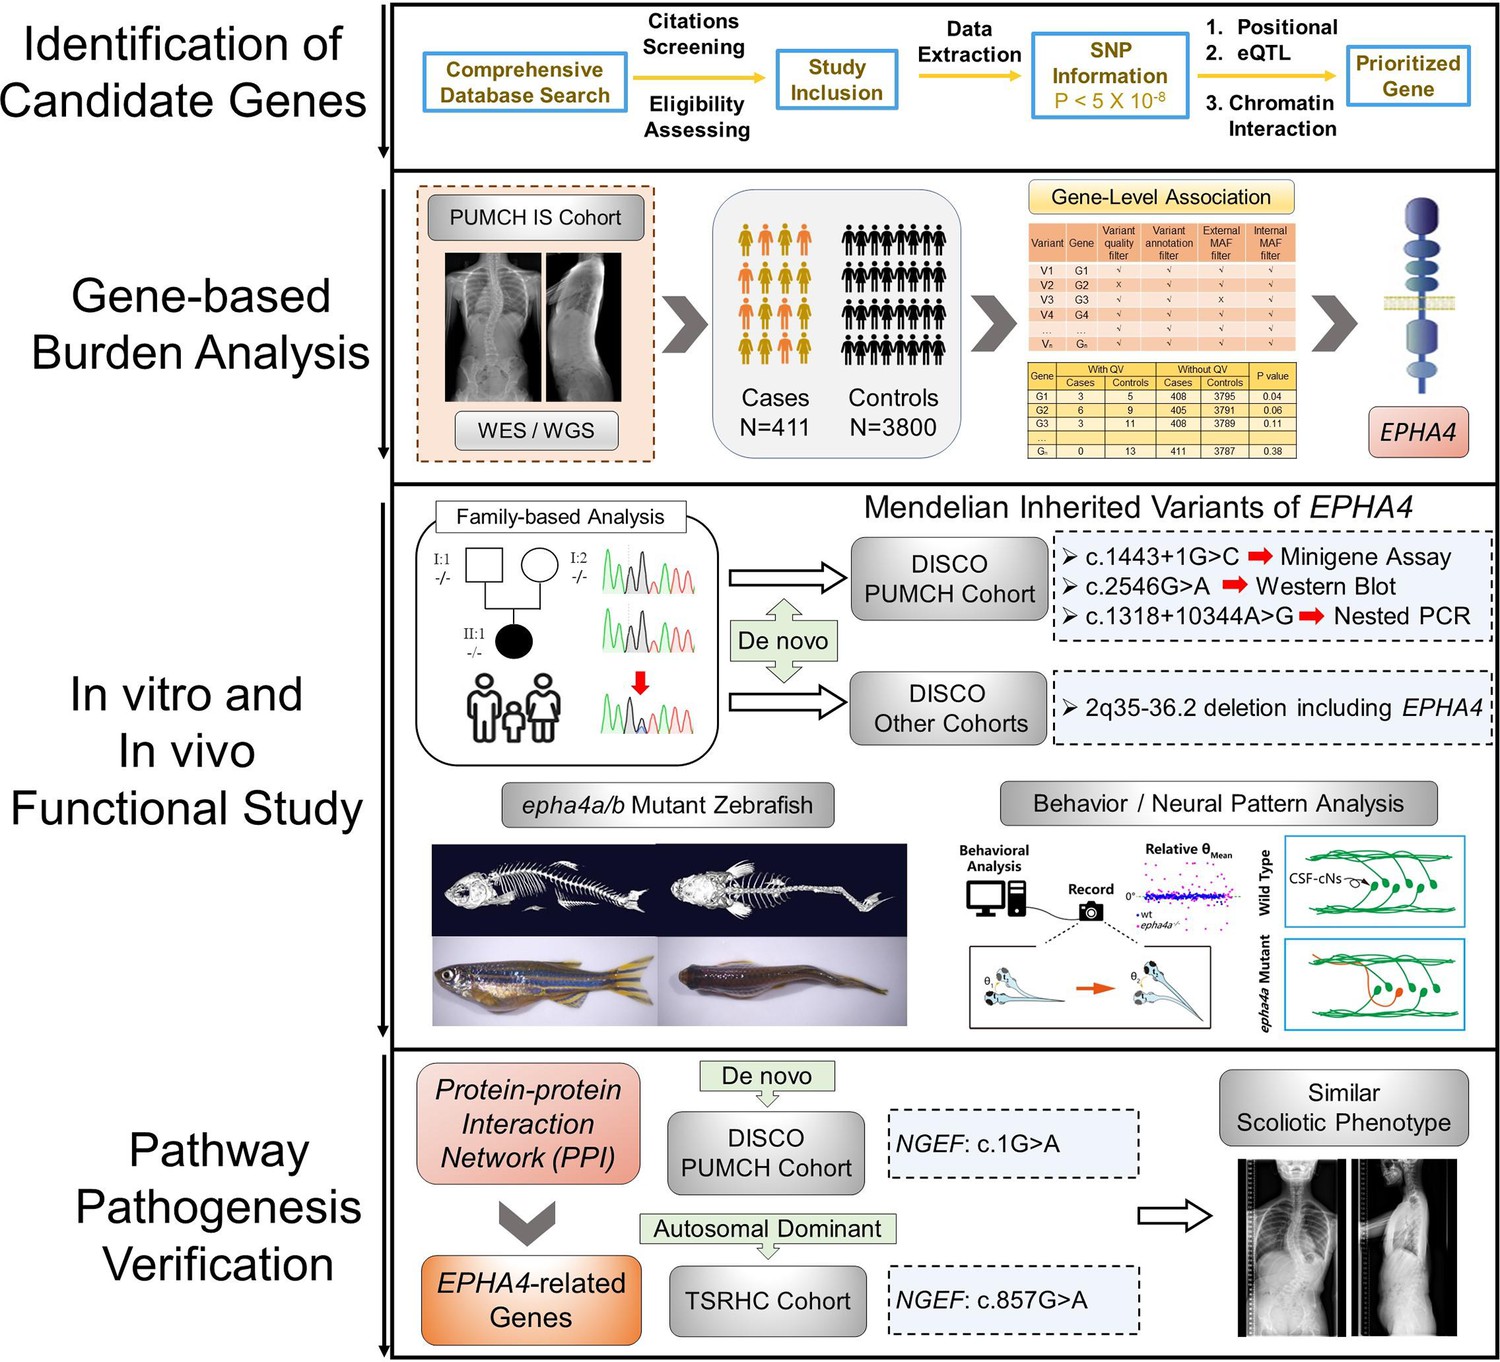
Flowchart for identification of causative genes.
The processes of candidate gene mapping and gene-based burden analysis were described. The variants in EPHA4 and NGEF identified in each cohort were displayed. Abbreviations: SNP: single-nucleotide polymorphism; eQTL: expression quantitative trait locus; IS: idiopathic scoliosis.
Figure 1—figure supplement 2
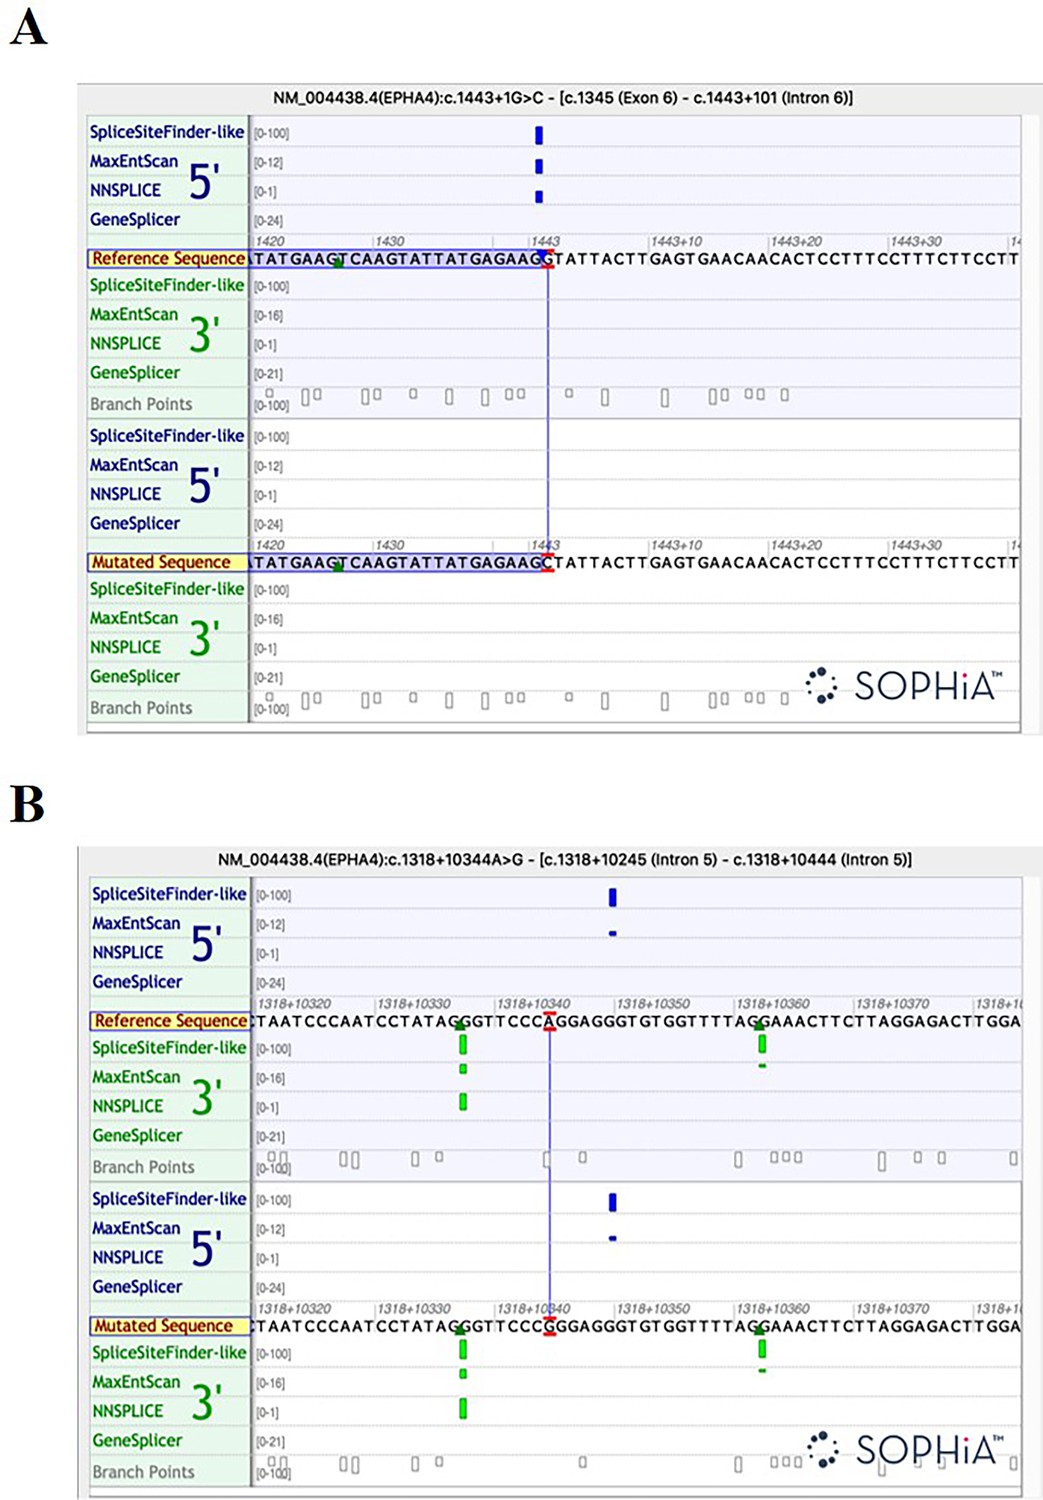
The splicing analysis by the Alamut software.
Results of Alamut analysis for (A) the c.1443+1G>C variant and (B) the c.1318+10344A>G variant using four algorithms (SpliceSiteFinder-like, MaxEntScan, NNSPLICE, and GeneSplicer).
Figure 2 with 2 supplements
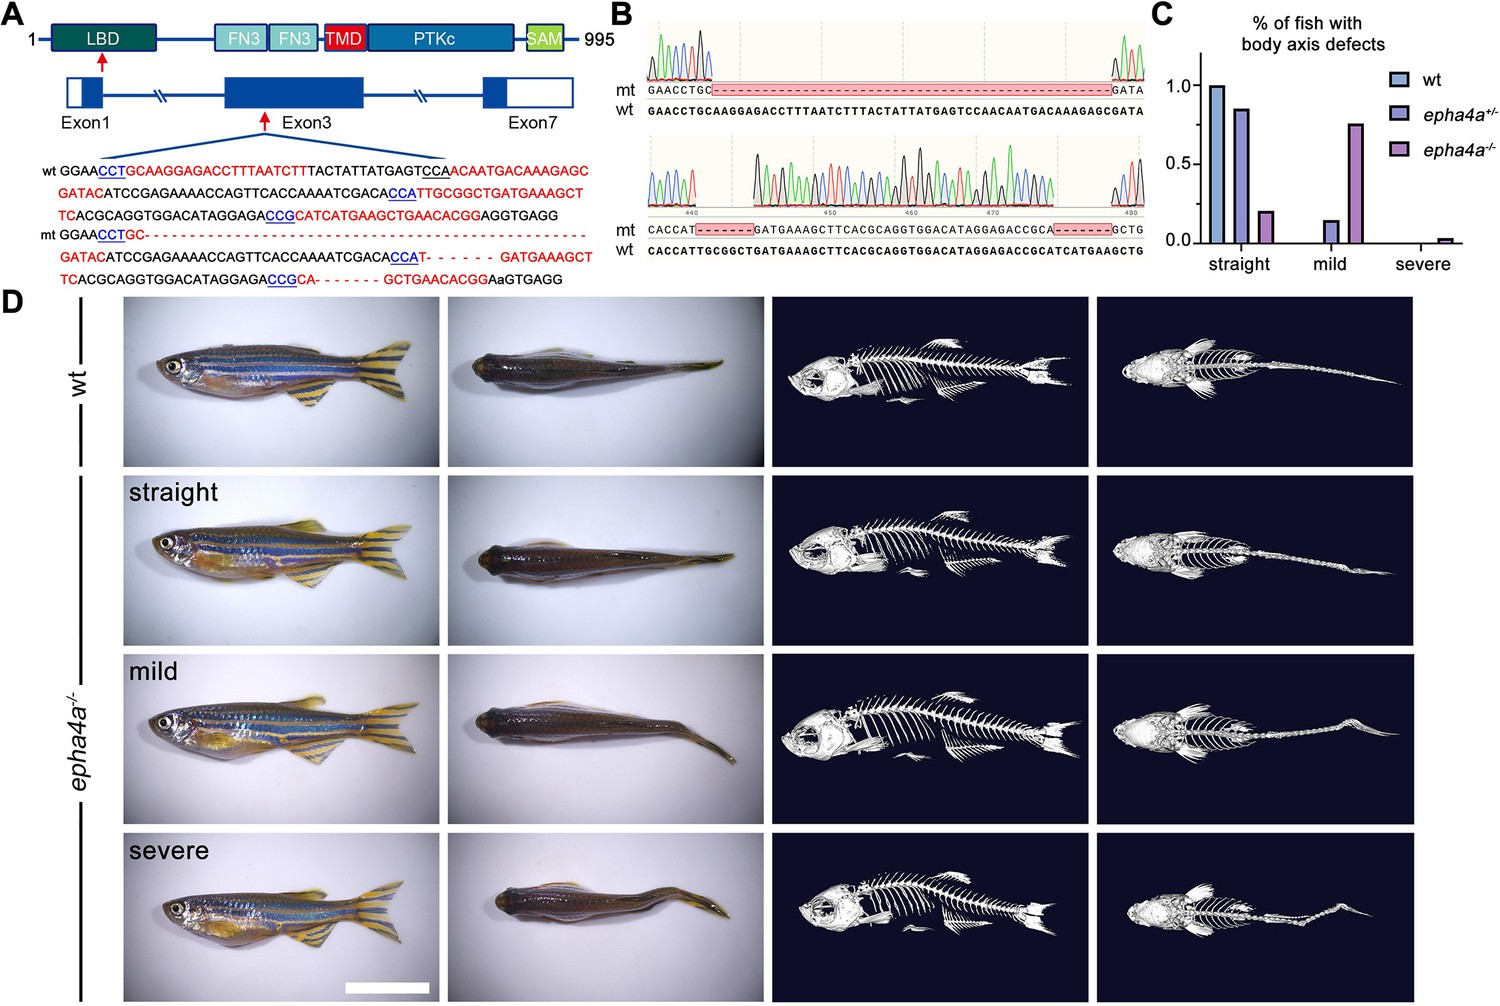
Scoliosis in zebrafish epha4a mutants.
(A) Diagram of the protein domains, genomic structures, and sequences of wild-type and corresponding epha4a mutants. Red arrows indicate mutation sites. Blue boxes indicate open reading frames. Underlined sequences indicate the protospacer adjacent motif (PAM) region, and red fonts indicate Cas9 binding sites. LBD: ligand binding domain; FN3: fibronectin type 3 domain; TMD: transmembrane domain; PTKc: catalytic domain of the protein tyrosine kinases; SAM: sterile alpha motif. (B) Sanger sequencing results confirmed the deletion of the target region in epha4a mutant transcripts. (C) Bar graph showing the percentages of adult zebrafish with normal, mild, or severe body axis defects in wild-type (n=76), epha4a heterozygote (n=95), or epha4a homozygous (n=116). (D) Representative images of wild-type and homozygous epha4a mutants. Micro CT images are shown on the right. Lateral and dorsal views are shown. Scale bar: 1 cm.
Figure 2—figure supplement 1
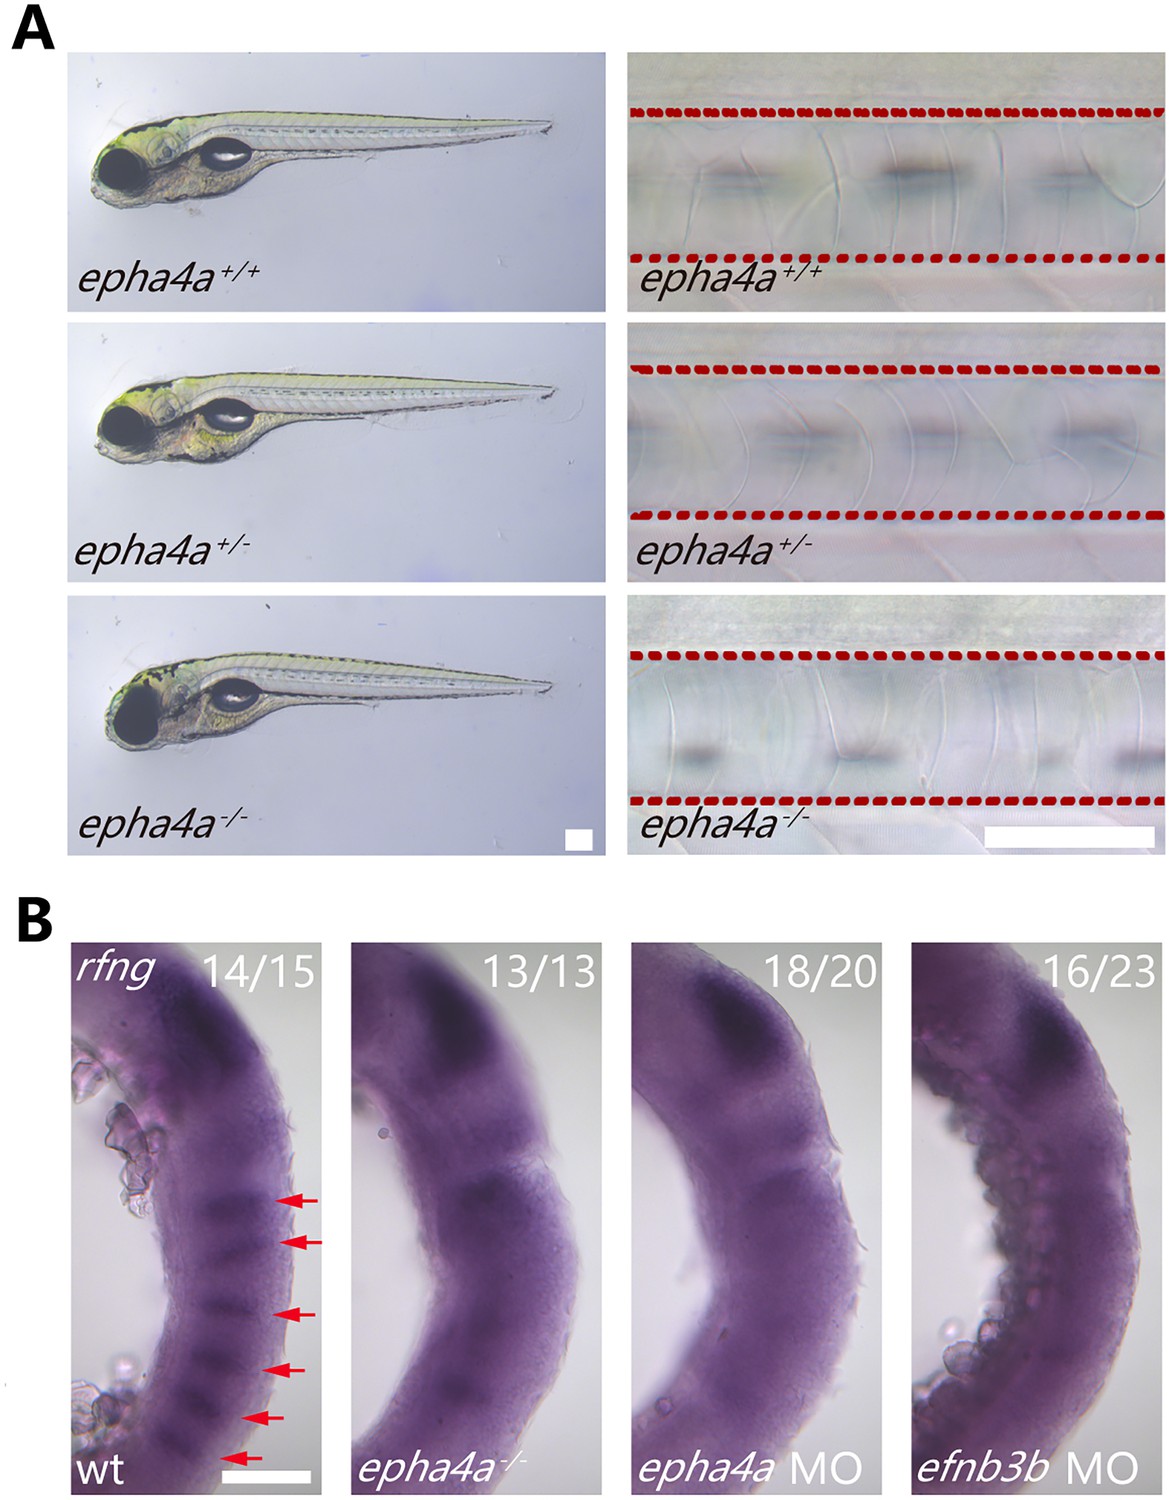
Phenotypes of epha4a mutants.
(A) Representative images showing the notochord and external phenotypes of wild-type and epha4a mutants. The red dashed lines indicate the area of the notochord. (B) Whole-mount in situ hybridization results showing the expression of the rfng gene in 18 hr post-fertilization (hpf) wild-type, homozygous mutant, or morphant larvae as indicated. The rfng gene marks boundary cells in the hindbrain. The red arrows indicate boundary expression. The numbers of embryos analyzed are shown on the top right. Scale bars: 200 µm in panel (A), 100 µm in panel (B).
Figure 2—figure supplement 2
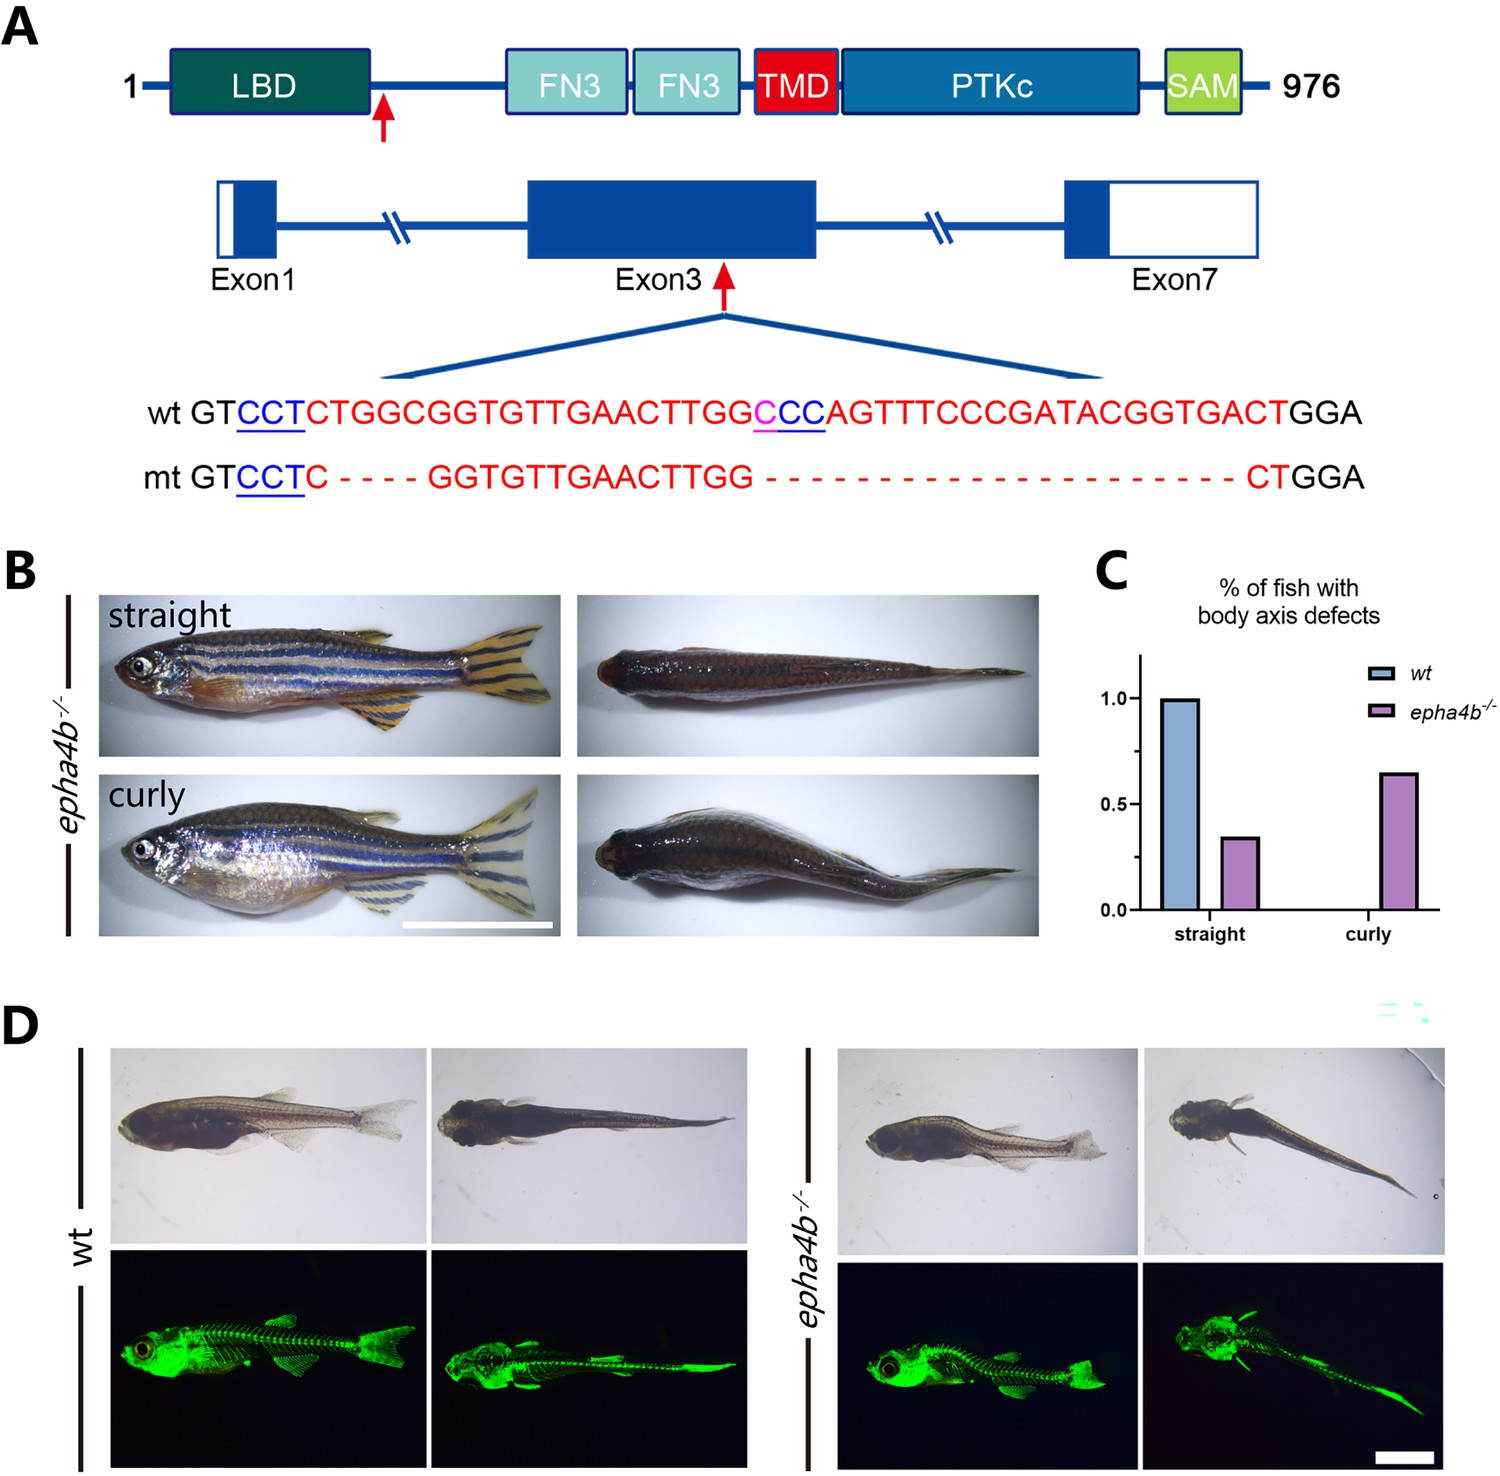
Zebrafish epha4b mutants exhibited body axis defects during development.
(A) Diagram showing the protein domains, genomic structures, and sequences of the wild-type and corresponding epha4b mutants. Red arrows indicate mutation sites. (B) Representative images of epha4b mutants. (C) Bar graph showing the percentages of adult fish with normal and body axis defects in wild-type (n=39) and epha4b mutants (n=43). (D) Bright-field and GFP fluorescent images showing scoliosis epha4b mutants at 28 days post-fertilization (dpf) as indicated by Tg(Ola.Sp7:NLS-GFP) transgene, which labels the bone skeleton. Scale bars: 1 cm in panel (B), 2 mm in panel (D).
Figure 3 with 1 supplement

Abnormal left-right swimming pattern in the absence of Epha4a.
(A) Dot plots showing the swimming distance of each 8 days post-fertilization (dpf) larva at a duration of 4 min (N=54 for wild-type and N=60 for epha4a mutants). (B) Dot plots showing the swimming velocity of wild-type and mutant larvae as indicated. (C) Diagram showing the turning angle (θ) of the larvae during swimming. (D) Scatter plot showing the relative turning angle of wild-type and mutant larvae. The relative angles were calculated by the sum of turning angles during fish swimming with left (positive) or right (negative) turns. The epha4a mutants favored turning to one side of their directions compared with those of wild-type larvae. (E) Dot plots showing the average absolute turning angle of wild-type and mutant larvae as indicated. (F) Dot plots showing the average absolute angular velocity of wild-type and mutant larvae as indicated. (G) Bar graph showing the percentages of 5 dpf zebrafish larvae with different reactions after tactile stimulation. N=10 for each group; the numbers of tactile stimulations are indicated in each column. (H) Representative images of the total body curvature measurements in zebrafish larvae, with values as the sum of α and β angles shown in the figure. (I) Representative time-series images of 5 dpf wild-type and epha4a mutant zebrafish larvae after tactile stimulation to the head. Each panel represents the points of maximal body curvature for the C-bend and counterbend after the tactile startle response. (J, K) A plot of body curvature angles as measured in panel (H) during swimming in response to tactile head stimulation in 5 dpf wild-type (panel J, N=5 larvae, n=10 stimuli) and epha4a mutants (panel K, N=5 larvae, n=7 stimuli). Each colored curve represents an independent experiment showing the response of a single larva to a stimulus. The positive angle means turning right. (L) The maximum curvature angles during the first C-bend and counterbend after tactile stimulation in wild-type and epha4a mutant larvae.
Figure 3—figure supplement 1
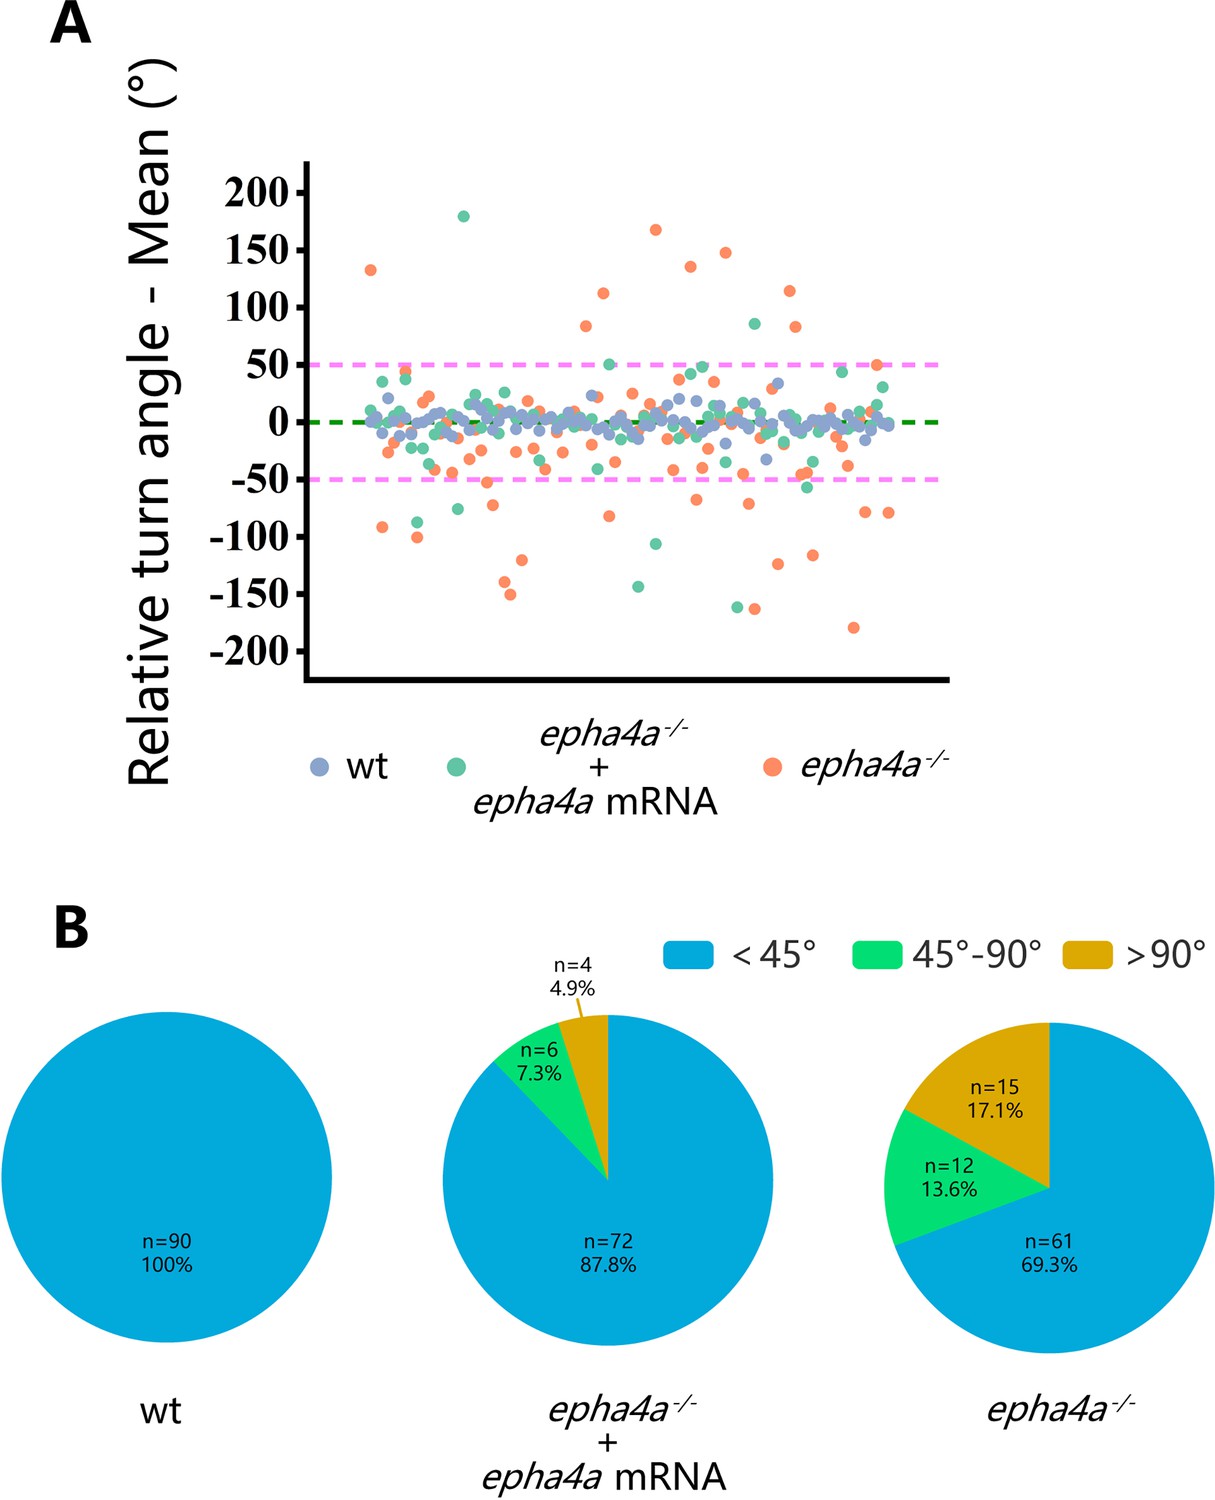
Rescue of the epha4a homozygous mutant phenotype by epha4a mRNA injection.
(A) Scatter plot showing the relative turning angle of wild-type, epha4a homozygous larvae and homozygous larvae injected with the corresponding mRNA. (B) The pie chart shows the proportional distribution of relative turning angles in three groups of larvae. N=30 larvae, n=90 experiments. Larvae that remained stationary during the recording were excluded.
Figure 4 with 1 supplement
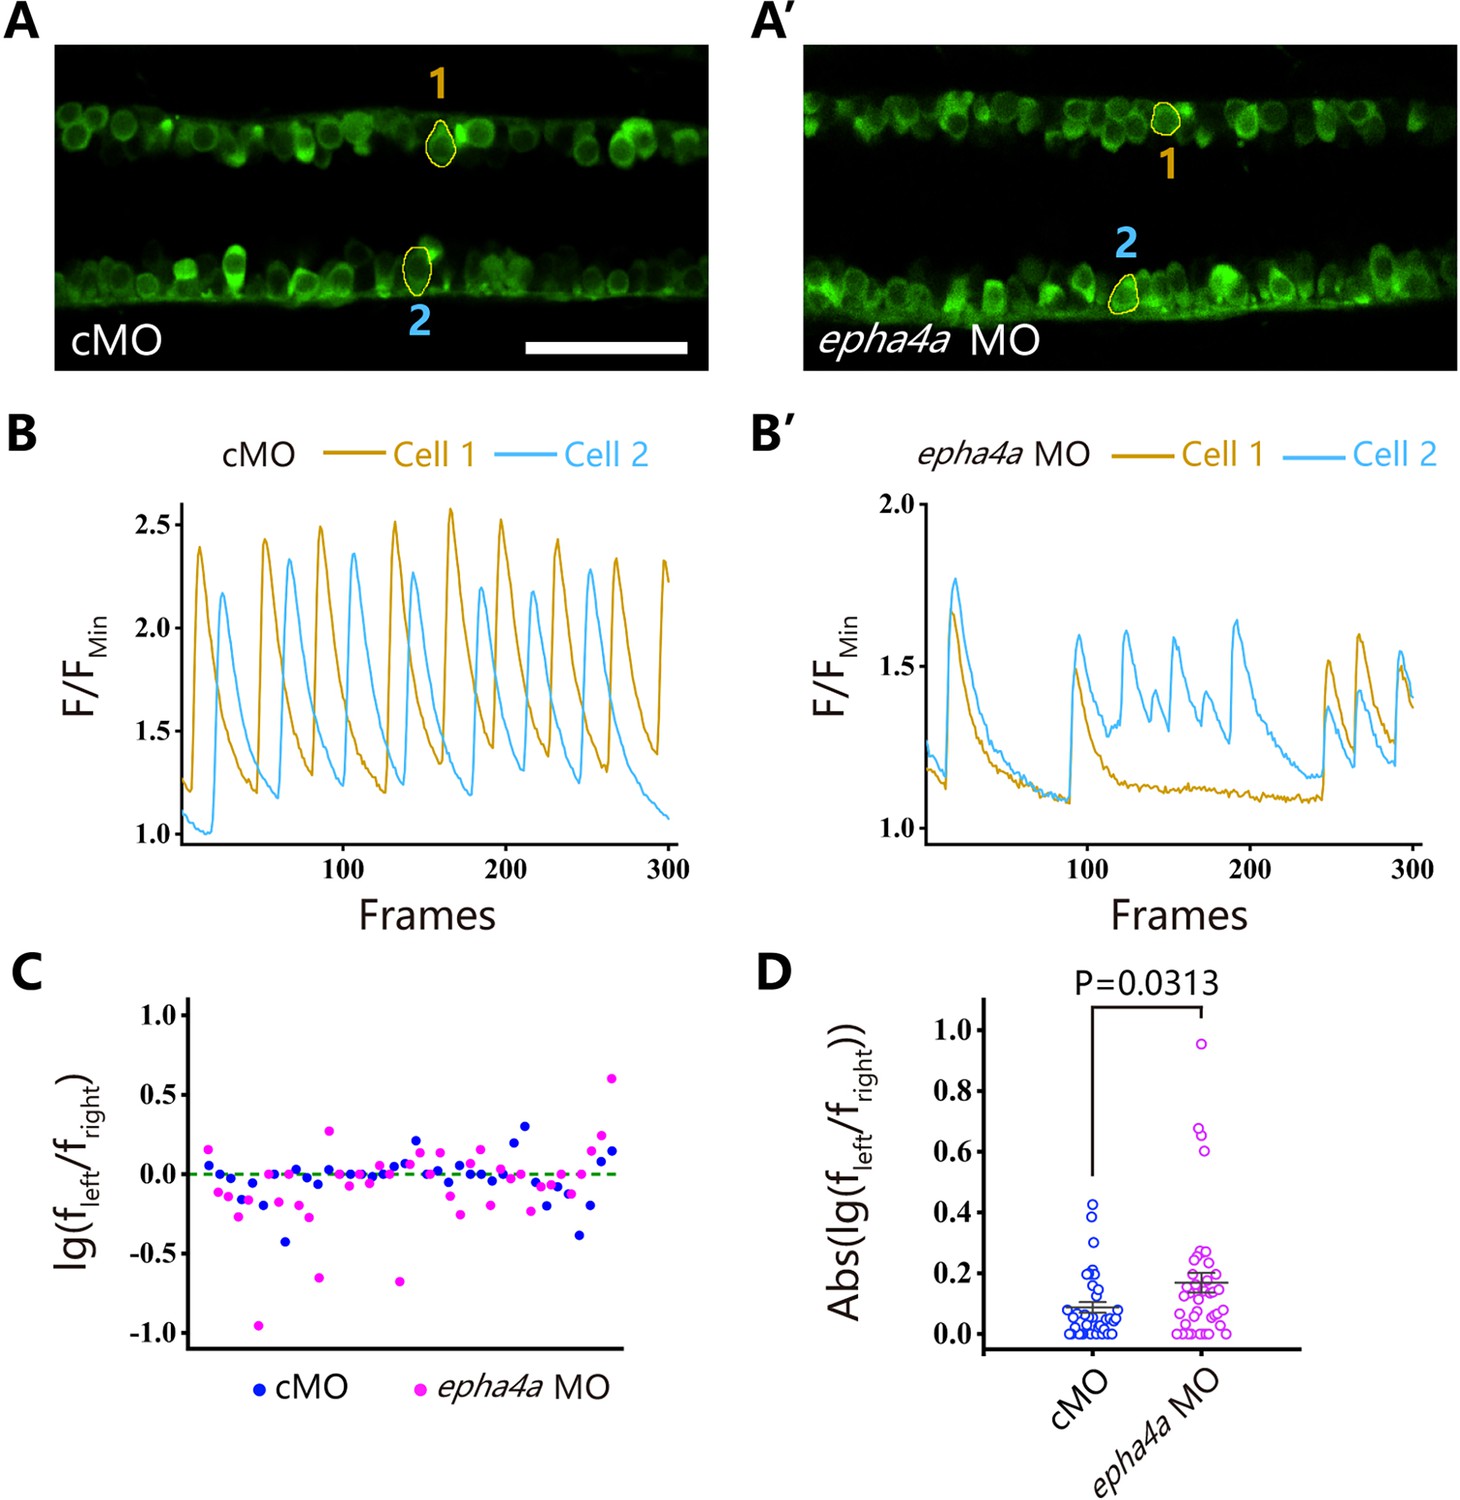
Uncoordinated left-right activation of spinal cord neurons in epha4a mutants.
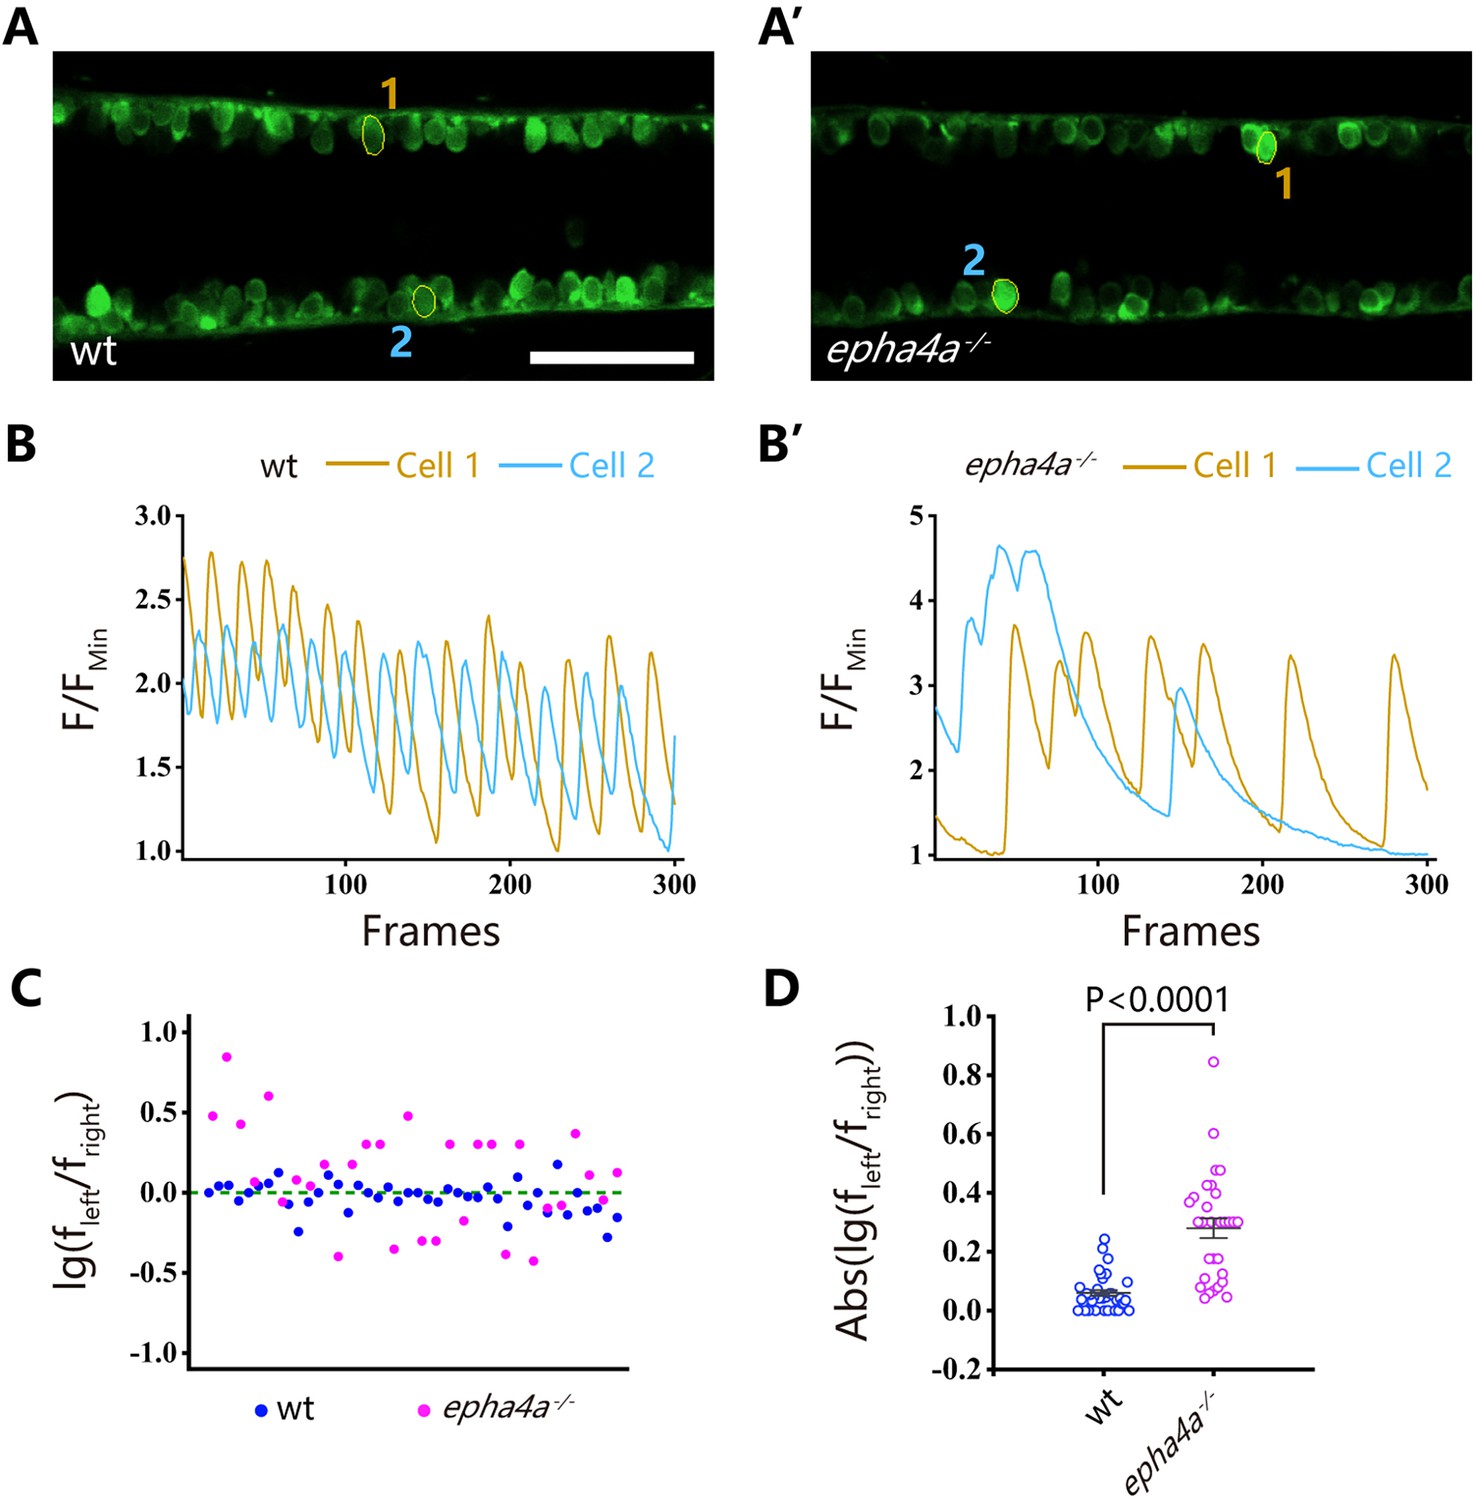
(A, A’) Fluorescent images showing the dorsal view of 24 hr post-fertilization (hpf) Tg(elavl3:GAL4; UAS:GCaMP) double transgenic larvae. The corresponding movies are shown in Videos 5 and 6. (B, B’) Line charts showing the quantification of fluorescence changes of the region of interests (ROIs, circled in A, A’) in wild-type larvae and epha4a mutants. (C) Scatter plot showing the distribution trend of the ratio of the calcium signal frequency between left and right in wild-type (N=14 larvae, n=42 experiments) and epha4a mutants (N=10 larvae, n=30 experiments). (D) Statistical graph of the ratio of the calcium signal frequency between left and right in wild-type larvae and epha4a mutants. Scale bars: 50 μm in panels (A, A’).
Figure 4—figure supplement 1
Uncoordinated left-right activation of spinal cord neurons in the absence of Epha4a.
(A, A’) Fluorescent images showing the dorsal view of 24 hr post-fertilization (hpf) Tg(elavl3:GAL4; UAS:GCaMP) double transgenic larvae. The corresponding movies are shown in Videos 7 and 8. (B, B’) Line charts showing the quantification of fluorescence changes of the region of interests (ROIs, circled in A, A’) in control and epha4a morphants. (C) Scatter plot showing the distribution trend of the ratio of the calcium signal frequency between left and right in control (N=15 larvae, n=38 experiments) and epha4a morphants (N=15 larvae, n=41 experiments). (D) Statistical graph of the ratio of the calcium signal frequency between left and right in control and epha4a morphants. Scale bars: 50 μm in panels (A, A’).
Figure 5
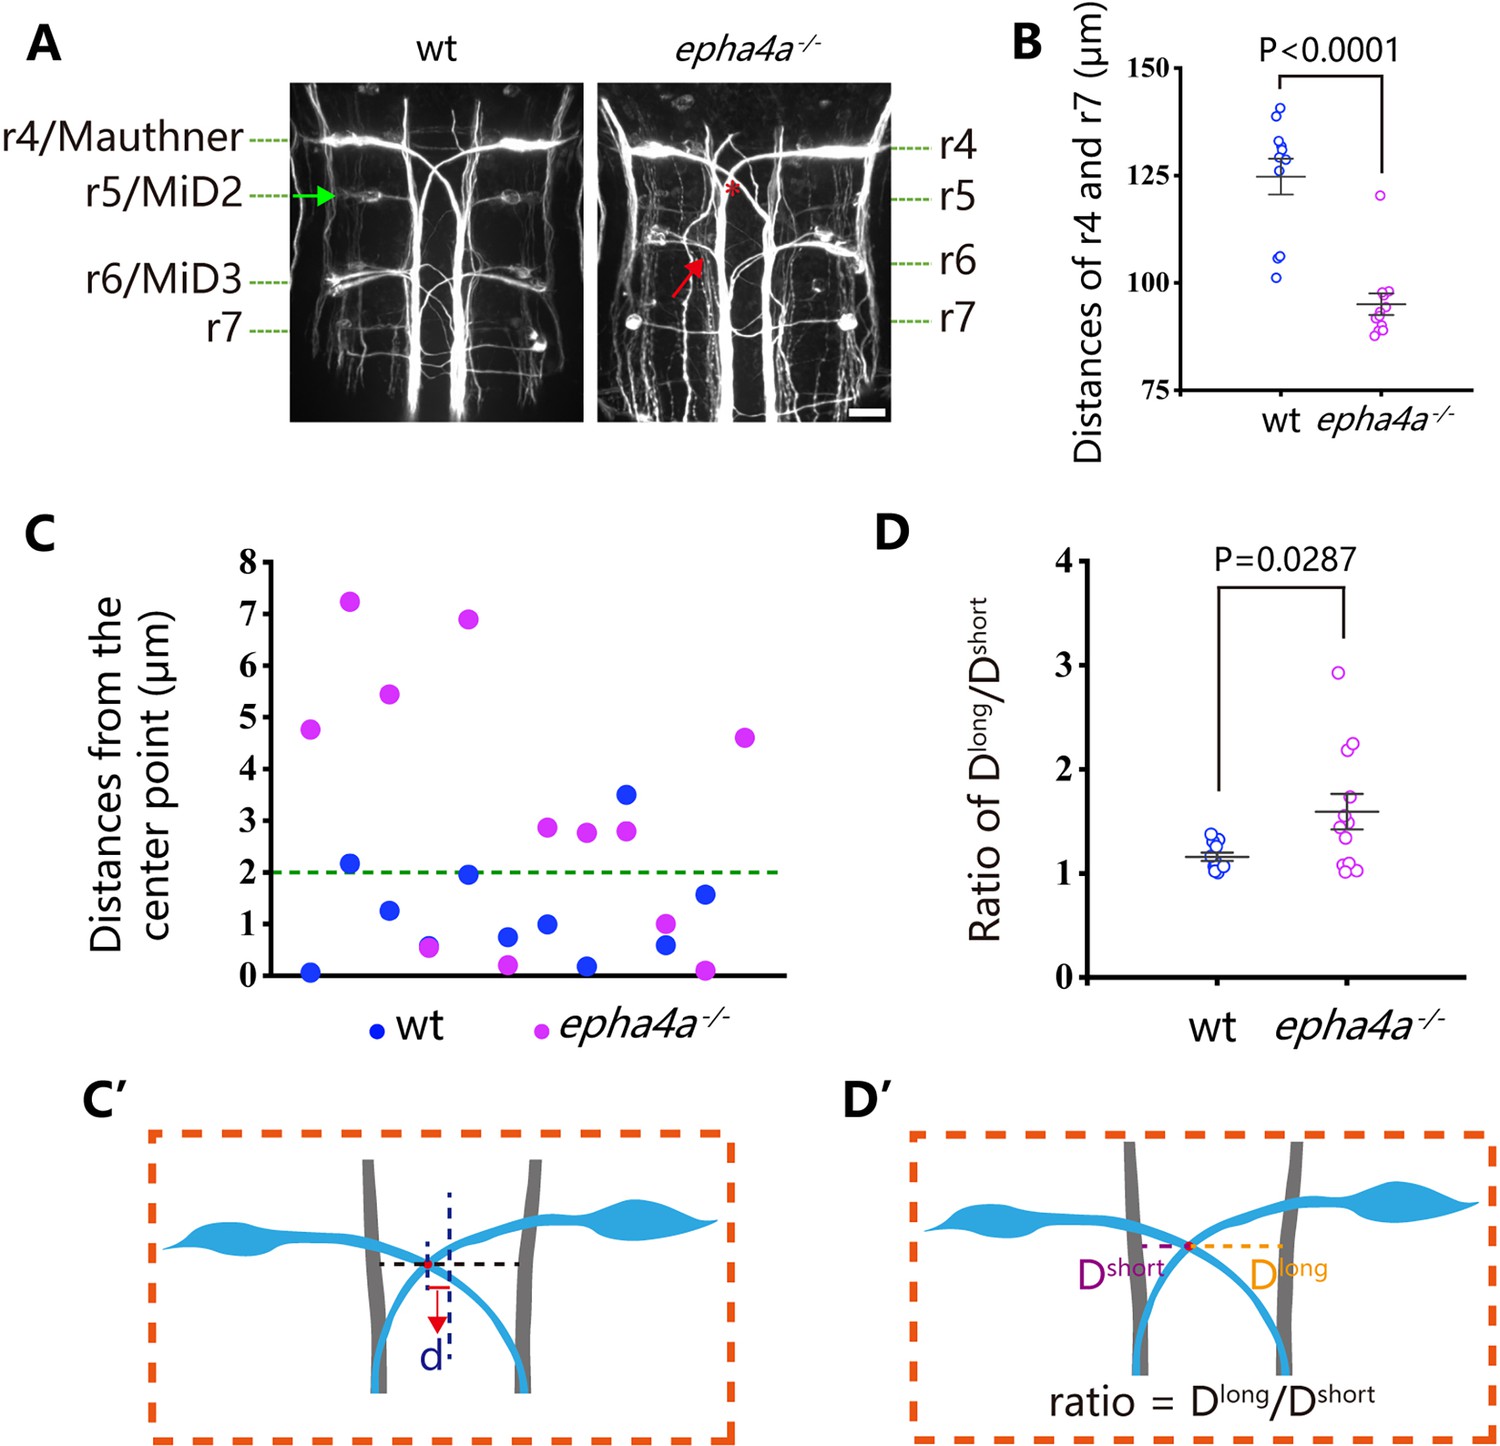
Disorganized neural patterning in epha4a mutants.
(A) Confocal images showing reticulospinal neuronal axons in 48 hr post-fertilization (hpf) wild-type and epha4a mutant larvae visualized with anti-neurofilament antibody RMO44. Asterisks indicate the cross sites of Mauthner axons. The green arrow indicates the cell body of the r5/MiD2 neuron in a wild-type larva. The red arrow points to the ipsilaterally projected axon of r6/MiD3 in the mutant larva, which is normally projected to the other side in wild-type fish. (B) Statistical chart showing the distance between r4 and r7 of 48 hpf wild-type and epha4a mutants. (C) Scatter plot showing the distance (d) between the center line and the intersection site of Mauthner axons as indicated in panel C′. (D) The ratio of the distance between the intersection site of Mauthner axons and bilateral axon bundles in 48 hpf wild-type (N=11 larvae) and epha4a mutants (N=12 larvae). The ratios were calculated as in panel D′. Scale bars: 20 µm in panel (A).
Figure 6

Aberrant swimming as a result of abnormal extension of cerebrospinal fluid-contacting neurons (CSF-cNs) axons.
(A) Fluorescent images showing the distribution of ascending axons of CSF-cNs marked by Tg(pkd2l1:GAL4,UAS:Kaede) in 2 days post-fertilization (dpf) epha4a mutant larvae. Yellow line indicates the midline, and the red arrows indicate aberrantly extended axons in epha4a+/- and epha4a-/- larvae. (B) Bar graph showing the percentages of abnormal extension of CSF-cNs axons in 2 dpf wild-type, epha4a heterozygote, and epha4a homozygous. The numbers of larvae are indicated in each column. (C, C’) Superimposed frames of tail oscillations in 5 dpf control and epha4a morphants. (D, D’) A plot of body curvature angles in panels (C) and (C’). The positive angle means turning right. (E) Percentages of tendentious swing in control (N=8 larvae, n=24 experiments) and epha4a morphants (N=11 larvae, n=33 experiments). The percentages were calculated by the ratio of tendentious tail oscillation during the first eight swings. Scale bars: 50 µm in panel (A).
Figure 7 with 1 supplement
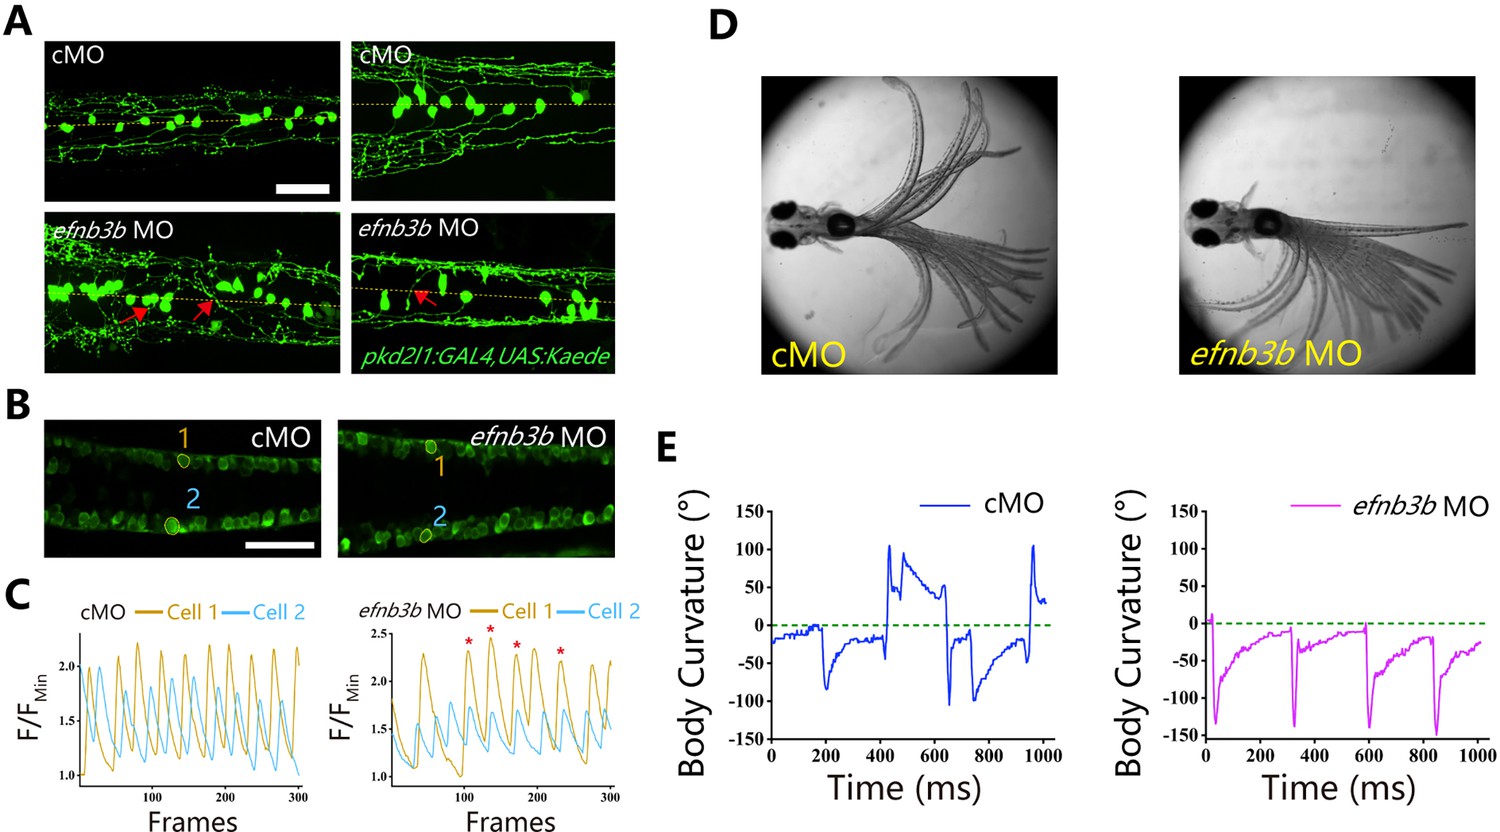
Left-right coordination defects in efnb3b morphants.
(A) Fluorescent images showing the distribution of ascending axons of cerebrospinal fluid-contacting neurons (CSF-cNs) marked by Tg(pkd2l1:GAL4,UAS:Kaede) in 2 days post-fertilization (dpf) efnb3b morphants. The red arrows indicate aberrantly extended axons in efnb3b morphants. (B) Fluorescent images showing the dorsal view of 24 hr post-fertilization (hpf) Tg(elavl3:GAL4; UAS:GCaMP) transgenic larvae. (C) The line chart showing the quantification of fluorescence changes of the region of interests (ROIs) in control morphants and efnb3b morphants as indicated in panel B. (D) Superimposed frames of tail oscillations in 5 dpf control and efnb3b morphants. (E) A plot of body curvature angles in panel (D). The positive angle means turning right. Scale bars: 50 μm in panels (A, B).
Figure 7—figure supplement 1
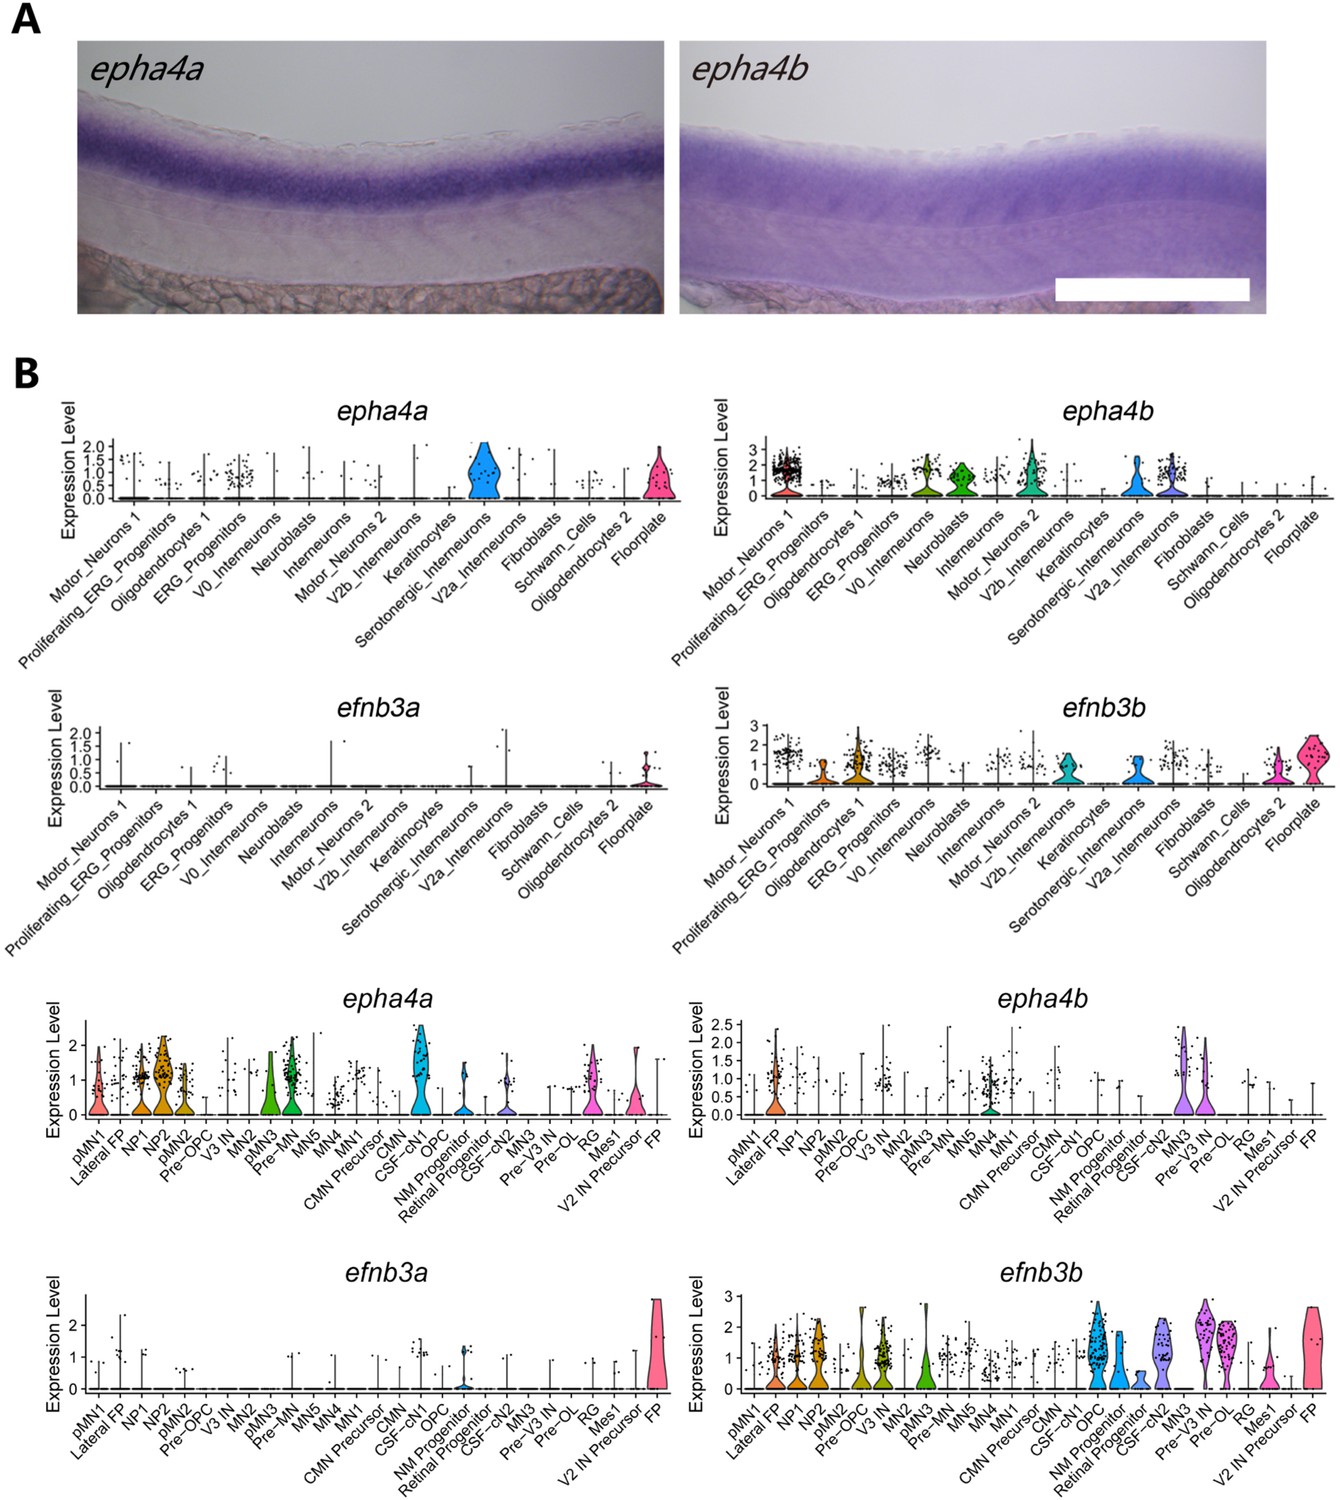
Expression pattern of epha4 and efnb3 in the spinal cord.
(A) Whole-mount in situ hybridization results showing the expression of epha4a and epha4b genes in the spinal cord in 24 days post-fertilization (dpf) zebrafish larvae. (B) Violin plot showing epha4a, epha4b, efnb3a, and efnb3b gene expression in different cell types. Single-cell transcriptome data were acquired from two different studies (top and bottom) (Cavone et al., 2021; Scott et al., 2021). Scale bars: 200 µm in panel (A).
Figure 8 with 1 supplement
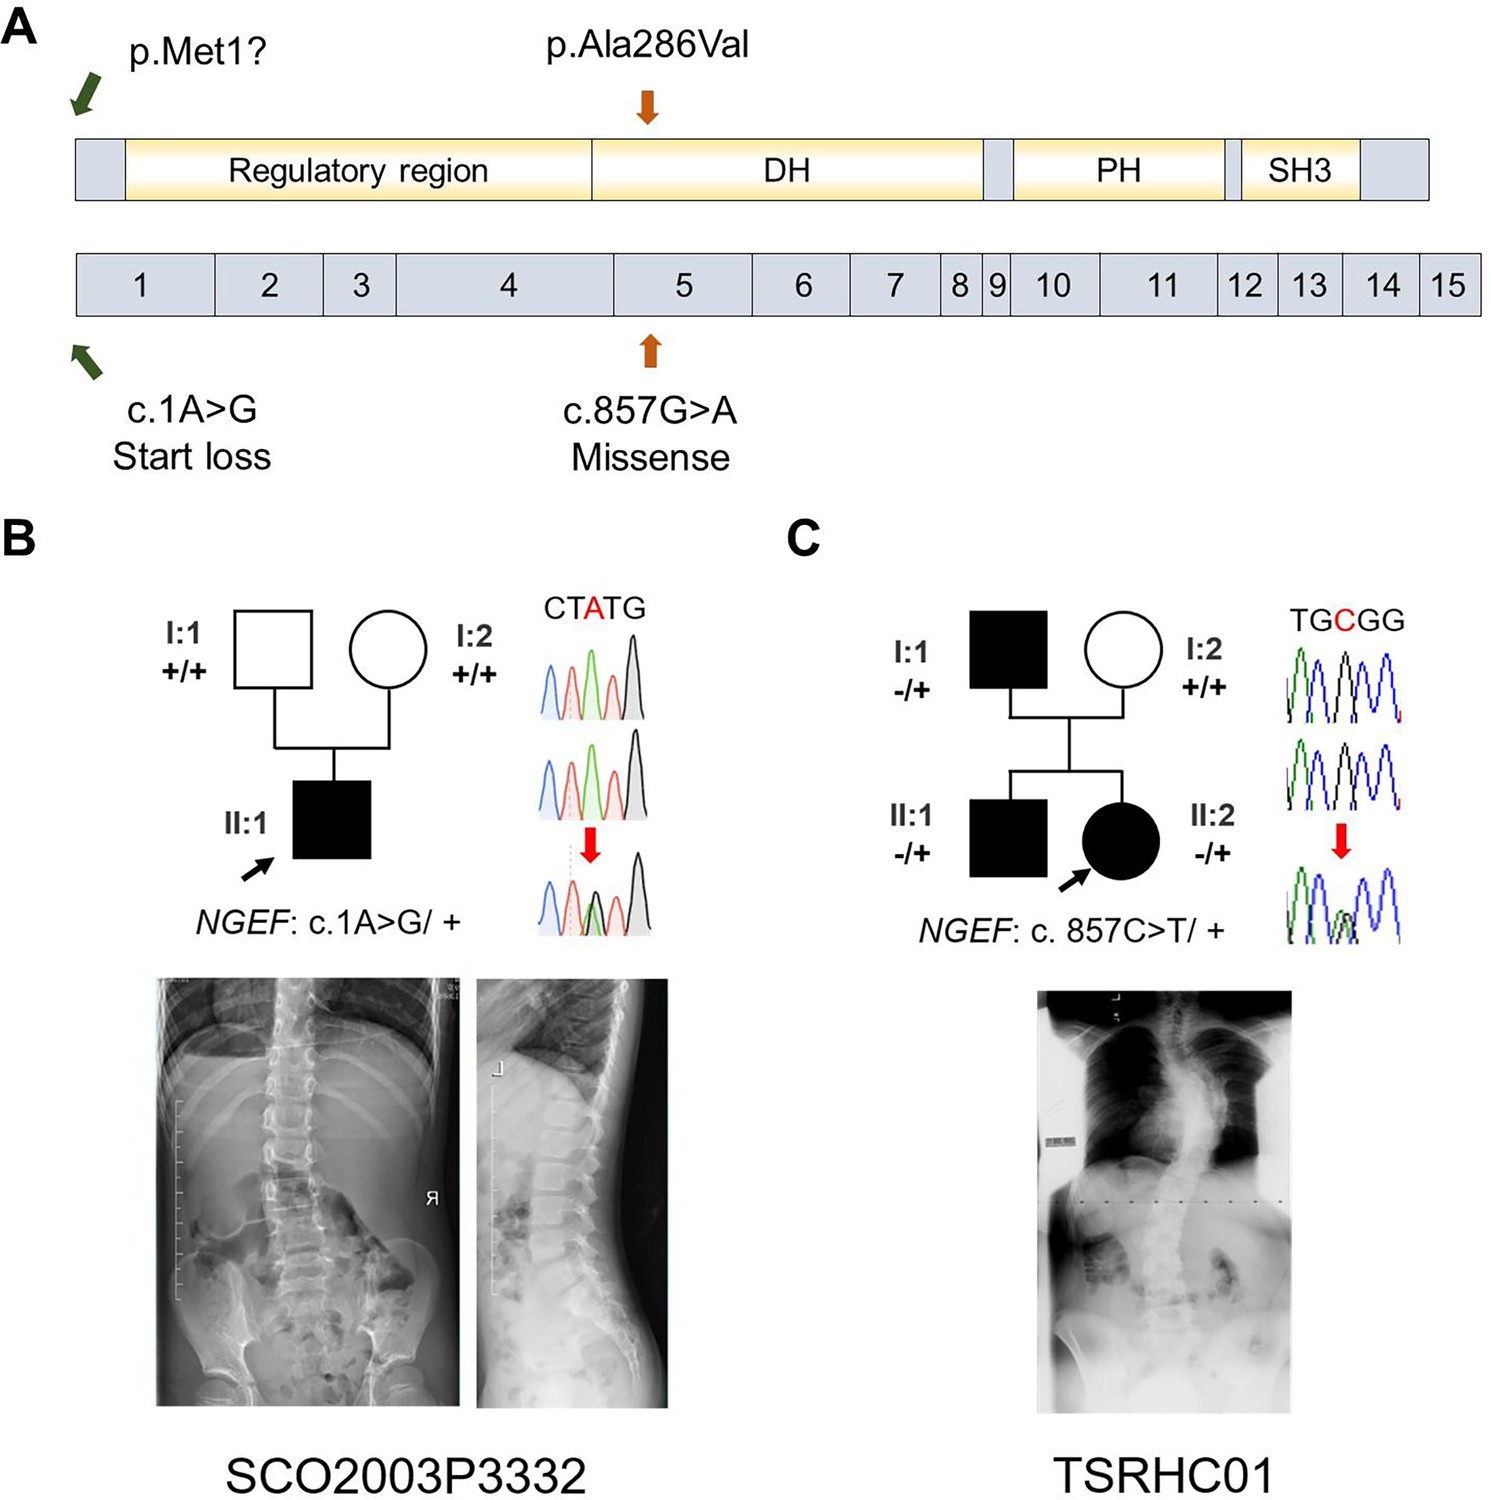
Idiopathic scoliosis (IS) patients with potential NGEF variants.
(A) Protein structure of NGEF protein with the position of potential variants. (B, C) Pedigrees and spinal radiographs of two probands with dominant gene variants. Sanger sequencing results are shown on the right.
Figure 8—figure supplement 1
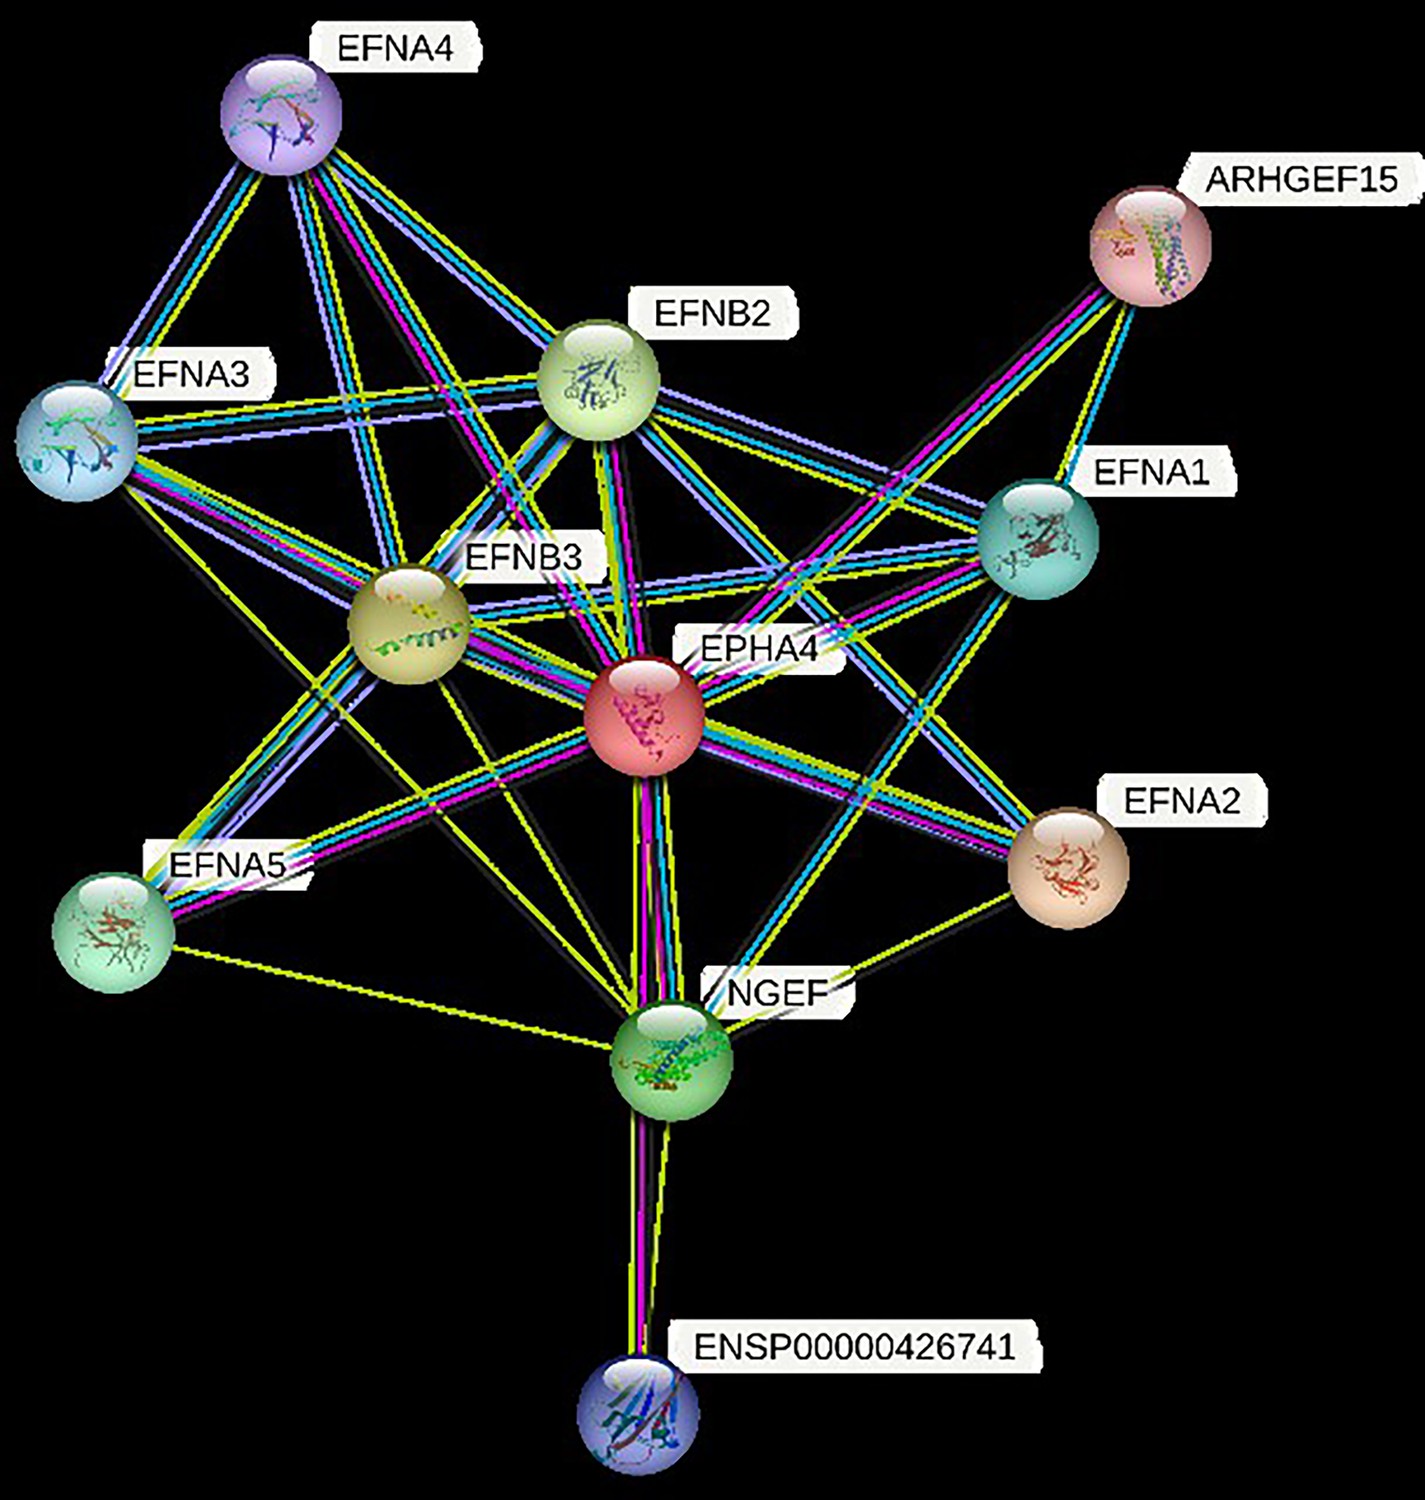
Proteins in STRING that interact with EPHA4.
Protein interaction network analysis, as illustrated by STRING v11.5, was used to identify rare variants in genes related to EPHA4. Known and predicted protein-protein interactions are included in the STRING database. Multiple proteins, including Ephexin, are associated with EPHA4 physically or functionally. Ephexin, encoded by NGEF, is a neuronal guanine exchange factor.
Figure 9

The proposed mechanism of idiopathic scoliosis (IS) mediated by EPHA4 dysfunction.
In healthy individuals, EphrinB3-activated EPHA4 phosphorylates CDK5, leading to the phosphorylation of Ephexin, a protein encoded by NGEF. Phosphorylated Ephexin can regulate axon guidance through either activating RHOA or suppressing CDC42 and RAC1 signaling. These processes are critical in maintaining the normal function of the central pattern generator (CPG), the local neural network that provides coordinated bilateral muscle control. Impairment of the EPHA4 pathway and CPG may cause an imbalance of the motor drive from the spinal cord during development, thus causing the uncoordinated left/right swimming behavior in zebrafish larvae and the asymmetry of the bilateral muscular pull in a young child. Although the appearance is normal in early childhood, the dysfunction produces a scoliotic curve during the growth spurt.
Videos
Video 1
Video showing the swimming of three wild-type fish.
Video 2
Video showing the swimming of three epha4a mutants with severe or mild scoliosis.
Video 3
High-speed video showing the startle response in a wild-type larva at 5 days post-fertilization (dpf) triggered by head tactile stimulation.
Time units: ms.
Video 4
High-speed video showing the abnormal startle response of an epha4a mutant larva at 5 days post-fertilization (dpf) triggered by head tactile stimulation.
Time units: ms.
Video 5
Alternated activation of calcium signaling in motor neurons of 24 hr post-fertilization (hpf) wild-type Tg(elavl3:GAL4; UAS: GCaMP) transgenic larva.
Video 6
Alternated activation of calcium signaling in motor neurons of 24 hr post-fertilization (hpf) wild-type Tg(elavl3:GAL4; UAS: GCaMP) transgenic larva injected with control MO.
Video 7
Abnormal activation of calcium signaling in motor neurons of 24 hr post-fertilization (hpf) Tg(elavl3:GAL4; UAS: GCaMP) transgenic larva with homozygous epha4a mutant background.
Video 8
Abnormal activation of calcium signaling in motor neurons of 24 hr post-fertilization (hpf) Tg(elavl3:GAL4; UAS: GCaMP) transgenic larva injected with epha4a MO.
Video 9
Tail oscillation after light activation of 5 days post-fertilization (dpf) Tg(Gal4s1020t; UAS:ChR2) double transgene larva.
Video 10
Tail oscillation after light activation of 5 days post-fertilization (dpf) Tg(Gal4s1020t; UAS:ChR2) double transgene larva injected with epha4a MO.
Tables
Table 1
Dominantly inherited variants identified in EPHA4 and NGEF.
Abbreviations: Chr: chromosomal localization; AA: amino acid; AD: autosomal dominant; CNV: copy number variant; ExAC PLI: probability of being loss-of-function intolerant from Exome Aggregation Consortium; CADD: Combined Annotation Dependent Depletion score; gnomAD: Genome Aggregation Database; NA: not applicable.
| Patient ID | Chr | Gene | Ethnicity | Inheritance pattern | cDNA change | AA change | Variant type | ExAC PLI | CADD | GnomAD frequency | In-house frequency |
|---|---|---|---|---|---|---|---|---|---|---|---|
| SCO2003P0846 | 2 | EPHA4 | Chinese | De novo | c.1443+1G>C | NA | Splice donor | 1 | 21.4 | 0 | 0 |
| SCO2003P2146 | 2 | EPHA4 | Chinese | De novo | c.2546G>A | p.Cys849Tyr | Missense | 1 | 28.2 | 0 | 0 |
| SCO2003P2080 | 2 | EPHA4 | Chinese | De novo | c.1318+10344A>G | NA | Intronic | 1 | NA | 0 | 0 |
| SCO2003P3202 | 2 | EPHA4 | Chinese | De novo | 2q35-36.2 4.6Mb deletion | NA | CNV | NA | NA | 0 | 0 |
| SCO2003P3332 | 2 | NGEF | Chinese | De novo | c.1A>G | p.Met1? | Start lost | 0.95 | 12.8 | 0 | 0 |
| TSRHC01 | 2 | NGEF | Non-Hispanic White | AD | c.857C>T | p.Ala286Val | Missense | 0.95 | 29.6 | 0.00002 | 0 |
Additional files
-
Supplementary file 1
Summary of the 14 studies and their corresponding single-nucleotide polymorphisms (SNPs) included in the candidate genes mapping.
- https://cdn.elifesciences.org/articles/95324/elife-95324-supp1-v1.docx
-
Supplementary file 2
Summarized results of burden analysis.
- https://cdn.elifesciences.org/articles/95324/elife-95324-supp2-v1.docx
-
Supplementary file 3
The significant single-nucleotide polymorphisms (SNPs) in the EPHA4 region identified from East Asian genome-wide association study (GWAS) meta-analysis.
- https://cdn.elifesciences.org/articles/95324/elife-95324-supp3-v1.xlsx
-
Supplementary file 4
Search strategies for each database.
- https://cdn.elifesciences.org/articles/95324/elife-95324-supp4-v1.docx
-
Supplementary file 5
Inclusion and exclusion criteria of literature review.
- https://cdn.elifesciences.org/articles/95324/elife-95324-supp5-v1.docx
-
Supplementary file 6
Sequencing information of PUMCH idiopathic scoliosis (IS) cohort.
- https://cdn.elifesciences.org/articles/95324/elife-95324-supp6-v1.docx
-
Supplementary file 7
Sequences information of single guide RNA (sgRNA) and primers for zebrafish study.
- https://cdn.elifesciences.org/articles/95324/elife-95324-supp7-v1.docx
-
MDAR checklist
- https://cdn.elifesciences.org/articles/95324/elife-95324-mdarchecklist1-v1.docx
Download links
A two-part list of links to download the article, or parts of the article, in various formats.
Downloads (link to download the article as PDF)
Open citations (links to open the citations from this article in various online reference manager services)
Cite this article (links to download the citations from this article in formats compatible with various reference manager tools)
EPHA4 signaling dysregulation links abnormal locomotion and the development of idiopathic scoliosis
eLife 13:RP95324.
https://doi.org/10.7554/eLife.95324.3


