Role of N343 glycosylation on the SARS-CoV-2 S RBD structure and co-receptor binding across variants of concern
- Department of Chemistry, Maynooth University, Ireland
- Department of Chemistry, University of Alberta, Canada
- Human Health Therapeutics Research Centre, Life Sciences Division, National Research Council Canada, Canada
- Département de Biochimie et Médecine Moléculaire, Université de Montréal, Canada
- School of Biological Sciences, University of Southampton, United Kingdom
Figures
Figure 1
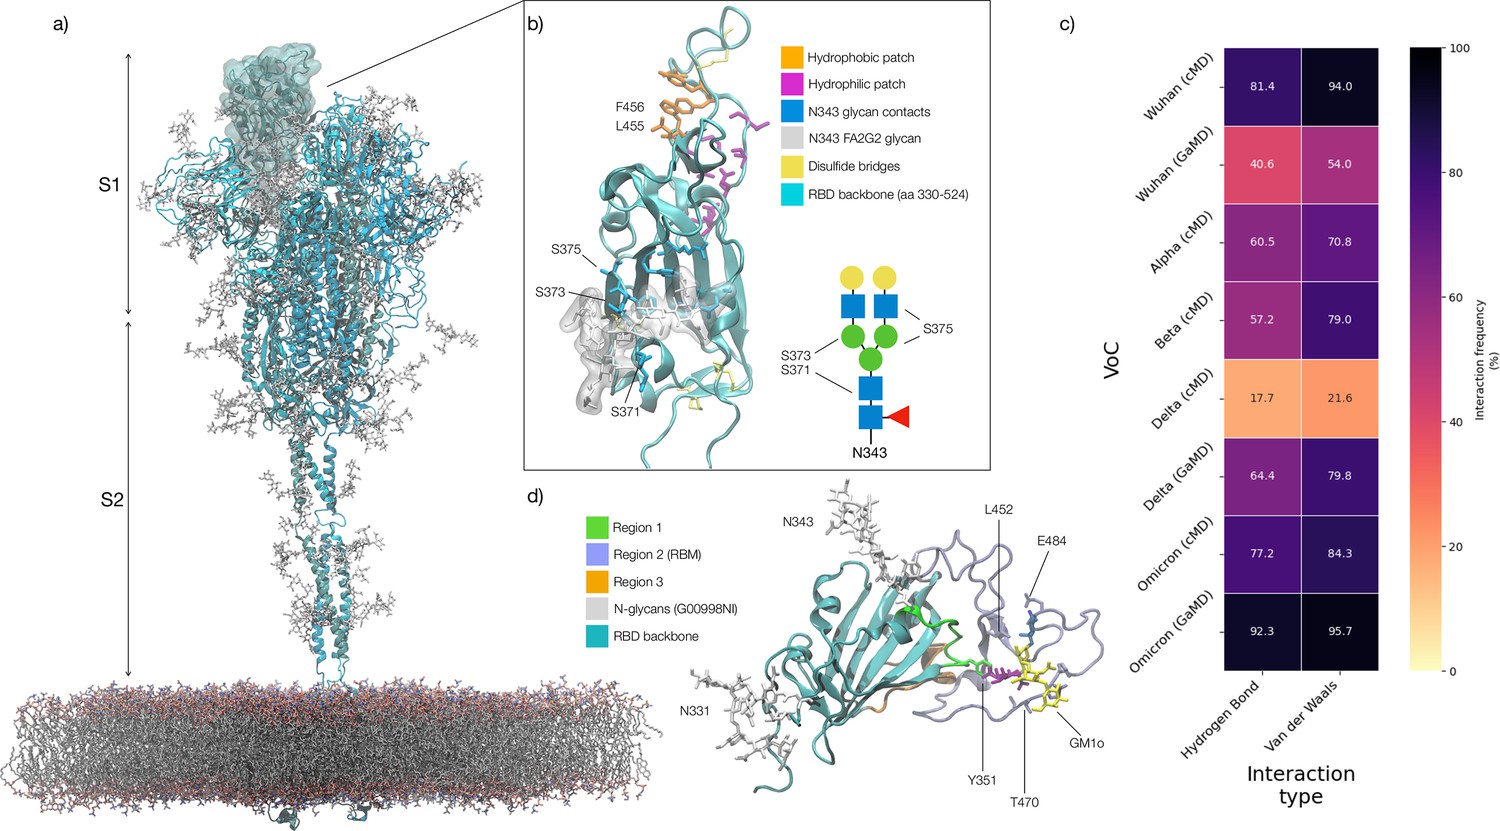
Structure of the SARS-CoV-2 (WHu-1) Spike (S) glycoprotein and of the receptor binding domain (RBD) with a heat map of the interactions between the N343 glycan and the RBD in different variants of concern.
(a) Atomistic model of the SARS-CoV-2 (WHu-1) S glycoprotein trimer embedded in a lipid bilayer as reported in Casalino et al., 2020. In the conformation shown, the S bears the receptor binding domain (RBD) of chain A in an open conformation, highlighted with a solvent accessible surface rendering. The topological S1 and S2 subdomains are indicated on the left-hand side. Glycans are represented with sticks in white, the protein is represented with cartoon rendering with different shades of cyan to highlight the chains. (b) Close-up of the open RBD (WHu-1) in a angiotensin-converting enzyme 2 (ACE2)-bound conformation (PDB 6M0J), with regions colour-coded as described in the legend. Key residues for anchoring the N343 glycan (GlyTouCan-ID G00998NI; FA2G2 Oxford nomenclature), namely S371, S373, and S375, across the beta sheet core are highlighted also in the symbol nomenclature for glycans (SNFG) diagram on the bottom-right with links to the monosaccharides corresponding to primary contacts. Key residues of the hydrophobic patch (orange) found to be inverted in the recently isolated FLip XBB1.5 variant are also indicated. (c) Heat map indicating the interactions frequency (%) classified in terms of hydrogen bonding and van der Waals contacts between the N343 glycan and the RBD residues 365–375 for each variants of concern (VoC), over the cumulative conventional MD (cMD) and enhanced gaussian accelerated MD (GaMD) sampling. (d) Side view of the RBD highlighting the GM1o binding region (SNFG colouring) and the antigenic Region 1 (green s), Region 2 (or RBM in ice-blue), and Region 3 (orange). Key residues Y351, L452, T470, and E484 are labelled and shown with sticks. N-glycans (white sticks) are labelled according to their linkage to residues Asn 331 and Asn 343. Rendering done with VMD (https://www.ks.uiuc.edu/Research/vmd/).
Figure 2
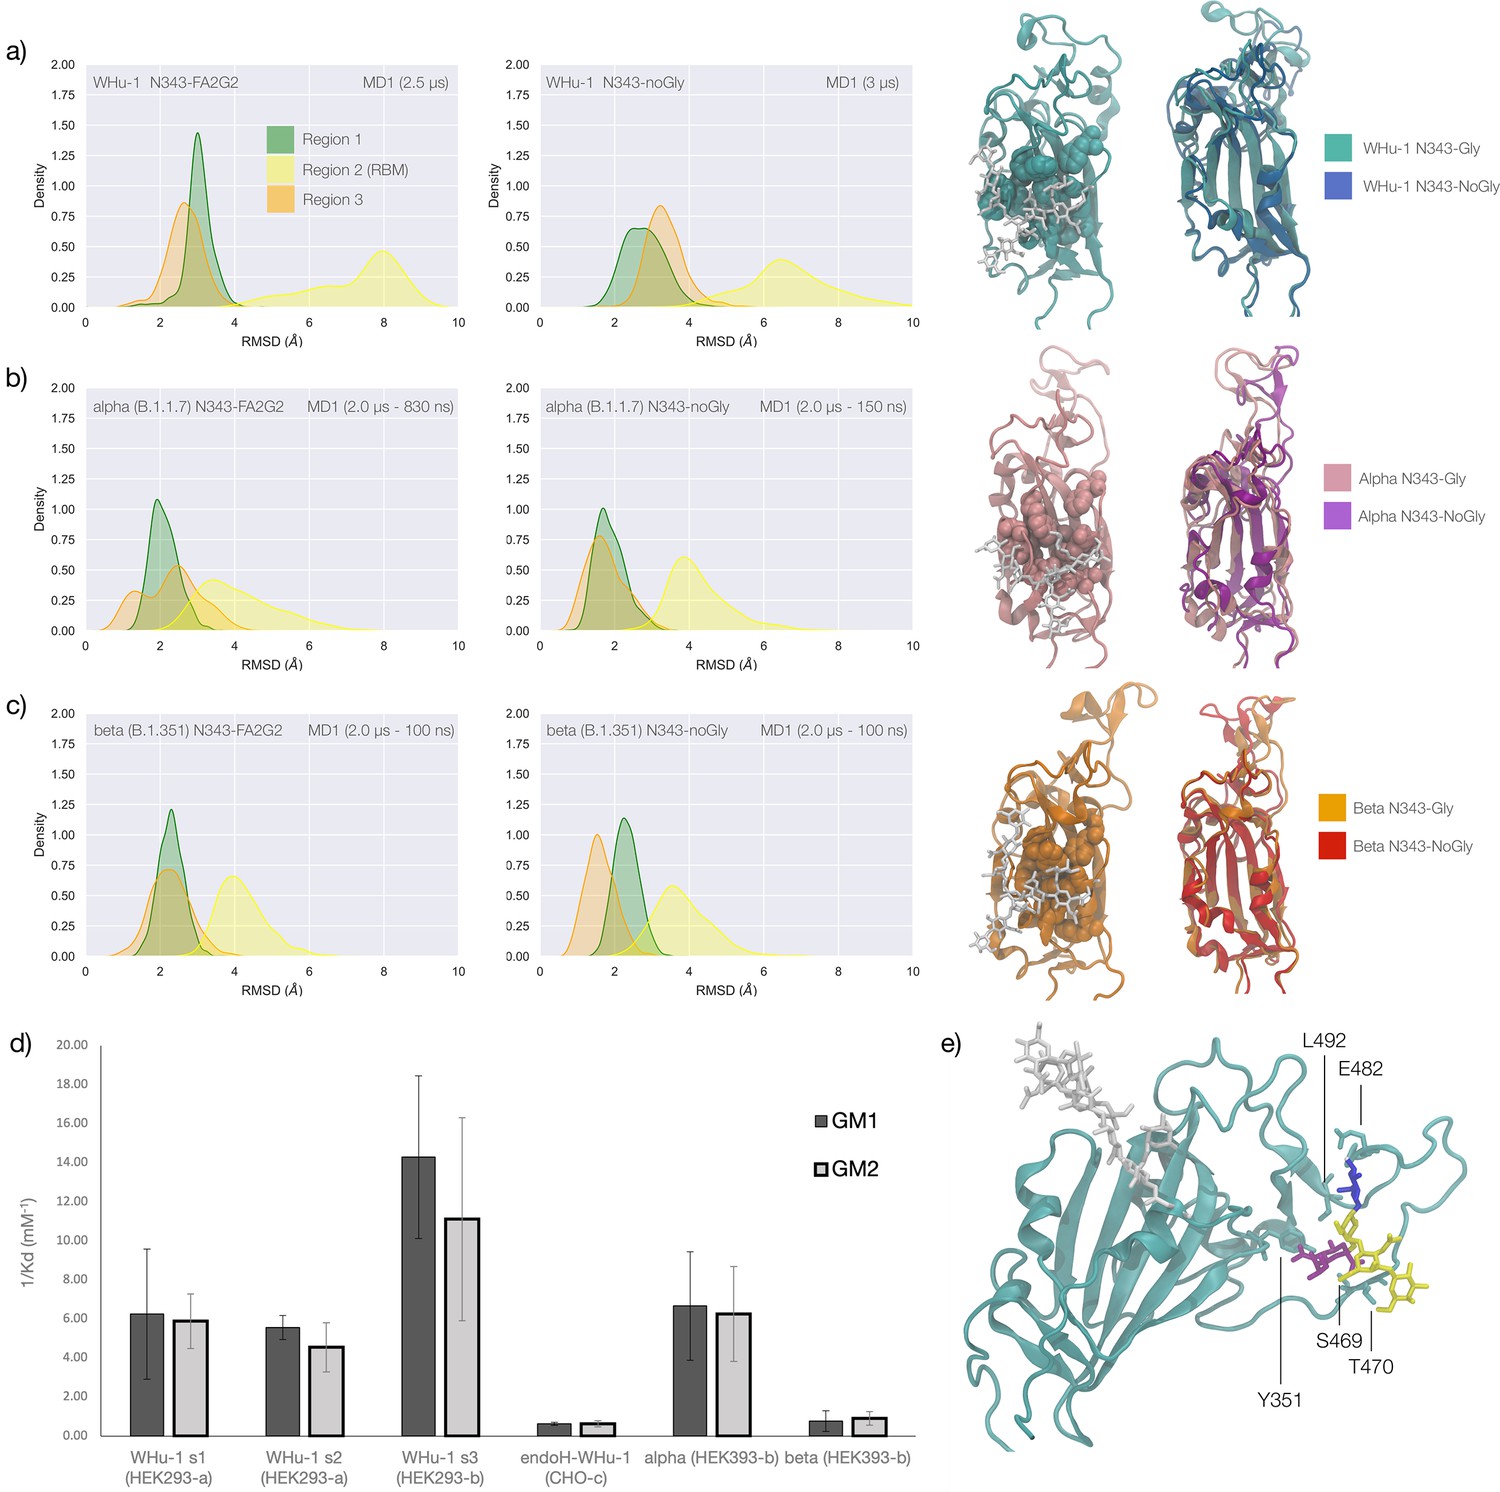
Conformational changes of the S receptor binding domain (RBD) structure in function of loss of N-glycosylation at N343 in WHu-1, alpha and beta variants and binding affinities for interactions between different RBDs and GM1/2os.
(a) Kernel density estimates (KDE) plot of the backbone RMSD values calculated relative to frame 1 (t=0) of the trajectory for Region 1 (green) aa 337–353, Region 2 (yellow) aa 439–506, and Region 3 (orange) aa 411–426 of the glycosylated (left plot) and non-glycosylated (right plot) WHu-1 RBDs. Duration of the molecular dynamics (MD) sampling is indicated on the top-right corner of each plot with the conformational equilibration time subtracted as the corresponding data were not included in the analysis. Representative structures from the MD trajectories of the WHu-1 RBD glycosylated (cyan) and non-glycosylated (blue) at N343 are shown on the right-hand side of the panel. The N343 glycan (GlyTouCan-ID G00998NI) is rendered with sticks in white, the hydrophobic residues underneath the N343 glycan are highlighted with VDW spheres, while the protein structure is represented with cartoons. (b) KDE plot of the backbone RMSD values (see details in (a) above) calculated for the alpha (B.1.1.7) RBD glycosylated (left) and non-glycosylated (right) at N343. Representative structures from the MD simulation of the alpha RBDs are shown on the right-hand side of the panel, with the N343 glycosylated RBD shown with pink cartoons and the non-glycosylated alpha RBD in purple cartoons. (c) KDE plots of the backbone RMSD values calculated for the beta (B.1.351) RBD glycosylated (left) and non-glycosylated (right) at N343. Representative structures from the MD simulation of the beta RBDs are shown on the right-hand side of the panel, with the N343 glycosylated RBD shown with orange cartoons and the non-glycosylated alpha RBD in red cartoons. (d) Binding affinities (1/Kd, x103 M–1) for interactions between different RBDs (including intact and endoF3 treated WHu-1 RBD and alpha and beta RBD) and the GM1os (GlyTouCan-ID G46613JI) and GM2os (GlyTouCan-ID G61168WC) oligosaccharides. HEK293a samples (Nguyen et al., 2022) and shown here as reference. HEK293b samples all carry FLAG and His tags and are shown for WHu-1 (glycosylated and treated with endoF3 treated), alpha, and beta sequences. Further details are in Appendix 1. (e) Predicted complex between the WHu-1 RBD and GM1os, with GM1os represented with sticks in symbol nomenclature for glycans (SNFG) colours, the protein represented with cartoons (cyan), and the N343 with sticks (white). Residues directly involved in the GM1os binding or proximal are labelled and highlighted with sticks. All N343 glycosylated RBDs carry also a FA2G2 N-glycan (GlyTouCan-ID G00998NI) at N331, which is not shown for clarity. Rendering done with VMD (https://www.ks.uiuc.edu/Research/vmd/), KDE analysis with seaborn (https://seaborn.pydata.org/), and bar plot with MS Excel.
Figure 3
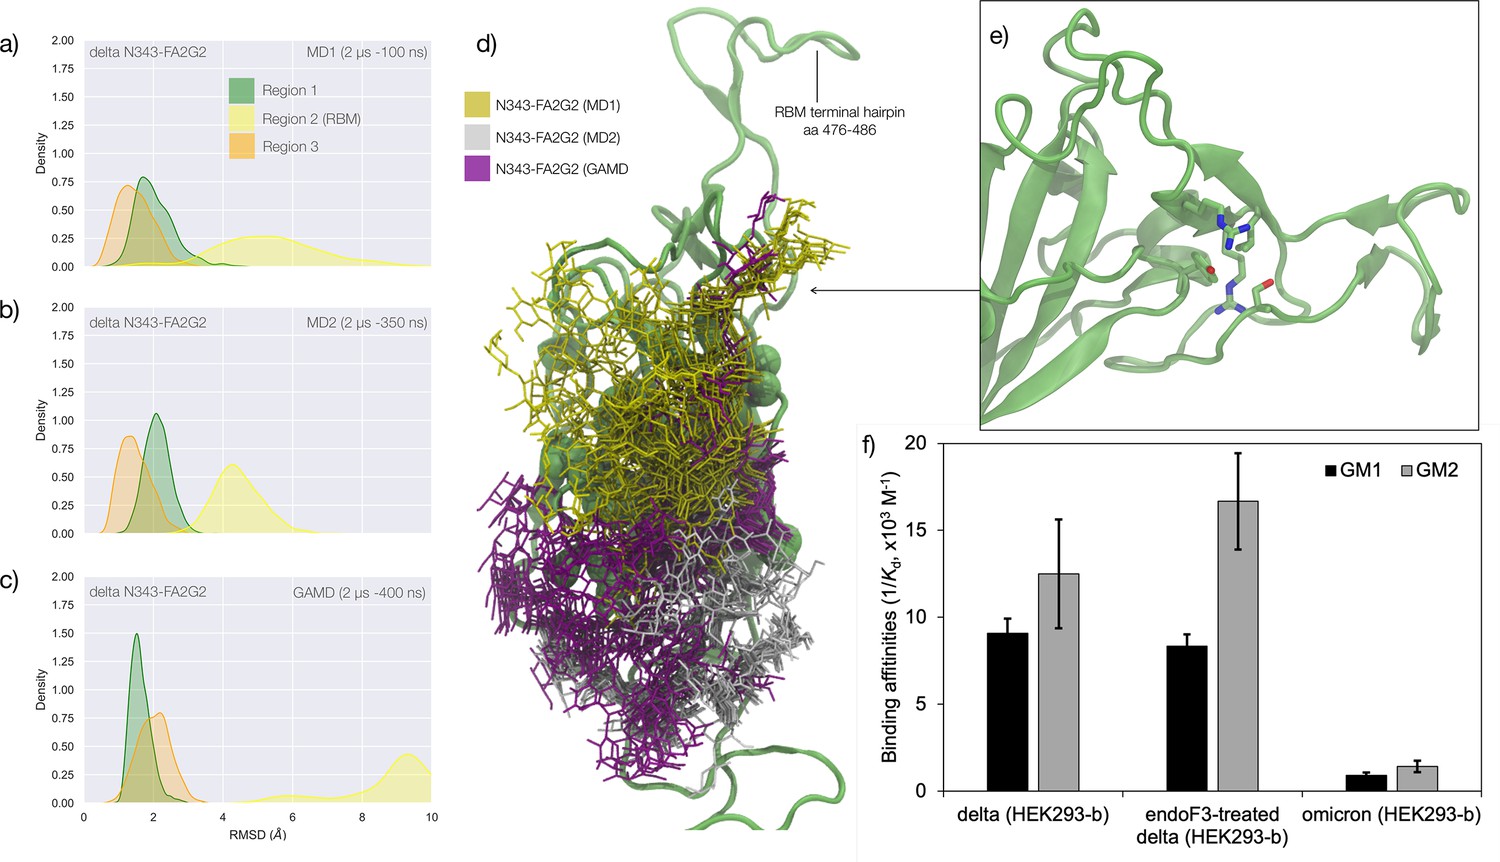
Conformational analysis and 3D structure of the S receptor binding domain (RBD) in the delta variant glycosylated at N343 with a diagram showing binding affinity to GM1/2os in the presence and absence of the glycan at N343 and in the omicron variant.
(a) Kernel density estimates (KDE) plot of the backbone RMSD values calculated relative to frame 1 (t=0) of the MD trajectories (MD1) trajectory for Region 1 (green) aa 337–353, Region 2 (yellow) aa 439–506, and Region 3 (orange) aa 411–426 of the N343 glycosylated delta (B.1.617.2) RBD. The MD1 simulation was started from the open RBD conformation from the cryo-EM structure PDB 7V7Q. Based on the conformation of the N-glycan reconstructed at N353, the first 100 ns of the MD1 production trajectory were considered part of the conformational equilibration and not included in the data analysis. (b) KDE plot of the backbone RMSD values calculated relative to frame 1 (t=0) of the MD2 trajectory for Regions 1–3 (see details above) of the N343 glycosylated delta (B.1.617.2) RBD. The MD2 simulation was started from the open RBD conformation from the cryo-EM structure PDB 7V7Q with different velocities relative to MD1. The first 350 ns of the MD2 production trajectory were considered part of the conformational equilibration and not included in the data analysis. (c) KDE plot of the backbone RMSD values calculated relative to frame 1 (t=0) of the gaussian accelerated MD (GaMD) trajectory for Regions 1–3 of the N343 glycosylated delta (B.1.617.2) RBD. The first 400 ns of the GaMD production trajectory were considered part of the conformational equilibration and not included in the data analysis. (e) Graphical representation of the delta RBD with the protein structure (lime cartoon) from a representative snapshot from MD1. The N343 FA2G2 glycan (GlyTouCan-ID G00998NI) is represented in different colours, corresponding to the different molecular dynamics (MD) trajectories, as described in the legend, with snapshots taken at intervals of 100 ns. Residues in the hydrophobic core of the delta RBD are represented with VDW spheres partially visible under the N-glycans overlay. (f) Insert showing the junction between Regions 1 and 2 from the left-hand side of the RBD in (e). The residues involved in the network solidifying the junction are highlighted with sticks and labelled. (f) Affinities (1/Kd, x103 M–1) for interactions between GM1os (GlyTouCan-ID G46613JI) and GM2os (GlyTouCan-ID G61168WC) oligosaccharides and the intact and endoF3-treated delta RBD and omicron RBD. Rendering done with VMD (https://www.ks.uiuc.edu/Research/vmd/), KDE analysis with seaborn (https://seaborn.pydata.org/), and bar plot with MS Excel.
Figure 4
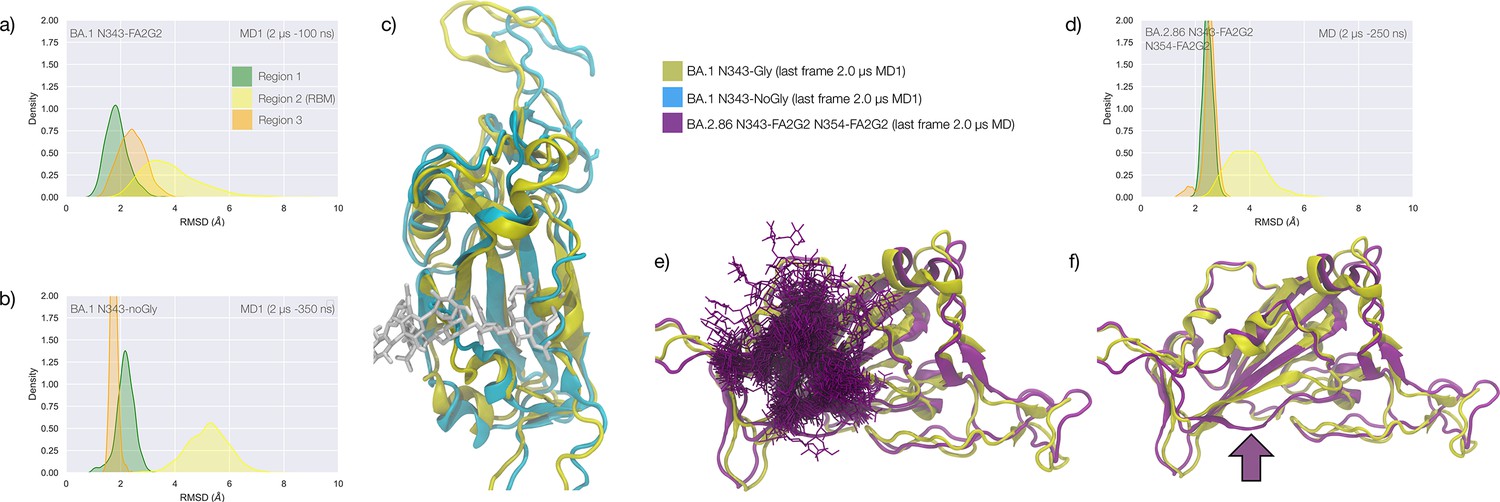
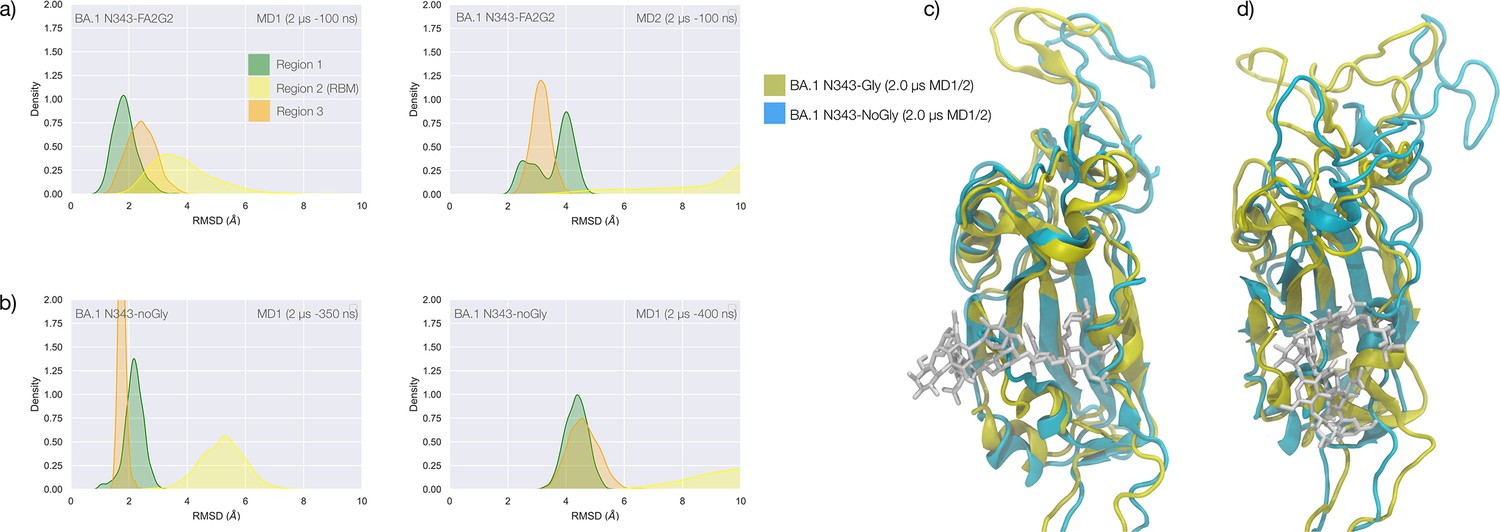
Conformational dynamics of the BA.1 and BA.2.86 S receptor binding domain (RBD) in function of N343 glycosylation.
(a) Kernel density estimates (KDE) plot of the backbone RMSD values calculated relative to frame 1 (t=0) of the gaussian accelerated MD (GaMD) trajectory for Region 1 (green) aa 337–353, Region 2 (yellow) aa 439–506, and Region 3 (orange) aa 411–426 of the glycosylated omicron (BA.1) RBD. (b) KDE plot of the backbone RMSD values calculated relative to frame 1 (t=0) of the GaMD trajectory (see details above) of the non-glycosylated omicron (BA.1) RBD. (c) Graphical representation of the glycosylated (protein in yellow cartoons and N343-FA2G2 in white sticks, N331 omitted for clarity) and non-glycosylated (protein in cyan cartoons) of the omicron (BA.1) RBD. Structures correspond to the last frame of the GaMD trajectories, see details in the legend. (d) KDE plot of the backbone RMSD values calculated relative to frame 1 (t=0) of the molecular dynamics (MD) trajectory of the omicron BA.2.86 RBD glycosylated with FA2G2 N-glycans at N343, N354 and N331 (not shown). (e) Graphical representation of the omicron BA.2.86 RBD (protein in violet cartoons and N-glycans in violet sticks) structurally aligned to the glycosylated omicron (BA.1) RBD (protein in yellow cartoons) for reference. The N343 and N354 glycans are intertwined throughout the trajectory. (f) Same graphical representation of the omicron BA.2.86 and BA.1 RBDs with the N-glycans not shown. The purple arrow points to the displacement of the loop in response to the presence of the N354 glycan in BA.2.86. Rendering with VMD (https://www.ks.uiuc.edu/Research/vmd/) and KDE analysis with seaborn (https://seaborn.pydata.org/).
Appendix 1—figure 1
Amino acid sequence of SARS-CoV-2 spike (S) protein variants and mutations on receptor binding domain (RBD) used in this study.
Appendix 1—figure 2
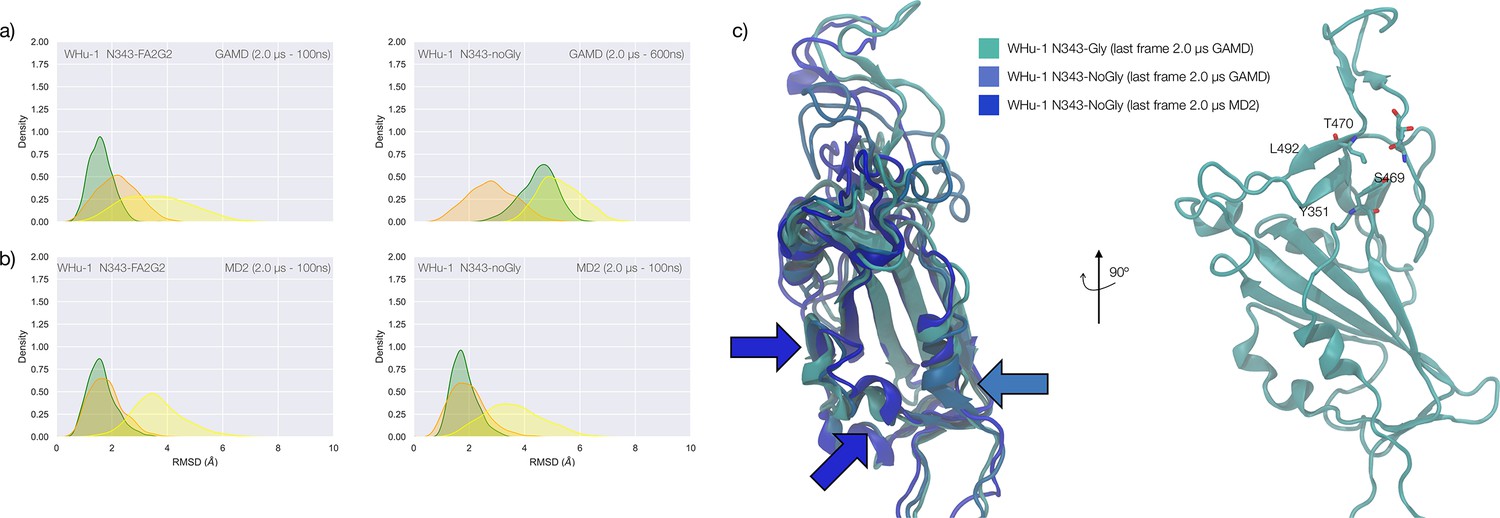
Conformational dynamics of the WHu-1 receptor binding domain (RBD) in function of N343 glycosylation.
(a) Kernel density estimates (KDE) plots of the backbone RMSD values calculated relative to frame 1 (t=0) of the gaussian accelerated MD (GaMD) trajectory for Region 1 (green) aa 337–353, Region 2 (yellow) aa 439–506, and Region 3 (orange) aa 411–426 of the N343 glycosylated and non-glycosylated WHu-1 RBD. The GaMD simulations were started from the structure of the RBD in PDB 6M0J. The first 100 ns of the N343 glycosylated RBD trajectory were considered part of the conformational equilibration and not included in the data analysis. The first 600 ns of the trajectory obtained for the N343 non-glycosylated WHu-1 RBD were considered part of the conformational equilibration and not included in the data analysis. (b) KDE plots of the backbone RMSD values calculated relative to frame 1 (t=0) of the conventional molecular dynamics (MD) trajectory MD2 (see details above). MD2 was started from the conformation of the RBD in PDB 6M0J. The first 100 ns of both trajectories were considered part of the conformational equilibration and not included in the data analysis. (c) Graphical representation of the structural alignment of N343 glycosylated and non-glycosylated RBDs from the last frames of the GaMD and MD2 trajectories. Colour-coded arrows (see legend) indicate where the main conformational changes leading to the tightening of the helices occur in each system. Proteins are represented by cartoons and N343 glycan is not represented for clarity. On the right-hand side a rotation of the RBD by 90°Clockwise shows how the hydrophilic loop in Region 2 is still well connected to Y351 in Region 1 at the end of the GaMD N343 glycosylated WHu-1 RBD. Rendering done with VMD (https://www.ks.uiuc.edu/Research/vmd/) and KDE analysis with seaborn (https://seaborn.pydata.org/).
Appendix 1—figure 3
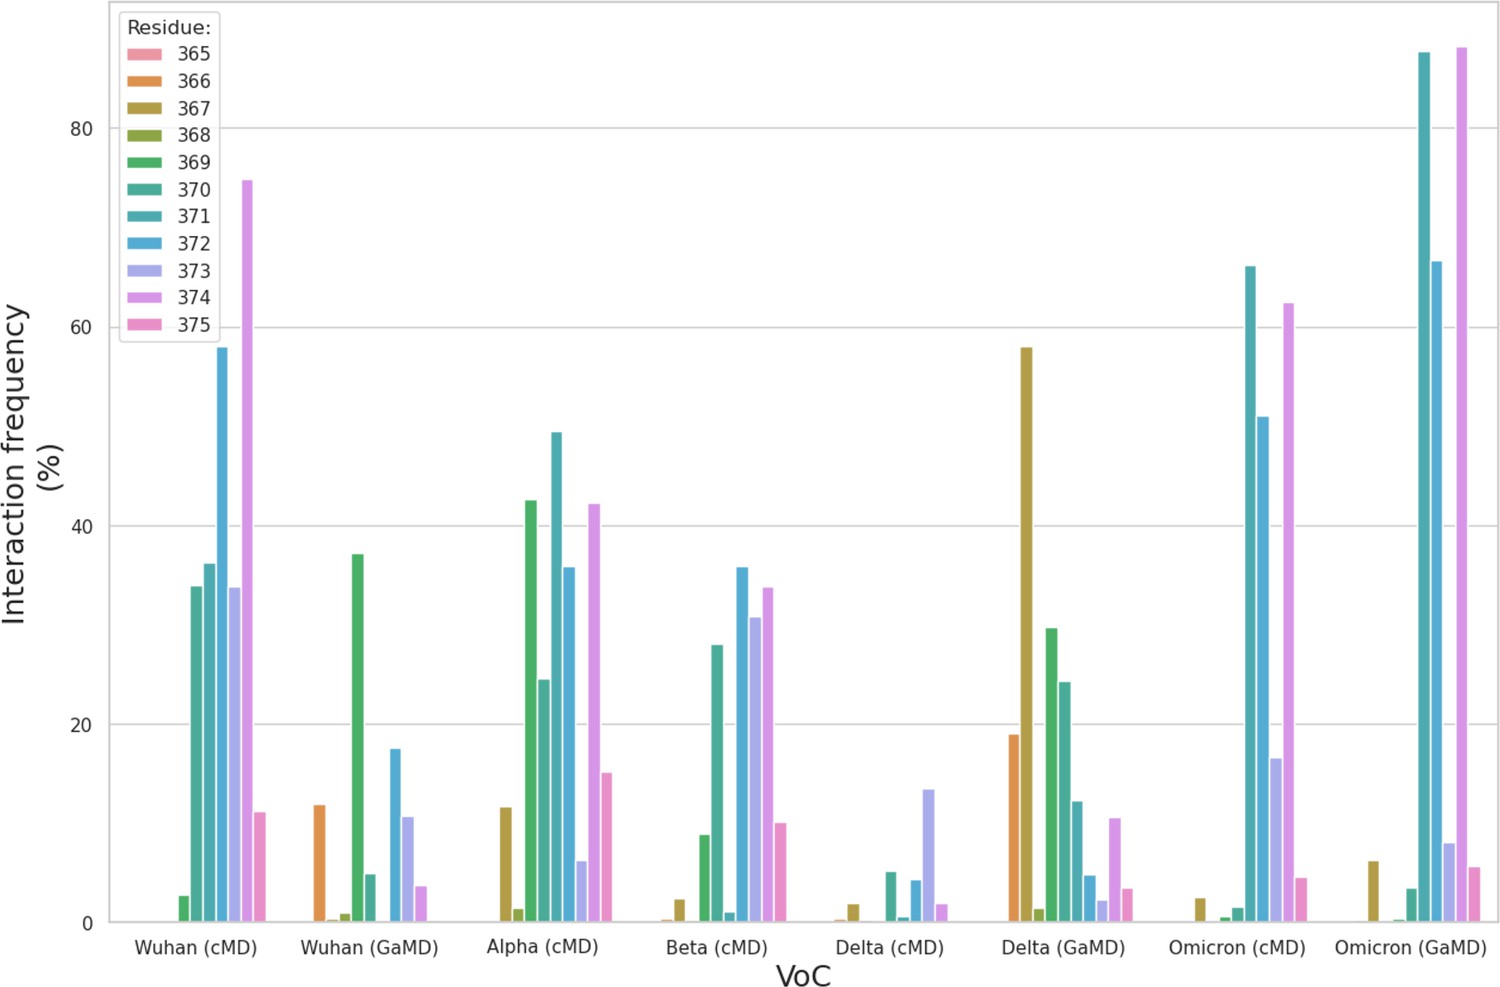
Bar plot of the interaction frequencies (%) of the N343 N-glycan with the different residues within the aa 365–375 loop for each variants of concern (VoC).
The interactions include both hydrogen bonding and dispersion (van der Waals) contacts.
Appendix 1—figure 4
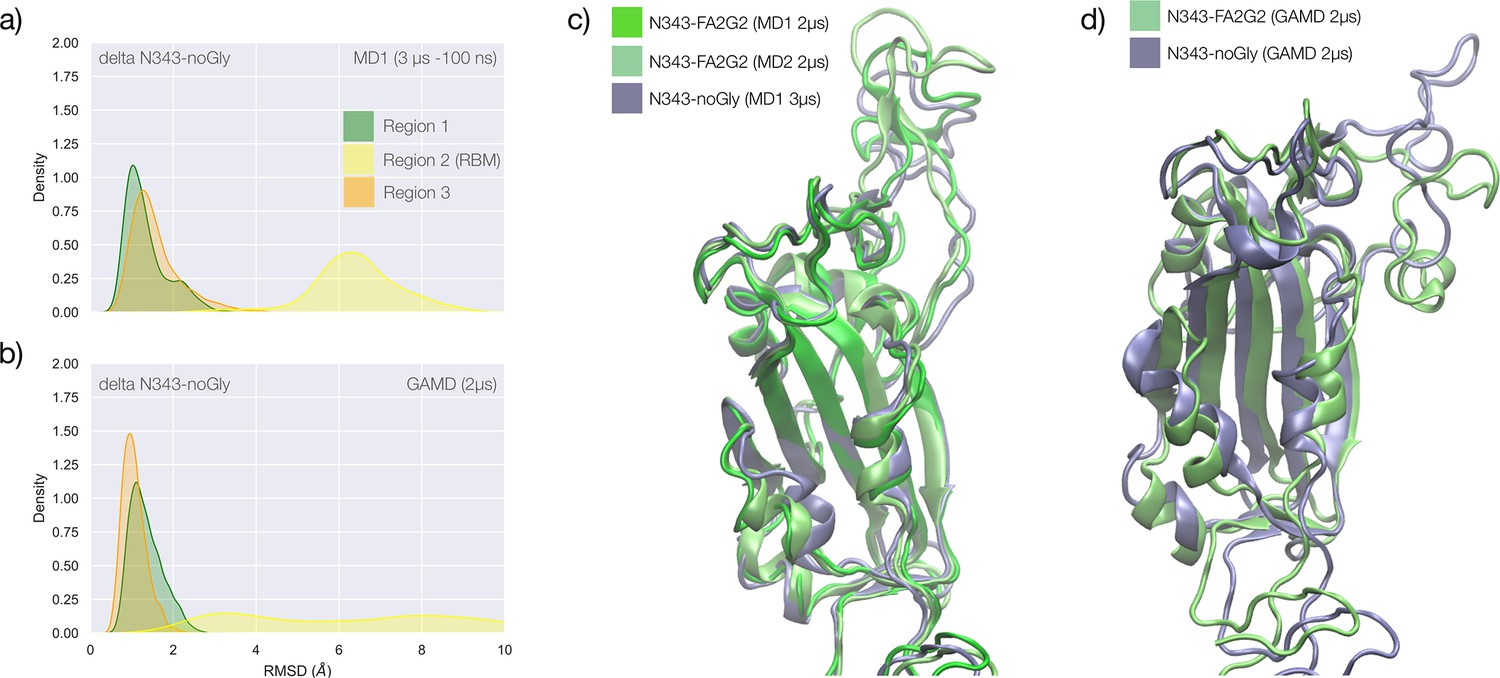
Conformational dynamics of the delta receptor binding domain (RBD) in function of N343 glycosylation.
(a) Kernel density estimates (KDE) plot of the backbone RMSD values calculated relative to frame 1 (t=0) of the MD1 trajectory for Region 1 (green) aa 337–353, Region 2 (yellow) aa 439–506, and Region 3 (orange) aa 411–426 of the N343 non-glycosylated delta RBD. (a) KDE plot of the backbone RMSD values calculated relative to frame 1 (t=0) of the gaussian accelerated MD (GaMD) trajectory of the N343 non-glycosylated delta RBD. (c) Graphical representations of the delta RBD structures from the last frame of the conventional simulation MD1 (N343 glycosylated and non-glycosylated) and MD2 (N343 glycosylated) with colourings indicated in the legend. Protein is represented with cartoons and the N343 and N331 glycans are omitted for clarity. (c) Graphical representations of the structurally aligned delta RBD structures from the last frame of the accelerated simulation GaMD (N343 glycosylated and non-glycosylated). Protein is represented with cartoons and the N343 and N331 glycans are omitted for clarity. Rendering done with VMD (https://www.ks.uiuc.edu/Research/vmd/) and KDE analysis with seaborn (https://seaborn.pydata.org/).
Appendix 1—figure 5
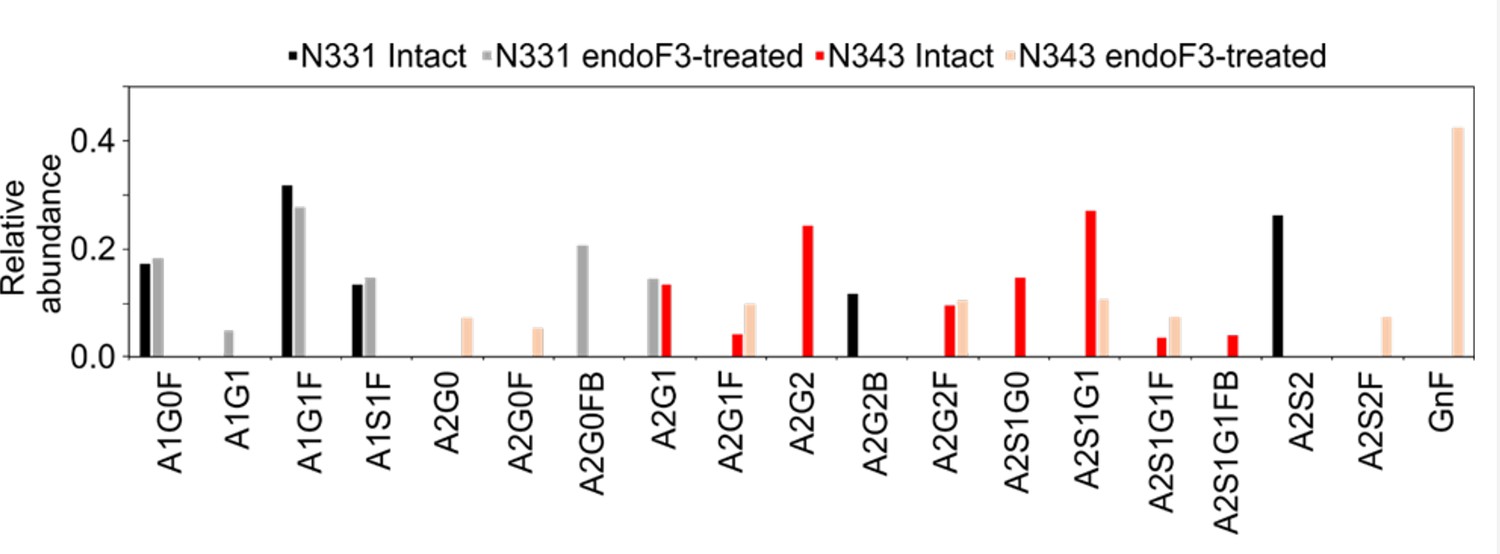
Relative abundance of N-glycans at N331 and N343 on the wild-type (WT) receptor binding domain (RBD) before and after endoF3 treatment.
Appendix 1—figure 6
Conformational dynamics of the BA.1 receptor binding domain (RBD) in function of N343 glycosylation.
(a) Kernel density estimates (KDE) plot of the backbone RMSD values calculated relative to frame 1 (t=0) of the MD1 (left) and MD2 (right) trajectories for Region 1 (green) aa 337–353, Region 2 (yellow) aa 439–506, and Region 3 (orange) aa 411–426 of the glycosylated omicron (BA.1) RBD. (b) KDE plot of the backbone RMSD values calculated relative to frame 1 (t=0) of the MD1 and MD2 trajectories (see details above) of the non-glycosylated omicron (BA.1) RBD. (c) Graphical representation of the structural alignment of the glycosylated (protein in yellow cartoons and N343-FA2G2 in white sticks, N331 omitted for clarity) and non-glycosylated (protein in cyan cartoons) of the omicron (BA.1) RBD from MD1. (d) Graphical representation of the structural alignment of the glycosylated (protein in yellow cartoons and N343-FA2G2 in white sticks, N331 omitted for clarity) and non-glycosylated (protein in cyan cartoons) of the omicron (BA.1) RBD from MD2. Structures correspond to the last frames of the trajectories, see details in the legend. Rendering done with VMD (https://www.ks.uiuc.edu/Research/vmd/) and KDE analysis with seaborn (https://seaborn.pydata.org/).
Tables
Appendix 1—table 1
Molecular dynamics (MD) sampling methods and corresponding times in the production phase of the simulations.
MD1 and MD2 indicate trajectories collected through conventional (deterministic) sampling. Gaussian accelerated MD (GaMD) indicates trajectories obtained through Gaussian accelerated MD sampling. Further details on the methodology and starting structures are in the text.
| N343-FA2G2 (μs) | N343 NoGly (μs) | |||||
|---|---|---|---|---|---|---|
| Variant | MD1 | MD2 | GaMD | MD1 | MD2 | GaMD |
| WHu-1 | 2.5 | 2.0 | 2.0 | 3.0 | 2.0 | 2.0 |
| Alpha (B.1.1.7) | 2.0 | - | - | - | 2.0 | - |
| Beta (B.1.351) | 2.0 | - | - | - | 2.0 | - |
| Delta (B.1.617.2) | 2.0 | 2.0 | 2.0 | 3.0 | - | 2.0 |
| Omicron (BA.1) | 2.0 | 2.0 | 2.0 | 2.0 | 2.0 | 2.0 |
| Omicron (BA.2.86) | 2.0 | - | - | - | - | - |
| Total (46.5) | 12.5 | 6.0 | 6.0 | 8.0 | 8.0 | 6.0 |
Appendix 1—table 2
Affinities of the oligosaccharides of GM1 and GM2 (GM1os and GM2os, respectively) for WHu-1, Alpha, Beta, Delta, and Omicron receptor binding domain (RBD) and endoH-treated WHu-1 RBD and endoF3-treated WHu-1 and Delta RBD measured by ESI-MS for aqueous ammonium acetate (100 mM, pH 7.4) solutions containing a given RBD (5 μM) and glycan (three different initial concentrations ranging from 10 μM to 150 μM).
Data represent mean ± SD; n = 3 independent experiments for each glycan concentration.
| Variant | GM1os Kd (mM) | GM2os Kd (mM) |
|---|---|---|
| WHu-1 RBD (sample 1; HEK293-a) | 0.16 ± 0.04 | 0.17 ± 0.02 |
| WHu-1 RBD (sample 2; HEK293-a) | 0.18 ± 0.01 | 0.22 ± 0.03 |
| WHu-1 RBD (sample 3; HEK293-b) | 0.07 ± 0.01 | 0.09 ± 0.02 |
| endoF3-treated WHu-1 RBD (HEK293-b) | 3.6 ± 0.7 | 5.7 ± 0.6 |
| alpha (HEK293-b) | 0.15 ± 0.03 | 0.16 ± 0.03 |
| beta (HEK293-b) | 1.3 ± 0.4 | 1.10 ± 0.2 |
| delta (HEK293-b) | 0.11 ± 0.01 | 0.08 ± 0.02 |
| endoF3-treated delta (HEK293-b) | 0.12 ± 0.01 | 0.06 ± 0.01 |
| micron (HEK293-b) | 1.1 ± 0.2 | 0.70 ± 0.16 |
Appendix 1—table 3
Summary of molecular weights (MWs) of WHu-1 receptor binding domain (RBD) glycoforms (WTx) with respective relative abundances identified by ESI-MS and putative H_N_F_S combinations.
| RBD | MeasuredMW (Da) | Relative abundance | H_N_F_S combination | Theoretical MW (Da) | Mass difference (Da) |
|---|---|---|---|---|---|
| WT1 | 31342.4 | 25.5 | 9_11_2_0 | 31345.1 | 5.3 |
| WT2 | 31402.4 | 2.6 | 11_9_1_1 | 31408.0 | 2.4 |
| WT3 | 31505.2 | 42.7 | 9_9_0_3 | 31520.1 | 6.9 |
| WT4 | 31527.0 | 34.3 | 10_9_1_2 | 31537.1 | 2.1 |
| WT5 | 31609.4 | 19.0 | 11_10_3_0 | 31612.1 | 5.3 |
| WT6 | 31668.8 | 48.8 | 10_9_0_3 | 31682.1 | 5.4 |
| WT7 | 31690.2 | 56.2 | 11_9_1_2 | 31699.1 | 1.0 |
| WT8 | 31711.4 | 17.8 | 9_10_0_3 | 31723.2 | 3.7 |
| WT9 | 31771.1 | 43.9 | 12_10_3_0 | 31774.2 | 4.9 |
| WT10 | 31794.0 | 65.6 | 10_11_0_2 | 31797.2 | 4.8 |
| WT11 | 31816.5 | 26.5 | 10_9_1_3 | 31828.2 | 3.7 |
| WT12 | 31835.3 | 30.6 | 11_9_2_2 | 31845.2 | 1.9 |
| WT13 | 31854.4 | 44.6 | 9_10_1_3 | 31869.2 | 6.8 |
| WT14 | 31875.2 | 47.5 | 10_10_2_2 | 31886.2 | 3.1 |
| WT15 | 31896.4 | 35.8 | 11_10_1_2 | 31902.2 | 2.2 |
| WT16 | 31935.8 | 5.6 | 10_11_1_2 | 31943.3 | 0.6 |
| WT17 | 31957.8 | 85.0 | 11_11_0_2 | 31959.2 | 6.6 |
| WT18 | 31979.7 | 98.1 | 13_11_0_1 | 31992.3 | 4.6 |
| WT19 | 31001.2 | 61.3 | 9_10_2_3 | 32015.3 | 6.1 |
| WT20 | 32038.7 | 17.3 | 11_10_0_3 | 32047.3 | 0.6 |
| WT21 | 32060.1 | 55.7 | 12_10_1_2 | 32064.3 | 3.9 |
| WT22 | 32083.3 | 55.9 | 10_11_0_3 | 32088.3 | 3.0 |
| WT23 | 32105.5 | 1.1 | 12_11_0_2 | 32121.3 | 7.8 |
| WT24 | 32125.1 | 12.6 | 13_11_1_1 | 32138.3 | 5.2 |
| WT25 | 32144.3 | 72.6 | 10_12_1_2 | 32146.3 | 5.9 |
| WT26 | 32165.0 | 63.5 | 12_12_1_1 | 32179.3 | 6.4 |
| WT27 | 32185.7 | 39.8 | 11_10_1_3 | 32193.3 | 0.4 |
| WT28 | 32247.8 | 88.4 | 11_11_0_3 | 32250.3 | 5.5 |
| WT29 | 32270.3 | 100.0 | 13_11_0_2 | 32283.4 | 5.1 |
| WT30 | 32291.8 | 62.4 | 12_14_1_0 | 32294.4 | 5.4 |
| WT31 | 32348.8 | 58.7 | 12_10_1_3 | 32355.4 | 1.4 |
| WT32 | 32371.5 | 46.6 | 10_11_0_4 | 32379.4 | 0.1 |
| WT33 | 32434.4 | 69.7 | 10_12_1_3 | 32437.4 | 5.0 |
| WT34 | 32456.1 | 76.4 | 12_12_1_2 | 32470.4 | 6.3 |
| WT35 | 32477.0 | 43.6 | 11_10_1_4 | 32484.4 | 0.6 |
| WT36 | 32538.2 | 78.0 | 11_11_0_4 | 32541.4 | 4.8 |
| WT37 | 32560.9 | 79.6 | 13_11_0_3 | 32574.4 | 5.6 |
| WT38 | 32583.0 | 49.5 | 12_14_1_1 | 32585.5 | 5.5 |
| WT39 | 32615.2 | 19.1 | 11_10_0_5 | 32629.5 | 6.3 |
| WT40 | 32637.9 | 60.5 | 12_10_1_4 | 32646.5 | 0.6 |
| WT41 | 32659.6 | 39.0 | 10_11_0_5 | 32670.5 | 2.9 |
| WT42 | 32725.4 | 55.2 | 10_12_1_4 | 32728.5 | 4.9 |
| WT43 | 32747.7 | 58.2 | 12_12_1_3 | 32761.5 | 5.8 |
| WT44 | 32768.8 | 4.1 | 11_10_1_5 | 32775.5 | 1.3 |
| WT45 | 32826.8 | 1.7 | 11_11_0_5 | 32832.5 | 2.3 |
| WT46 | 32851.5 | 10.7 | 13_11_0_4 | 32865.5 | 6.1 |
| WT47 | 32873.7 | 4.3 | 12_14_1_2 | 32876.6 | 5.1 |
| WT48 | 32927.5 | 49.5 | 12_10_1_5 | 32937.6 | 2.1 |
| WT49 | 32949.8 | 15.6 | 10_11_0_6 | 32961.6 | 3.8 |
| WT50 | 33293.5 | 34.6 | 13_11_1_5 | 33302.7 | 1.2 |
| WT51 | 33583.8 | 9.4 | 13_11_1_6 | 33593.8 | 2.0 |
Appendix 1—table 4
Summary of molecular weights (MWs) of B.1.1.7 receptor binding domain (RBD) glycoforms (Alpha, Ax) with respective relative abundances identified by ESI-MS and putative H_N_F_S combinations.
| RBD | MeasuredMW (Da) | Relative abundance | H_N_F_S combination | Theoretical MW (Da) | Mass difference (Da) |
|---|---|---|---|---|---|
| A1 | 30894.6 | 6.4 | 9_10_0_0 | 30899.0 | 4.3 |
| A2 | 31080.7 | 17.1 | 9_8_2_1 | 31076.0 | 4.7 |
| A3 | 31137.8 | 5.3 | 9_9_3_0 | 31134.1 | 3.7 |
| A4 | 31160.2 | 3.2 | 9_7_2_2 | 31164.0 | 3.8 |
| A5 | 31184.9 | 3.7 | 9_10_0_1 | 31190.1 | 5.2 |
| A6 | 31243.1 | 13.0 | 10_8_2_1 | 31238.1 | 5.1 |
| A7 | 31265.9 | 10.9 | 10_11_0_0 | 31264.1 | 1.8 |
| A8 | 31300.5 | 4.5 | 10_9_3_0 | 31296.1 | 4.4 |
| A9 | 31319.6 | 3.4 | 8_10_2_1 | 31320.1 | 0.5 |
| A10 | 31346.6 | 2.6 | 10_10_0_1 | 31352.1 | 5.5 |
| A11 | 31369.5 | 19.4 | 11_10_1_0 | 31369.1 | 0.4 |
| A12 | 31405.1 | 26.4 | 8_9_2_2 | 31408.1 | 3.0 |
| A13 | 31427.3 | 13.6 | 11_11_0_0 | 31426.1 | 1.1 |
| A14 | 31449.4 | 4.9 | 7_10_4_1 | 31450.2 | 0.8 |
| A15 | 31482.0 | 4.6 | 9_10_2_1 | 31482.2 | 0.1 |
| A16 | 31505.7 | 3.4 | 7_11_3_1 | 31507.2 | 1.5 |
| A17 | 31529.1 | 30.9 | 12_10_1_0 | 31531.2 | 2.0 |
| A18 | 31553.5 | 35.3 | 10_11_0_1 | 31555.2 | 1.7 |
| A19 | 31590.8 | 27.8 | 12_11_0_0 | 31588.2 | 2.6 |
| A20 | 31611.6 | 16.5 | 8_10_2_2 | 31611.2 | 0.4 |
| A21 | 31658.9 | 9.8 | 11_10_3_0 | 31661.2 | 2.3 |
| A22 | 31693.9 | 8.8 | 13_10_1_0 | 31693.2 | 0.6 |
| A23 | 31715.2 | 96.9 | 11_11_0_1 | 31717.2 | 2.0 |
| A24 | 31737.6 | 13.7 | 12_11_1_0 | 31734.3 | 3.3 |
| A25 | 31773.3 | 19.8 | 9_10_2_2 | 31773.3 | 0.1 |
| A26 | 31793.9 | 13.4 | 12_12_0_0 | 31791.3 | 2.7 |
| A27 | 31819.9 | 31.4 | 12_10_1_1 | 31822.3 | 2.4 |
| A28 | 31844.4 | 20.4 | 10_11_0_2 | 31846.3 | 1.9 |
| A29 | 31880.1 | 13.3 | 12_11_0_1 | 31879.3 | 0.8 |
| A30 | 31901.1 | 78.6 | 8_10_4_2 | 31903.3 | 2.3 |
| A31 | 31920.8 | 4.8 | 11_12_0_1 | 31920.3 | 0.5 |
| A32 | 31937.3 | 2.7 | 12_12_1_0 | 31937.3 | 0.1 |
| A33 | 31957.6 | 10.8 | 13_12_0_0 | 31953.3 | 4.2 |
| A34 | 31978.1 | 10.0 | 9_11_2_2 | 31976.3 | 1.7 |
| A35 | 31006.1 | 100.0 | 11_11_0_2 | 31008.3 | 2.2 |
| A36 | 32027.7 | 5.2 | 12_11_3_0 | 32026.4 | 1.3 |
| A37 | 32061.8 | 4.9 | 9_10_2_3 | 32064.4 | 2.6 |
| A38 | 32081.4 | 53.5 | 12_12_0_1 | 32082.4 | 1.0 |
| A39 | 32109.6 | 10.5 | 12_10_1_2 | 32113.4 | 3.8 |
| A40 | 32137.5 | 13.8 | 10_11_2_2 | 32138.4 | 0.9 |
| A41 | 32191.8 | 82.8 | 13_11_3_0 | 32188.4 | 3.4 |
| A42 | 32212.7 | 3.2 | 11_12_0_2 | 32211.4 | 1.3 |
| A43 | 32227.5 | 2.6 | 12_12_1_1 | 32228.4 | 1.0 |
| A44 | 32266.5 | 39.1 | 9_11_2_3 | 32267.4 | 0.9 |
| A45 | 32297.9 | 48.2 | 11_11_0_3 | 32299.4 | 1.5 |
| A46 | 32372.0 | 53.5 | 12_12_0_2 | 32373.5 | 1.5 |
| A47 | 32393.9 | 5.0 | 11_10_4_2 | 32389.5 | 4.4 |
| A48 | 32446.4 | 31.2 | 11_11_1_3 | 32445.5 | 0.9 |
| A49 | 32483.1 | 35.2 | 13_11_3_1 | 32479.5 | 3.6 |
| A50 | 32504.3 | 4.7 | 11_12_2_2 | 32503.5 | 0.7 |
| A51 | 32557.2 | 43.9 | 14_12_3_0 | 32553.6 | 3.7 |
| A52 | 32590.0 | 10.0 | 11_11_2_3 | 32591.5 | 1.6 |
| A53 | 32631.8 | 25.2 | 10_12_2_3 | 32632.6 | 0.8 |
| A54 | 32663.5 | 34.6 | 12_12_0_3 | 32664.6 | 1.1 |
| A55 | 32707.1 | 4.5 | 11_13_2_2 | 32706.6 | 0.5 |
| A56 | 32737.2 | 44.7 | 11_11_1_4 | 32736.6 | 0.6 |
| A57 | 32774.4 | 6.2 | 13_11_3_2 | 32770.6 | 3.8 |
| A58 | 32811.6 | 21.6 | 12_12_1_3 | 32810.6 | 0.9 |
| A59 | 32848.2 | 24.6 | 14_12_3_1 | 32844.7 | 3.6 |
| A60 | 32869.8 | 4.8 | 12_13_2_2 | 32868.7 | 1.2 |
| A61 | 32887.8 | 3.5 | 13_13_1_2 | 32884.7 | 3.1 |
| A62 | 32922.7 | 34.7 | 10_12_2_4 | 32923.7 | 1.0 |
| A63 | 32954.7 | 11.5 | 12_12_0_4 | 32955.7 | 1.0 |
| A64 | 32998.0 | 16.2 | 11_13_2_3 | 32997.7 | 0.3 |
| A65 | 33028.4 | 28.5 | 11_11_1_5 | 33027.7 | 0.7 |
| A66 | 33050.4 | 3.3 | 12_11_4_3 | 33045.7 | 4.7 |
| A67 | 33072.5 | 4.0 | 12_14_2_2 | 33071.7 | 0.7 |
| A68 | 33102.6 | 30.2 | 12_12_1_4 | 33101.7 | 0.8 |
| A69 | 33138.5 | 8.1 | 14_12_3_2 | 33135.7 | 2.8 |
| A70 | 33176.8 | 16.5 | 13_13_1_3 | 33175.8 | 1.0 |
| A71 | 33213.2 | 22.7 | 15_13_3_1 | 33207.8 | 5.5 |
| A72 | 33250.3 | 3.8 | 12_12_2_4 | 33247.8 | 2.5 |
| A73 | 33288.0 | 23.1 | 16_14_3_0 | 33283.8 | 4.1 |
| A74 | 33320.0 | 12.6 | 11_11_3_5 | 33319.8 | 0.2 |
| A75 | 33362.3 | 13.4 | 12_14_2_3 | 33362.8 | 0.5 |
| A76 | 33393.8 | 21.4 | 12_12_1_5 | 33392.8 | 1.0 |
| A77 | 33467.9 | 24.3 | 13_13_1_4 | 33466.8 | 1.0 |
| A78 | 33504.4 | 8.7 | 15_13_3_2 | 33500.9 | 3.5 |
| A79 | 33542.5 | 11.6 | 14_14_1_3 | 33540.9 | 1.6 |
| A80 | 33578.2 | 15.7 | 16_14_3_1 | 33574.9 | 3.3 |
| A81 | 33613.2 | 4.6 | 13_13_0_5 | 33611.9 | 1.3 |
| A82 | 33653.0 | 18.2 | 12_14_2_4 | 33653.9 | 0.9 |
| A83 | 33685.1 | 8.2 | 14_14_2_3 | 33686.9 | 1.9 |
| A84 | 33727.9 | 11.9 | 11_13_3_5 | 33726.0 | 1.9 |
| A85 | 33759.2 | 17.4 | 13_13_1_5 | 33757.9 | 1.3 |
| A86 | 33833.4 | 16.8 | 14_14_1_4 | 33832.0 | 1.4 |
| A87 | 33868.9 | 7.3 | 16_14_1_3 | 33865.0 | 3.9 |
| A88 | 33907.0 | 11.8 | 13_13_0_6 | 33903.0 | 4.0 |
| A89 | 33944.0 | 12.4 | 13_13_0_6 | 33945.0 | 1.0 |
| A90 | 34018.6 | 14.8 | 12_14_2_5 | 34018.0 | 0.6 |
| A91 | 34051.1 | 10.3 | 13_13_3_5 | 34050.1 | 1.0 |
| A92 | 34125.0 | 11.1 | 14_14_1_5 | 34123.1 | 2.0 |
| A93 | 34198.1 | 9.5 | 13_13_0_7 | 34194.1 | 4.0 |
| A94 | 34309.0 | 7.9 | 13_15_0_6 | 34309.1 | 0.2 |
| A95 | 34599.3 | 3.5 | 13_15_2_6 | 34601.3 | 2.0 |
| A96 | 34823.3 | 2.2 | 16_13_1_7 | 34826.3 | 3.0 |
| A97 | 34886.3 | 8.7 | 16_14_2_6 | 34884.3 | 2.0 |
Appendix 1—table 5
Summary of molecular weights (MWs) of B.1.351 receptor binding domain (RBD) glycoforms (Beta, Bx) with respective relative abundances identified by ESI-MS and putative H_N_F_S combinations.
| RBD | MeasuredMW (Da) | Relative abundance | H_N_F_S combination | Theoretical MW (Da) | Mass difference (Da) |
|---|---|---|---|---|---|
| B1 | 31247.7 | 10.6 | 9_9_0_2 | 31255.0 | 7.3 |
| B2 | 31352.5 | 18.2 | 10_8_1_2 | 31360.0 | 7.6 |
| B3 | 31376.3 | 12.9 | 9_11_0_1 | 31370.0 | 6.2 |
| B4 | 31408.6 | 25.9 | 11_11_0_0 | 31403.1 | 5.5 |
| B5 | 31433.0 | 16.9 | 11_9_1_1 | 31434.0 | 1.0 |
| B6 | 31512.7 | 19.6 | 9_11_1_1 | 31516.1 | 3.4 |
| B7 | 31538.1 | 62.3 | 9_9_0_3 | 31546.1 | 8.0 |
| B8 | 31559.8 | 7.0 | 10_9_1_2 | 31563.1 | 3.2 |
| B9 | 31595.6 | 34.7 | 9_10_1_2 | 31604.1 | 8.6 |
| B10 | 31616.5 | 9.9 | 10_10_0_2 | 31620.1 | 3.6 |
| B11 | 31641.7 | 11.0 | 11_10_1_1 | 31637.1 | 4.6 |
| B12 | 31669.2 | 15.4 | 13_10_1_0 | 31670.1 | 0.9 |
| B13 | 31700.2 | 100.0 | 10_9_0_3 | 31708.1 | 7.9 |
| B14 | 31723.8 | 64.4 | 11_9_1_2 | 31725.1 | 1.3 |
| B15 | 31758.7 | 10.9 | 10_10_1_2 | 31766.2 | 7.5 |
| B16 | 31778.5 | 16.2 | 11_10_0_2 | 31782.2 | 3.7 |
| B17 | 31803.0 | 12.5 | 12_10_1_1 | 31799.2 | 3.8 |
| B18 | 31829.5 | 42.9 | 10_11_2_1 | 31824.2 | 5.3 |
| B19 | 31886.1 | 84.9 | 12_9_1_2 | 31887.2 | 1.1 |
| B20 | 31906.0 | 32.1 | 10_10_0_3 | 31911.2 | 5.2 |
| B21 | 31962.0 | 22.6 | 10_11_1_2 | 31969.3 | 7.2 |
| B22 | 31991.3 | 58.7 | 10_9_2_3 | 31000.2 | 8.9 |
| B23 | 32014.8 | 31.8 | 11_9_1_3 | 32016.2 | 1.5 |
| B24 | 32066.4 | 53.9 | 11_10_0_3 | 32073.3 | 6.9 |
| B25 | 32089.4 | 36.3 | 12_10_1_2 | 32090.3 | 0.9 |
| B26 | 32142.2 | 10.0 | 12_11_0_2 | 32147.3 | 5.1 |
| B27 | 32177.0 | 45.9 | 12_9_1_3 | 32178.3 | 1.3 |
| B28 | 32196.7 | 21.8 | 10_10_0_4 | 32202.3 | 5.6 |
| B29 | 32251.5 | 48.1 | 13_10_1_2 | 32252.3 | 0.9 |
| B30 | 32271.1 | 10.1 | 11_11_0_3 | 32276.3 | 5.3 |
| B31 | 32326.4 | 14.9 | 14_11_1_1 | 32326.4 | 0.1 |
| B32 | 32356.4 | 33.3 | 11_10_0_4 | 32364.4 | 8.0 |
| B33 | 32379.5 | 27.6 | 12_10_1_3 | 32381.4 | 1.9 |
| B34 | 32431.3 | 48.8 | 12_11_0_3 | 32438.4 | 7.1 |
| B35 | 32454.7 | 29.5 | 11_9_2_4 | 32453.4 | 1.3 |
| B36 | 32541.6 | 24.4 | 13_10_1_3 | 32543.4 | 1.8 |
| B37 | 32560.9 | 20.8 | 11_11_0_4 | 32567.4 | 6.6 |
| B38 | 32617.1 | 43.1 | 14_11_1_2 | 32617.5 | 0.4 |
| B39 | 32637.1 | 9.6 | 12_12_0_3 | 32641.5 | 4.4 |
| B40 | 32722.1 | 35.2 | 12_11_0_4 | 32729.5 | 7.4 |
| B41 | 32744.8 | 17.2 | 13_11_1_3 | 32746.5 | 1.7 |
| B42 | 32796.8 | 34.1 | 11_10_1_5 | 32801.5 | 4.7 |
| B43 | 32820.3 | 13.6 | 12_10_2_4 | 32818.5 | 1.8 |
| B44 | 32927.0 | 9.0 | 12_12_0_4 | 32932.6 | 5.6 |
| B45 | 32983.0 | 30.0 | 13_10_2_4 | 32980.6 | 2.4 |
| B46 | 33109.9 | 10.9 | 12_10_2_5 | 33109.6 | 0.3 |
| B47 | 33162.3 | 26.9 | 12_11_1_5 | 33166.6 | 4.4 |
| B48 | 33273.5 | 21.2 | 13_10_2_5 | 33271.7 | 1.8 |
| B49 | 33348.1 | 27.5 | 14_11_2_4 | 33345.7 | 2.4 |
| B50 | 33452.7 | 24.3 | 12_11_1_6 | 33457.7 | 5.1 |
| B51 | 33528.0 | 25.5 | 13_12_1_5 | 33531.8 | 3.8 |
| B52 | 33637.9 | 17.3 | 14_11_2_5 | 33636.8 | 1.1 |
| B53 | 33713.1 | 20.7 | 13_10_3_6 | 33708.8 | 4.3 |
| B54 | 33817.9 | 21.0 | 13_12_1_6 | 33822.9 | 5.0 |
| B55 | 33893.0 | 17.0 | 14_13_1_5 | 33896.9 | 3.9 |
| B56 | 34003.3 | 13.8 | 13_10_3_7 | 33999.9 | 3.4 |
| B57 | 34183.0 | 10.0 | 14_13_1_6 | 34188.0 | 5.0 |
| B58 | 34548.7 | 7.7 | 15_14_1_6 | 34553.1 | 4.5 |
| B59 | 34693.1 | 13.5 | 15_14_2_6 | 34699.2 | 6.1 |
Appendix 1—table 6
Summary of molecular weights (MWs) of B.1.351.2 receptor binding domain (RBD) glycoforms (Delta, Dx) with respective relative abundances identified by ESI-MS and putative H_N_F_S combinations.
| RBD | MeasuredMW (Da) | Relative abundance | H_N_F_S combination | Theoretical MW (Da) | Mass difference (Da) |
|---|---|---|---|---|---|
| D1 | 31073.5 | 20.9 | 8_11_1_0 | 31079.0 | 5.5 |
| D2 | 31094.3 | 1.0 | 9_11_0_0 | 31095.0 | 0.7 |
| D3 | 31259.9 | 24.3 | 10_11_0_0 | 31257.1 | 2.8 |
| D4 | 31363.7 | 28.6 | 8_11_1_1 | 31370.1 | 6.4 |
| D5 | 31423.0 | 23.4 | 11_11_0_0 | 31419.1 | 3.9 |
| D6 | 31526.2 | 26.6 | 9_11_1_1 | 31532.2 | 5.9 |
| D7 | 31548.3 | 25.4 | 10_11_0_1 | 31548.2 | 0.2 |
| D8 | 31654.2 | 29.4 | 8_11_1_2 | 31661.2 | 7.0 |
| D9 | 31690.5 | 23.9 | 10_11_1_1 | 31694.2 | 3.7 |
| D10 | 31711.4 | 39.3 | 11_11_0_1 | 31710.2 | 1.2 |
| D11 | 31733.5 | 16.1 | 9_12_1_1 | 31735.2 | 1.7 |
| D12 | 31813.8 | 33.6 | 10_13_1_0 | 31809.3 | 4.5 |
| D13 | 31838.0 | 31.0 | 10_11_0_2 | 31839.3 | 1.3 |
| D14 | 31875.9 | 13.2 | 12_11_2_0 | 31873.3 | 2.6 |
| D15 | 31895.2 | 25.7 | 10_12_1_1 | 31897.3 | 2.1 |
| D16 | 31979.4 | 30.5 | 10_11_1_2 | 31985.3 | 5.9 |
| D17 | 31000.6 | 60.7 | 11_11_0_2 | 31001.3 | 0.8 |
| D18 | 32022.0 | 26.0 | 9_12_1_2 | 32026.3 | 4.3 |
| D19 | 32079.6 | 25.4 | 12_12_0_1 | 32075.3 | 4.2 |
| D20 | 32104.2 | 49.0 | 10_13_1_1 | 32100.4 | 3.8 |
| D21 | 32127.5 | 29.3 | 10_11_0_3 | 32130.3 | 2.8 |
| D22 | 32164.9 | 4.6 | 12_11_0_2 | 32163.4 | 1.6 |
| D23 | 32185.4 | 44.8 | 10_12_1_2 | 32188.4 | 3.0 |
| D24 | 32206.8 | 5.0 | 11_12_0_2 | 32204.4 | 2.4 |
| D25 | 32290.9 | 90.6 | 11_11_0_3 | 32292.4 | 1.5 |
| D26 | 32312.4 | 32.4 | 9_12_1_3 | 32317.4 | 5.1 |
| D27 | 32348.4 | 26.0 | 11_12_1_2 | 32350.4 | 2.1 |
| D28 | 32369.1 | 34.1 | 12_12_0_2 | 32366.4 | 2.7 |
| D29 | 32394.4 | 45.5 | 10_13_1_2 | 32391.5 | 3.0 |
| D30 | 32475.9 | 50.0 | 10_12_1_3 | 32479.5 | 3.5 |
| D31 | 32496.5 | 22.2 | 11_12_0_3 | 32495.5 | 1.0 |
| D32 | 32553.6 | 0.7 | 11_13_1_2 | 32553.5 | 0.1 |
| D33 | 32581.7 | 100.0 | 11_11_0_4 | 32583.5 | 1.8 |
| D34 | 32603.7 | 34.7 | 12_11_3_2 | 32601.5 | 2.2 |
| D35 | 32638.2 | 0.3 | 11_12_1_3 | 32641.5 | 3.3 |
| D36 | 32658.4 | 41.3 | 12_12_0_3 | 32657.5 | 0.8 |
| D37 | 32683.3 | 21.8 | 10_13_1_3 | 32682.6 | 0.7 |
| D38 | 32766.4 | 41.9 | 10_12_1_4 | 32770.6 | 4.2 |
| D39 | 32843.0 | 8.0 | 11_13_1_3 | 32844.6 | 1.7 |
| D40 | 32873.4 | 68.5 | 11_11_0_5 | 32874.6 | 1.2 |
| D41 | 32895.2 | 18.5 | 12_11_3_3 | 32892.6 | 2.6 |
| D42 | 32948.2 | 45.1 | 12_12_0_4 | 32948.6 | 0.4 |
| D43 | 33238.9 | 42.5 | 12_12_0_5 | 33239.7 | 0.8 |
| D44 | 33313.9 | 30.2 | 13_13_0_4 | 33313.8 | 0.1 |
| D45 | 33604.6 | 37.1 | 13_13_0_5 | 33604.9 | 0.2 |
| D46 | 33896.1 | 29.5 | 13_13_0_6 | 33896.0 | 0.2 |
| D47 | 33969.9 | 9.2 | 12_12_3_6 | 33969.0 | 0.9 |
| D48 | 34186.4 | 21.6 | 13_13_0_7 | 34187.0 | 0.7 |
| D49 | 34260.3 | 9.0 | 14_14_0_6 | 34261.1 | 0.7 |
Appendix 1—table 7
Summary of molecular weights (MWs) of B.1.1.529 receptor binding domain (RBD) glycoforms (Omicron, Ox) with respective relative abundances identified by ESI-MS and putative H_N_F_S combinations.
| RBD | MeasuredMW (Da) | Relative abundance | H_N_F_S combination | Theoretical MW (Da) | Mass difference (Da) |
|---|---|---|---|---|---|
| O1 | 32489.2 | 40.2 | 10_11_1_3 | 32487.6 | 1.5 |
| O2 | 32538.4 | 45.7 | 11_9_3_3 | 32535.7 | 2.7 |
| O3 | 32559.4 | 5.6 | 11_12_1_2 | 32561.7 | 2.3 |
| O4 | 32576.0 | 23.0 | 10_10_1_4 | 32575.7 | 0.3 |
| O5 | 32595.1 | 74.6 | 11_10_2_3 | 32592.7 | 2.4 |
| O6 | 32615.4 | 31.4 | 12_10_1_3 | 32608.7 | 6.7 |
| O7 | 32651.1 | 29.0 | 11_11_1_3 | 32649.7 | 1.4 |
| O8 | 32670.2 | 24.9 | 12_11_2_2 | 32666.7 | 3.4 |
| O9 | 32702.3 | 42.5 | 11_12_0_3 | 32706.7 | 4.4 |
| O10 | 32723.8 | 87.1 | 10_10_2_4 | 32721.7 | 2.1 |
| O11 | 32744.0 | 2.5 | 11_10_3_3 | 32738.7 | 5.3 |
| O12 | 32761.0 | 11.3 | 12_10_2_3 | 32754.7 | 6.3 |
| O13 | 32779.8 | 53.6 | 10_11_1_4 | 32778.7 | 1.1 |
| O14 | 32798.7 | 23.0 | 11_11_2_3 | 32795.8 | 2.9 |
| O15 | 32829.1 | 62.1 | 11_9_3_4 | 32826.8 | 2.3 |
| O16 | 32852.5 | 27.6 | 11_12_1_3 | 32852.8 | 0.3 |
| O17 | 32885.7 | 85.7 | 11_10_2_4 | 32883.8 | 2.0 |
| O18 | 32905.7 | 29.7 | 12_10_3_3 | 32900.8 | 4.9 |
| O19 | 32942.2 | 12.1 | 11_11_1_4 | 32940.8 | 1.4 |
| O20 | 32960.8 | 40.8 | 12_11_2_3 | 32957.8 | 3.0 |
| O21 | 33014.9 | 100.0 | 12_12_1_3 | 33014.8 | 0.1 |
| O22 | 33035.6 | 25.5 | 11_10_3_4 | 33029.8 | 5.8 |
| O23 | 33070.2 | 52.1 | 12_13_0_3 | 33071.9 | 1.6 |
| O24 | 33089.8 | 52.7 | 11_11_2_4 | 33086.9 | 2.9 |
| O25 | 33120.4 | 52.4 | 13_11_2_3 | 33119.9 | 0.6 |
| O26 | 33144.7 | 28.3 | 11_12_1_4 | 33143.9 | 0.8 |
| O27 | 33177.5 | 50.7 | 11_10_2_5 | 33174.9 | 2.6 |
| O28 | 33195.9 | 33.2 | 12_10_3_4 | 33191.9 | 4.0 |
| O29 | 33217.4 | 13.2 | 12_13_1_3 | 33217.9 | 0.5 |
| O30 | 33233.9 | 1.6 | 11_11_1_5 | 33231.9 | 2.0 |
| O31 | 33251.6 | 58.4 | 12_11_2_4 | 33248.9 | 2.7 |
| O32 | 33271.2 | 15.4 | 13_11_3_3 | 33265.9 | 5.2 |
| O33 | 33306.1 | 83.2 | 12_12_1_4 | 33305.9 | 0.2 |
| O34 | 33326.7 | 28.9 | 13_12_2_3 | 33322.9 | 3.7 |
| O35 | 33361.5 | 30.3 | 12_13_0_4 | 33362.9 | 1.4 |
| O36 | 33380.8 | 61.4 | 13_13_1_3 | 33380.0 | 0.9 |
| O37 | 33402.5 | 0.3 | 14_13_0_3 | 33396.0 | 6.5 |
| O38 | 33435.9 | 27.5 | 11_12_1_5 | 33435.0 | 0.9 |
| O39 | 33454.8 | 15.1 | 12_12_2_4 | 33452.0 | 2.8 |
| O40 | 33486.2 | 24.5 | 14_12_0_4 | 33484.0 | 2.2 |
| O41 | 33508.3 | 18.3 | 12_13_1_4 | 33509.0 | 0.7 |
| O42 | 33542.1 | 37.0 | 12_11_2_5 | 33540.0 | 2.1 |
| O43 | 33561.5 | 24.8 | 15_13_0_3 | 33558.0 | 3.5 |
| O44 | 33597.5 | 25.2 | 12_12_1_5 | 33597.0 | 0.5 |
| O45 | 33617.3 | 33.1 | 13_12_2_4 | 33614.0 | 3.2 |
| O46 | 33671.8 | 47.2 | 13_13_1_4 | 33671.1 | 0.7 |
| O47 | 33691.7 | 16.4 | 14_13_0_4 | 33687.1 | 4.6 |
| O48 | 33726.3 | 13.7 | 13_14_0_4 | 33728.1 | 1.7 |
| O49 | 33745.7 | 35.3 | 12_12_2_5 | 33743.1 | 2.6 |
| O50 | 33776.2 | 16.1 | 14_12_2_4 | 33776.1 | 0.1 |
| O51 | 33800.4 | 17.0 | 12_13_1_5 | 33800.1 | 0.3 |
| O52 | 33833.8 | 3.0 | 14_13_1_4 | 33833.1 | 0.7 |
| O53 | 33851.7 | 28.4 | 15_13_0_4 | 33849.1 | 2.6 |
| O54 | 33874.5 | 10.3 | 13_14_1_4 | 33874.1 | 0.4 |
| O55 | 33907.8 | 21.7 | 13_12_2_5 | 33905.1 | 2.7 |
| O56 | 33927.2 | 14.4 | 14_12_3_4 | 33922.1 | 5.0 |
| O57 | 33963.1 | 27.1 | 13_13_1_5 | 33962.2 | 0.9 |
| O58 | 33982.3 | 13.7 | 14_13_0_5 | 33978.1 | 4.2 |
| O59 | 34037.0 | 32.6 | 14_14_1_4 | 34036.2 | 0.8 |
| O60 | 34058.2 | 3.7 | 13_12_3_5 | 34051.2 | 7.0 |
| O61 | 34090.9 | 8.8 | 12_13_1_6 | 34091.2 | 0.3 |
| O62 | 34110.9 | 11.6 | 13_13_2_5 | 34108.2 | 2.7 |
| O63 | 34142.7 | 22.5 | 15_13_0_5 | 34140.2 | 2.5 |
| O64 | 34165.6 | 5.1 | 13_14_1_5 | 34165.2 | 0.4 |
| O65 | 34199.3 | 6.6 | 15_14_1_4 | 34198.2 | 1.1 |
| O66 | 34217.1 | 20.9 | 14_12_1_6 | 34212.2 | 4.8 |
| O67 | 34274.9 | 20.8 | 14_13_2_5 | 34270.3 | 4.6 |
| O68 | 34327.5 | 26.7 | 14_14_1_5 | 34327.3 | 0.2 |
| O69 | 34346.6 | 15.5 | 13_12_3_6 | 34342.3 | 4.3 |
| O70 | 34384.5 | 0.9 | 13_10_4_7 | 34373.3 | 11.2 |
| O71 | 34402.4 | 23.3 | 13_13_2_6 | 34399.3 | 3.1 |
| O72 | 34457.1 | 9.0 | 13_14_1_6 | 34456.3 | 0.8 |
| O73 | 34506.7 | 18.8 | 14_12_1_7 | 34503.3 | 3.4 |
| O74 | 34529.7 | 3.1 | 12_13_4_6 | 34529.4 | 0.3 |
| O75 | 34564.3 | 25.0 | 14_13_0_7 | 34560.3 | 4.0 |
| O76 | 34620.0 | 26.6 | 14_14_1_6 | 34618.4 | 1.6 |
| O77 | 34638.4 | 23.0 | 15_14_2_5 | 34635.4 | 3.0 |
| O78 | 34658.8 | 12.7 | 16_14_3_4 | 34652.4 | 6.4 |
| O79 | 34768.4 | 0.9 | 14_14_2_6 | 34764.4 | 4.0 |
| O80 | 34798.6 | 29.8 | 14_12_1_8 | 34794.4 | 4.2 |
| O81 | 34840.4 | 0.5 | 13_13_3_7 | 34836.5 | 4.0 |
| O82 | 34858.9 | 20.4 | 14_13_0_8 | 34851.4 | 7.5 |
| O83 | 35019.8 | 14.5 | 15_13_0_8 | 35013.5 | 6.3 |
| O84 | 35041.2 | 10.5 | 13_14_3_7 | 35039.5 | 1.7 |
| O85 | 35220.7 | 23.8 | 15_14_0_8 | 35216.6 | 4.1 |
| O86 | 35312.3 | 2.6 | 15_13_2_8 | 35305.6 | 6.7 |
| O87 | 35354.0 | 19.8 | 15_14_1_8 | 35362.6 | 8.6 |
Appendix 1—table 8
Summary of molecular weights (MWs) of endoF3-treated WHu-Hu-1 receptor binding domain (RBD) glycoforms (eWTx) with respective relative abundances identified by ESI-MS and putative H_N_F_S combinations.
| RBD | MeasuredMW (Da) | Relative abundance | H_N_F_S combination | Theoretical MW (Da) | Mass difference (Da) | Number of trimmed N-glycans |
|---|---|---|---|---|---|---|
| eWT1 | 28116.9 | 4.5 | 1_3_0_0 | 28123.9 | 7.0 | 2 |
| eWT2 | 28243.9 | 26.4 | 3_2_0_0 | 28244.9 | 1.0 | 2 |
| eWT3 | 28357.3 | 14.5 | 1_2_1_1 | 28358.0 | 0.6 | 2 |
| eWT4 | 28618.0 | 23.8 | 1_4_2_0 | 28619.1 | 1.0 | 2 |
| eWT5 | 28881.1 | 2.4 | 3_3_1_1 | 28885.1 | 4.0 | 2 |
| eWT6 | 29029.2 | 18.7 | 3_3_2_1 | 29031.2 | 2.1 | 2 |
| eWT7 | 29143.8 | 1.1 | 6_4_0_0 | 29137.2 | 6.5 | 1 |
| eWT8 | 29318.2 | 1.1 | 5_5_1_0 | 29324.3 | 6.1 | 1 |
| eWT9 | 29406.5 | 8.2 | 5_4_1_1 | 29412.3 | 5.8 | 1 |
| eWT10 | 29454.5 | 14.1 | 4_5_1_1 | 29453.4 | 1.2 | 1 |
| eWT11 | 29649.4 | 0.6 | 7_5_1_0 | 29648.4 | 1.0 | 1 |
| eWT12 | 29736.3 | 9.6 | 5_7_1_0 | 29730.5 | 5.8 | 1 |
| eWT13 | 29753.5 | 1.3 | 5_5_0_2 | 29760.5 | 6.9 | 1 |
| eWT14 | 30084.9 | 1.3 | 7_5_2_1 | 30085.6 | 0.7 | 1 |
| eWT15 | 30103.4 | 10.3 | 5_6_1_2 | 30109.6 | 6.2 | 1 |
| eWT16 | 31033.0 | 27.6 | 8_6_2_3 | 31032.9 | 0.1 | 1 |
| eWT17 | 31216.4 | 17.2 | 7_7_1_4 | 31219.0 | 2.5 | 1 |
| eWT18 | 31416.8 | 8.0 | 7_8_1_4 | 31422.0 | 5.2 | 1 |
| eWT19 | 31437.4 | 0.9 | 8_8_0_4 | 31438.0 | 0.7 | 1 |
| eWT20 | 31482.3 | 9.0 | 7_9_2_3 | 31480.1 | 2.2 | 1 |
| eWT21 | 31505.7 | 38.4 | 9_9_0_3 | 31512.1 | 6.4 | 0 |
| eWT22 | 31543.3 | 41.0 | 9_7_1_4 | 31543.1 | 0.2 | 1 |
| eWT23 | 31564.8 | 55.2 | 7_8_2_4 | 31568.1 | 3.3 | 1 |
| eWT24 | 31607.4 | 2.2 | 11_10_3_0 | 31604.1 | 3.2 | 0 |
| eWT25 | 31644.1 | 27.3 | 8_9_2_3 | 31642.1 | 2.0 | 1 |
| eWT26 | 31668.2 | 82.8 | 10_9_0_3 | 31674.1 | 5.9 | 0 |
| eWT27 | 31691.0 | 33.8 | 11_9_1_2 | 31691.1 | 0.2 | 0 |
| eWT28 | 31708.4 | 9.9 | 9_10_0_3 | 31715.2 | 6.7 | 0 |
| eWT29 | 31727.6 | 58.6 | 10_10_1_2 | 31732.2 | 4.5 | 0 |
| eWT30 | 31748.3 | 42.7 | 11_10_0_2 | 31748.2 | 0.1 | 0 |
| eWT31 | 31770.9 | 29.2 | 12_10_3_0 | 31766.2 | 4.7 | 0 |
| eWT32 | 31795.9 | 25.7 | 10_11_0_2 | 31789.2 | 6.7 | 0 |
| eWT33 | 31833.6 | 35.0 | 11_9_2_2 | 31837.2 | 3.6 | 0 |
| eWT34 | 31854.4 | 95.9 | 9_10_1_3 | 31861.2 | 6.8 | 0 |
| eWT35 | 31872.6 | 14.1 | 10_10_2_2 | 31878.2 | 5.6 | 0 |
| eWT36 | 31893.5 | 1.5 | 11_10_1_2 | 31894.2 | 0.7 | 0 |
| eWT37 | 31912.9 | 51.6 | 12_10_0_2 | 31910.2 | 2.6 | 0 |
| eWT38 | 31933.2 | 26.1 | 10_11_1_2 | 31935.3 | 2.0 | 0 |
| eWT39 | 31958.1 | 100.0 | 11_11_0_2 | 31951.2 | 6.9 | 0 |
| eWT40 | 31980.4 | 28.5 | 13_11_0_1 | 31984.3 | 3.9 | 0 |
| eWT41 | 32017.7 | 36.8 | 10_10_1_3 | 32023.3 | 5.5 | 0 |
| eWT42 | 32060.9 | 6.2 | 12_10_1_2 | 32056.3 | 4.6 | 0 |
Appendix 1—table 9
Summary of molecular weights (MWs) of endoF3-treated B.1.351.2 receptor binding domain (RBD) glycoforms (eDx) with respective relative abundances identified by ESI-MS and putative H_N_F_S combinations.
| RBD | MeasuredMW (Da) | Relative abundance | H_N_F_S combination | Theoretical MW (Da) | Mass difference (Da) | Number of trimmed N-glycans |
|---|---|---|---|---|---|---|
| eD1 | 28681.8 | 2.2 | 4_3_0_0 | 28680.1 | 1.7 | 2 |
| eD2 | 28720.3 | 24.9 | 3_4_0_0 | 28721.1 | 0.8 | 2 |
| eD3 | 28741.8 | 35.3 | 2_2_2_1 | 28736.1 | 5.6 | 2 |
| eD4 | 28762.6 | 9.4 | 2_5_0_0 | 28762.2 | 0.5 | 2 |
| eD5 | 28782.3 | 33.5 | 1_3_2_1 | 28777.2 | 5.2 | 2 |
| eD6 | 28803.6 | 25.9 | 3_3_2_0 | 28810.2 | 6.5 | 2 |
| eD7 | 28826.2 | 19.8 | 4_3_1_0 | 28826.2 | 0.1 | 2 |
| eD8 | 28867.3 | 82.4 | 3_4_1_0 | 28867.2 | 0.1 | 2 |
| eD9 | 28888.2 | 52.6 | 4_4_0_0 | 28883.2 | 5.0 | 2 |
| eD10 | 28907.6 | 20.6 | 3_2_2_1 | 28898.2 | 9.4 | 2 |
| eD11 | 28927.8 | 100.0 | 3_5_0_0 | 28924.2 | 3.6 | 2 |
| eD12 | 28949.2 | 57.5 | 3_3_1_1 | 28955.2 | 6.0 | 2 |
| eD13 | 28970.6 | 38.3 | 4_3_0_1 | 28971.2 | 0.6 | 2 |
| eD14 | 28990.7 | 30.3 | 2_4_1_1 | 28996.2 | 5.5 | 2 |
| eD15 | 29011.6 | 32.3 | 3_4_0_1 | 29012.2 | 0.6 | 2 |
| eD16 | 29032.7 | 24.1 | 4_4_1_0 | 29029.2 | 3.5 | 2 |
| eD17 | 29053.6 | 52.1 | 3_2_1_2 | 29043.2 | 10.4 | 2 |
| eD18 | 29074.7 | 51.9 | 3_5_1_0 | 29070.3 | 4.4 | 2 |
| eD19 | 29095.1 | 15.7 | 3_3_2_1 | 29101.3 | 6.2 | 2 |
| eD20 | 29114.2 | 37.7 | 4_3_1_1 | 29117.3 | 3.1 | 2 |
| eD21 | 29135.1 | 26.0 | 2_4_0_2 | 29141.3 | 6.2 | 2 |
| eD22 | 29158.3 | 34.9 | 3_4_1_1 | 29158.3 | 0.0 | 2 |
| eD23 | 29179.7 | 25.3 | 4_4_2_0 | 29175.3 | 4.4 | 2 |
| eD24 | 29198.8 | 17.6 | 3_2_2_2 | 29189.3 | 9.6 | 2 |
| eD25 | 29219.2 | 43.7 | 3_5_0_1 | 29215.3 | 3.9 | 2 |
| eD26 | 29240.2 | 24.3 | 3_3_1_2 | 29246.3 | 6.1 | 2 |
| eD27 | 29261.4 | 16.4 | 4_3_2_1 | 29263.3 | 1.9 | 2 |
| eD28 | 29281.5 | 6.4 | 2_4_1_2 | 29287.3 | 5.9 | 2 |
| eD29 | 29301.3 | 1.9 | 3_4_2_1 | 29304.3 | 3.0 | 2 |
| eD30 | 29302.0 | 1.2 | 3_4_0_2 | 29303.3 | 1.3 | 2 |
| eD31 | 29344.9 | 24.8 | 5_4_2_0 | 29337.4 | 7.6 | 2 |
| eD32 | 29366.8 | 5.0 | 3_5_1_1 | 29361.4 | 5.5 | 2 |
| eD33 | 29405.7 | 10.1 | 4_3_1_2 | 29408.4 | 2.7 | 2 |
| eD34 | 29427.1 | 3.8 | 2_4_2_2 | 29433.4 | 6.3 | 2 |
Appendix 1—table 10
Glycopeptide analysis of wild-type (WT) receptor binding domain (RBD).
| N-site | Peptide sequence | N-glycan | Retention time (min) | Measured m/z | Charge state | Mass accuracy (ppm) | MS area |
|---|---|---|---|---|---|---|---|
| N331 | PNITNLCPFGEV | A2S2 | 18.0 | 1170.471 | 3 | –3.66 | 88472 |
| N331 | PNITNLCPFGEV | A2S2 | 18.0 | 1755.705 | 2 | –2.48 | 70771 |
| N331 | PNITNLCPFGEV | A1G1F | 18.2 | 1354.577 | 2 | 0.45 | 157724 |
| N331 | PNITNLCPFGEV | A1G0F | 18.3 | 1273.551 | 2 | 0.14 | 85745 |
| N331 | PNITNLCPFGEV | A1S1F | 18.6 | 1500.124 | 2 | 0.04 | 65793 |
| N331 | FPNIT | A2G2B | 27.8 | 1209.489 | 2 | –2.73 | 57370 |
| N343 | GEVFNATR | A2S1G1FB | 31.0 | 1579.132 | 2 | –3.43 | 44341 |
| N343 | NATRF | A2G2F | 6.3 | 1189.484 | 2 | 0.33 | 107145 |
| N343 | NATRF | A2G1F | 6.5 | 1107.955 | 2 | 0.30 | 46566 |
| N343 | NATRF | A2S1G1F | 7.0 | 1335.032 | 2 | 0.75 | 38217 |
| N343 | PFGEVFNATR | A2G2 | 13.5 | 1381.076 | 2 | –3.29 | 272764 |
| N343 | PFGEVFNATR | A2G1 | 13.6 | 1300.049 | 2 | –3.69 | 150239 |
| N343 | PFGEVFNATR | A2S1G1 | 13.7 | 1526.623 | 2 | –2.90 | 305875 |
| N343 | PFGEVFNATR | A2S1G0 | 13.8 | 1445.597 | 2 | –3.53 | 164686 |
Appendix 1—table 11
Glycopeptide analysis of endoF3-treated wild-type (WT) receptor binding domain (RBD).
| N-site | Peptide sequence | N-glycan | Retention time (min) | Measured m/z | Charge state | Mass accuracy (ppm) | MS area |
|---|---|---|---|---|---|---|---|
| N331 | PNITNLCPFGEVF | A1G0F | 18.9 | 1347.585 | 2 | –3.88 | 21591 |
| N331 | PNITNLCPFGE | A2G0FB | 19.5 | 1427.087 | 2 | –5.81 | 83634 |
| N331 | PNITNLCPFGEV | A1G1F | 19.6 | 1354.575 | 2 | –1.09 | 112872 |
| N331 | PNITNLCPFGEV | A1G0F | 19.7 | 1273.551 | 2 | –1.21 | 52498 |
| N331 | PNITNLCPFGEV | A1S1F | 19.9 | 1500.122 | 2 | –1.51 | 59378 |
| N331 | PNITNLCPF | A2G1 | 26.2 | 827.350 | 3 | 1.33 | 49111 |
| N331 | PNITNLCPF | A2G1 | 26.9 | 1240.524 | 2 | 2.81 | 25854 |
| N331 | PNITNL | A1G1 | 28.6 | 964.915 | 2 | 0.19 | 19156 |
| N343 | NATRF | A2G2F | 6.3 | 1189.483 | 2 | 0.54 | 32460 |
| N343 | NATRF | A2G1F | 6.4 | 1107.955 | 2 | 0.19 | 47037 |
| N343 | NATRF | A2G0F | 6.5 | 1027.430 | 2 | 0.50 | 23831 |
| N343 | NATRF | A2S1G1F | 7.5 | 1335.032 | 2 | 0.75 | 34621 |
| N343 | NATRF | A2S2F | 7.8 | 1480.580 | 2 | 1.09 | 24974 |
| N343 | NATRF | GnF | 8.2 | 957.453 | 1 | 0.28 | 17273 |
| N343 | NATRF | GnF | 8.2 | 479.230 | 2 | 0.53 | 255747 |
| N343 | NATR | A2G0 | 18.0 | 880.363 | 2 | –2.3 | 34690 |
| N343 | NATRFASVY | A2S1G1 | 9.4 | 736.560 | 4 | 4.72 | 103643 |
| N343 | GEVFNATR | GnF | 11.3 | 621.797 | 2 | 0.83 | 14586 |
| N343 | GEVFNATR | GnF | 15.5 | 414.868 | 3 | 3.39 | 15706 |
| N343 | GEVFNATR | GnF | 15.7 | 414.868 | 3 | 3.78 | 18198 |
| N343 | GEVFNATRF | GnF | 17.6 | 695.331 | 2 | 1.23 | 17392 |
| N343 | GEVFNATRF | A2G0F | 23.2 | 1243.537 | 2 | 4.76 | 17779 |
Additional files
Download links
A two-part list of links to download the article, or parts of the article, in various formats.
Downloads (link to download the article as PDF)
Open citations (links to open the citations from this article in various online reference manager services)
Cite this article (links to download the citations from this article in formats compatible with various reference manager tools)
Role of N343 glycosylation on the SARS-CoV-2 S RBD structure and co-receptor binding across variants of concern
eLife 13:RP95708.
https://doi.org/10.7554/eLife.95708.3


