Focal adhesion-derived liquid-liquid phase separations regulate mRNA translation
- Yale Cardiovascular Research Center, Department of Internal Medicine (Division of Cardiovascular Medicine), United States
- Department of Cell Biology, Yale School of Medicine, United States
- Department of Biomedical Engineering, Yale University, United States
Figures
Figure 1 with 1 supplement
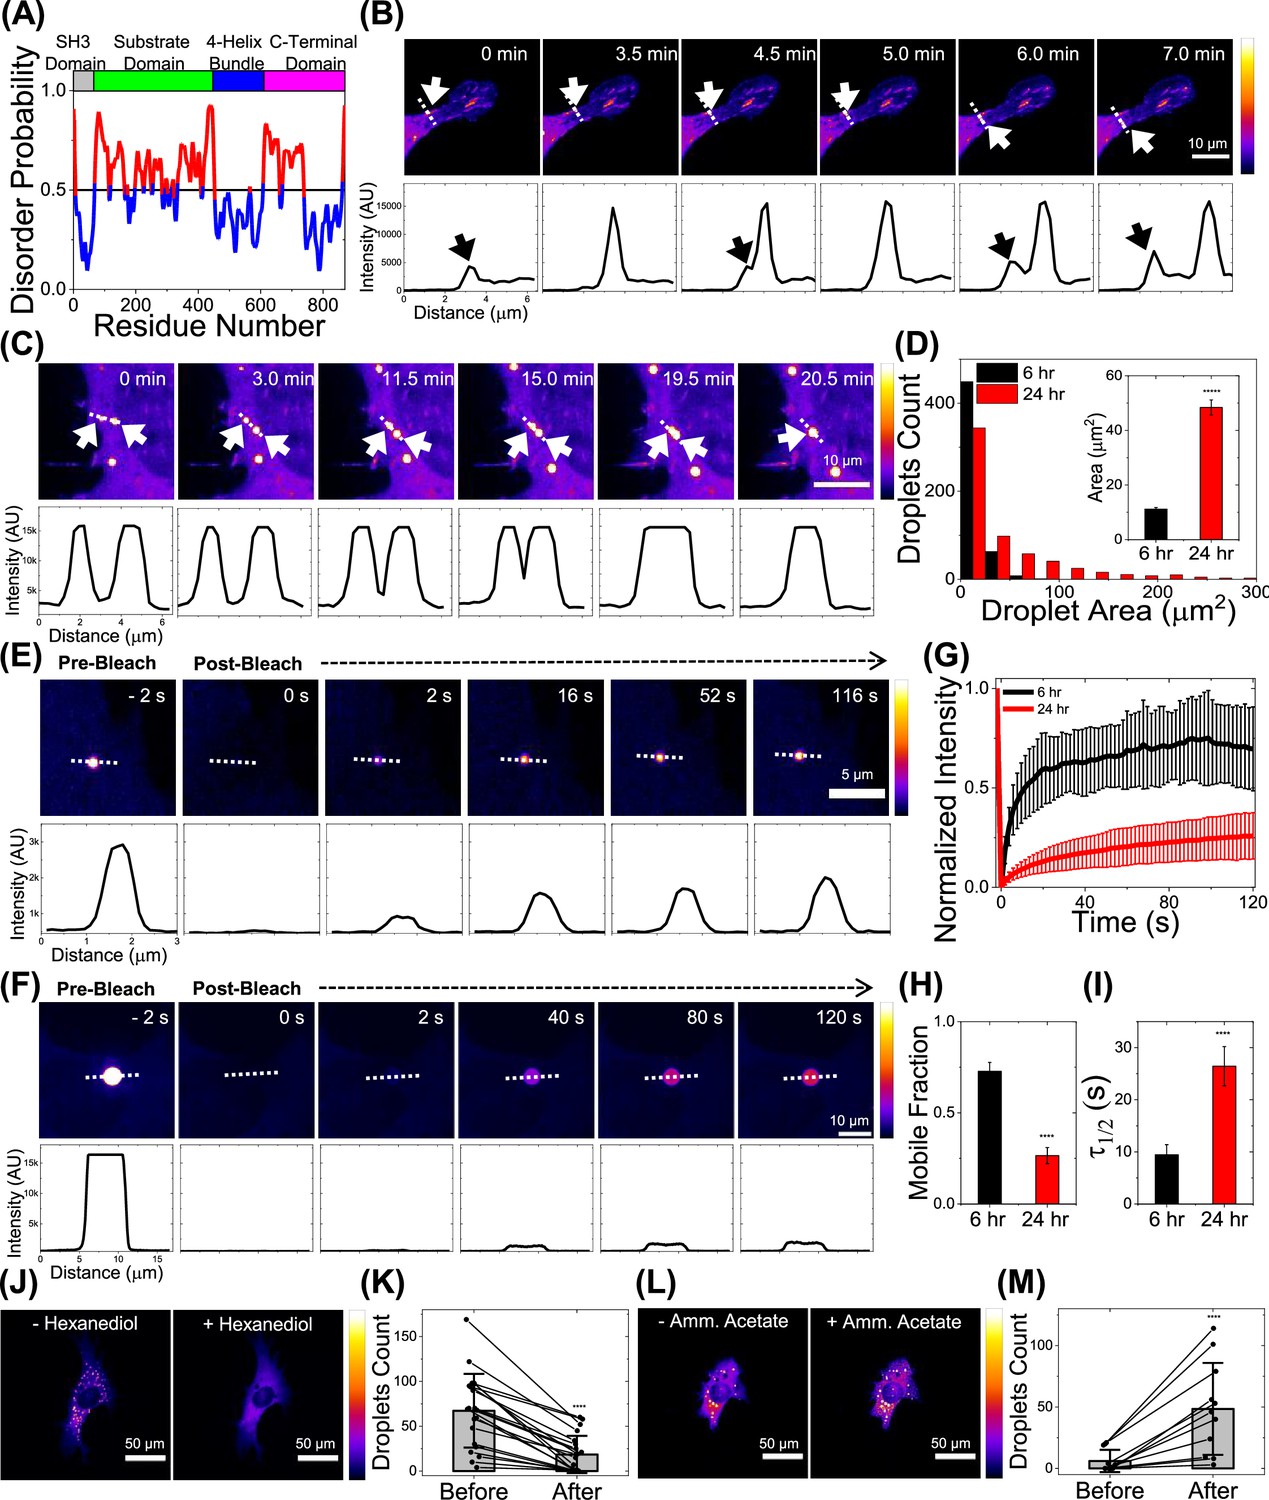
p130Cas phase separates in live cells.
(A) Plot of p130Cas (Homo sapiens) amino-acid position versus predicted disorder probability using web-based tool Protein DisOrder (PrDOS). Red indicates high probability of disorder. Top: Color-coded protein domains. Horizontal line at 0.5 represents 5% false positive rate prediction. (B) Time-lapse images showing the emergence of a p130Cas droplet from a focal adhesion (FA) within a live NIH3T3 cell. Intensity scale bar to the right; black/blue represents low intensity while white/yellow represents high intensity. Corresponding intensity line profiles (drawn left (0 µm) to right) perpendicular to the FA long axis are shown in the lower panels. White arrow in image panel and black arrow in line profile indicate droplet formation and FA, respectively. Note that the p130Cas intensity in the droplet is significantly higher than in the cytoplasm or FAs. Scale bar = 10 µm. (C) Time-lapse imaging shows coalescence of two droplets in a live NIH3T3 cell; corresponding intensity line scan in the lower panel. Scale bar = 10 µm. (D) Histogram of p130Cas droplet area at ~6 hr (black) and ~24 hr (red) after plating transfected NIH3T3 fibroblasts on fibronectin-coated glass bottom dishes. N=521 droplets from 48 cells and N=631 droplets from 121 cells for 6 hr and 24 hr, respectively. Inset: Mean droplet area at 6 hr and 24 hr. Error bars = standard error of the mean (SEM). P-value <5 × 10⁻⁶ using Student’s t-test. (E–F) Time lapse images showing droplet intensity (upper panel) and quantified intensity profile (lower panel) during FRAP at pre-bleach (–2 s), immediately after photobleach (0 s) and during recovery in cells at 6 hr (E) and 24 hr (F) after plating. Scale bar = 5 µm (E) & 10 µm (F). (G–I) Plot of normalized fluorescence intensity or recovery fraction with time for droplets at 6 hr (black curve) and 24 hr (red curve) and the corresponding mean mobile fraction (H) and t1/2 for recovery (I) determined by fitting individual Fluorescence Recovery After Photobleaching (FRAP) curves to single component exponential recovery function. N=14 for 6 hr and N=7 for 24 hr. Error bars = standard deviation (SD) in (G) and SEM in (H–I). (J–K) Intensity coded image (J) and quantification of number of droplets (K) (N=21 cells) before and after treatment with 5% hexanediol for 2 min. Error bars are standard deviations. Scale bar = 50 µm. (L–M) Intensity coded image (L) and quantification of number of droplets (M) (N=11 cells) before and after treatment with 100 mM ammonium acetate for 8 min. Scale bar = 50 µm. Error bars = SD.
Figure 1—figure supplement 1
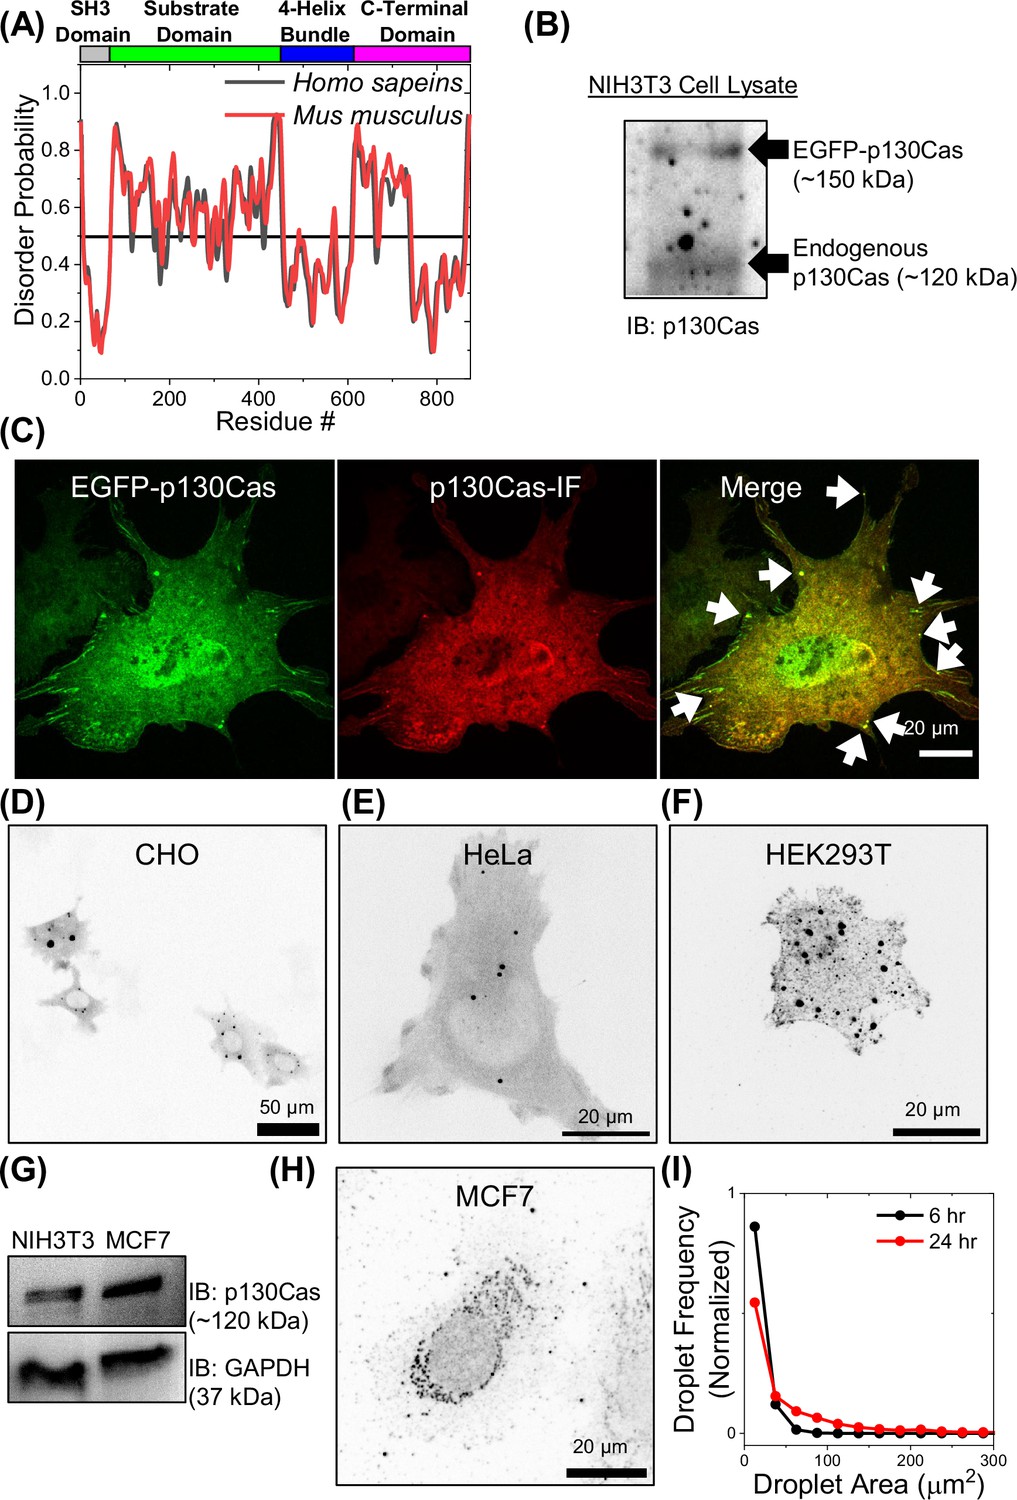
p130Cas condensates in different cell lines.
(A) Comparison of disorder probability of Homo sapiens (human) and Mus musculus (mouse) p130Cas. Plot of disorder probability prediction versus amino-acid residue position in human (black) and mouse (red) p130Cas/BCAR1. Top: Color-coded protein domains. Horizontal line at 0.5 represents 5% false positive rate prediction. (B) Immunoblot of p130Cas in EGFP-p130Cas NIH3T3 cell line under transient over-expression. (C) Immunofluorescence image of transiently transfected NIH3T3 with EGFP-p130Cas (green) stained with anti-p130Cas antibody (red) showing colocalization. Arrows point to droplets. Scale bar = 20 µm. (D–F) Inverted intensity images of EGFP-p130Cas transfected in (D) Chinese Hamster Ovary (CHO) cells (Scale bar = 50 µm), (E) HeLa cells (Scale bar = 20 µm) and (F) HEK 293 Tx cells (Scale bar = 20 µm). (G) Immunoblot of p130Cas in NIH3T3 and MCF7 cell line with GAPDH as a loading control. MCF7 cells express 2–2.5 x more p130Cas than NIH3T3 fibroblasts. (H) Inverted intensity immunofluorescence image of endogenous p130Cas in MCF7 cells stained with anti-p130Cas antibody. Scale bar = 20 µm. (I) Normalized histogram of p130Cas droplet area at ~6 hr (black) and ~24 hr (red) after plating transfected NIH3T3 fibroblasts on fibronectin-coated glass bottom dishes. N=521 droplets from 48 cells and N=631 droplets from 121 cells for 6 hr and 24 hr, respectively.
-
Figure 1—figure supplement 1—source data 1
Original membrane corresponding to Figure 1—figure supplement 1B, indicating the relevant bands.
- https://cdn.elifesciences.org/articles/96157/elife-96157-fig1-figsupp1-data1-v1.zip
-
Figure 1—figure supplement 1—source data 2
Original membrane corresponding to Figure 1—figure supplement 1G, indicating the relevant bands.
The membrane was first developed using p130cas antibody (A) and then using GAPDH antibody (B).
- https://cdn.elifesciences.org/articles/96157/elife-96157-fig1-figsupp1-data2-v1.zip
Figure 2 with 1 supplement
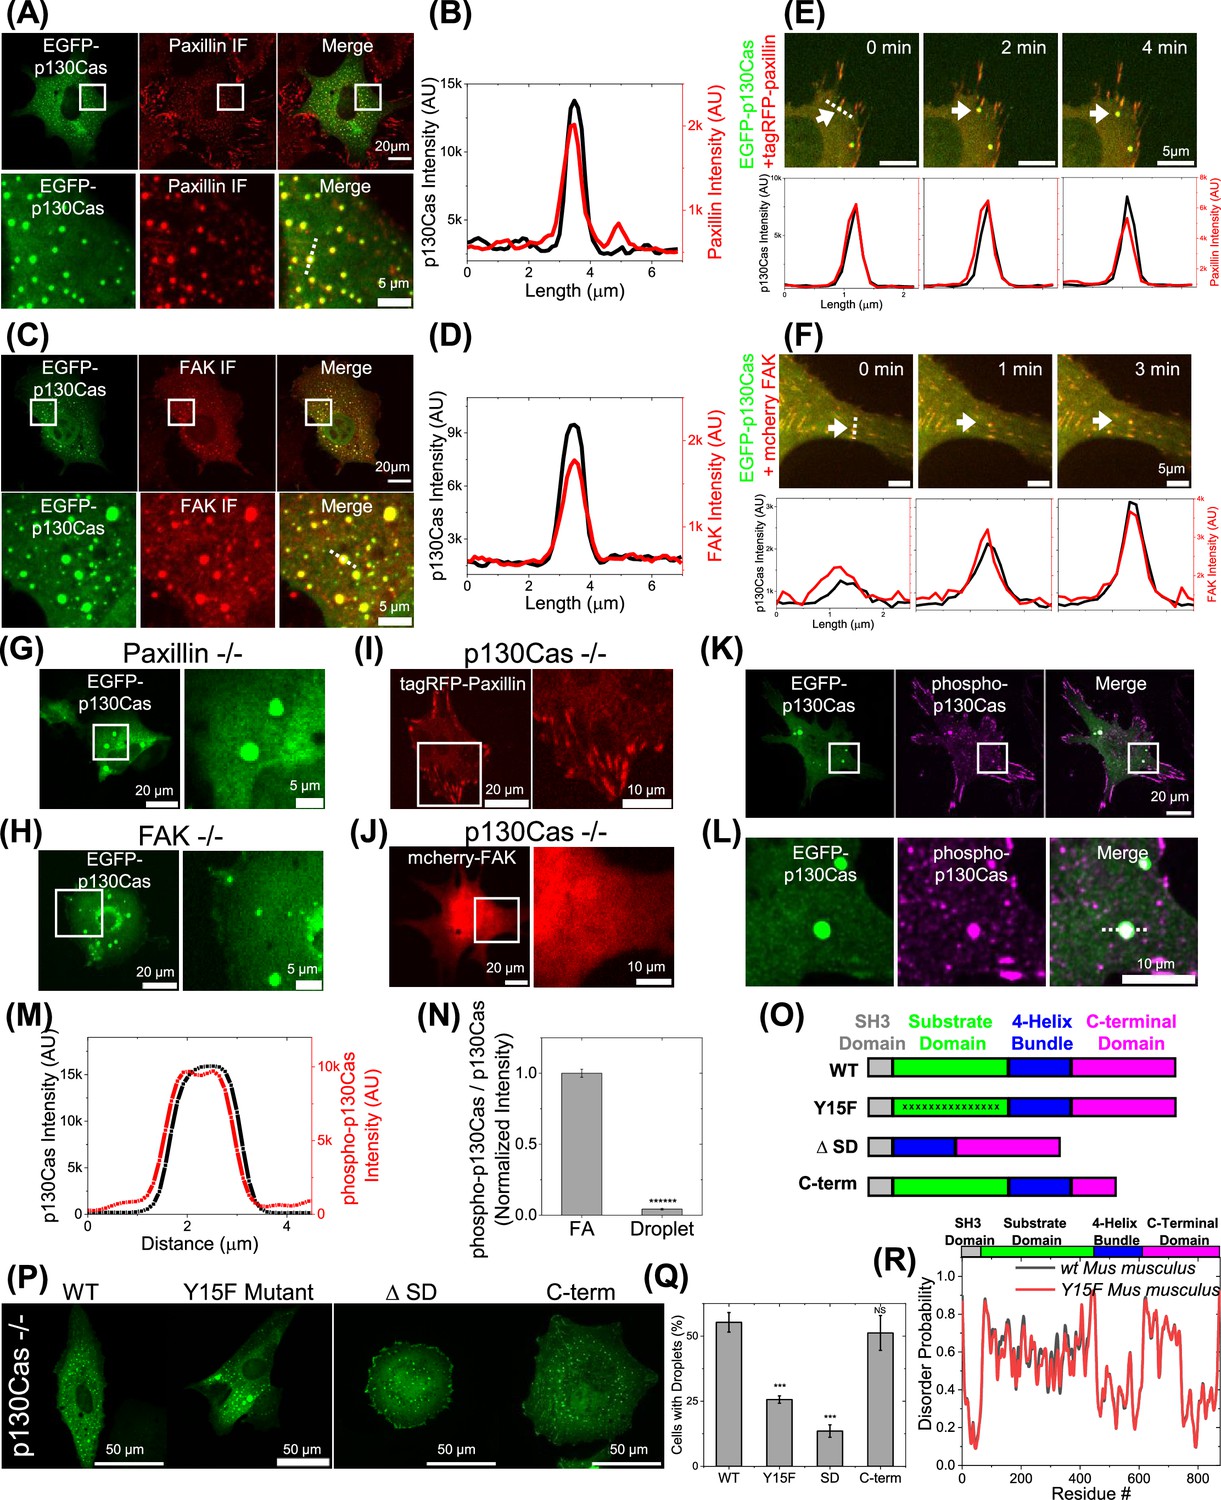
Paxillin and focal adhesion kinase (FAK) in p130Cas liquid-liquid phase separation (LLPS).
(A and C) EGFP-p130Cas (green) transfected cells immunostained for paxillin (red) (A) and FAK (C). Lower panels show zoomed-in images of the area in the white box. (B and D) Line scans of p130Cas and paxillin (B) /FAK (D) showing co-localization. (E and F) Time lapse images of a cell co-transfected with EGFP-p130Cas (green) and either tagRFP-paxillin (red) (E) or mcherry-FAK (red) (F) showing the co-emergence from a focal adhesion (FA) of paxillin (E) and FAK (F) with p130Cas. Lower panel: corresponding line intensity profile. (G and H) EGFP-p130Cas in a paxillin-null (G) and FAK-null (H) cell. Right panels show zoomed-in images of the boxed area. (I and J) Image of a p130Cas-null cell transfected with either tagRFP-paxillin (I) or mcherry-FAK (J). Right panels show zoomed-in images of the boxed area. (K) Immunofluorescence image of a cell expressing EGFP-p130Cas (green) stained for phosphorylated p130Cas (purple). (L) Lower panels show zoomed-in images of the boxed area. (M) Corresponding intensity line profile of phosphorylated p130Cas and p130Cas. (N) Ratio of phosphorylated p130Cas to total p130Cas in FA and droplets. N=2176 FA and 53 droplets from 10 cells each. Error bars = SEM. (O) Schematic of WT, Y15F mutant, substrate domain deleted (Δ68–456 or ΔSD) and C-terminal domain partly deleted p130Cas (Δ611–742 or C-term). (P) Image of p130Cas-/- cells transfected with EGFP- WT-, Y15F, ΔSD/Δ68–456, or C-term/ Δ611–742 p130Cas. (Q) Quantification of percentage of droplet-positive cells for the indicated constructs from N=7 (N indicates independent experiments) with 146/238, 76/156, 231/347, 56/86, 205/396, 236/430, and 110/284 cells; N=4 with 82/278, 52/201, 42/184, and 58/238 cells; N=3 with 38/346, 23/203, and 68/371 cells and N=3 with 139/287, 142/222, and 134/325 cells, respectively. Error bars = SEM. (R) Plot of disorder probability versus amino acid for WT (black) and Y15F mutant (red) mouse p130Cas. Top: Color-coded protein domains.
Figure 2—figure supplement 1
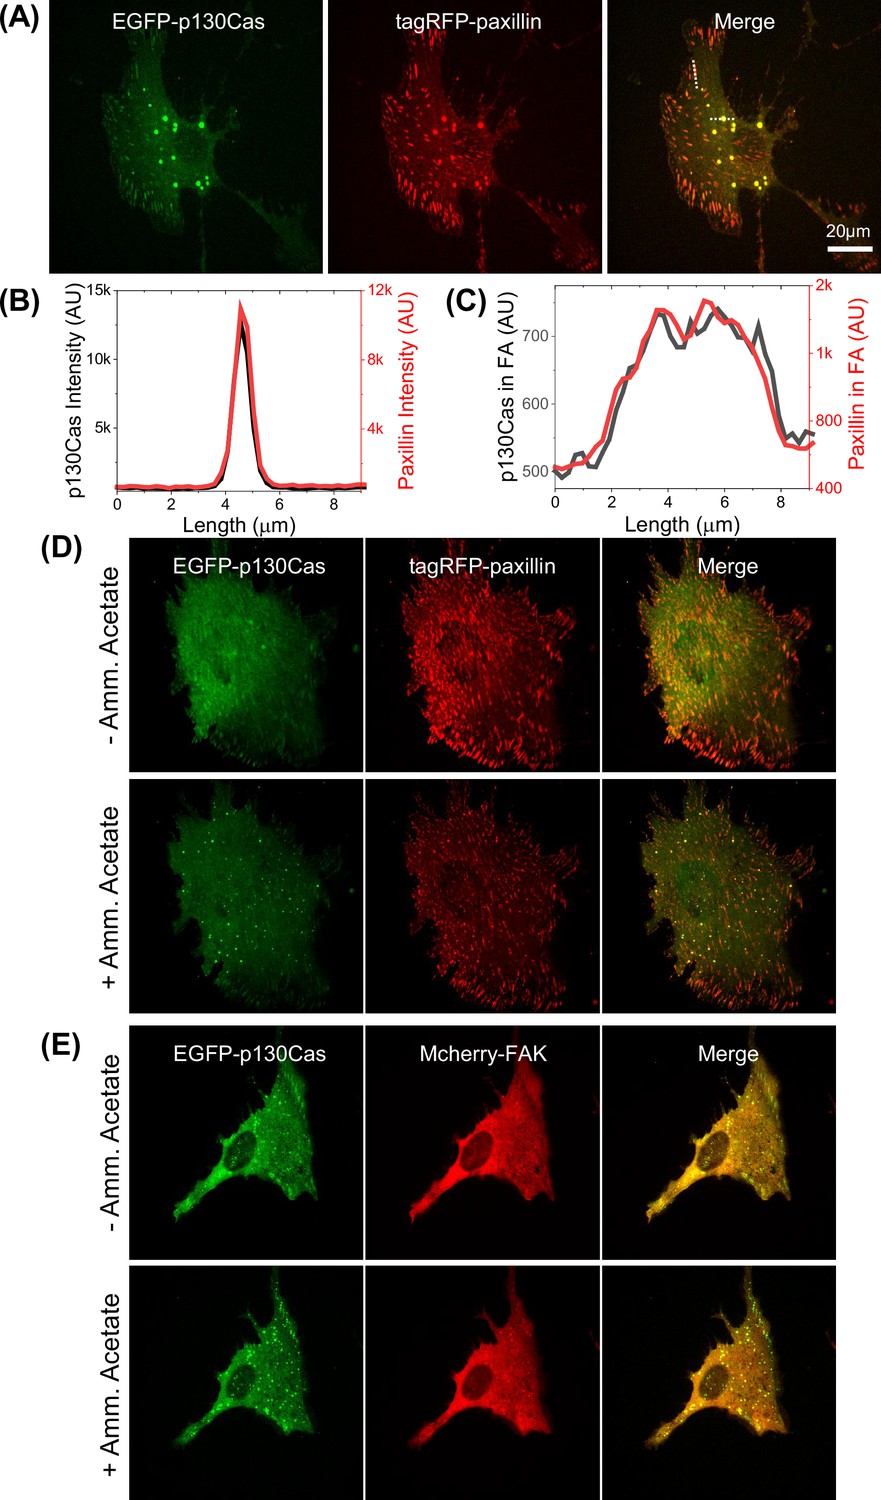
Colocalization of p130Cas condensates with paxillin and FAK.
(A) Cell co-transfected with EGFP-p130Cas (green- left panel) and tagRFP-paxillin (red- middle panel) showing colocalization (merge- right panel). (B–C) Corresponding line intensity profiles for a typical droplet (B) and a focal adhesion (FA) (C). (D–E) Cell co-transfected with EGFP-p130Cas (green- left panel) and tagRFP-paxillin (D) or mCherry-focal adhesion kinase (FAK) (E) (red- middle panel) showing colocalization in droplets with (lower panel) or without (upper-panel- control) 250 mM ammonium acetate treatment.
Figure 3 with 1 supplement
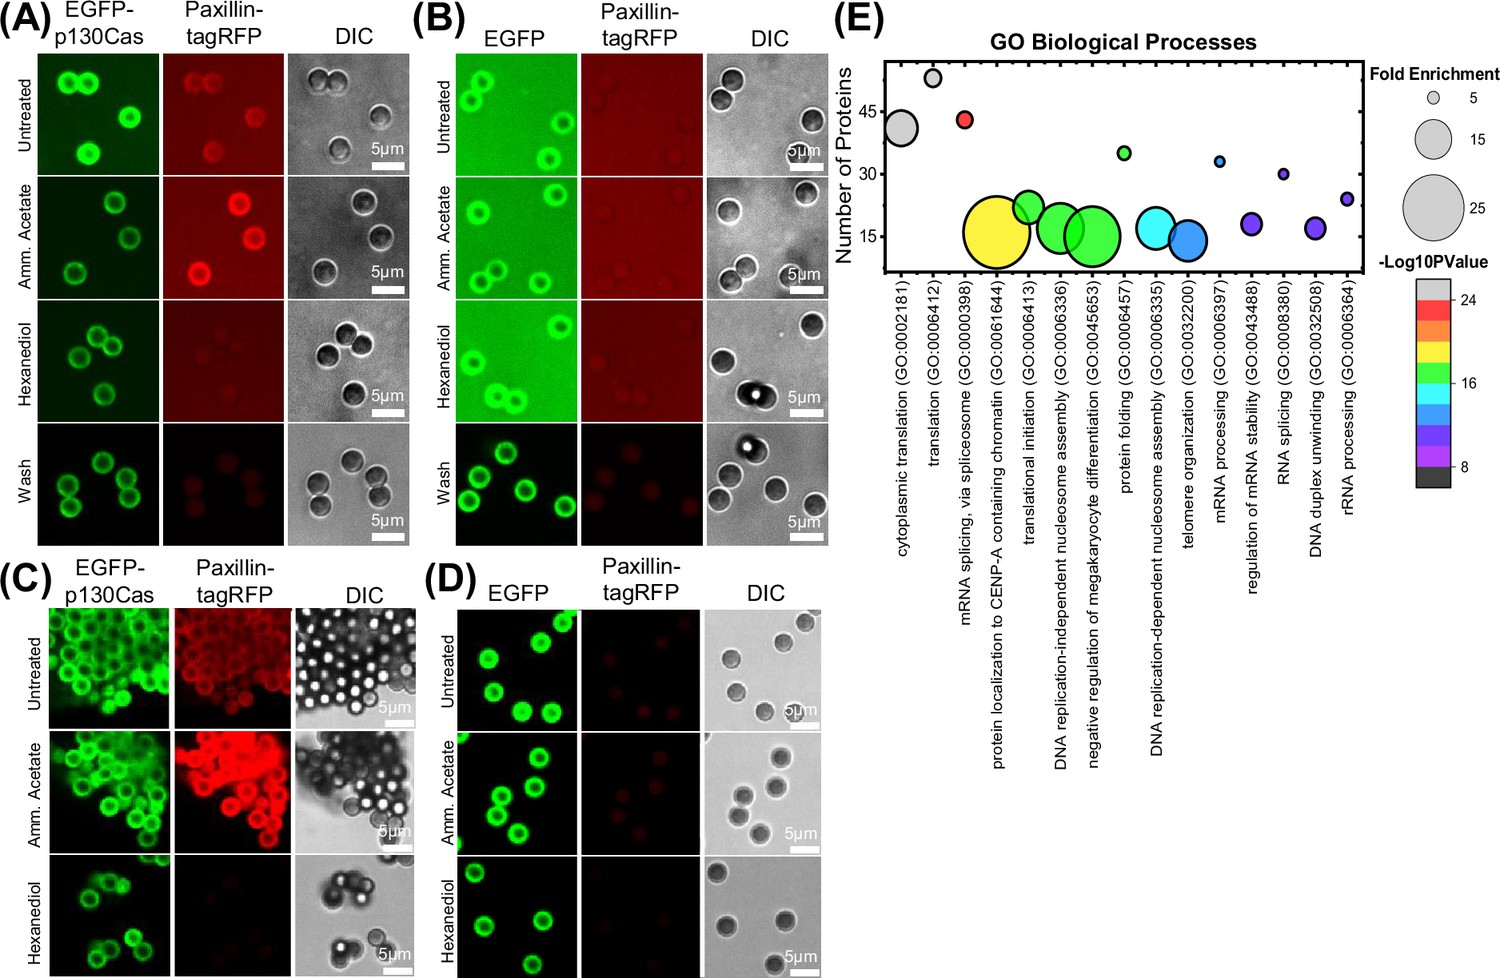
Isolation and characterization of p130Cas droplets.
(A and B) Fluorescence image of GFP-trap magnetic beads incubated with cell lysate from HEK293tx cells transfected with either EGFP-p130Cas (A) or EGFP (B) and then mixed with lysate from tagRFP-paxillin transfected cells. Images show p130Cas on beads (green- left panel), paxillin on beads (red- middle panel) and DIC images of beads (gray- right panel): First row- Untreated, second row- 250 mM ammonium acetate, third row- 5% hexanediol, fourth row- washed with PBS. (C & D) GFP-trap beads incubated with cell lysate from HEK293tx cells transfected with either EGFP-p130Cas (C) or EGFP (negative control) (D) plus lysate from tagRFP-paxillin cells. Beads treated as in A & B were fixed with 4% paraformaldehyde and then washed with cold PBS. Note retention of paxillin after washing. (E) Proteins specifically associated with p130Cas beads (≥2 counts and twofold enrichment compared with control beads) were analyzed for Gene Ontology (GO; biological processes) using the online webtool-Database for Annotation, Visualization, and Integrated Discovery (DAVID). Number of proteins versus corresponding Gene ontology (GO) term is plotted with fold enrichment depicted by the size of the circle and -log10(p-value) by the color of the circle. The corresponding fold enrichment and -log10(p-value) scale bars are shown to the right of each plot. GO terms are sorted in descending order of their -log10(p-values).
Figure 3—figure supplement 1

Venn diagram of proteins in p130Cas condensates and its direct interactors obtained using mass spectrometric proteomics.
Venn diagram showing the number of proteins significantly enriched in p130Cas droplets relative to GFP-only vs its published direct interactors.
Figure 4 with 1 supplement
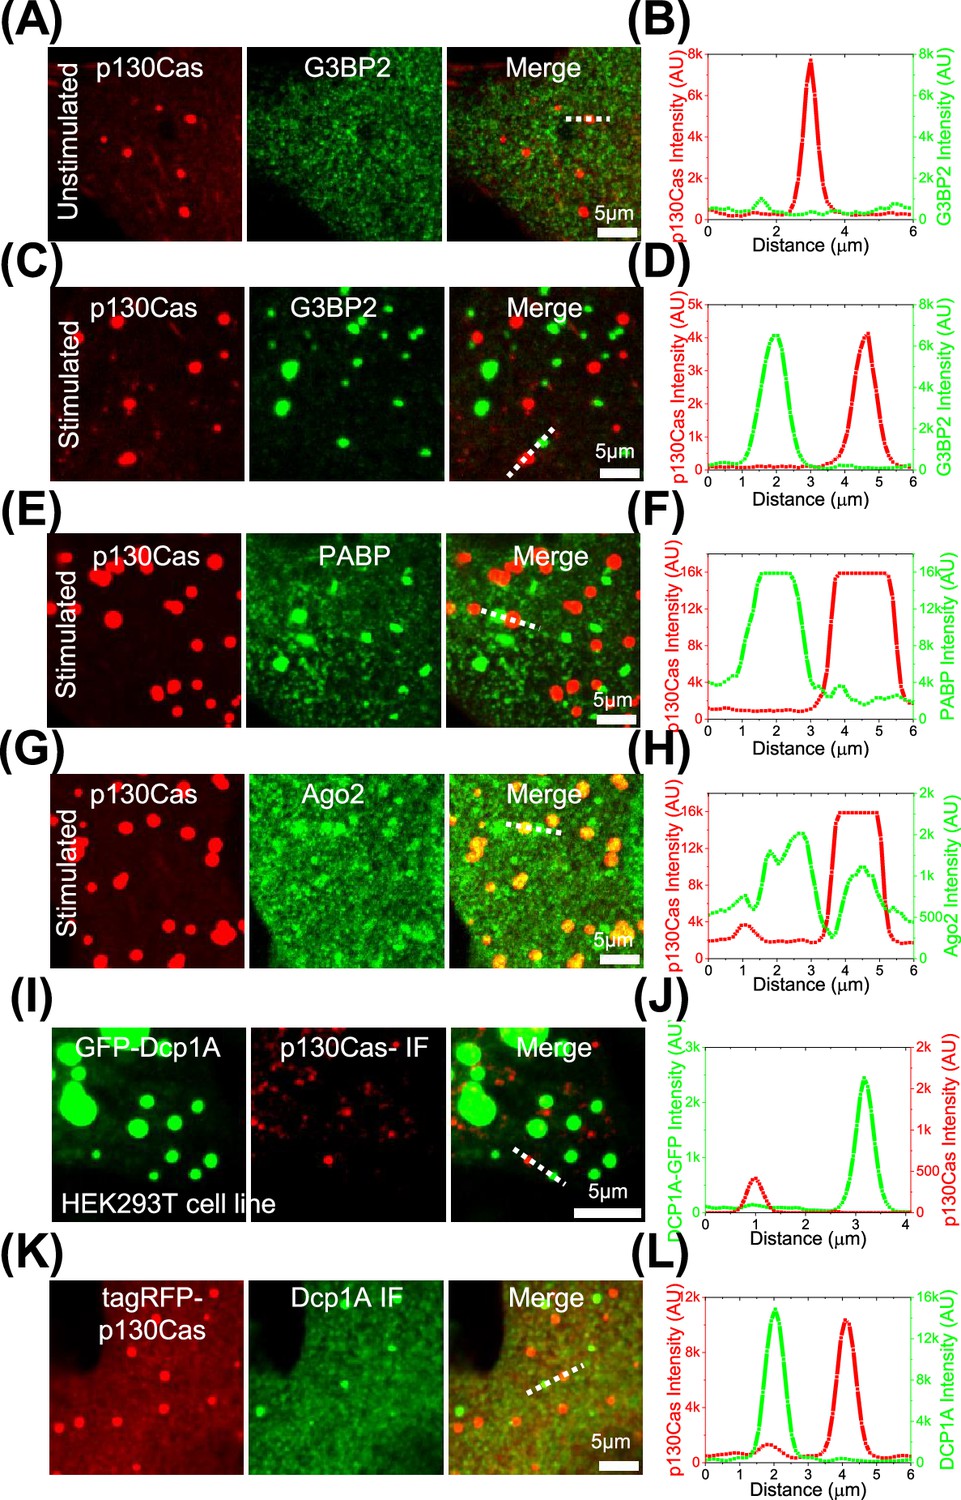
p130Cas comparison to stress granules and p-bodies.
(A, C, E and G) Cells expressing EGFP-p130Cas (red- left panel) stained for G3BP2 (A and C), PABP (E), or Ago2 (G) (green - middle panel) and merged (right panel) under control/unstimulated (A) and stress granule induction with sodium arsenite (C, E, and G). (B, D, F, and H) The corresponding line intensity profile across a p130Cas droplet and a stress granule. (I) Immunofluorescence image of p130Cas (red - middle panel) in HEK293T cells stably expressing EGFP-Dcp1A marking p-granules (green-left panel) and the merge (right panel). (J) The corresponding line intensity profile across a p130Cas droplet and a p-granule. (K) Immunofluorescence image of Dcp1A (green - middle panel) in NIH3T3 cells expressing tagRFP-p130Cas (red-left panel) and the merge (right panel). (L) The corresponding line intensity profile across a p130Cas droplet and a p-granule.
Figure 4—figure supplement 1
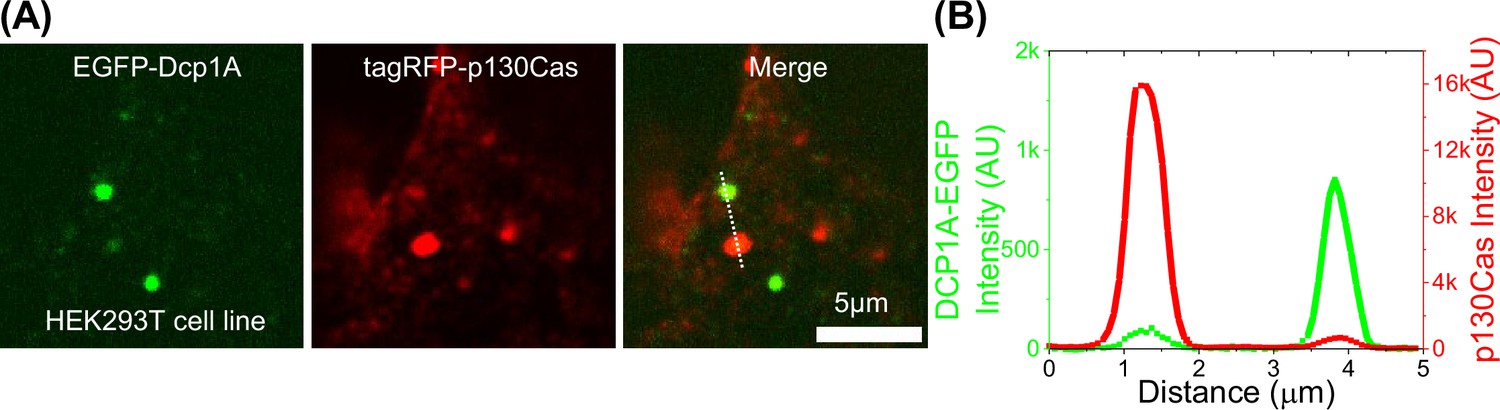
Colocalization between p130Cas condensates and p-bodies.
(A) HEK293T cells stably expressing EGFP-Dcp1A (left-panel) transfected with tagRFP-p130Cas (red-middle panel) and merged (right-panel). (B) A typical line intensity profile across a p130Cas droplet and a p-granule.
Figure 5 with 1 supplement

p130Cas comparison to mRNA processing proteins and mRNA.
(A and C) Cells expressing EGFP-p130Cas (green- left panel) stained for Ago2 (A) and GW182 (C) (purple- middle panel) and merged (right panel). (B and D) Corresponding line intensity profile across a p130Cas droplet showing its colocalization with Ago2 present throughout the droplet (A) and GW182 at the periphery of the droplet (C). (E) Cells expressing tagRFP-p130Cas (red- left panel) with RNA- fluorescence in-situ hybridization (FISH) of poly-A binding probes (green- middle panel) and merged. (F) The corresponding line intensity profile across a p130Cas droplet showing colocalization with RNA-FISH probes. (G) EGFP-p130Cas expressing cells plated for 5 hr without (-CHX) or with (+CHX) 100 µg/ml cycloheximide for 2 min. (H) Number of droplets per cell under these conditions. N=3 independent experiments with 39 and 52 cells for -CHX and +CHX, respectively. Bar represents Mean, horizontal line is median and Error bars = SD.
Figure 5—figure supplement 1
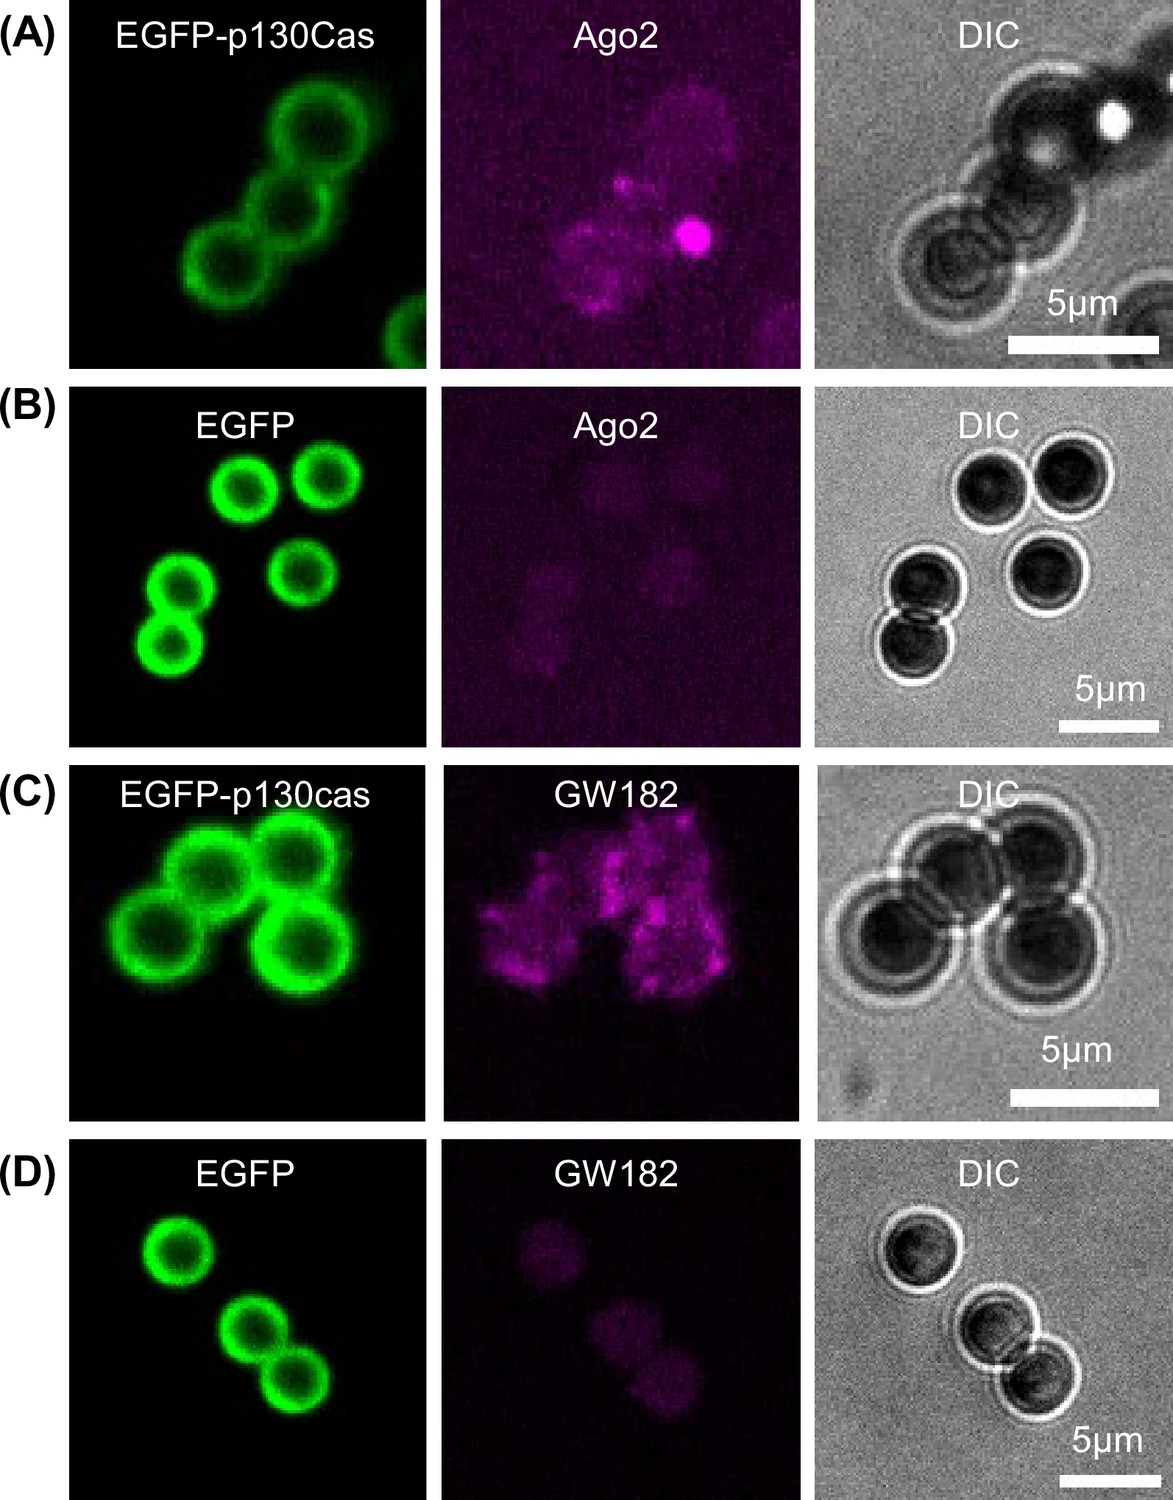
Ago2 and GW182 in in vitro purified p130Cas condensates on beads.
Immunofluorescence of Ago2 (A and B) and GW182 (C and D) (purple- middle panel) on GFP-Trap magnetic beads incubated with cell lysate from HEK293tx cells transfected with either EGFP-p130Cas (A and C) or EGFP (B and D) after fixation with 4% PFA. Corresponding DIC images, right panel.
Figure 6
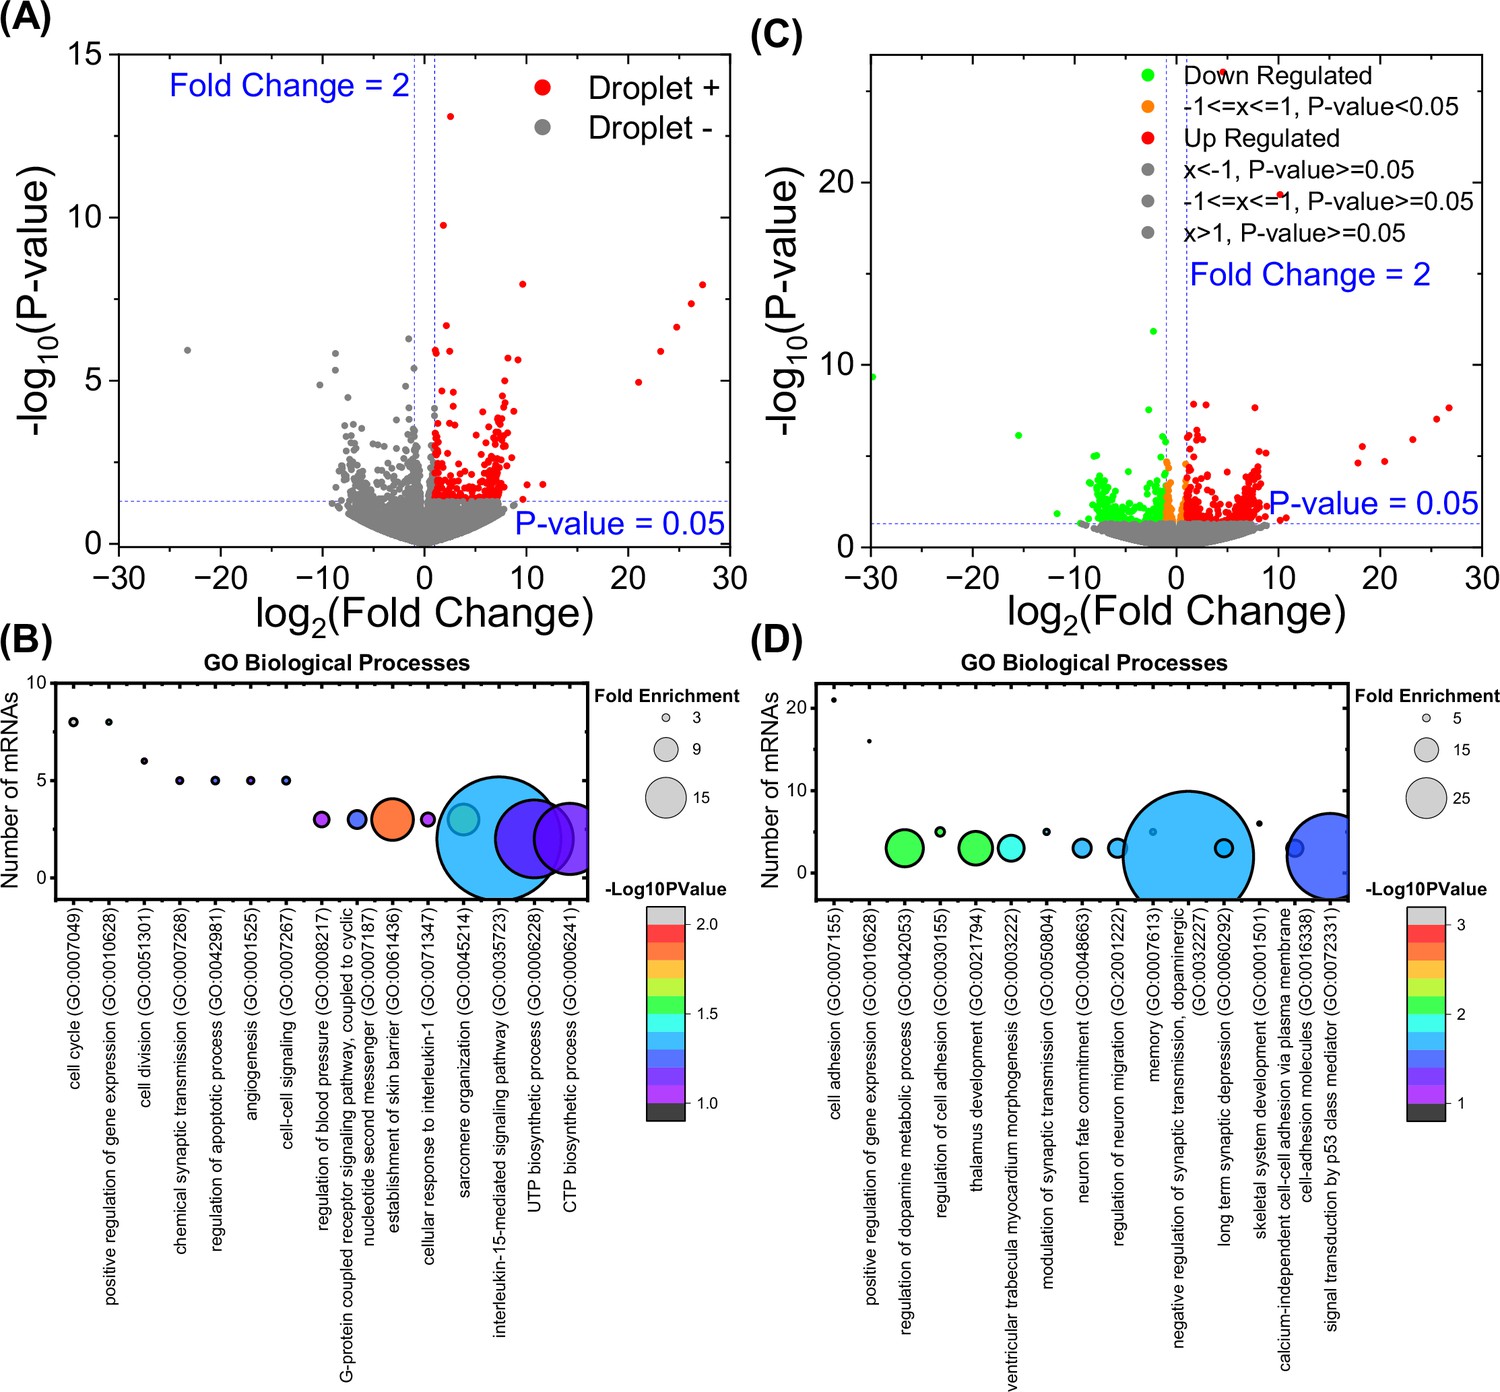
mRNAs associated with p130Cas droplets.
(A) Volcano plot of mRNAs enriched on p130Cas beads compared to the EGFP-only control. mRNAs with twofold enrichment and p-value <0.05 are associated with p130Cas droplet (red dots). (B) Gene Ontology (GO) analysis (biological processes) of p130Cas-enriched mRNAs as described in Methods. (C) Volcano plot of p130Cas-regulated mRNAs. mRNAs with twofold up-regulation (red dots) or down-regulation (green dots) after p130Cas expression compared to the control transfected. (D) GO analysis (biological processes) of p130Cas-regulated mRNAs as described in Methods. Number of mRNAs versus corresponding GO term is plotted with fold enrichment depicted by the size of the circle and -log10(p-value) by the color of the circle. The corresponding fold enrichment and -log10(p-value) scale bars are shown to the right of each plot. GO terms are sorted in the descending order of the mRNA count (B) or -log10(p-values) (D).
Figure 7 with 1 supplement

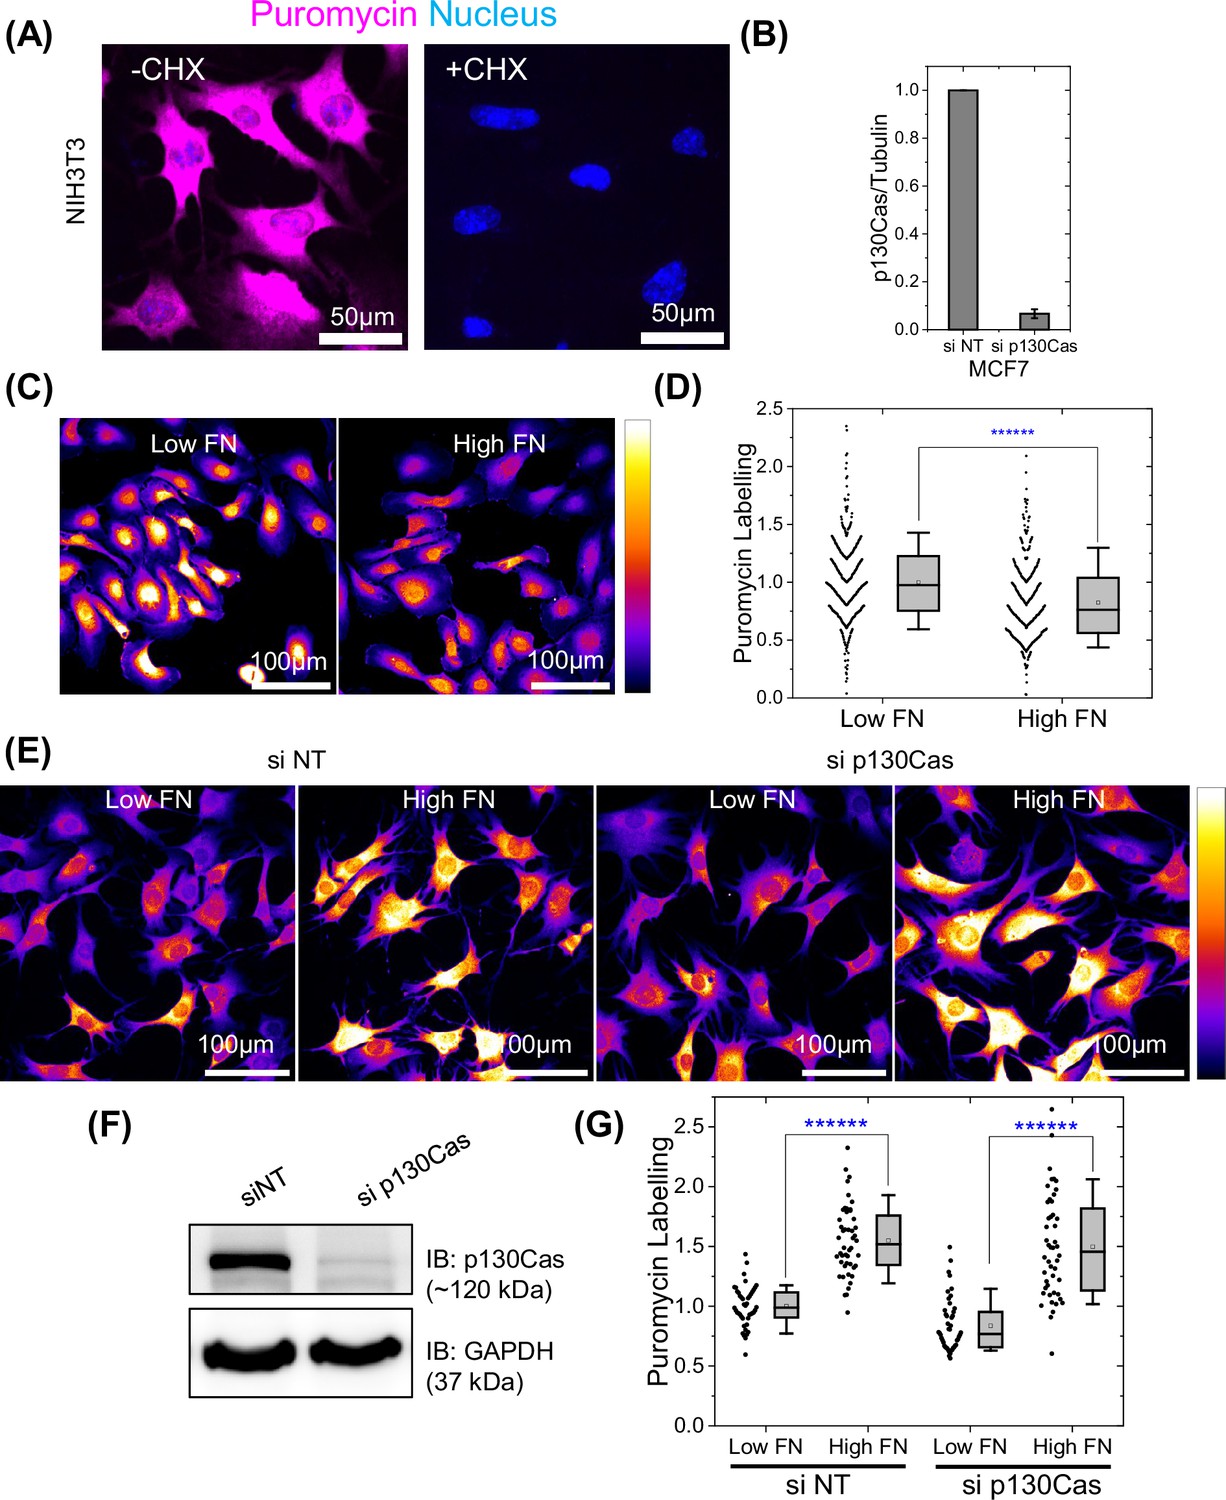
p130Cas liquid-liquid phase separation (LLPS) regulates global protein synthesis in hyper-adhesive cells.
(A–B) MCF7 on low (2 µg/ml), medium (20 µg/ml), and high (50 µg/ml) fibronectin-coated dishes stained for paxillin (red) with the nucleus labeled using Hoechst-33343. Zoomed-in images (B) of the area labeled in the white box in (A) showing punctate paxillin in the cytosol to mark droplets. Scale bar = 20 µm (A) and 5 µm (B). (C) Quantification of puncta in MCF7 cells from A&B. N=5 field of views (FOVs) with 3–6 cells per field of view from three independent experiments imaged using high resolution 60x objective. (D) Intensity-coded images of MCF7 cells on low, medium, and high fibronectin (FN) incubated with puromycin then fixed and stained with anti-puromycin antibody. Scale bar = 100 µm. All images in a panel are shown at same intensity scale as depicted in the right color bar with black/blue as low intensity and white/yellow as high intensity. (E) Quantification of puromycin labeling intensity from D. N=262, 285, and 240 cells from 16 field of views each for low, medium, and high fibronectin, respectively from three independent experiments. (F and I) Intensity-coded images of puromycin labeling in MCF7 cells (F) & HUVECs (I) transfected with scrambled siRNAs or p130Cas siRNA on low and high fibronectin coated substrate. Scale bar = 100 µm. (G and J) Immunoblot of p130Cas for cells in (G) and HUVECs (J), with tubulin (G) and GAPDH (J) as loading controls. (H and K) Quantification of puromycin intensity for multiple cells MCF7 from F & I. N=690, 331, 547, & 359 MCF7 cells and N=792, 873, 1232, & 1054 HUVECs from 25 FOVs each from three independent experiments for cells on low and high fibronectin without and with p130Cas knockdown respectively. (L) Intensity coded images of puromycin labeling in MCF10A cells plated on low and high fibronectin coated substrate. Scale bar = 50 µm. (M) Quantification of puromycin intensity from multiple cells from L. N=859 and 863 cells from 25 field of views from three independent experiments for cells on low and high fibronectin, respectively.
-
Figure 7—source data 1
Original membrane corresponding to Figure 7G (Same as Figure 1—figure supplement 1—source data 2), indicating the relevant bands and treatment.
The membrane was first developed using p130cas antibody (A) (and then using the GAPDH antibody) and then using the tubulin antibody (B).
- https://cdn.elifesciences.org/articles/96157/elife-96157-fig7-data1-v1.zip
-
Figure 7—source data 2
Original membrane corresponding to Figure 7J, indicating the relevant bands and treatment.
The membrane was first developed using p130cas antibody (A) and then using the GAPDH antibody (B). White light image corresponding to each membrane is shown in the right panel.
- https://cdn.elifesciences.org/articles/96157/elife-96157-fig7-data2-v1.zip
Figure 7—figure supplement 1
Role of p130Cas LLPS in modulating protein synthesis in hyperadhesive cells.
(A) NIH 3T3 cells on low or high fibronectin (FN) labeled with puromycin (purple), nucleus labeled with Hoechst 33343. Cells were treated with or without 100 µg/ml cycloheximide for 2 min before puromycin labeling for 10 min. (B) Quantification of p130Cas Western blot after knock-down in MCF7 cells. (C) HUVECs on low vs high FN labeled with puromycin as in A. (D) Quantification of puromycin labeling intensity in C. N=388 and 348 cells from nine fields of views each from three independent experiments for low and high FN conditions, respectively. (E) NIH 3T3 cells transfected with control or p130Cas siRNA on low vs. high FN, labeled for puromycin as in (A). (F) Immunoblot of p130Cas for NIH 3T3 cells in (E), GAPDH as loading controls. Labeling intensity quantified in (G). N=4 field of views each from four independent experiments for each condition.
-
Figure 7—figure supplement 1—source data 1
Original membrane corresponding to Figure 7—figure supplement 1F, indicating the relevant bands and treatment.
The membrane was first developed using p130cas antibody (A) and then using GAPDH antibody (B).
- https://cdn.elifesciences.org/articles/96157/elife-96157-fig7-figsupp1-data1-v1.zip
Figure 8 with 1 supplement
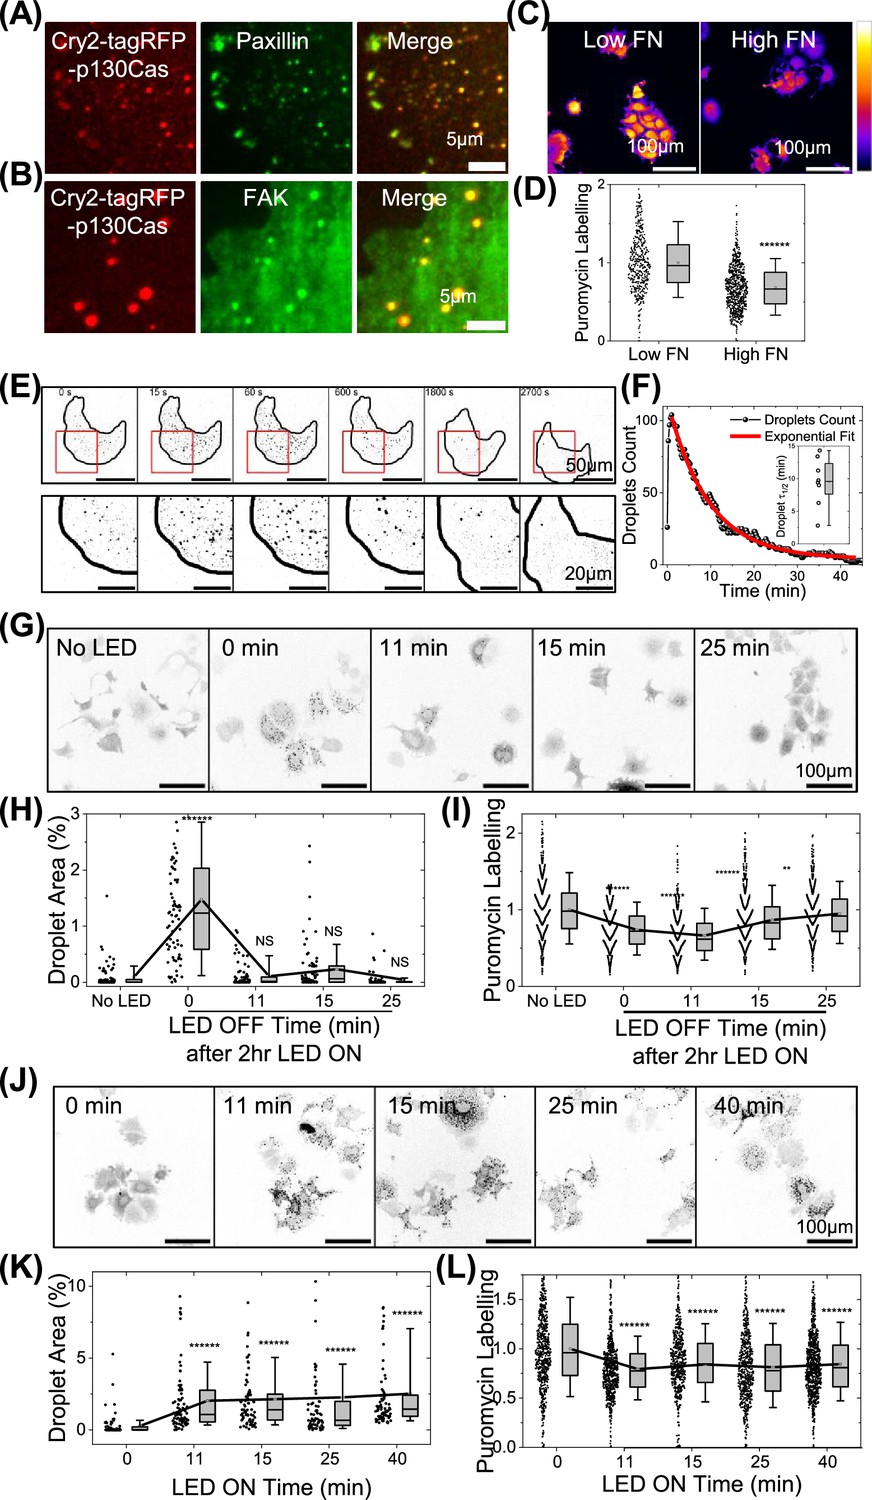
Light-induced p130Cas droplets regulate translation.
(A–B) MCF7 cells expressing light-inducible cry2-tagRFP-p130Cas illuminated with blue LED light (red- left panel) stained for paxillin (A) or focal adhesion kinase (FAK) (B) (green-middle panel) and merged (right panel). Scale bar = 5 µm. (C) Intensity coded images of puromycin labeling in stable MCF7 cell line with modest over-expression of cry2-tagRFP-p130Cas plated on low and high fibronectin coated substrate. Scale bar = 100 µm. (D) Quantification of puromycin intensity in multiple cells from C. N=446 and 747 cells from 25 field of views for cells on low and high fibronectin, respectively from three independent experiments. (E) Time lapse intensity inverted images of MCF7 cells stably expressing cry2-tagRFP-p130Cas before (first frame) and after (second frame onwards) a 0.5 s 488 nm laser pulse. Scale bar = 50 µm. Lower panels show zoomed-in images of the area labeled in the red box. Scale bar = 20 µm. (F) Typical plot of the droplets per cell over time after illumination of cry2-tagRFP-p130Cas cells. Red line shows the fit to an exponential function to determine the half-life of the droplets. Inset: Box plot of half-life of p130Cas droplets showing mean at 9.5±3.7 min. N=8 cells. (G) Intensity inverted images of cry2-tagRFP-p130Cas cell line with no blue LED light induction (first image) and cells illuminated with pulsed blue LED light for 2 hr then incubated in the dark for indicated times. Cells were then pulsed with puromycin, fixed, and stained. Scale bar = 100 µm. (H–I) Quantification of droplet area percentage (H) and puromycin labeling intensity (I) in cells from (G). N>550 cells from 25 FOVS from three independent experiments each for No LED light, 0, 11, 15, and 25 min, respectively after switching off the blue LED after intermittently illumination for 2 hr. (J) Intensity inverted images of cry2-tagRFP-p130Cas cell line with no light (first image) or illuminated for with pulsed LED light for the indicated times, labeled with puromycin and stained. Scale bar = 100 µm. (K–L) Quantification of droplet area % (K) and puromycin labeling intensity (L) for cells in (J). N>550 cells from 25 FOVS from three independent experiments each for No blue LED light or LED switched on for 11, 15, 25, and 40 min, respectively with intermittent pulses.
Figure 8—figure supplement 1
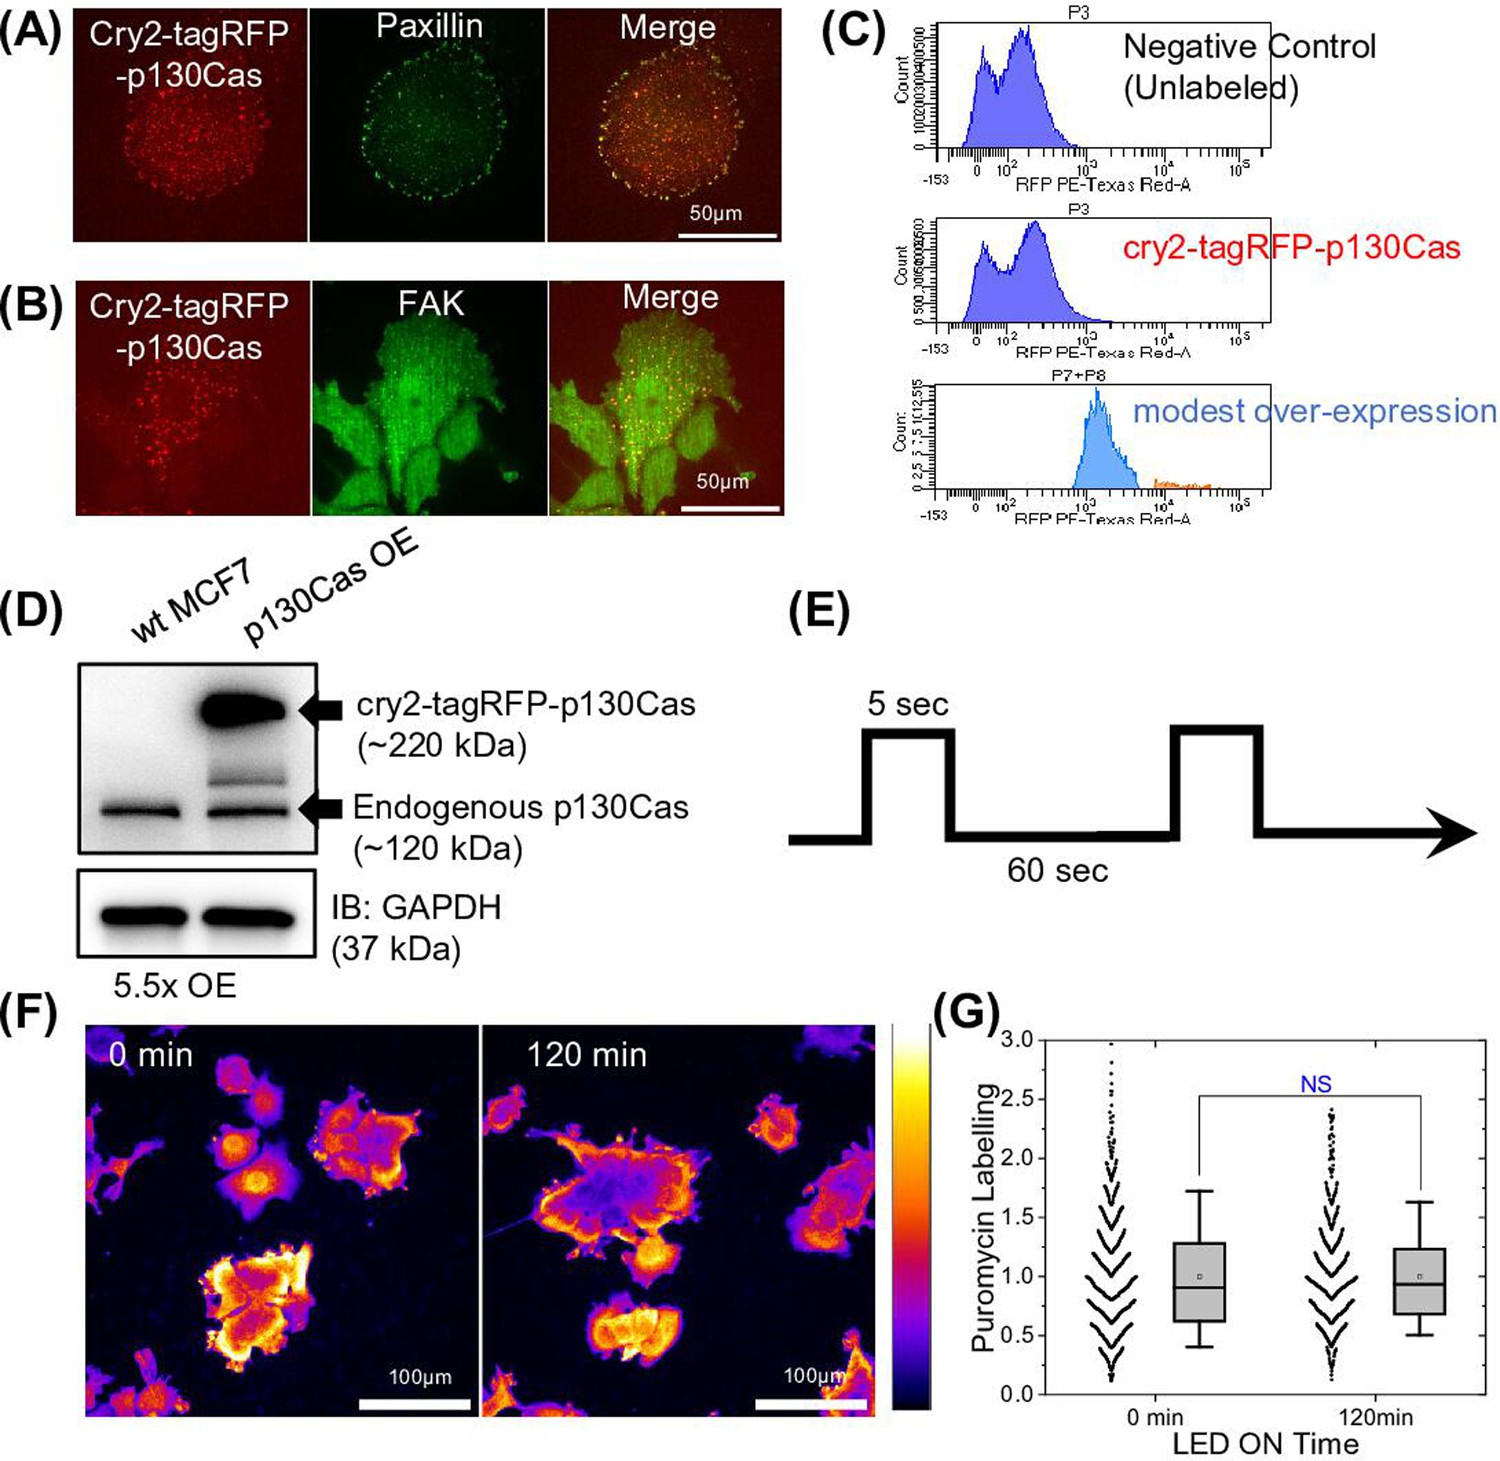
Characterization of light inducible p130Cas droplets in cells.
(A–B) MCF7 cells expressing light-inducible cry2-tagRFP-p130Cas after exposure to 470 nm LED light and stained for paxillin (A) or focal adhesion kinase (FAK) (B) (green-middle panel) in (red- left panel), merge-right panel. Scale bar = 50 µm. (C) MCF7 cells stably expressing cry2-tagRFP-p130Cas were sorted for modest vs high expressors and cells analyzed for tagRFP intensity. Top panel: untransfected MCF7 cells (negative control), unsorted cells (middle panel), sorted cells (modest over-expression -light blue) (bottom panel). (D) Immunoblot of p130Cas in wild-type (WT) and stable cry2-tagRFP-p130Cas expressing MCF7 cell line with GAPDH as a loading control. (E) Pulse sequence with 5 s ON followed by 60 s OFF to minimize phototoxicity. Blue LED light array was controlled using programmable switch-Arduinos. (F). Puromycin-labeled control WT MCF7 cells after 0- and 120 min exposure to blue LED light pulse protocol and (G) quantification of normalized puromycin intensity under these two conditions showing no effect of illumination on protein synthesis. N=680 and 591 cells, respectively for 0 and 120 min from 16 field of views each from three independent experiments.
-
Figure 8—figure supplement 1—source data 1
Original membrane corresponding to Figure 8—figure supplement 1D, indicating the relevant bands and treatment.
The membrane was first developed using p130cas antibody (A) and then using GAPDH antibody (B). White light image corresponding to each membrane is shown in the right panel.
- https://cdn.elifesciences.org/articles/96157/elife-96157-fig8-figsupp1-data1-v1.zip
Videos
Video 1
Movie showing emergence of p130Cas droplets from focal adhesion (FA) in a live NIH3T3 fibroblast transiently transfected with EGFP-p130Cas freshly plated on fibronectin-coated glass bottom dishes.
Time points are shown in each frame, frame interval = 30 s. Scale bar = 10 µm.
Video 2
Movie showing coalescence of two cytoplasmic p130Cas droplets in a live NIH3T3 fibroblast transiently transfected with EGFP-p130Cas freshly plated on fibronectin-coated glass bottom dishes.
Time points are shown in each frame, frame interval = 30 s. Scale bar = 10 µm.
Video 3
Movie of p130Cas droplet merging back into a focal adhesion (FA) in a live NIH3T3 fibroblast transiently transfected with EGFP-p130Cas freshly plated on fibronectin-coated glass bottom dishes.
Time points are shown in each frame, frame interval = 30 ss. Scale bar = 10 µm.
Video 4
Movie of p130Cas droplet co-emerging from focal adhesion (FA) along with paxillin.
EGFP-p130Cas is in green and tagRFP-Paxillin is in red. Time points are shown in each frame, frame interval = 2 min. Scale bar = 10 µm.
Video 5
Movie of p130Cas droplet co-emerging from focal adhesion (FA) along with focal adhesion kinase (FAK).
EGFP-p130Cas is in green and mcherry-FAK is in red. Time points are shown in each frame, frame interval = 1 min. Scale bar = 10 µm.
Video 6
Movie of induction of p130Cas droplets in MCF7 cell line stably expressing modest levels of cry2-tagRFP-p130Cas upon irradiation with blue laser light for 0.5 s.
0 s frame is before irradiation and 15 s onwards frame is after irradiation. Time points are shown in each image, frame interval = 15 s. Scale bar = 50 µm.
Additional files
-
Supplementary file 1
Excel Sheet containing the list of proteins found in p130Cas droplets determined by mass spectrometry.
- https://cdn.elifesciences.org/articles/96157/elife-96157-supp1-v1.xlsx
-
Supplementary file 2
Excel Sheet containing the list of mRNAs found in p130Cas droplets determined by RNA sequencing.
- https://cdn.elifesciences.org/articles/96157/elife-96157-supp2-v1.xlsx
-
Supplementary file 3
Excel Sheet containing the list of differentially regulated mRNAs in HEK293T cells with p130Cas droplets induced by its overexpression as determined by RNA sequencing.
- https://cdn.elifesciences.org/articles/96157/elife-96157-supp3-v1.xlsx
-
MDAR checklist
- https://cdn.elifesciences.org/articles/96157/elife-96157-mdarchecklist1-v1.docx
Download links
A two-part list of links to download the article, or parts of the article, in various formats.
Downloads (link to download the article as PDF)
Open citations (links to open the citations from this article in various online reference manager services)
Cite this article (links to download the citations from this article in formats compatible with various reference manager tools)
Focal adhesion-derived liquid-liquid phase separations regulate mRNA translation
eLife 13:RP96157.
https://doi.org/10.7554/eLife.96157.2


