Architecture of genome-wide transcriptional regulatory network reveals dynamic functions and evolutionary trajectories in Pseudomonas syringae
- Department of Biomedical Sciences, City University of Hong Kong, China
- The University of Hong Kong, Pokfulam, China
- Shenzhen Research Institute, City University of Hong Kong, China
- Tung Biomedical Sciences Center, City University of Hong Kong, China
- Chengdu Research Institute, City University of Hong Kong, China
- Institute of Digital Medicine, City University of Hong Kong, China
Figures
Figure 1 with 2 supplements
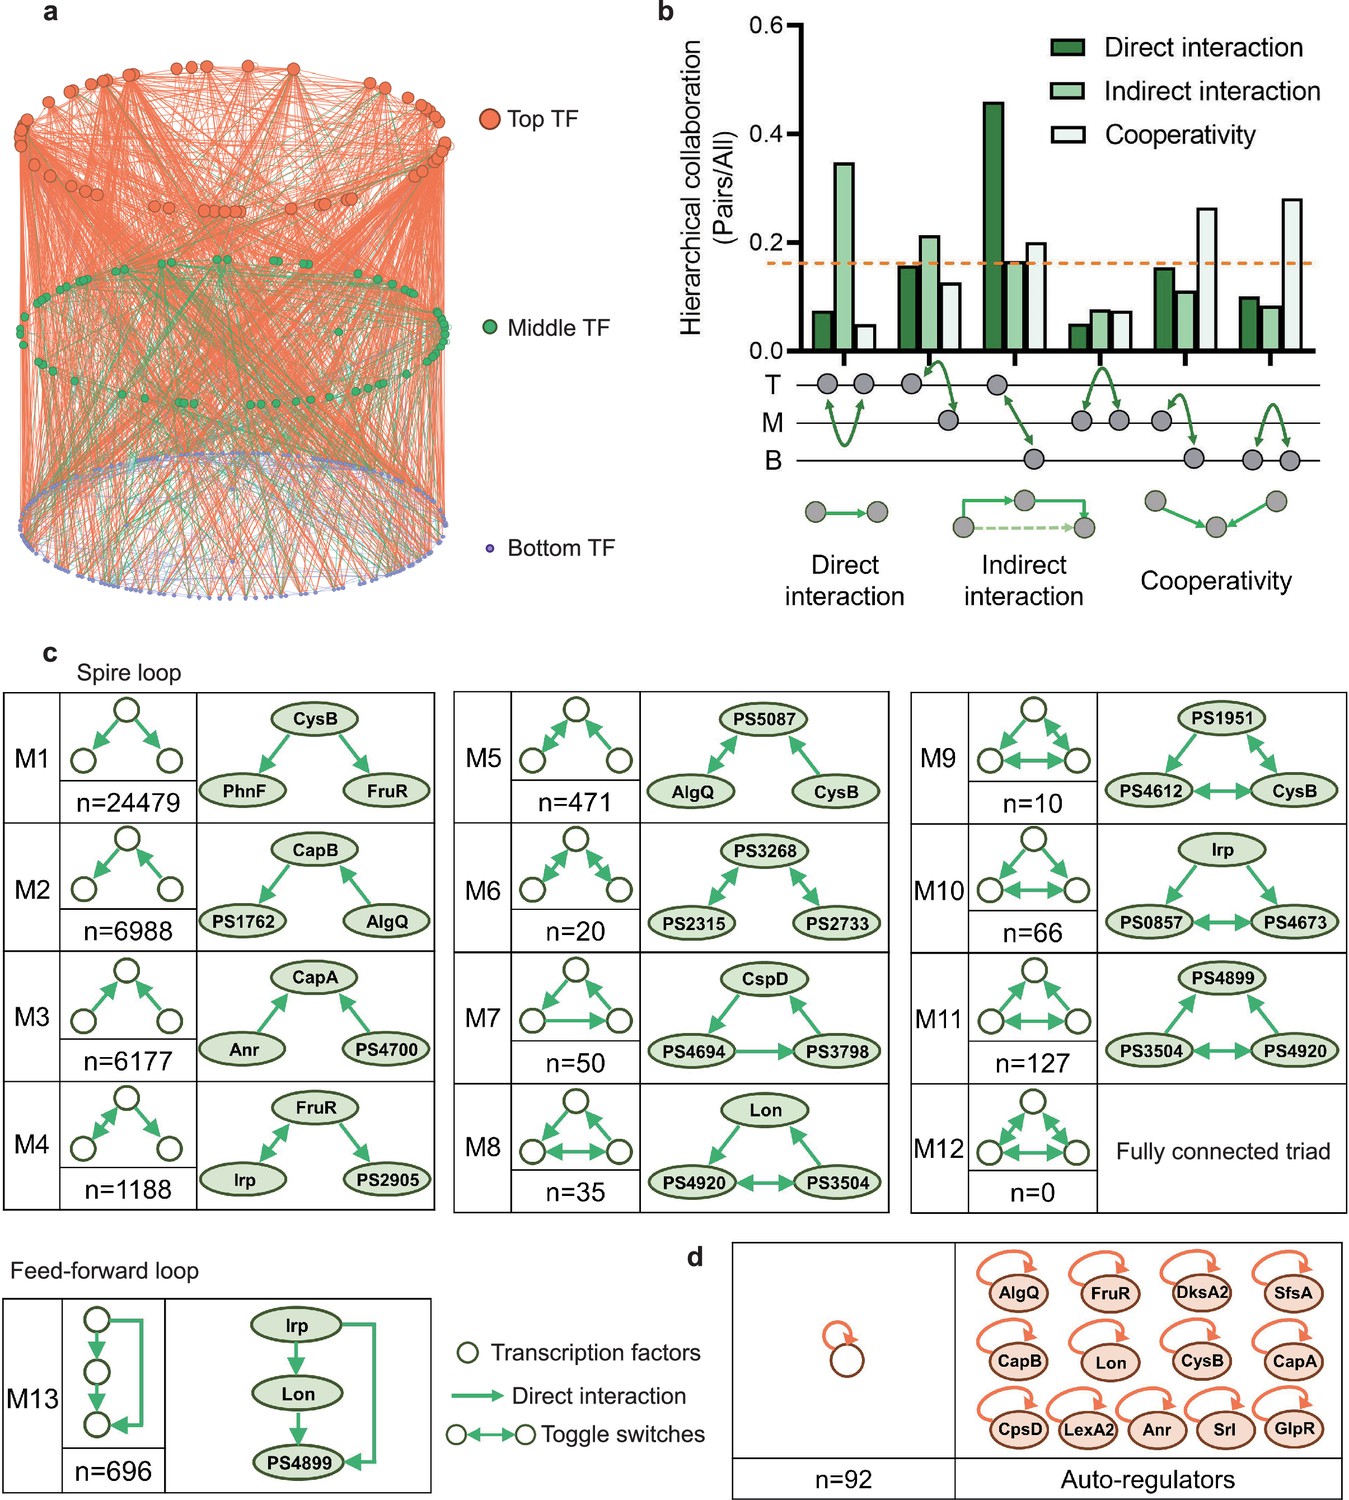
Hierarchical height and collaboration of transcription factors (TFs) reveal the multiple regulatory patterns in Psph 1448A.
(a) Close-up representation of 262 TFs hierarchy in Psph 1448A (8 TFs showed no hierarchical characteristic). Nodes depict TFs. Colours of edges represent source-bases. (b) Enrichment of different collaborating (direct interaction, indirect interaction, and cooperativity) TF pairs at top (T), middle (M), and bottom (B) levels. We defined indirect interaction if two TFs co-associated with one target DNA. Cooperative TF pair was defined if their common target is from a TF. Grey nodes below the graph represent TFs. The dashed orange line indicates the averaged level of collaboration. (c) Thirteen 3-node submodules with the number of occurrences and an example. Spire loop is the most enriched submodule. Edges represent the regulatory direction. (d) Auto-regulations are accompanied by the number of occurrences and 13 auto-regulators as examples.
Figure 1—figure supplement 1
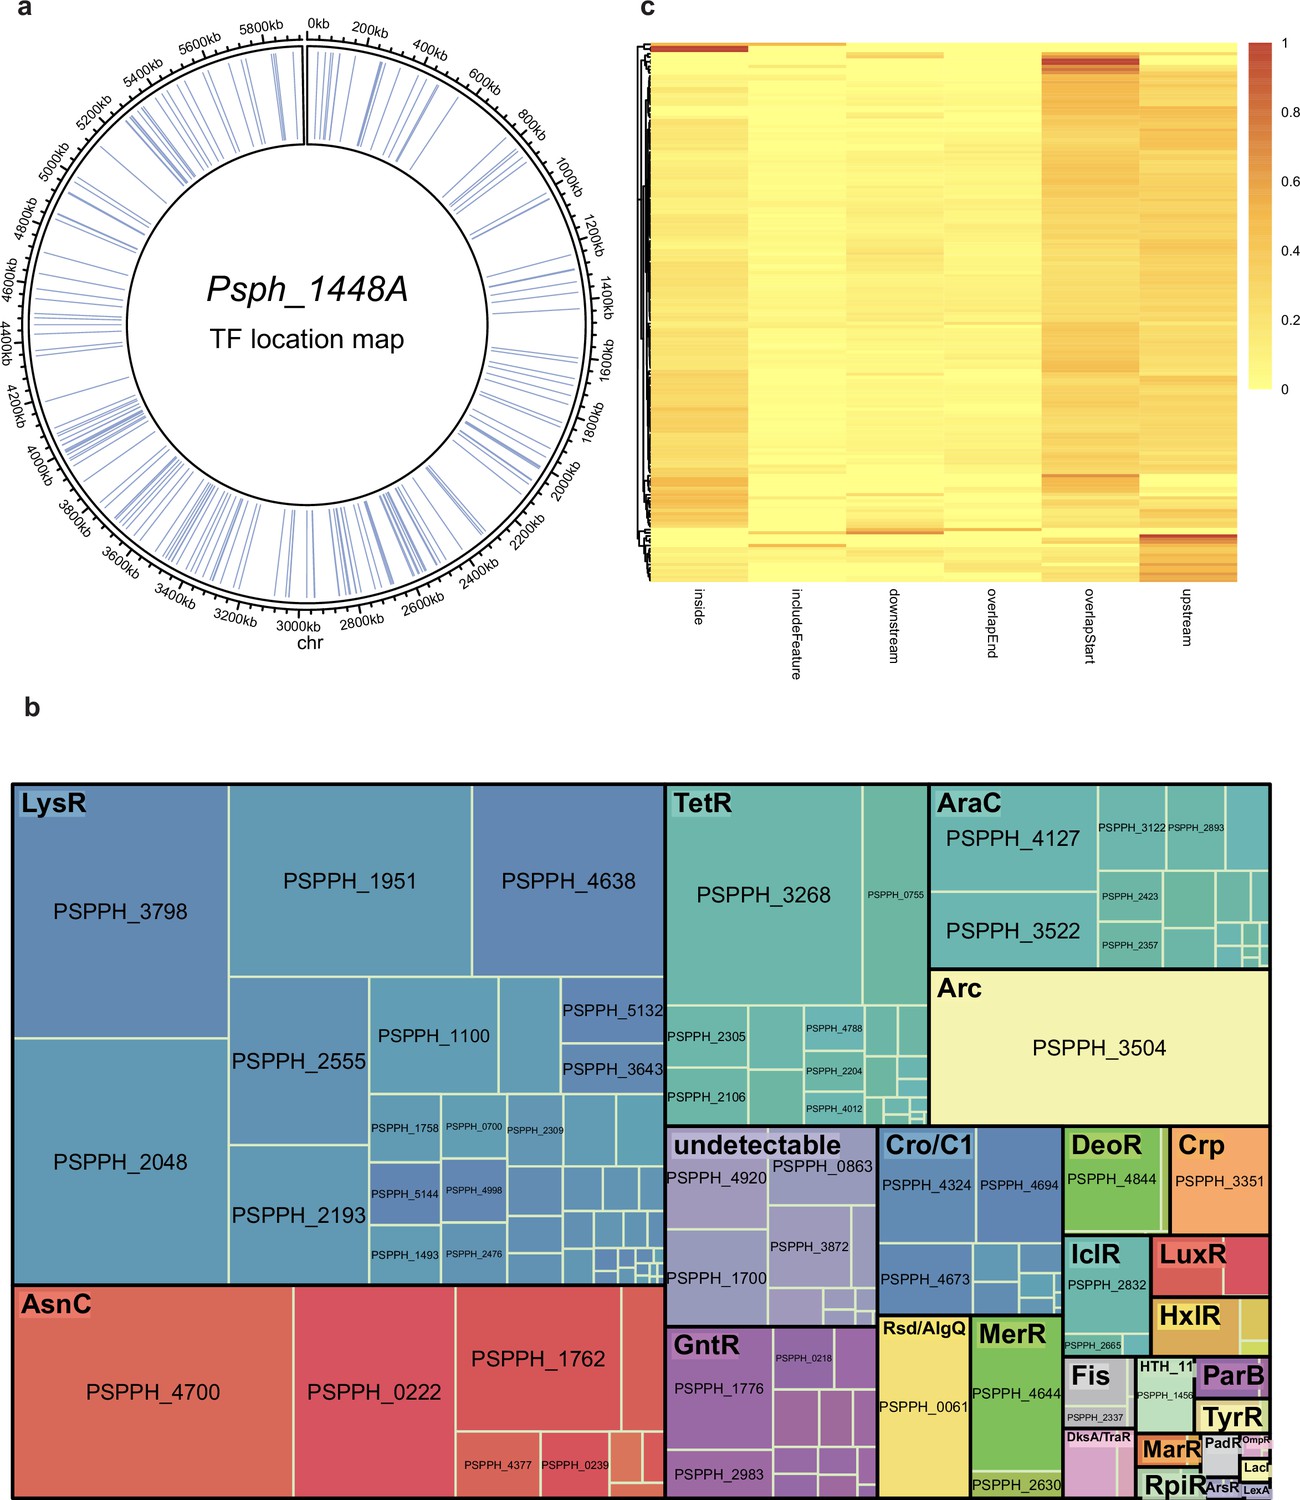
Summary of chromatin immunoprecipitation sequencing (ChIP-seq) results in Psph 1448A.
(a) Locations of all the 301 annotated transcription factors (TFs) in Psph 1448A genome. Blue lines represent the TF loci. (b) ChIPed TFs are classified as respective family with different colours. Square size represents the targeted enrichment of each TF. (c) The preferential enrichment at different genome loci of each ChIPed TF, including upstream, overlapStart, inside, overlapEnd, downstream and includeFeature regions.
Figure 1—figure supplement 2
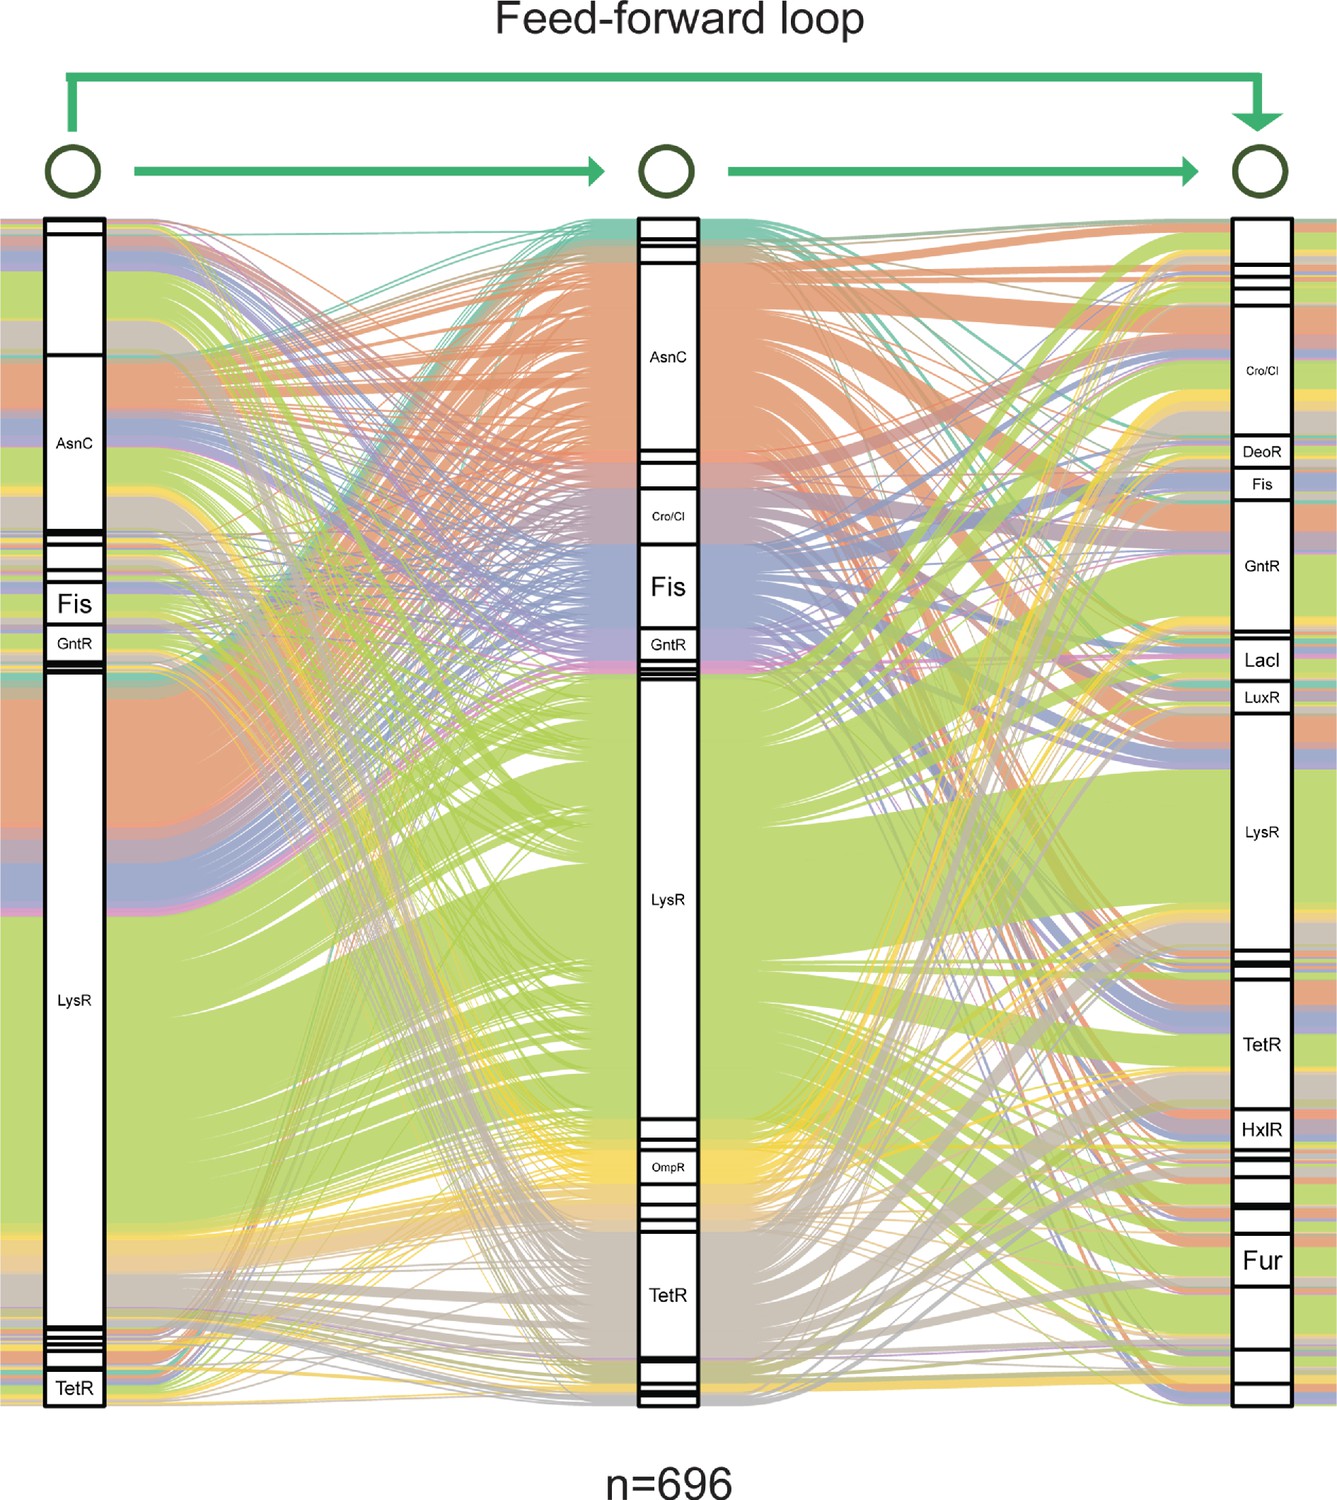
Graph diagram of feedforward loop in Psph 1448A.
Transcription factor (TF) columns in feedforward loop (M13, n=696) are classified as families. TF-TF edges are distinguished with separate colours.
Figure 2 with 3 supplements
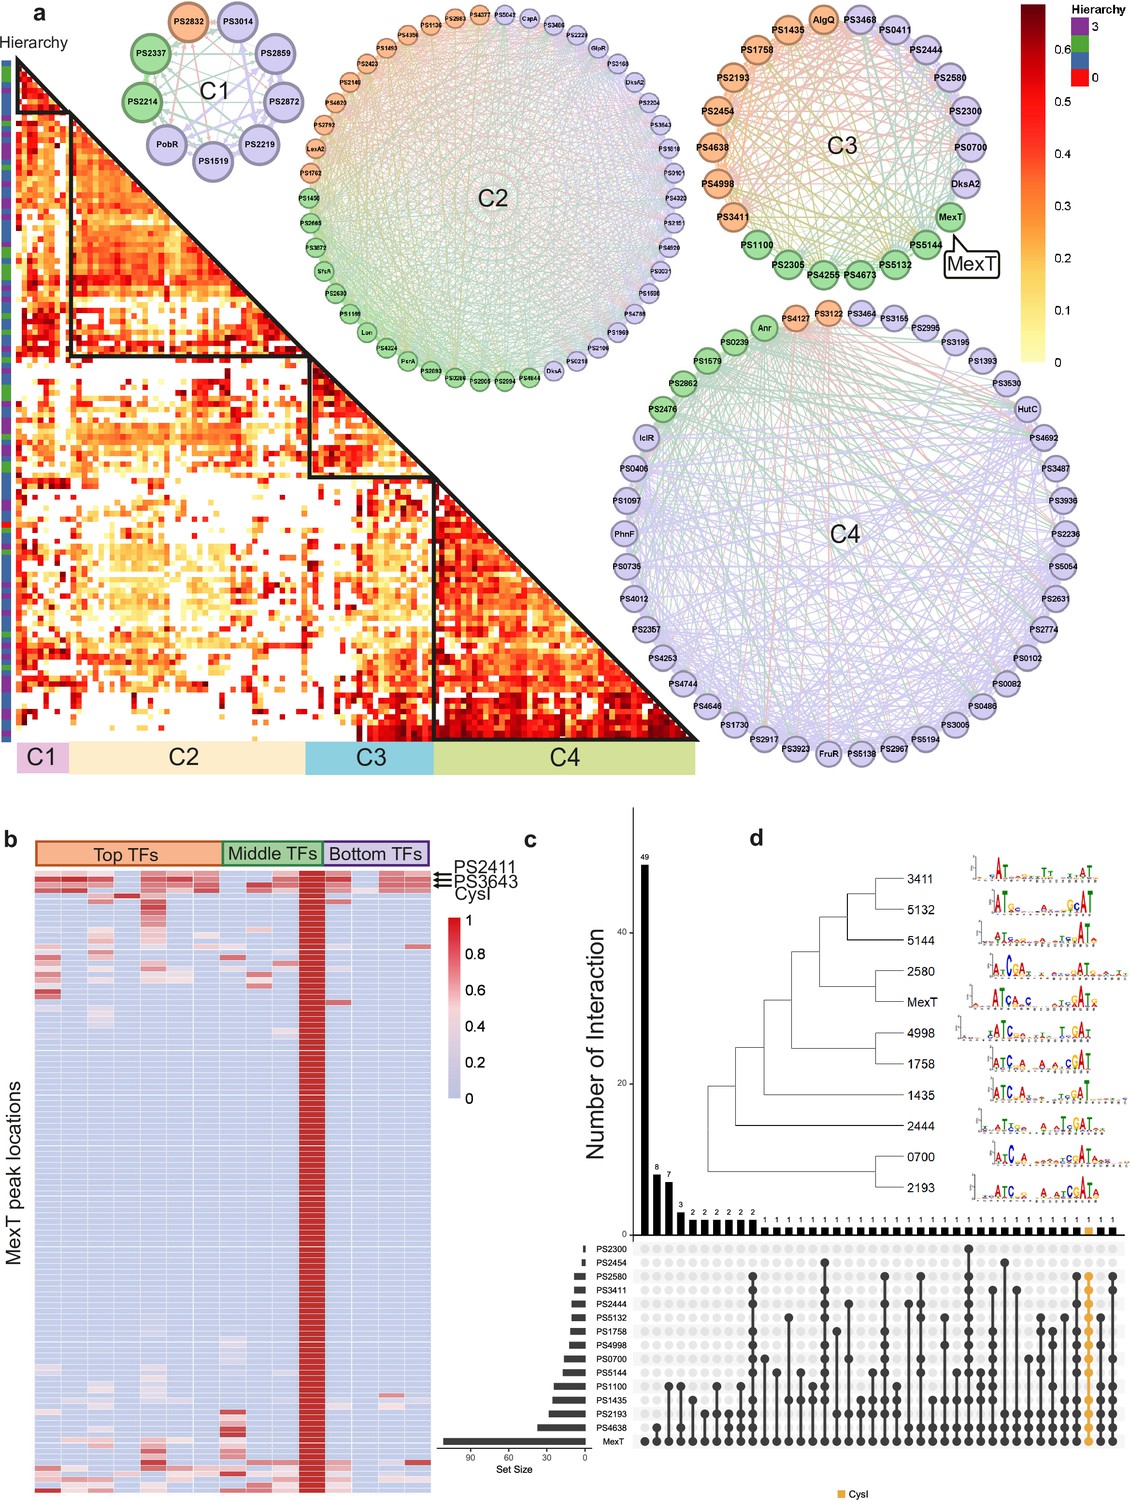
Bottom transcription factors (TFs) share the same binding sequences to coregulate in Psph 1448A.
(a) The co-association map for 170 TFs in Psph 1448A shows the co-associated scores of binding peaks of these TFs (rows) that overlap each TF peak (columns). The three-coloured rectangles represent three different TF levels. C1–C4 represent four clusters of TFs according to the co-associated scores. The TFs in corresponding cluster are shown in the circle diagram. Orange nodes represent top TFs. Green nodes represent middle TFs. Purple nodes represent bottom TFs. The colours of edges are the mixture of two-source TF colours. (b) The heat-map of MexT indicates the associated scores of binding peaks of TFs in C3 (columns) that overlap the binding peaks (rows) of MexT. PSPPH2411, PSPPH3643, and CysI are the top 3 TFs with high associated scores. (c) UpSet plot shows the number of genes uniquely targeted TFs or co-targeted by multiple TFs in C3. The vertical black lines represent shared TF-binding sites. The y axis represents the number of overlapped binding sites across the linked TFs. The x axis represents the number of binding sites for each TF. Orange line represents the most enriched gene cysI that is co-targeted by 12 TFs in C3. (d) Motifs of MexT and other 10 TFs in C3 which show similar binding sequences.
Figure 2—figure supplement 1
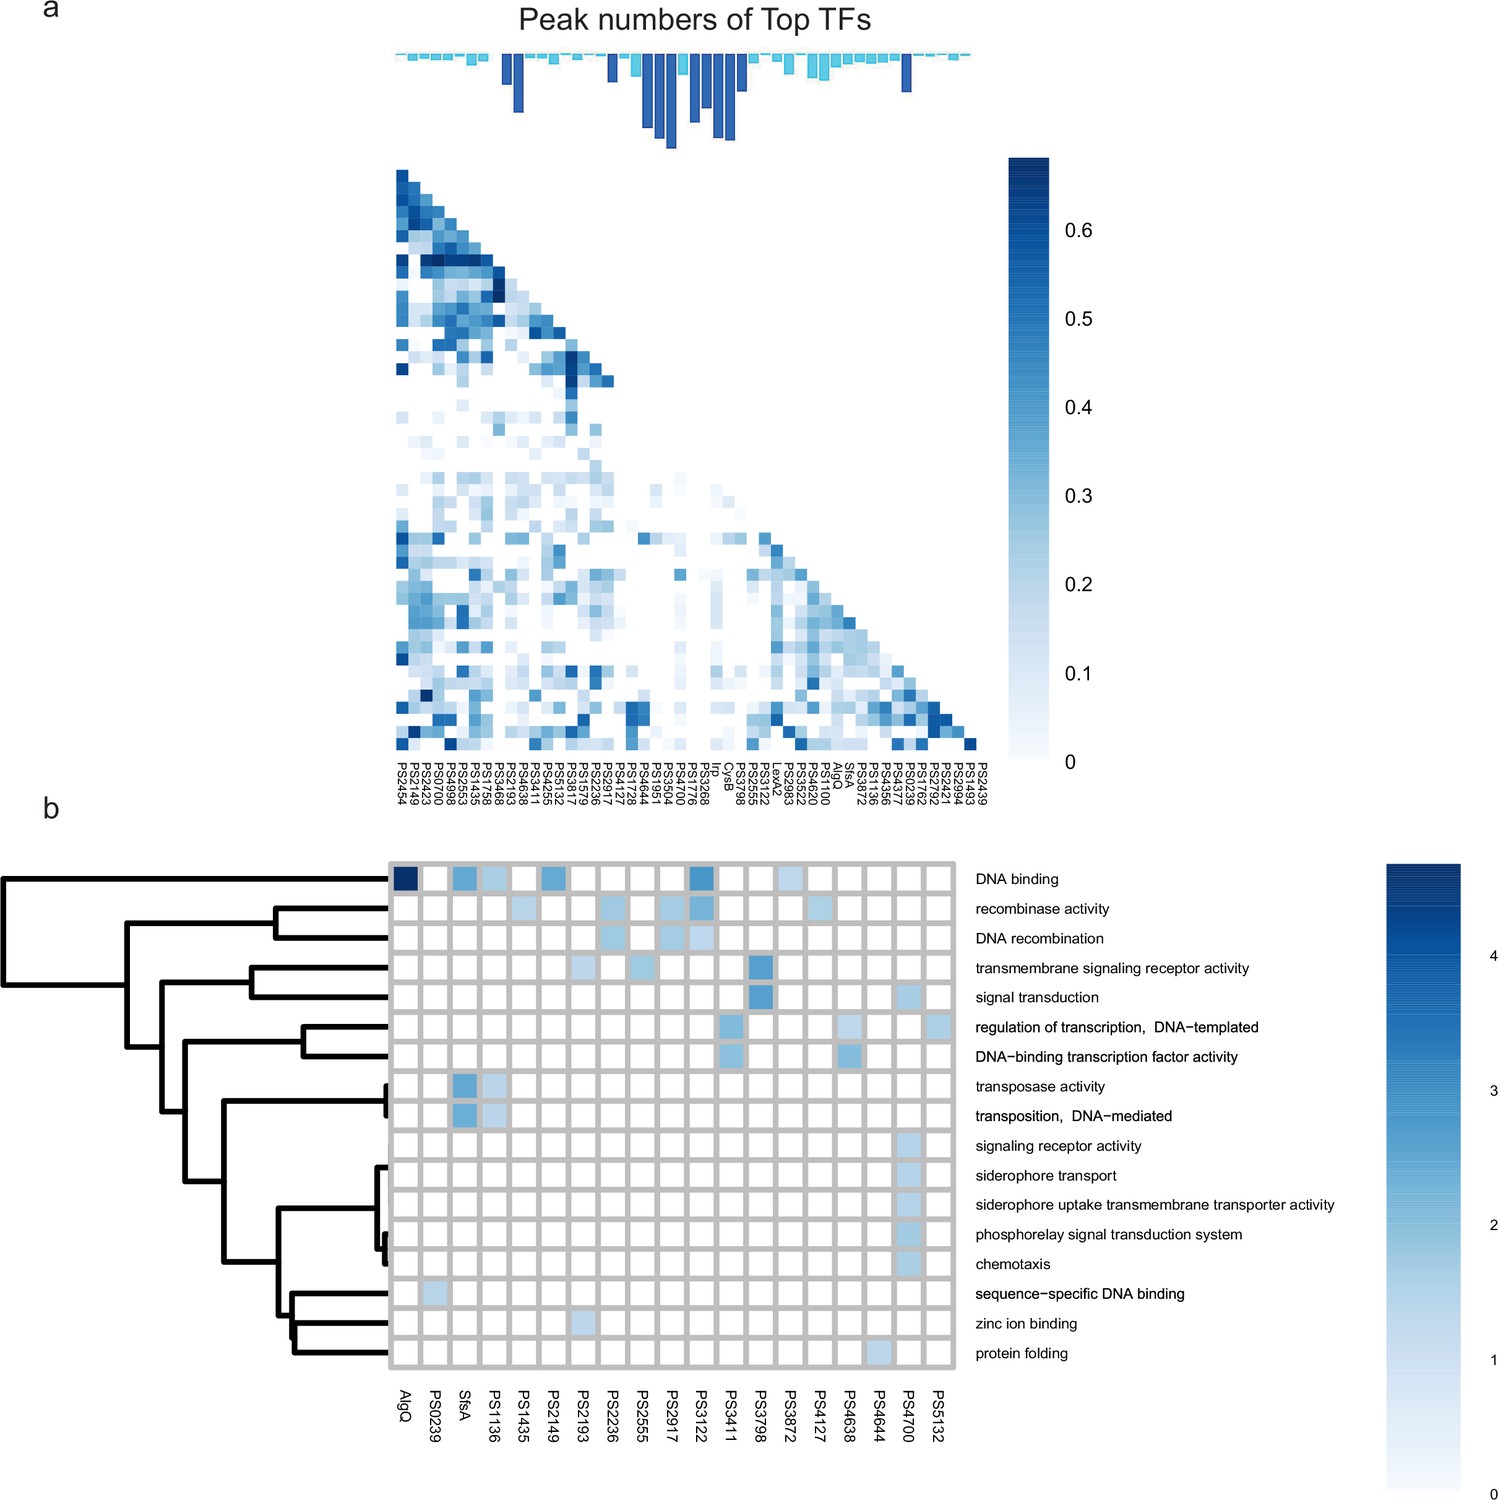
Co-association and virulence-related functional category of transcription factors (TFs) at top level.
(a–b) The co-associated map and functional category of top TFs. The peak number of top TFs is shown at upper, corresponding to the TFs in the lower map. Functional enrichment analysis was performed by hypergeometric test (BH-adjusted p<0.05).
Figure 2—figure supplement 2
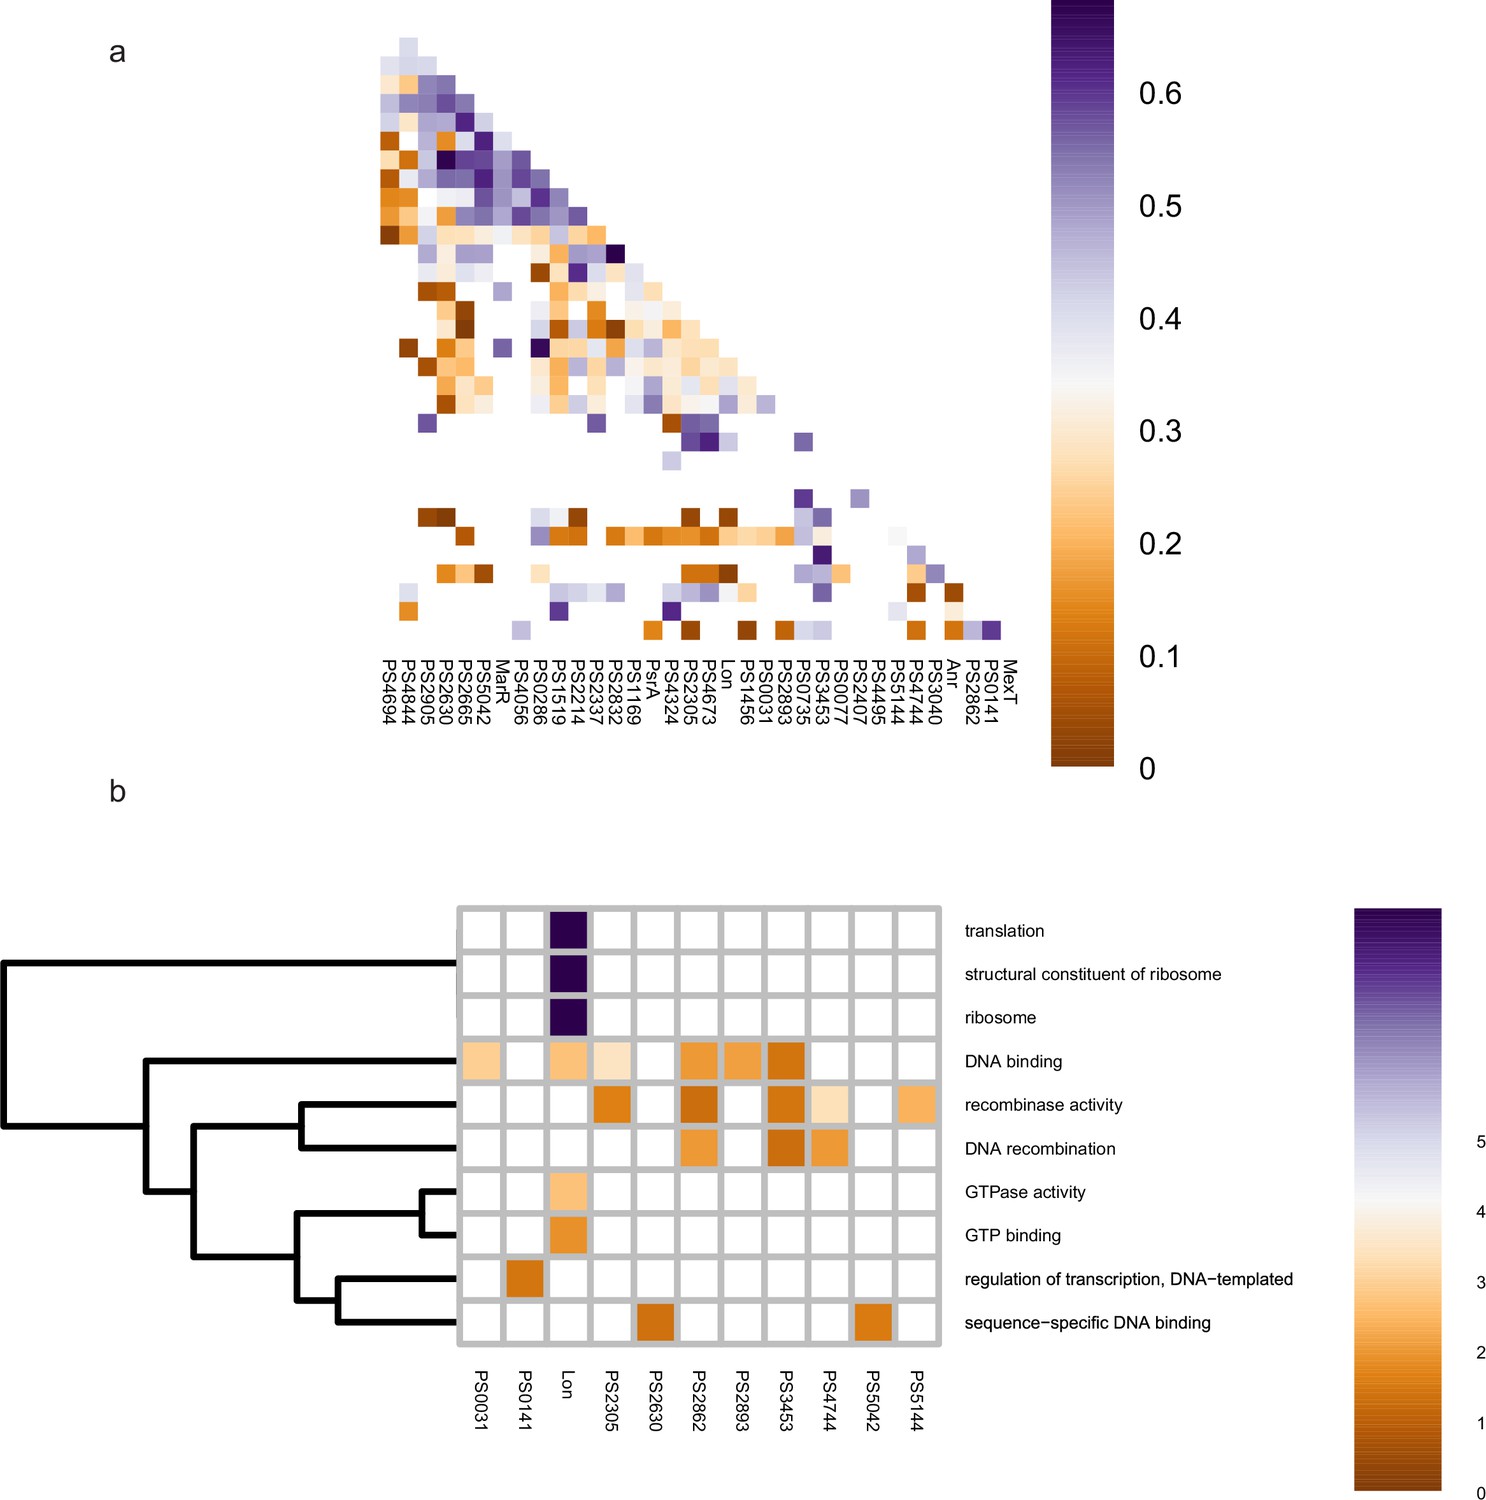
Co-association and virulence-related functional category of transcription factors (TFs) at middle level.
(a–b) The co-associated map and functional category of middle TFs. The peak number of middle TFs is shown at upper, corresponding to the TFs in the lower map. Functional enrichment analysis was performed by hypergeometric test (BH-adjusted p<0.05).
Figure 2—figure supplement 3
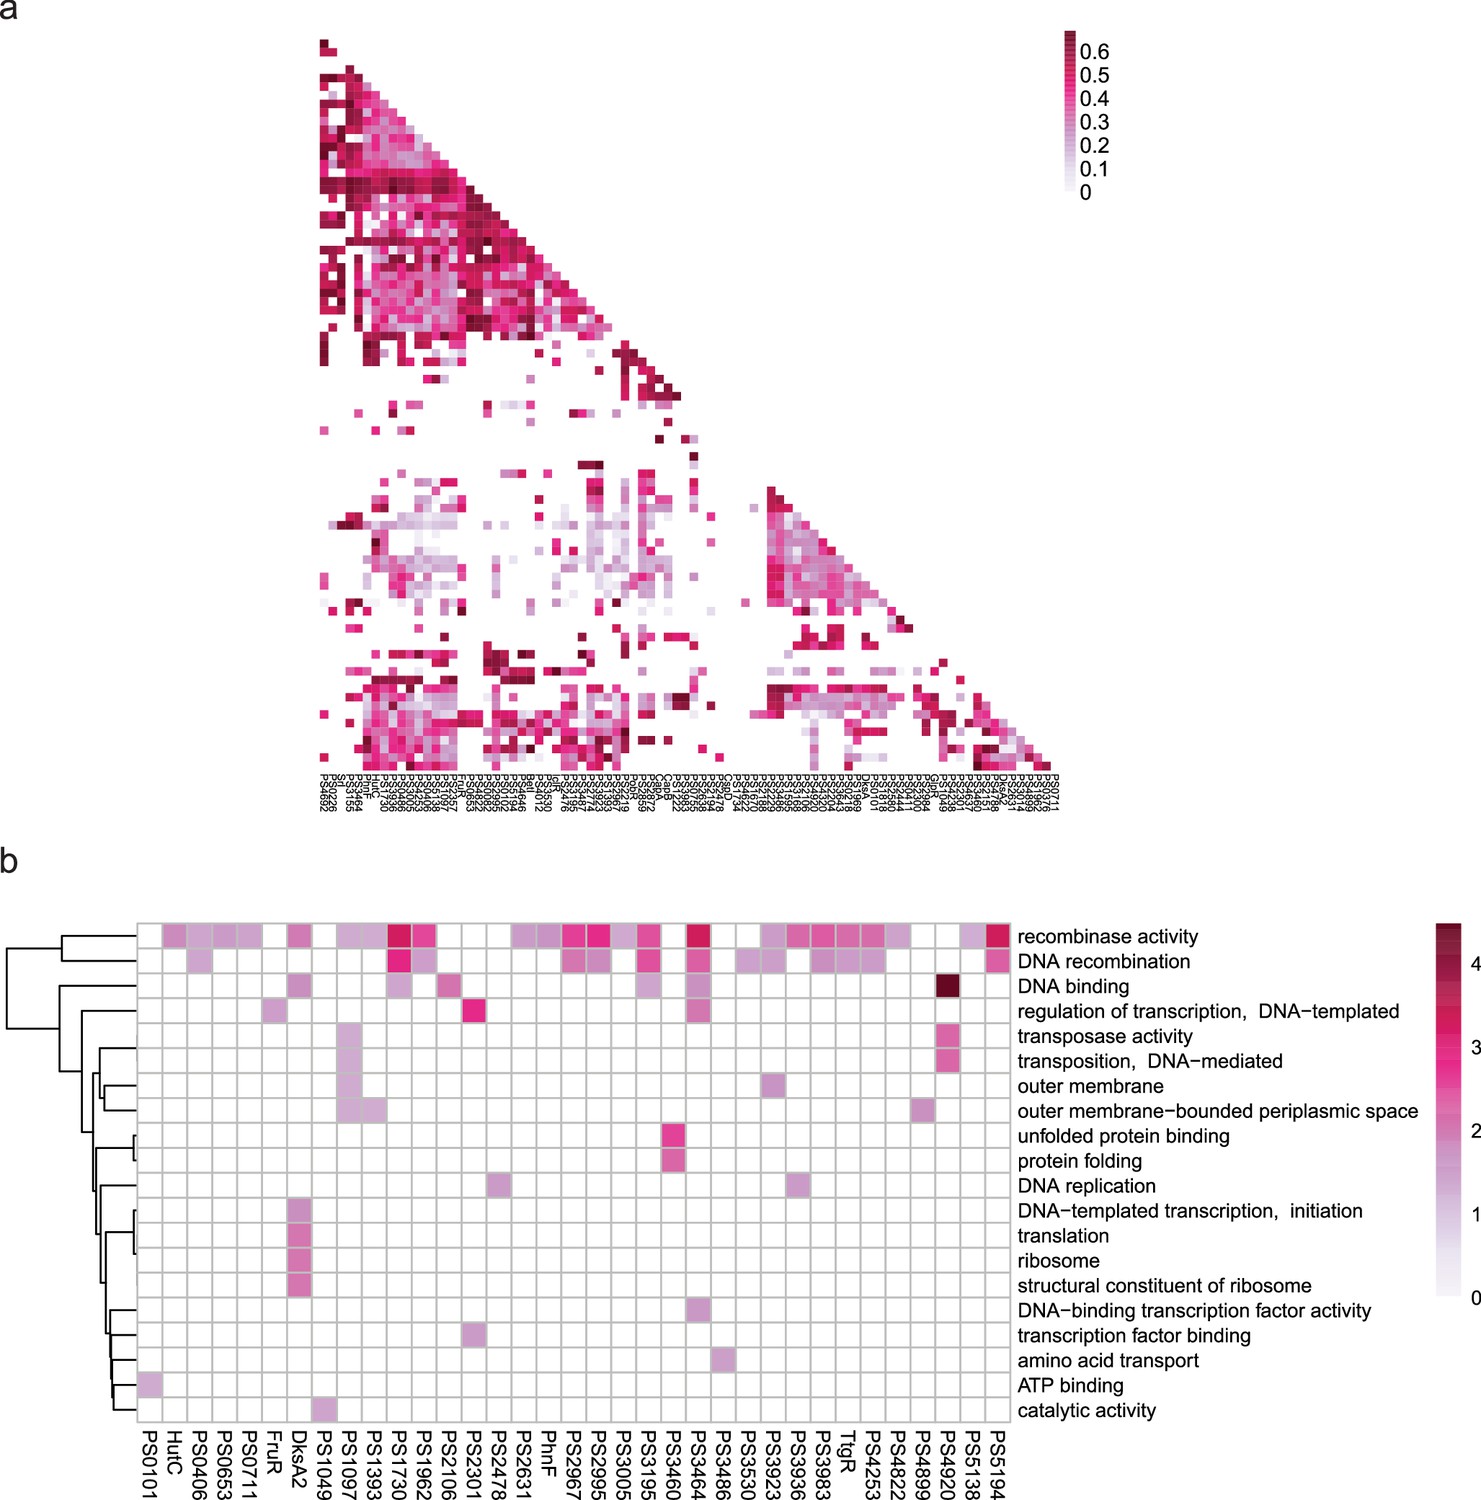
Co-association and virulence-related functional category of transcription factors (TFs) at bottom level.
(a–b) The co-associated map and functional category of bottom TFs. The peak number of bottom TFs is shown at upper, corresponding to the TFs in the lower map. Functional enrichment analysis was performed by hypergeometric test (BH-adjusted p<0.05).
Figure 3 with 1 supplement
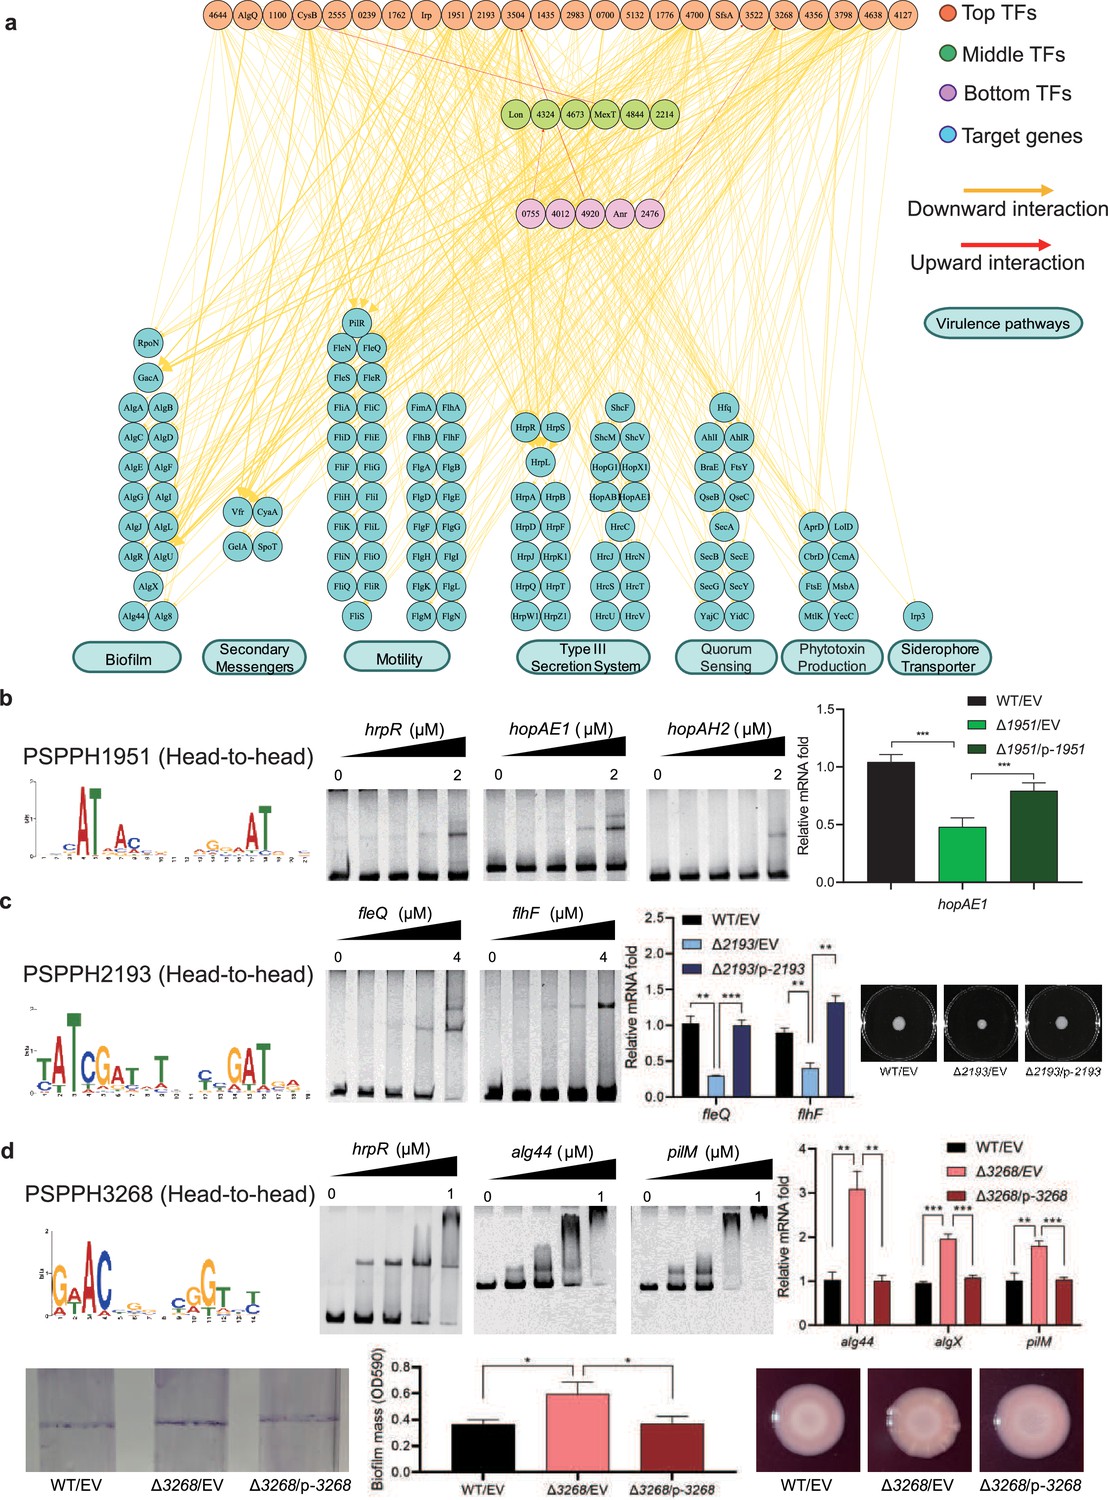
Virulence hierarchical regulatory network reveals 35 transcription factors (TFs) involved in virulence.
(a) Virulence hierarchical regulatory network shows the TF hierarchy and the large pool of target genes of multi-TF. Target genes are related with seven key virulence pathways, including biofilm formation, secondary messengers, motility, T3SS, quorum sensing (QS), phytotoxin production, and siderophore transporter. Orange nodes represent top TFs. Green nodes represent middle TFs. Purple nodes represent bottom TFs. Blue nodes represent target genes. Yellow edges represent downward point. Red edges represent upward point. (b) The head-to-head binding motif of PSPPH1951, the validation of the binding sites of PSPPH1951 by electrophoretic mobility shift assay (EMSA), and the detection of expression of target gene hopAE1 in wild-type (WT), ∆PSPPH1951, and complementary strain by real-time quantitative PCR (RT-qPCR). The validated binding sites are from the promoters of the hrpR, hopAE1, and hopAH2. (c) The binding motif of PSPPH2193 is head-to-head. EMSA confirms the direct binding of PSPPH2193 to the promoters of fleQ and flhF. RT-qPCR confirms the positive regulation of PSPPH2193 on the expression of fleQ and flhF. Motility assay validates the weaker motility of ∆PSPPH2193 than WT and complementary strain. (d) The binding motif of PSPPH3268 is head-to-head. EMSA confirms the direct binding of PSPPH3268 to the promoters of hrpR, alg44, and pilM. RT-qPCR confirms the negative regulation of PSPPH3268 on the expression of alg44, algX, and pilM. Crystal violate staining assay and the quantification of biofilm formation validate the negative regulation of PSPPH3268 on the biofilm formation. Congo red assay confirms the negative regulation of PSPPH3268 on colony morphologies and extracellular polysaccharide (EPS) production. Student’s t-test. n.s., not significant, *p≤0.05, **p≤0.01, and ***p≤0.001.
-
Figure 3—source data 1
PDF file containing original electrophoretic mobility shift assay (EMSA), motility, biofilm, and extracellular polysaccharides (EPS) detection for Figure 3b–d, indicating the relevant binding and phenotypes.
- https://cdn.elifesciences.org/articles/96172/elife-96172-fig3-data1-v1.zip
-
Figure 3—source data 2
Original electrophoretic mobility shift assay (EMSA) gels and photos for EMSA, motility, biofilm, and extracellular polysaccharides (EPS) detection displayed in Figure 3b–d.
- https://cdn.elifesciences.org/articles/96172/elife-96172-fig3-data2-v1.zip
Figure 3—figure supplement 1
The validation of the binding sites of virulence-related transcription factors (TFs) in Psph 1448A.
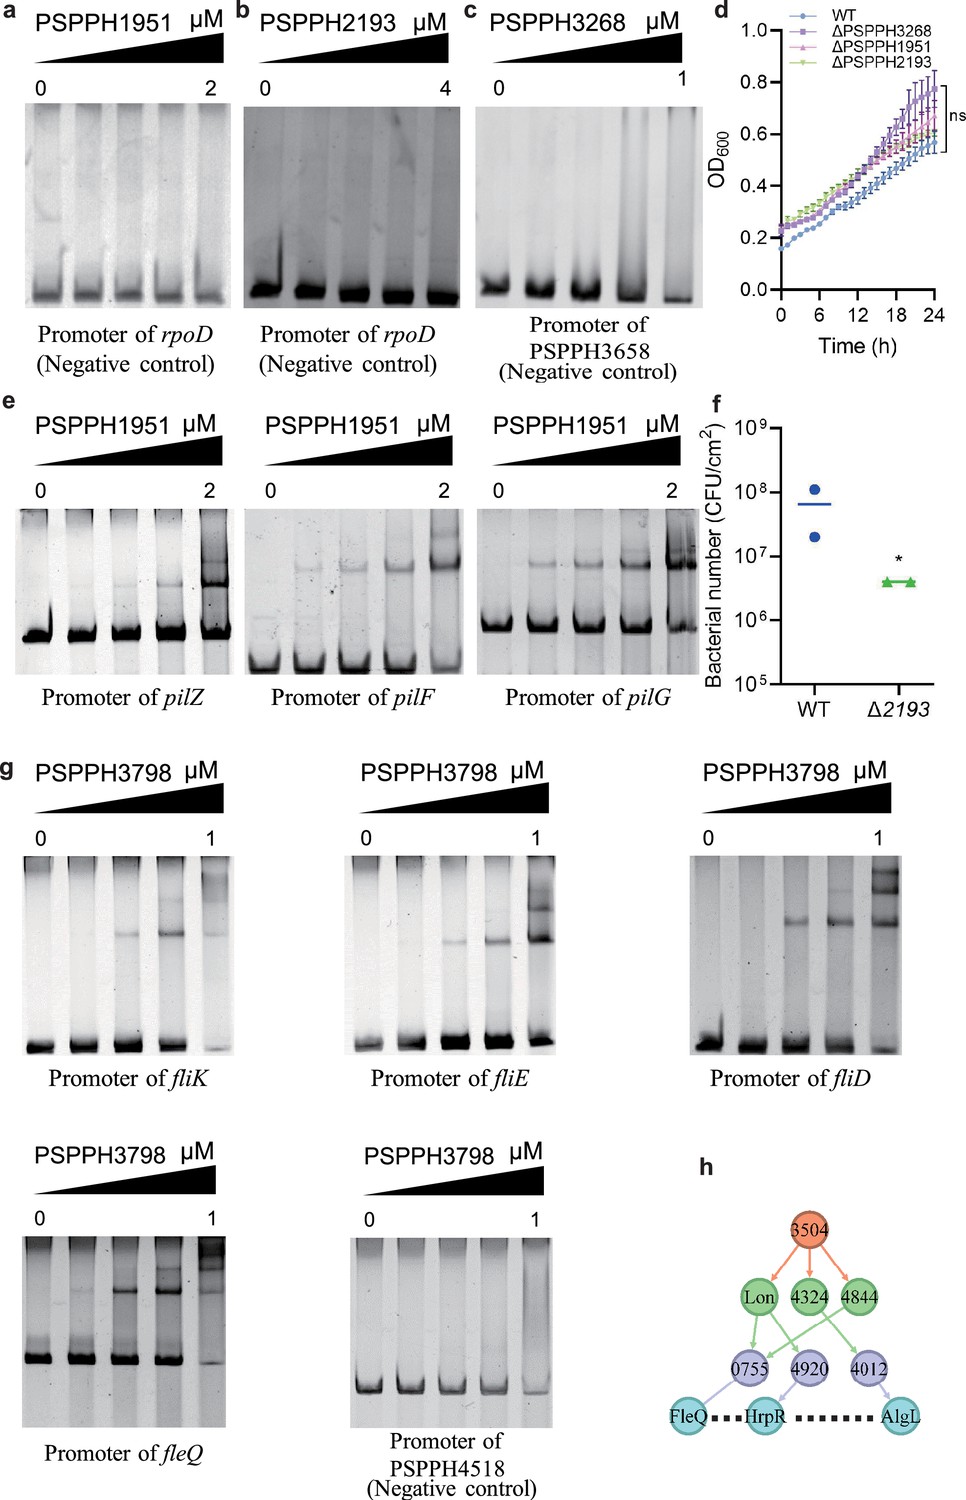
(a–c) The promoter of rpoD is the negative control of PSPPH1951 and PSPPH2193. The promoter of PSPPH3658 is the negative control of PSPPH3268. (d) Growth curve of three TF mutants. (e) The validation of binding sites of PSPPH1951. The validated binding sites are from the promoters of pilZ, pilF, and pilG. (f) Bacterial number (colony-forming units [CFUs]) of Δ2193 strain on the bean leaf surface after dip inoculation. *p<0.05. Results were indicated as mean ± SD. All experiments were repeated at least three times. (g) The validation of binding sites of PSPPH3798. The validated binding sites are from the promoters of fliK, fliE, fliD, and fleQ. The promoter of PSPPH2263 is the negative control. (h) A regulatory cascade of PSPPH3504. / means sibling nodes. – means downward regulation.
-
Figure 3—figure supplement 1—source data 1
PDF file containing original electrophoretic mobility shift assay (EMSA) for Figure 3-figure supplement 1a–c, e, and g.
- https://cdn.elifesciences.org/articles/96172/elife-96172-fig3-figsupp1-data1-v1.zip
-
Figure 3—figure supplement 1—source data 2
Original electrophoretic mobility shift assay (EMSA) gels corresponding to Figure 3-figure supplement 1a–c, e, and g.
- https://cdn.elifesciences.org/articles/96172/elife-96172-fig3-figsupp1-data2-v1.zip
Figure 4 with 2 supplements
Hundreds of transcription factors (TFs) are identified to participate in metabolic pathways.
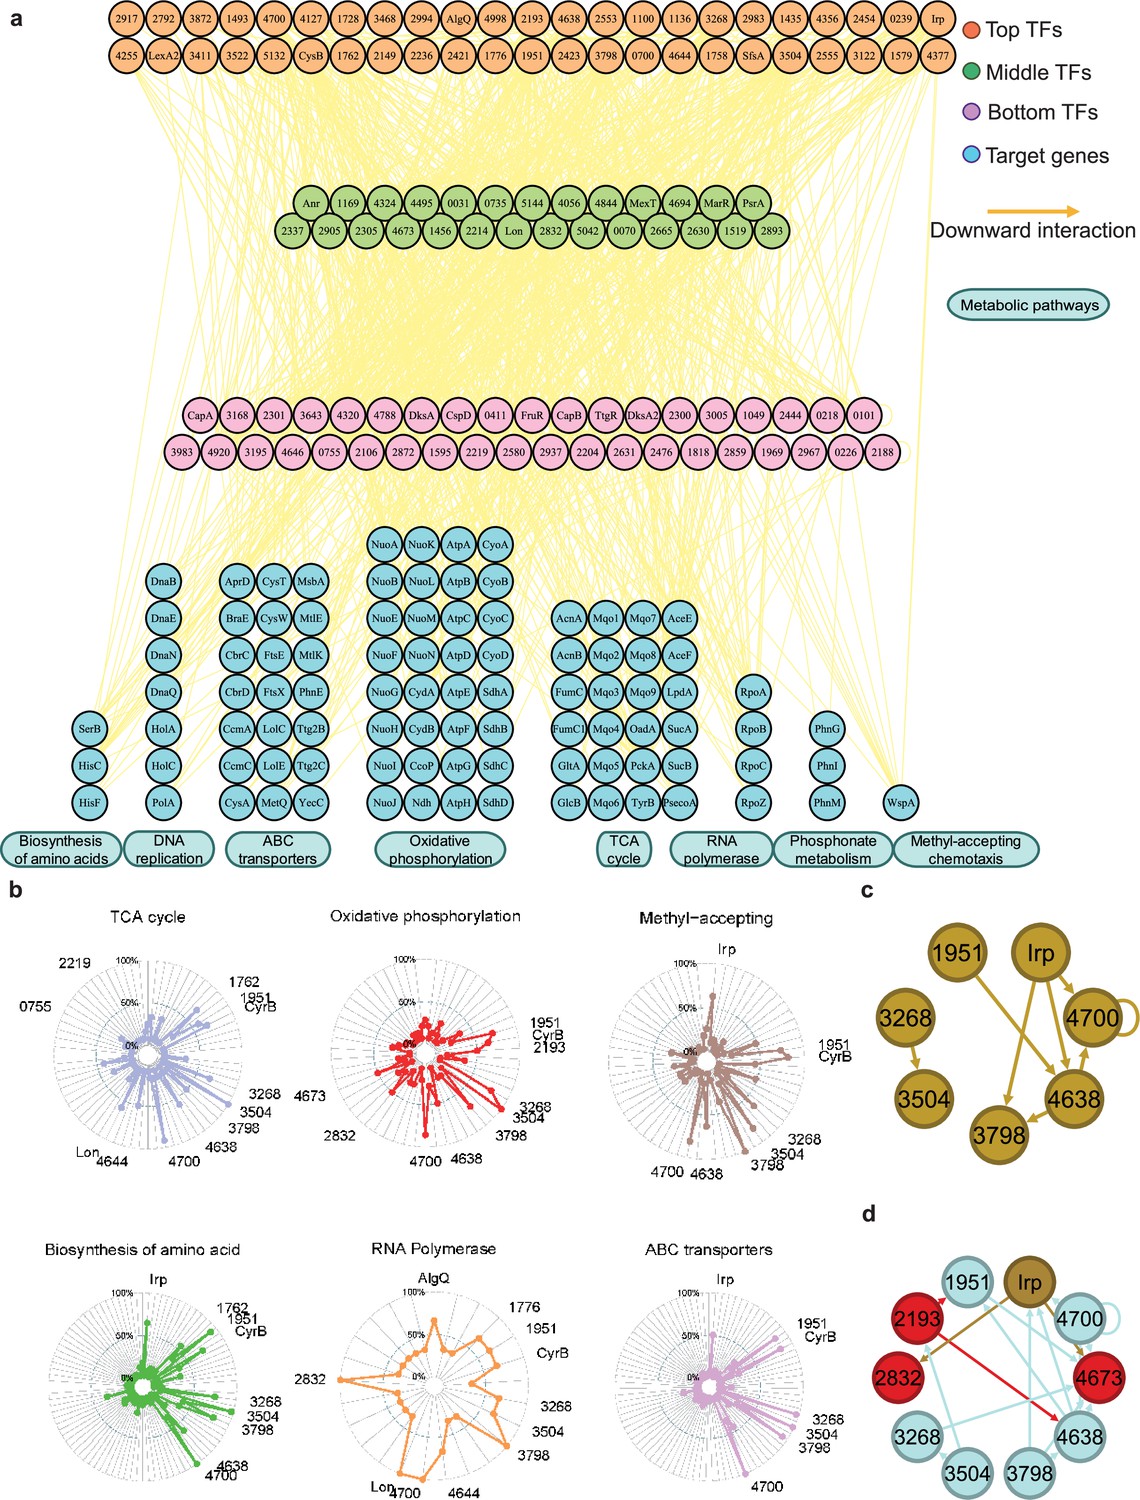
(a) Metabolic hierarchical regulatory network shows the TF hierarchy and the large pool of target genes of multi-TF. Target genes are related with eight key metabolic pathways, including biosynthesis of amino acids, DNA replication, ATP-binding cassette (ABC) transporter, oxidative phosphorylation, tricarboxylic acid (TCA) cycle, RNA polymerase, phosphonate metabolism, and methyl-accepting chemotaxis. Orange nodes represent top TFs. Green nodes represent middle TFs. Purple nodes represent bottom TFs. Blue nodes represent target genes. Yellow edges represent the direct interaction. (b) Radar plots show the putative key regulators identified in six different metabolic pathways, including TCA cycle, oxidative phosphorylation, methyl-accepting, biosynthesis of amino acids, RNA polymerase, and ABC transporter. Each radiation line represents a key regulator, and the radial length of the thick coloured line is the rate of target genes to the associated genes, representing the significance of the enrichment of the TF-target genes within each pathway. (c) TFs involved in the methyl-accepting pathway bound to the promoters of TFs in the same category. Brown nodes represent the TFs that are responsible for methyl-accepting pathway. The brown arrows point to the targeted TFs. (d) TFs involved in the oxidative phosphorylation pathway bind to the promoters of TFs in the methyl-accepting pathway. Red nodes represent the TFs that are responsible for oxidative phosphorylation pathway. Brown nodes represent the TFs that are responsible for methyl-accepting pathway. Blue nodes represent the TFs involved in these two pathways. The arrows point to the targeted TFs and the arrow colours are source-based.
Figure 4—figure supplement 1
Metabolic functional category of transcription factors (TFs) at three different levels.
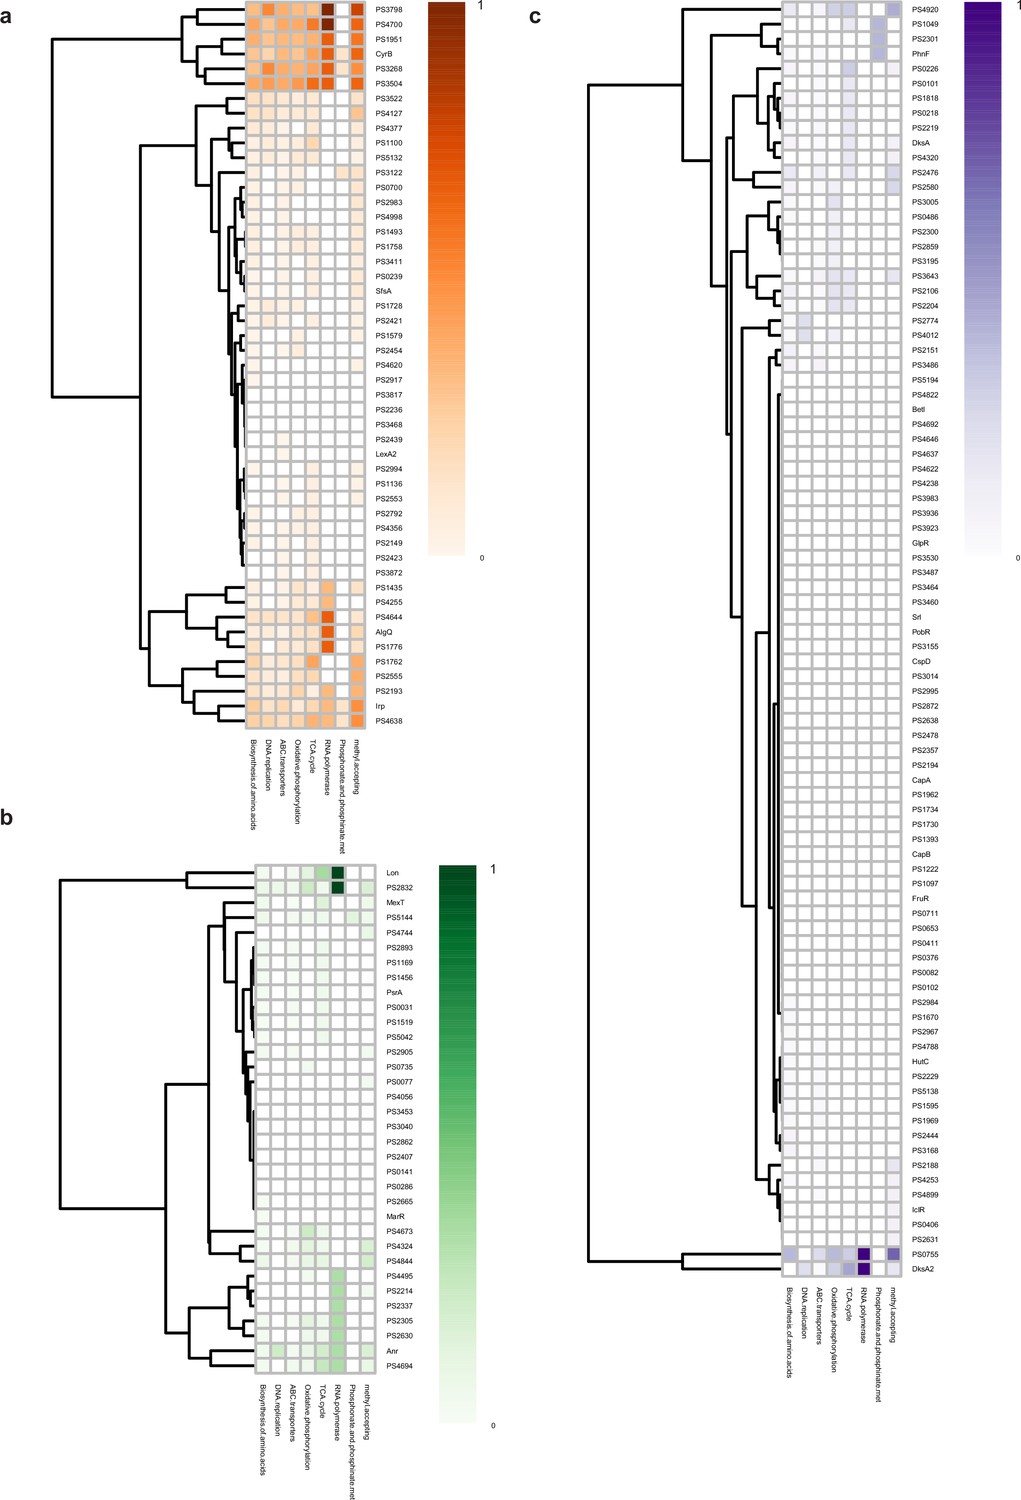
(a–c) Functional category according to different metabolic pathways of top (a), middle (b), and bottom (c) TFs.
Figure 4—figure supplement 2

Key transcription factors (TFs) in different metabolic pathways.
(a) Radar plots show the putative key regulators identified in two different metabolic pathways, including DNA replication, and phosphonate and phosphonate metabolism. Each radiation line represents a key regulator, and the radial length of the thick coloured line is the rate of target genes to the associated genes, representing the significance of the enrichment of the TF-target genes within each pathway. (b) The monomer motif of PSPPH0755 and the validation of the binding sites of PSPPH0755 by electrophoretic mobility shift assay (EMSA). The validated binding sites are from promoters of PSPPH5210 and PSPPH3109. The promoter of PSPPH4598 is negative control. (c) The head-to-head motif of PSPPH3798 and the validation of the binding sites of PSPPH3798 by EMSA. The validated binding sites are from promoters of PSPPH3881 and PSPPH5119. (d) The monomer motif of PSPPH4638 and the validation of the binding sites of PSPPH4638 by EMSA. The validated binding sites are from promoters of PSPPH3881 and PSPPH0550. The promoter of PSPPH4117 is the negative control.
-
Figure 4—figure supplement 2—source data 1
PDF file containing original electrophoretic mobility shift assay (EMSA) for Figure 4-figure supplement 2b–d.
- https://cdn.elifesciences.org/articles/96172/elife-96172-fig4-figsupp2-data1-v1.zip
-
Figure 4—figure supplement 2—source data 2
Original electrophoretic mobility shift assay (EMSA) gels corresponding to Figure 4-figure supplement 2b–d.
- https://cdn.elifesciences.org/articles/96172/elife-96172-fig4-figsupp2-data2-v1.zip
Figure 5 with 2 supplements
Various conservations are observed in transcription factors (TFs) between different P. syringae pathovars.
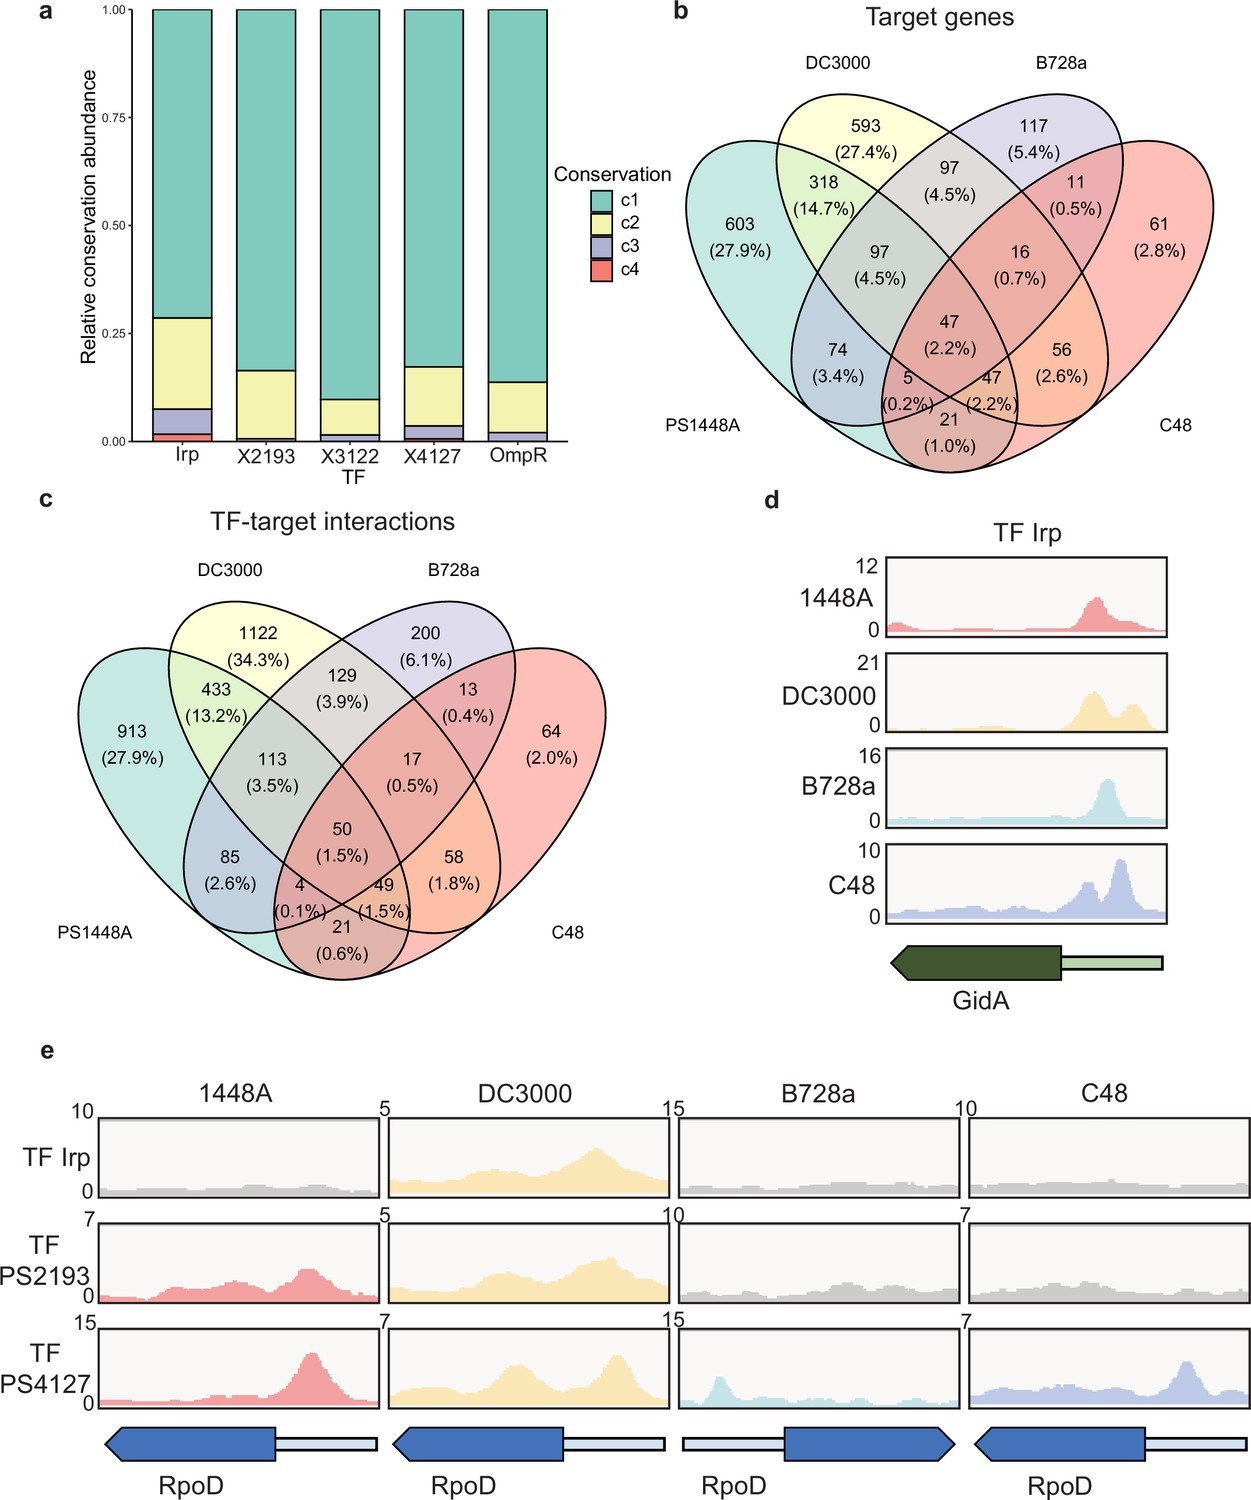
(a) Proportion of the TF-target genes detected in one, two, three, or four tested genomes. C1–C4 represent the conservation of targets in one, two, three, and four strains. (b–c) Repartition of the total pool of target genes (b) or TF-target interactions (c) in four tested strains. (d) Enrichment coverage tracks of chromatin immunoprecipitation sequencing (ChIP-seq) against negative controls for TF Irp with binding sites on the promoter of gidA in all four genomes. (e) Enrichment coverage tracks of ChIP-seq against negative controls (grey tracks) for the three TFs (Irp, PSPPH2193, and PSPPH4127) with binding sites on the promoter of rpoD in four tested strains.
Figure 5—figure supplement 1
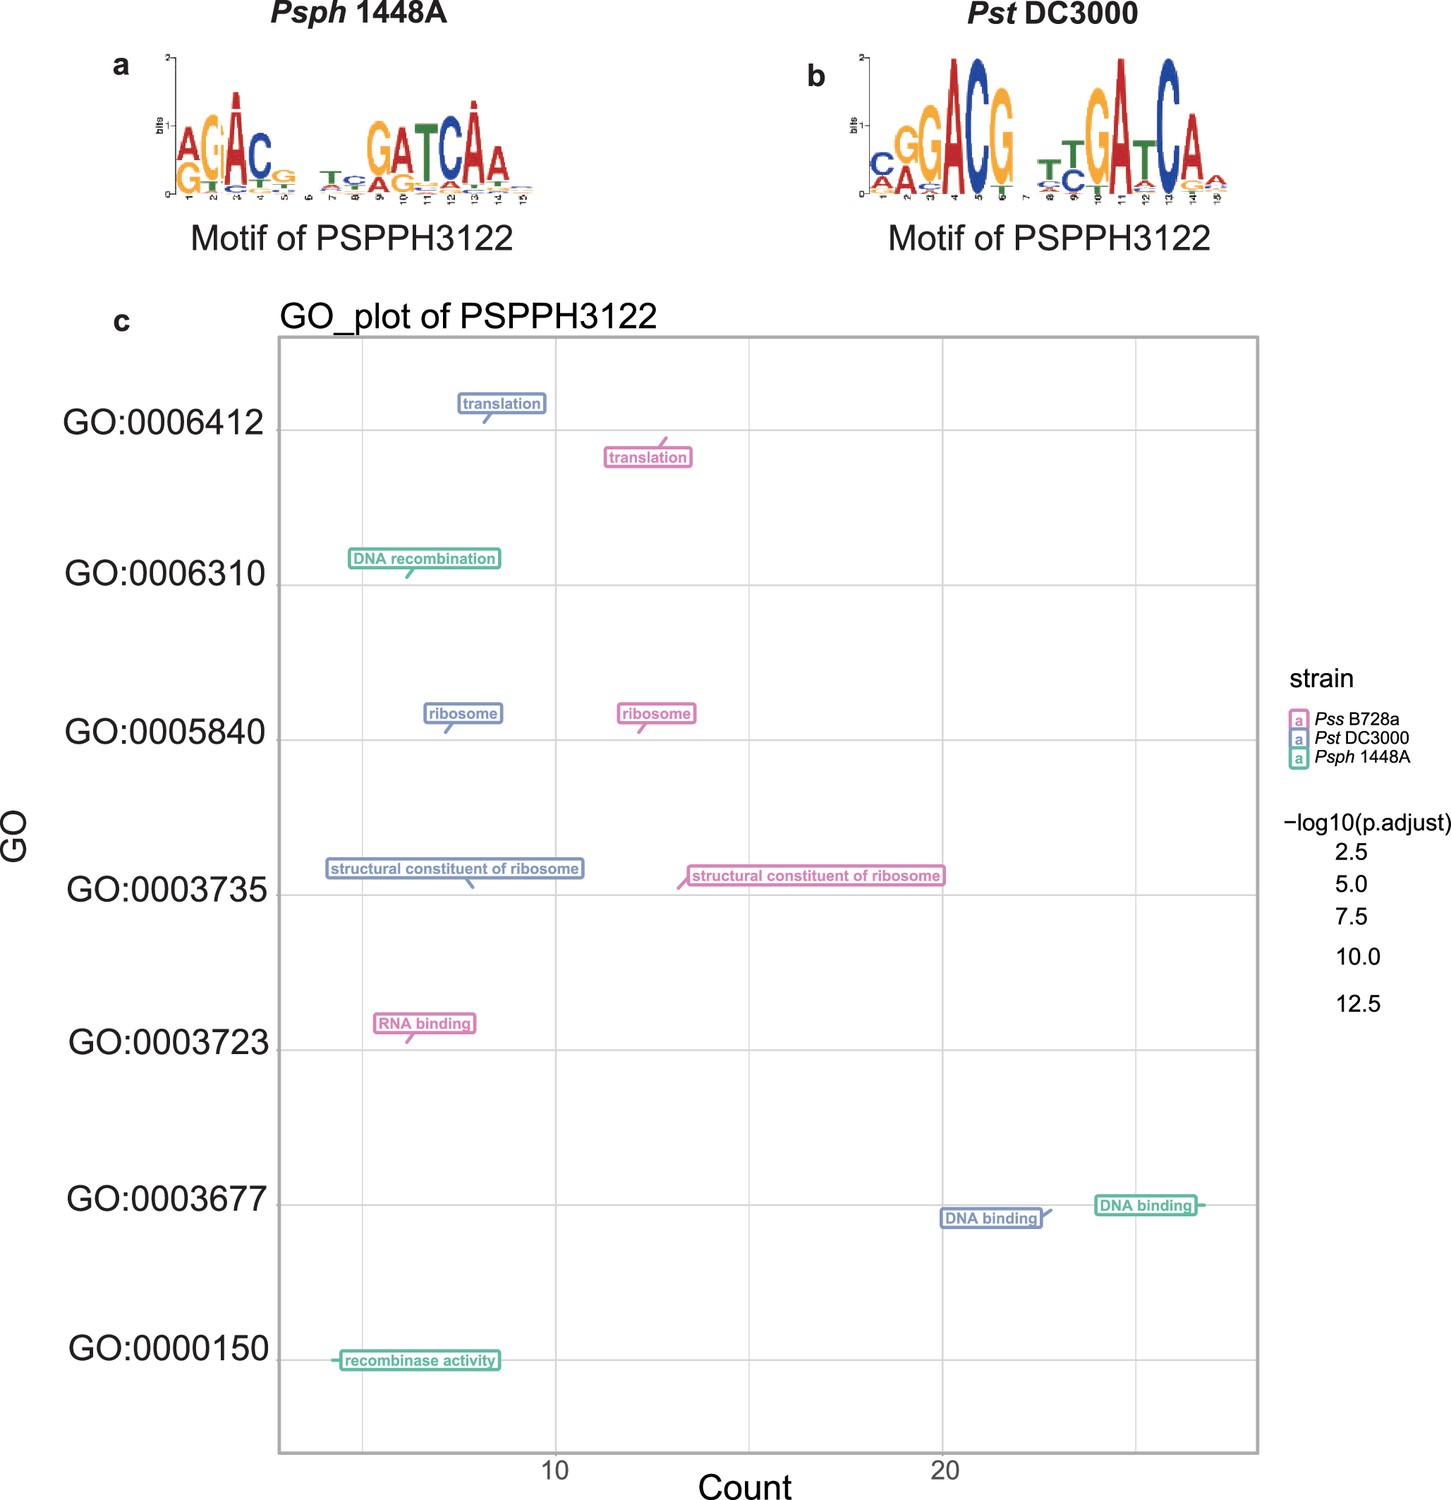
Motif and functional enrichment analysis of PSPPH3122 in Psph 1448A, Pss B728a, and Pst DC3000 strains.
Motifs of PSPPH3122 in Psph 1448A (a) and Pst DC3000 (b) strains. (c) Gene Ontology (GO) analysis by hypergeometric test (BH-adjusted p<0.05) of PSPPH3122 in Psph 1448A, Pst DC3000, and Pss B728a strains.
Figure 5—figure supplement 2
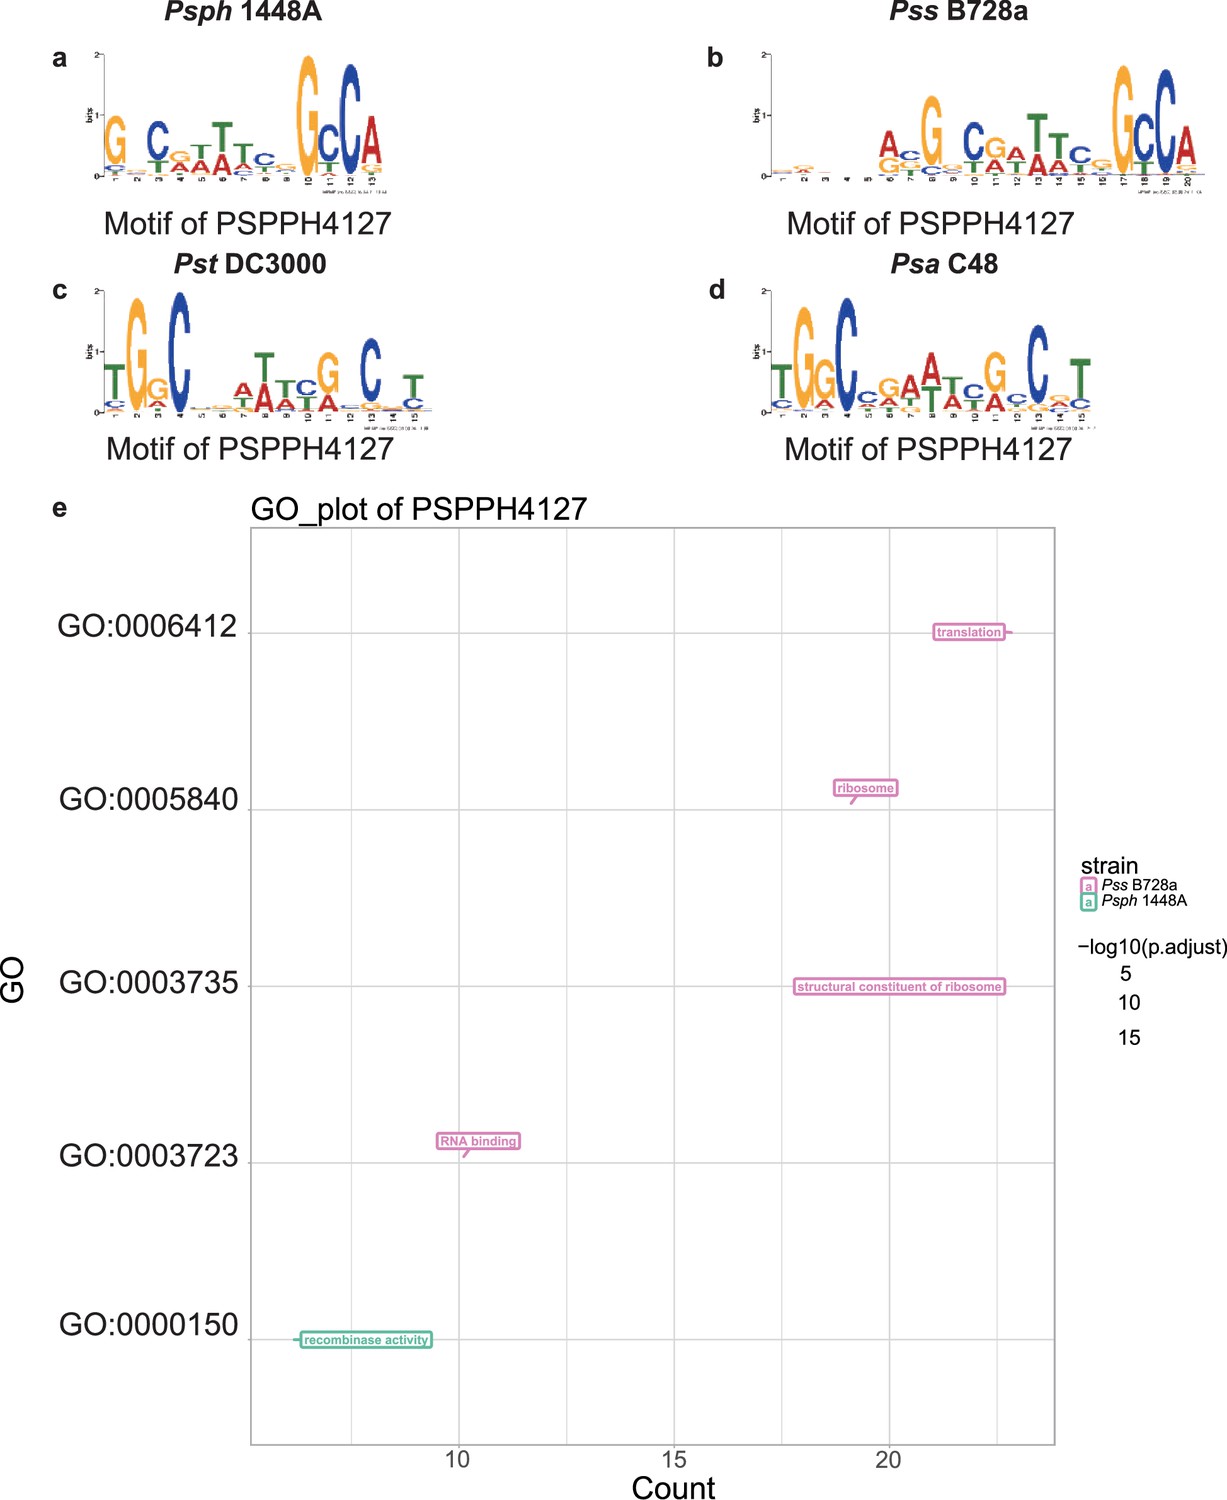
Motif and functional enrichment analysis of PSPPH4127 in Psph 1448A, Pss B728a, Pst DC3000, and Psa C48 strains.
Motifs of PSPPH4127 in Psph 1448A (a), Pss B728a (b), Pst DC3000 (c), and Psa C48 (d) strains. (e) Gene Ontology (GO) analysis by hypergeometric test (BH-adjusted p<0.05) of PSPPH4127 in Psph 1448A, Pss B728a, Pst DC3000, and Psa C48 strains.
Figure 6
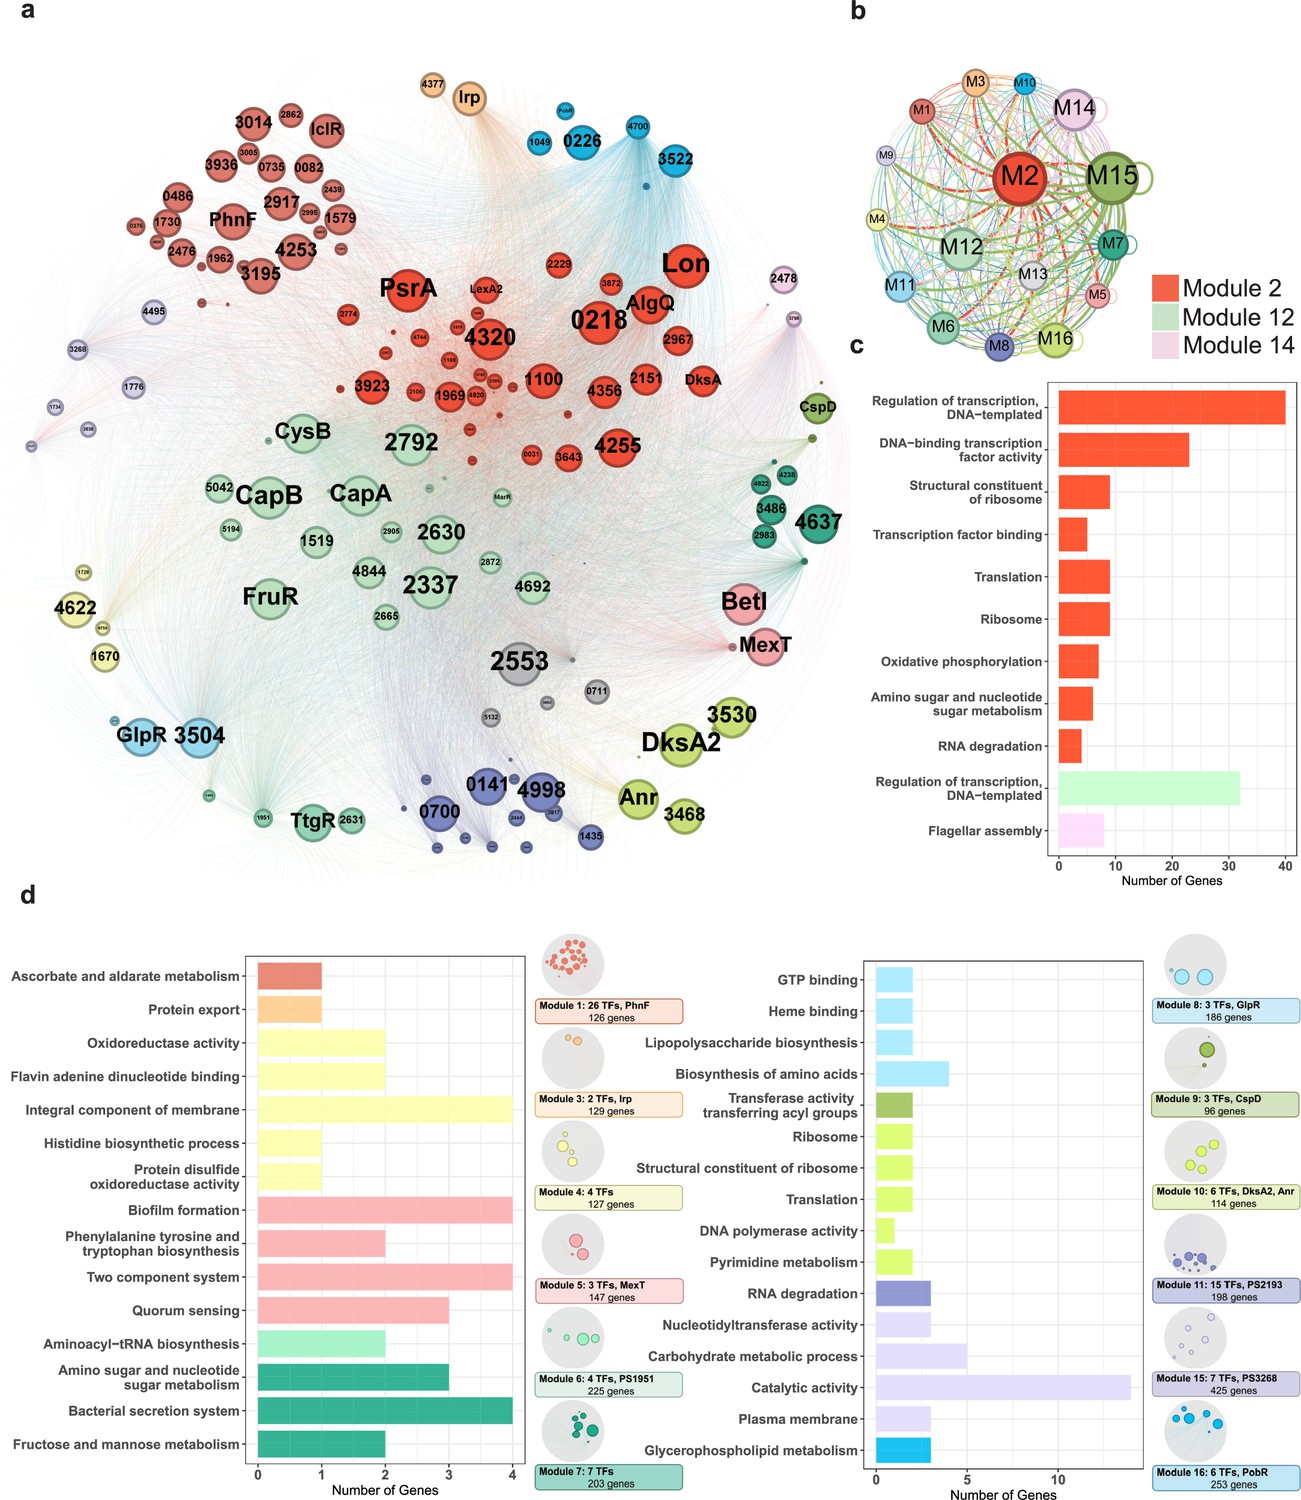
Functional modularised regulatory network in P. syringae exhibits the specific functions of both transcription factors (TFs) and their target genes.
(a) The functional categorical regulation network in Psph 1448A analysed by Gephi (resolution 0.9). The 16 modules (both TFs and their target genes) are labelled in different colours. TF nodes are shown as corresponding sized circles representing their expression level. Their target genes are shown as corresponding-coloured dots in the background. TF-target edges are shown as corresponding-coloured lines between nodes. (b) Graph diagram indicates the connections between TF and their targets in modules. Module nodes are shown as corresponding-coloured circles with size proportional to the number of nodes within. Edge colours are source-based, and edge thicknesses represent the connected quantity between modules. (c–d) Functional category enrichment analysis of genes in each module, p<0.05.
Figure 7
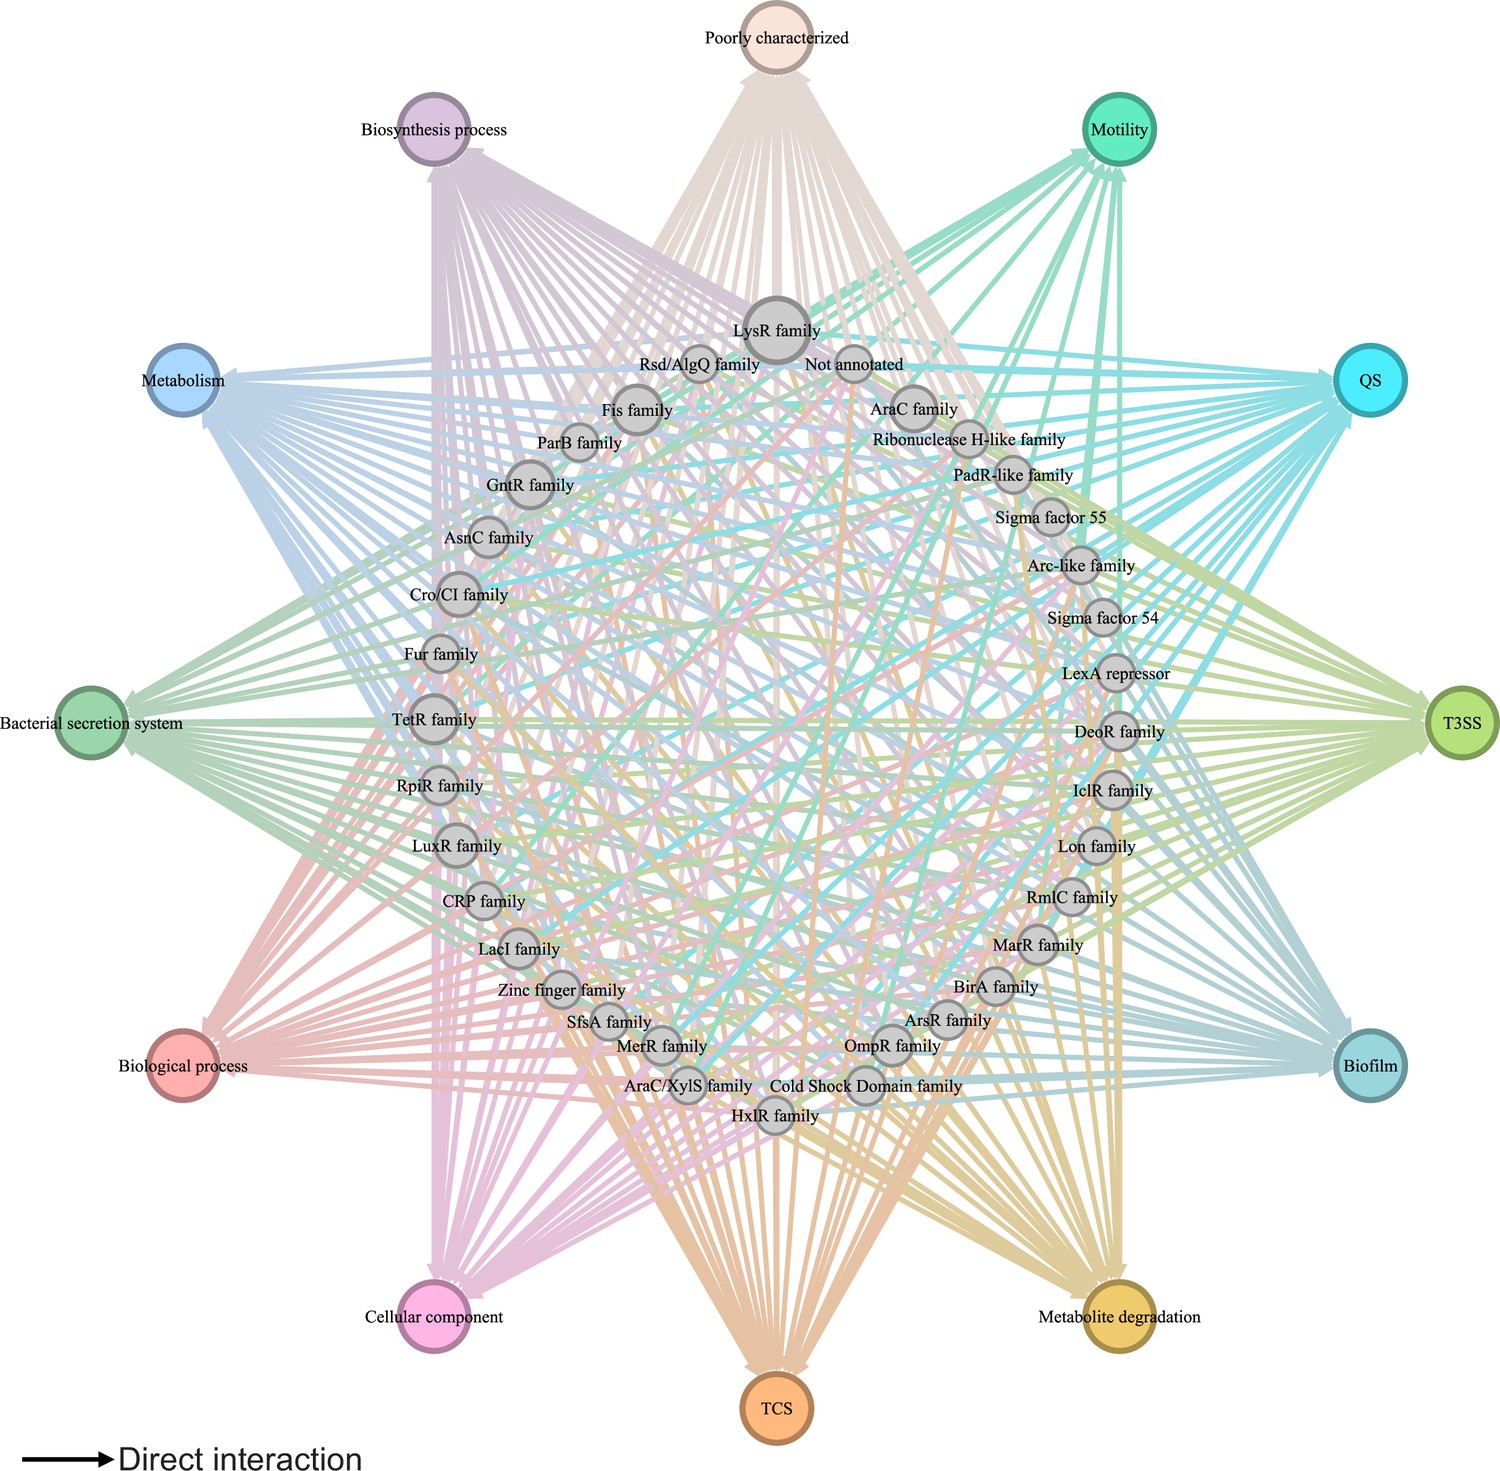
Global transcriptional regulatory network in Psph 1448A.
The integrated transcriptional regulatory network reflects the interactions between all transcription factors (TFs) classified into 39 families from different DNA-binding domain types and target genes annotated from pathway annotations. The targets are shown in 12 pathways with various colours. TF nodes are grey as corresponding sizes representing TF number in the family. Edge colours are target-based.
Additional files
-
Supplementary file 1
Hierarchical height and direct interaction of transcription factors (TFs).
- https://cdn.elifesciences.org/articles/96172/elife-96172-supp1-v1.xlsx
-
Supplementary file 2
Functional category and peak numbers of top transcription factors (TFs), functional category of middle and bottom TFs.
- https://cdn.elifesciences.org/articles/96172/elife-96172-supp2-v1.xlsx
-
Supplementary file 3
Hierarchical network of transcription factors (TFs).
- https://cdn.elifesciences.org/articles/96172/elife-96172-supp3-v1.xlsx
-
Supplementary file 4
Homologous proteins in three strains (DC3000, B728a, and C48) with 1448A and binding peaks of five TFs (Irp, X2193, X2193, X4127, and OmpR).
- https://cdn.elifesciences.org/articles/96172/elife-96172-supp4-v1.xlsx
-
Supplementary file 5
List of orthologous genes of 1448A transcription factors (TFs) in the other tested P. syringae strains (DC3000, B728a, and C48).
- https://cdn.elifesciences.org/articles/96172/elife-96172-supp5-v1.xlsx
-
Supplementary file 6
Strains and primers used in this study.
- https://cdn.elifesciences.org/articles/96172/elife-96172-supp6-v1.xlsx
-
MDAR checklist
- https://cdn.elifesciences.org/articles/96172/elife-96172-mdarchecklist1-v1.docx
Download links
A two-part list of links to download the article, or parts of the article, in various formats.
Downloads (link to download the article as PDF)
Open citations (links to open the citations from this article in various online reference manager services)
Cite this article (links to download the citations from this article in formats compatible with various reference manager tools)
Architecture of genome-wide transcriptional regulatory network reveals dynamic functions and evolutionary trajectories in Pseudomonas syringae
eLife 13:RP96172.
https://doi.org/10.7554/eLife.96172.3


