A common alteration in effort-based decision-making in apathy, anhedonia, and late circadian rhythm
- MRC Cognition and Brain Sciences Unit, University of Cambridge, United Kingdom
- Department of Psychiatry, University of Cambridge, United Kingdom
Figures
Figure 1
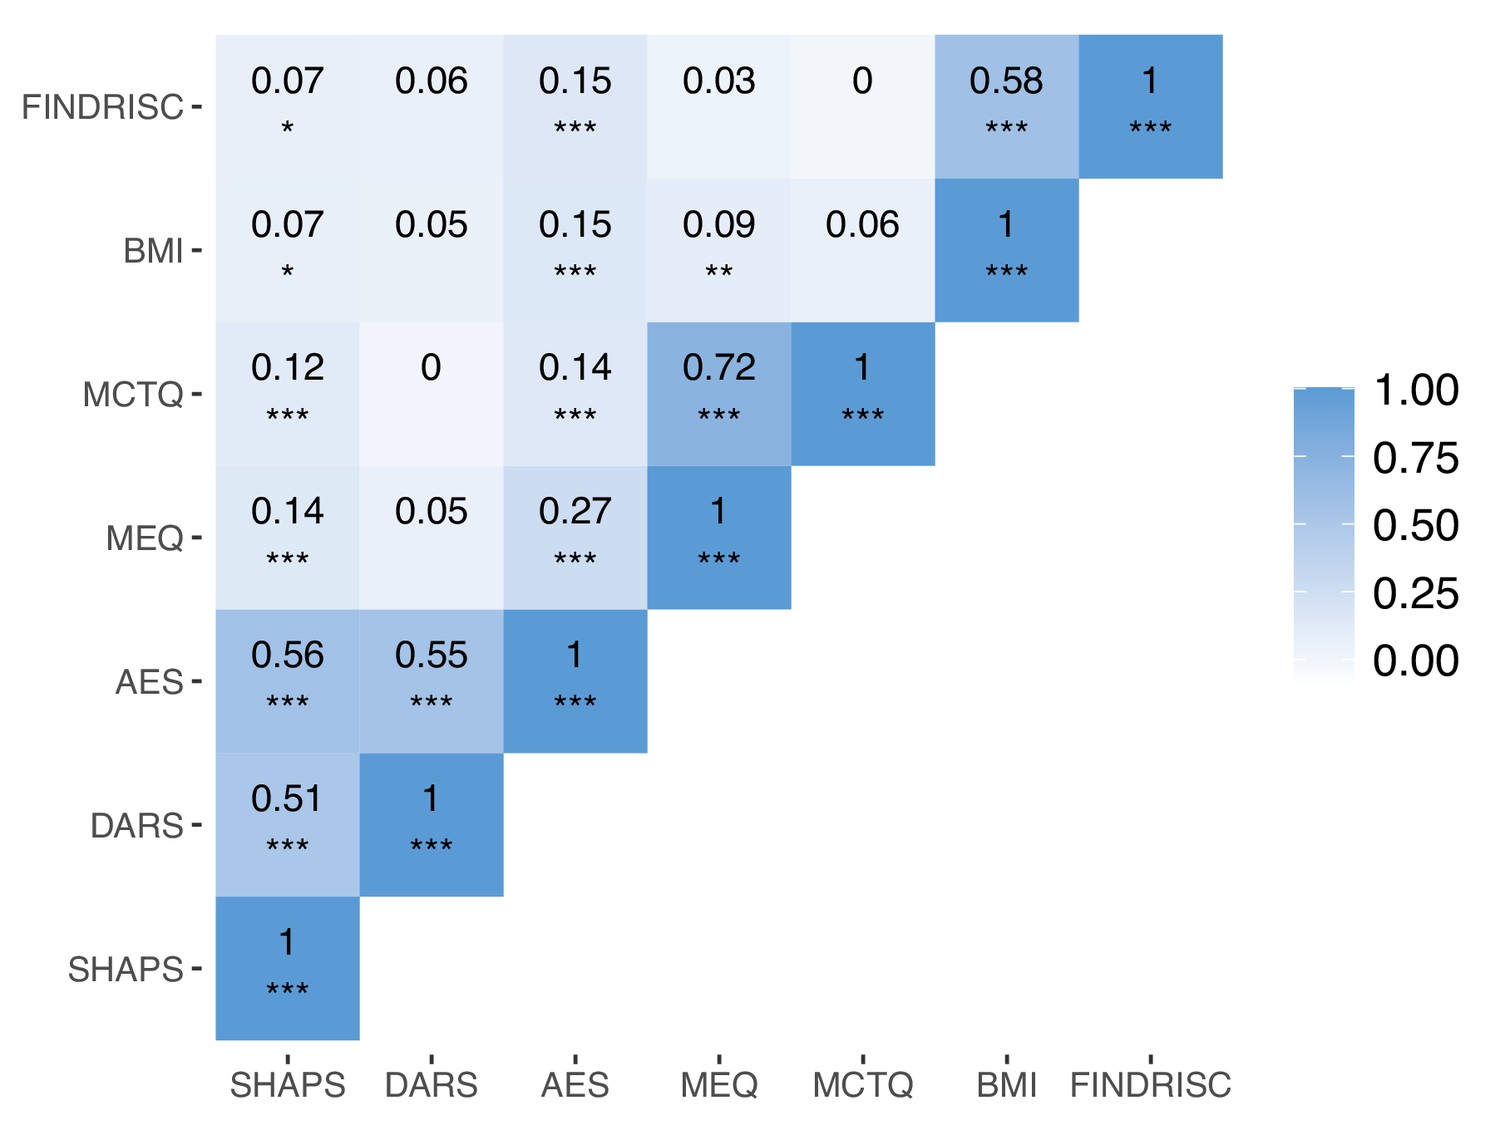
Correlations between questionnaire scores.
Correlations between questionnaire sum scores for the Snaith Hamilton Pleasure Scale (SHAPS), the Dimensional Anhedonia Rating Scale (DARS), the Apathy Evaluation Scale (AES), Morningness–Eveningness Questionnaire (MEQ), Munich Chronotype Questionnaire (MCTQ), body mass index (BMI), and the Finish Diabetes Risk Score (FINDRISC) (n=958). Asterisks indicate significance: *p < 0.05, **p < 0.01, ***p < 0.001 (not accounting for multiple comparisons). Note that sum scores for the AES and the DARS have been transformed such that increasing scores can be interpreted as higher symptom severity, in line with the SHAPS. Sum scores of the MEQ have been transformed such that higher scores indicate higher eveningness, in line with the MCTQ.
Figure 2
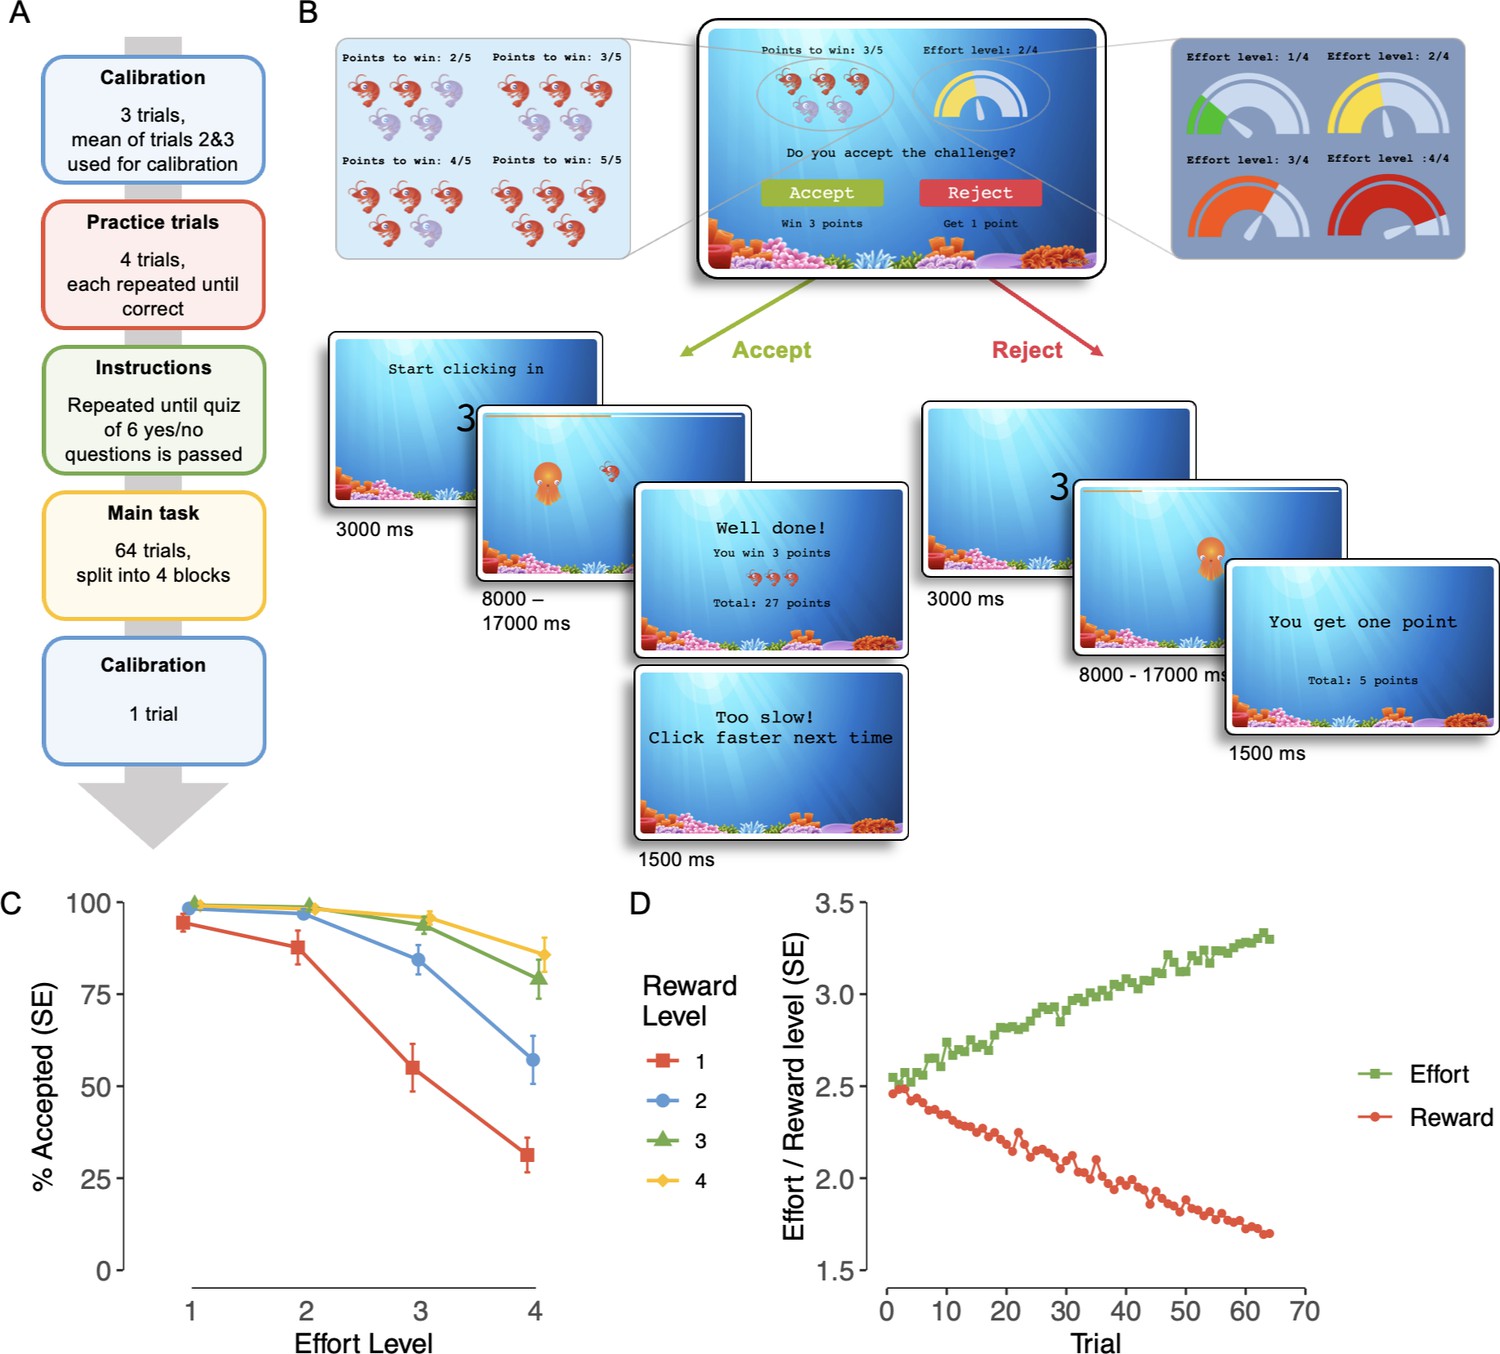
Effort-based decision-making: task design and model-agnostic results.
(A) The task can be divided into four phases: a calibration phase to determine individual clicking capacity to calibrate effort levels, practice trials that participants practice until successful on every effort level, instructions and a quiz that must be passed, and the main task, consisting of 64 trials split into 4 blocks. (B) Each trial consists of an offer with a reward (2, 3, 4, or 5 points) and an effort level (1, 2, 3, or 4, scaled to the required clicking speed and time the clicking must be sustained for) that subjects accept or reject. If accepted, a challenge at the respective effort level must be fulfilled for the required time to win the points. If rejected, subjects wait for a matched amount of time and receive one point. (C) Proportion of accepted trials, averaged across participants and effort–reward combinations. Error bars indicate standard errors (n = 958). (D) Staircasing development of offered effort and reward levels across the task, averaged across participants (n = 958).
Figure 3
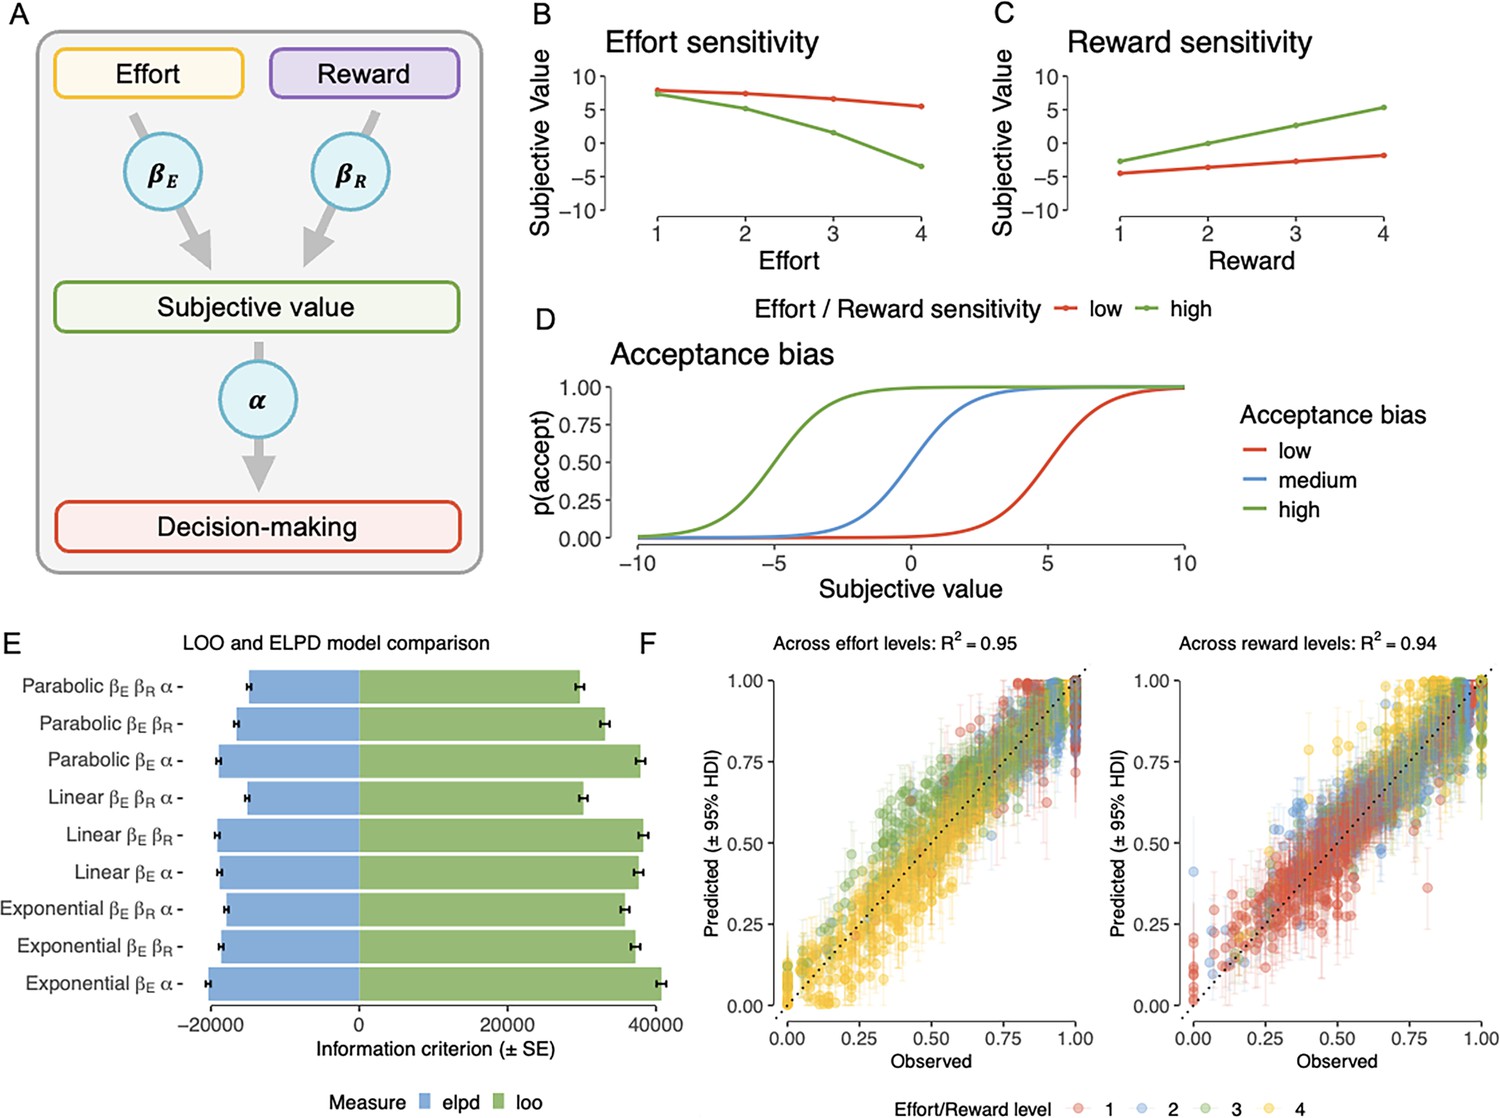
Computational modelling: model visualization and model-based results.
(A) Economic decision-making models posit that efforts and rewards are joined into a subjective value (SV), weighed by individual effort () and reward sensitivity () parameters. The SV is then integrated with an acceptance bias parameter and translated to decision-making. (B, C) The model suggests that SV decreases as effort increases and increases as reward increases. The magnitude of this relationship depends on the individual effort and reward sensitivity parameters. (D) The acceptance bias parameter acts as an intercept to the softmax function, thereby changing the relationship between SV and acceptance probability. (E) Model comparison based on leave-out-out information criterion (LOOIC; lower is better) and expected log posterior density (ELPD; higher is better). Error bars indicate standard errors (n = 958). (F) Posterior predictive checks for the full parabolic model, comparing observed versus model-predicted subject-wise acceptance proportions across effort levels (left) and reward levels (right). Error bars indicate 95% highest density intervals (n = 958).
Figure 4
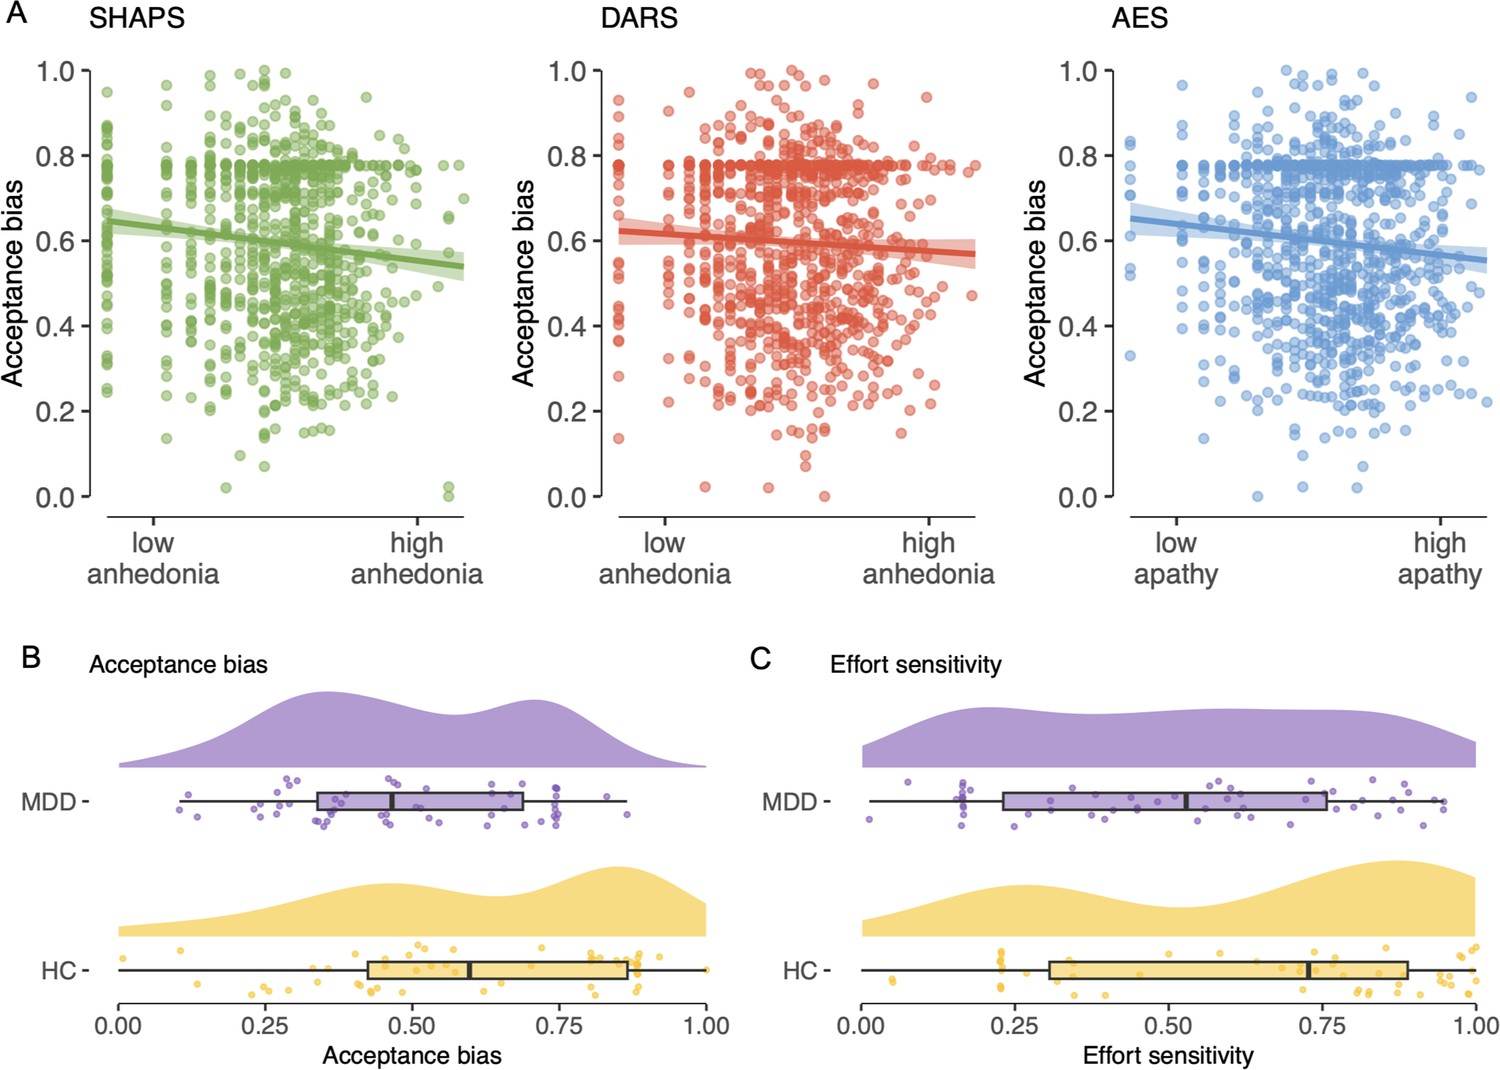
Associations between task parameter estimates and psychiatric measures.
(A) Visualizations of associations between the acceptance bias task parameter and the Snaith–Hamilton Pleasure Scale (SHAPS), the Dimensional Anhedonia Rating Scale (DARS) (Rizvi et al., 2015), and the Apathy Evaluation Scale (AES) (Marin et al., 1991). (B, C) Comparison of acceptance bias (left) and effort sensitivity (right) between a sample of participants meeting criteria for current major depressive disorder (MDD; purple, upper) on the the Mini-International Neuropsychiatric Interview 7.0.1 (M.I.N.I) (Lecrubier et al., 1997) and age- and gender-matched controls (yellow, lower).
Figure 5
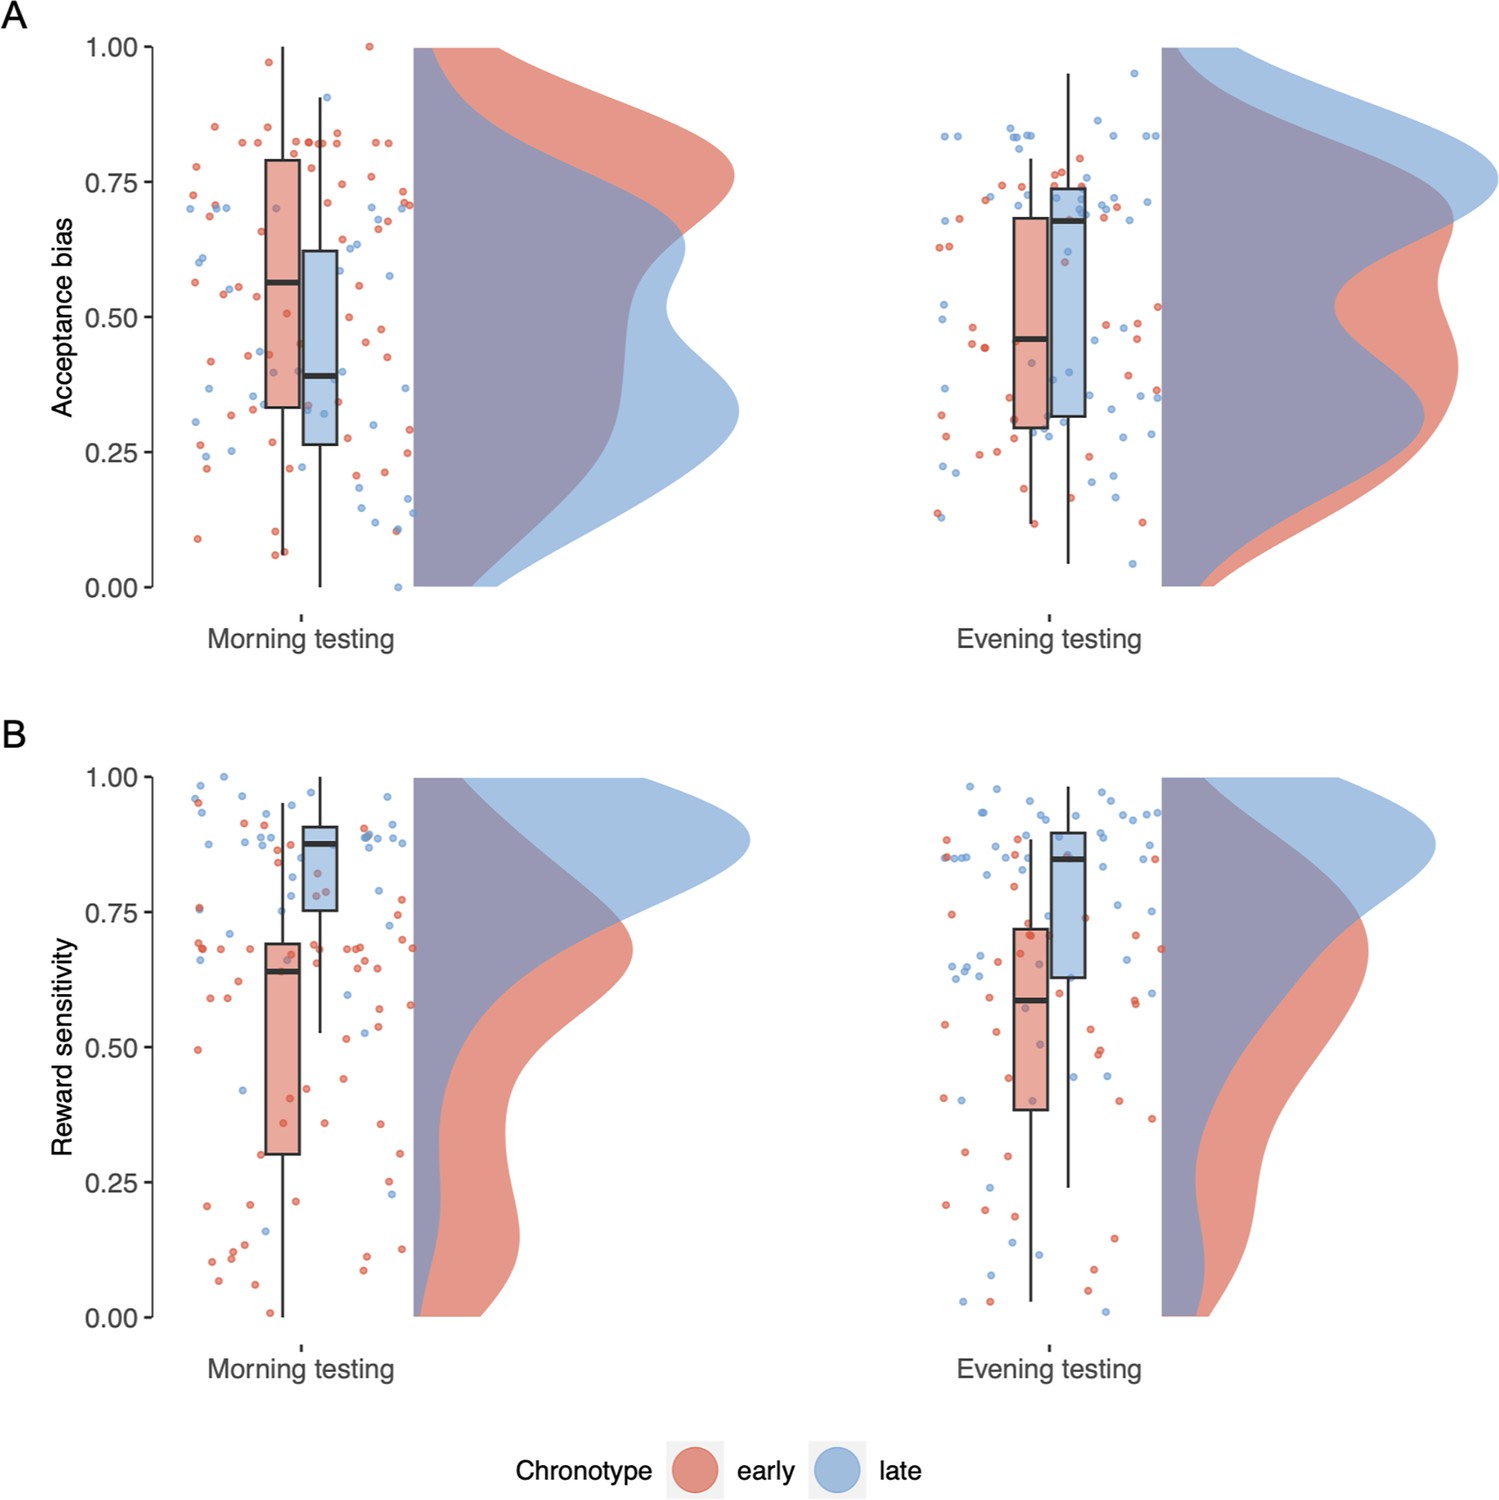
Effects of chronotype and time-of-day on task parameter estimates.
(A) Effect of chronotype and time-of-day on reward sensitivity parameter estimates. (B) Effect of chronotype and time-of-day on acceptance bias parameter estimates.
Appendix 1—figure 1
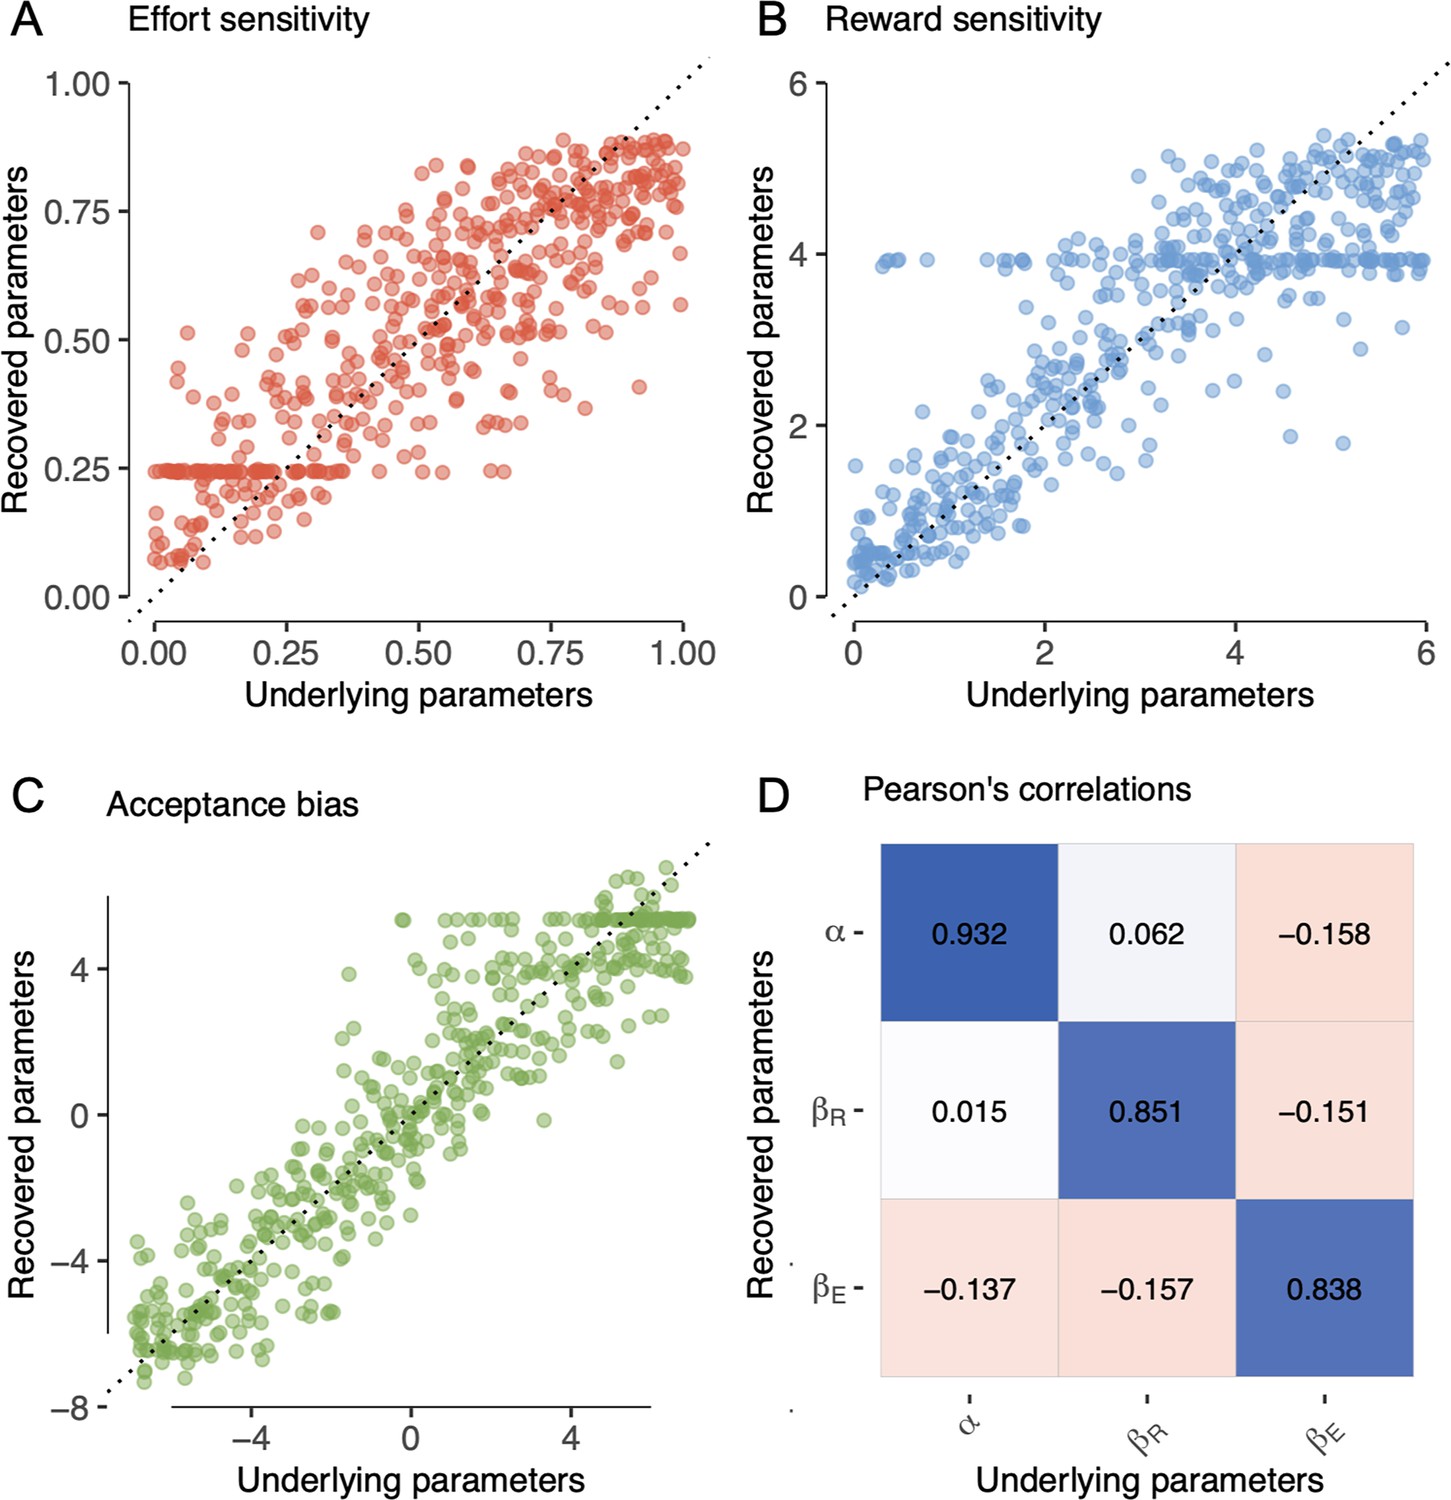
Parameter recovery.
(A–C) Comparison between underlying parameters and recovered mean parameter estimates for the three free parameters of the full parabolic model. (D) Pearson’s correlations between all underlying and recovered parameters for the full parabolic model.
Appendix 1—figure 2
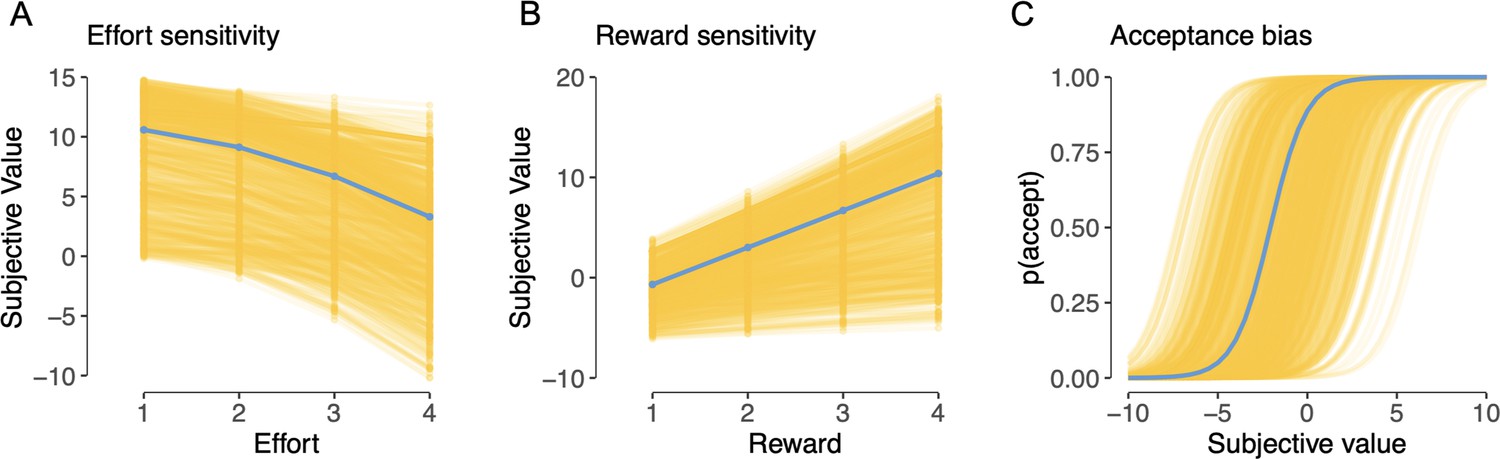
Parameter estimates.
(A–C) Visualization of individual-level (yellow) and group-level (blue) model parameter estimates for effort sensitivity (A), reward sensitivity (B), and acceptance bias (C).
Appendix 2—figure 1
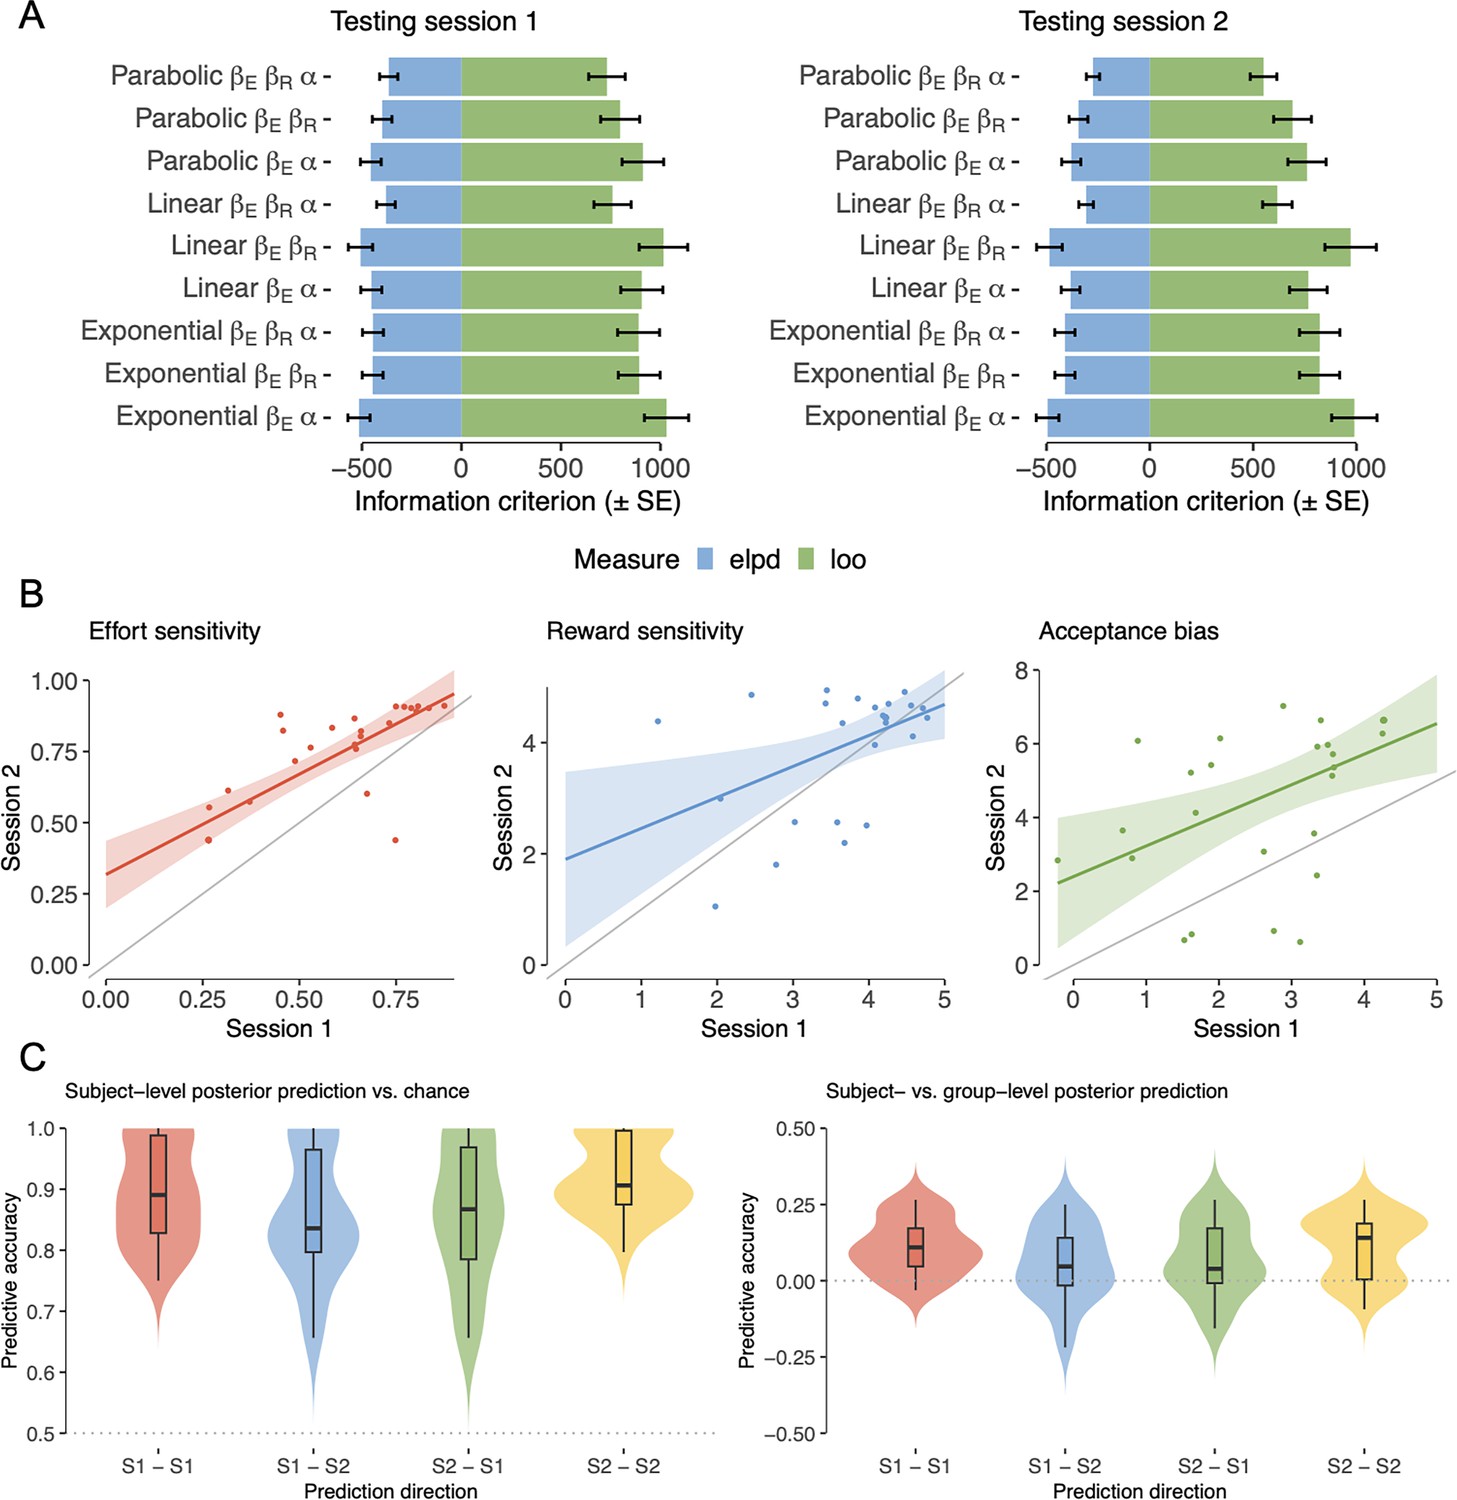
Computational modelling and test–retest reliability.
(A) Model comparison for each testing session based on the leave-one-out information criterion (LOO) and expected log predictive density (ELPD). Error bars indicate standard errors (n = 30). (B) Subject-wise parameter estimates compared between testing sessions. (C) Predictive accuracy against chance (left) and group-level parameters (right; values >0 indicate better performance of subject-level compared to group-level parameters). Labels s1s2 (and s2s1) indicate session 1 (session 2) parameters predicting session 2 (session 1) data, s1s1 (and s2s2) indicate session 1 (session 2) parameters predicting session 1 (session 2) data.
Appendix 3—figure 1
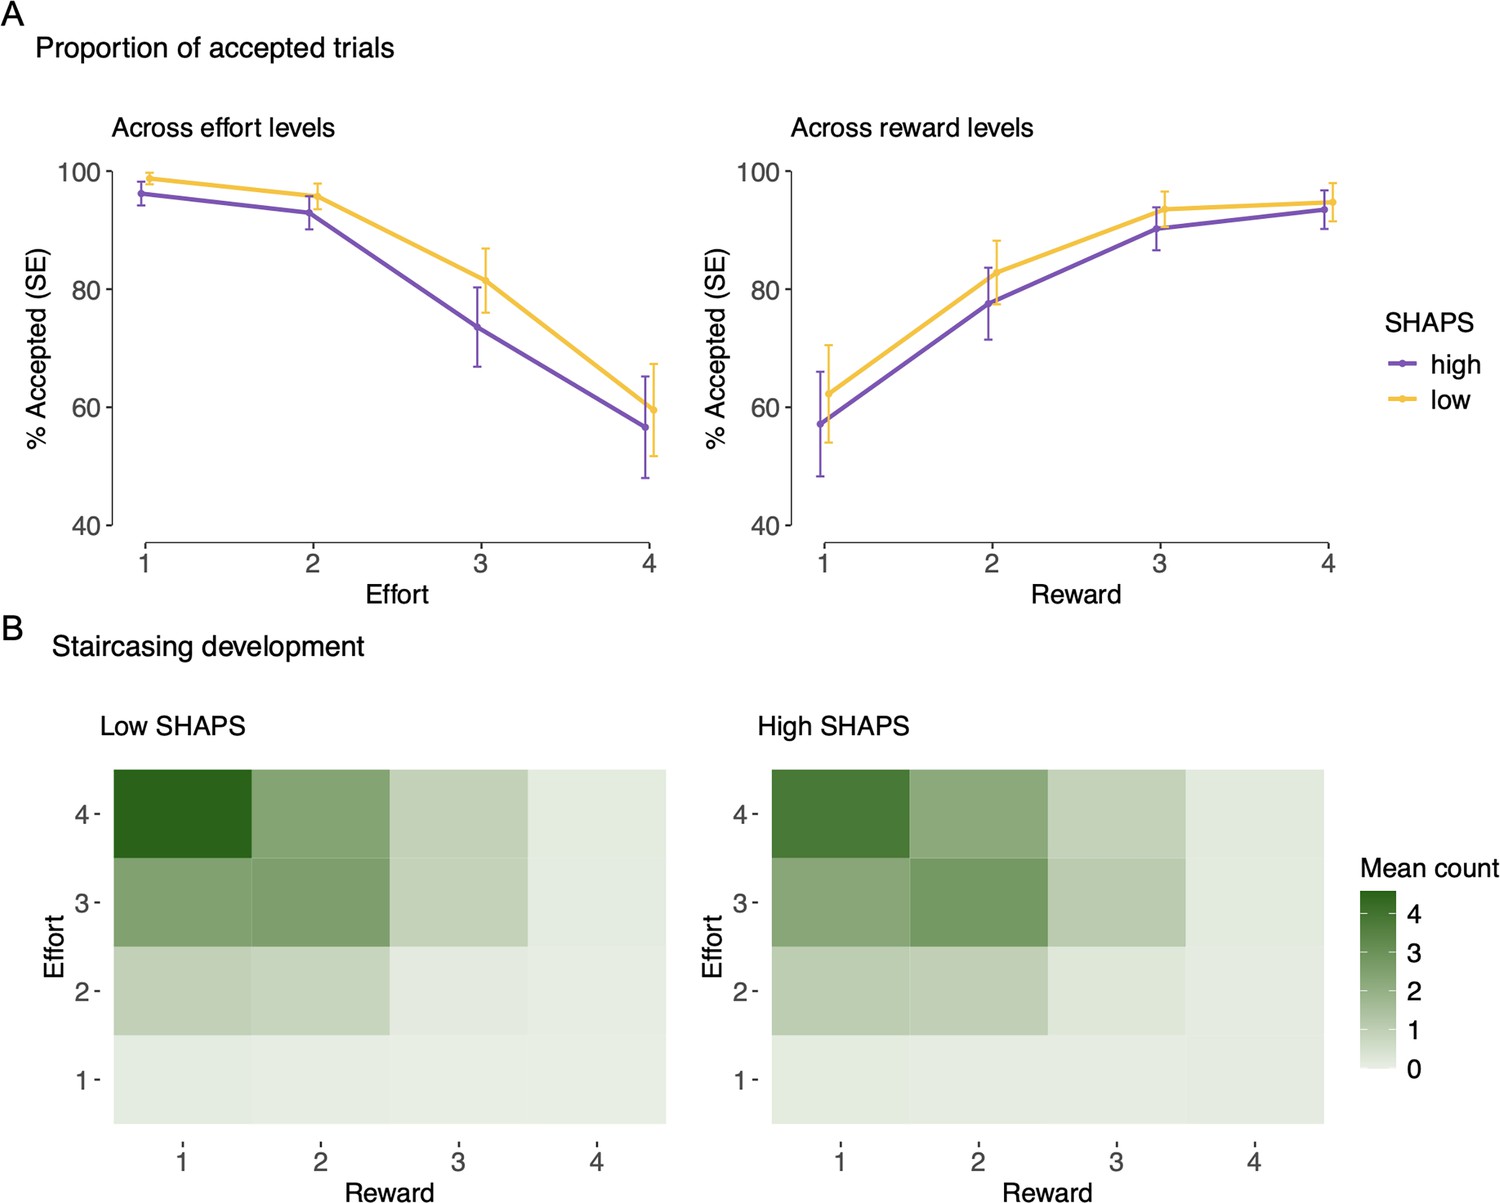
Model-agnostic task measures relation to anhedonia.
(A) Comparing the proportion of accepted trials across effort (right) and reward (left) levels in subsamples of participants scoring in the highest and lowest SHAPS quartile. Error bars indicate standard errors (n = 479). (B) Distribution of effort–reward combinations, averaged across the final trial of 16 staircases.
Tables
Table 1
Demographic characteristics and descriptive questionnaire measures in the included sample and excluded participants.
| Included | Excluded | |
|---|---|---|
| Cohort size (%) | 958 (96.4%) | 36 (3.62%) |
| Demographics | ||
| Age, mean (SD; range) | 45.00 (15.01; 18–79) | 47.90 (13.60; 20–70) |
| Gender, number (%) | ||
| Male (%) | 470 (49.06) | 12 (33.33) |
| Female (%) | 484 (50.52) | 24 (66.67) |
| Non-binary (%) | 4 (0.42) | 0 (0.0) |
| Ethnicity, number (%) | ||
| White (%) | 852 (88.94) | 28 (77.78) |
| Asian (%) | 53 (5.53) | 4 (11.1) |
| Black (%) | 27 (2.82) | 3 (8.33) |
| Mixed (%) | 18 (1.88) | 1 (2.78) |
| Other (%) | 8 (0.84) | 0 (0.0) |
| SES (/9), median (IQR) | 5 (4–6) | 5 (4–6) |
| Psychiatric comorbidities | ||
| Current or past, number (%) | ||
| Any (%) | 264 (27.60) | 5 (13.90) |
| Major depressive disorder (%) | 94 (9.81) | 1 (2.78) |
| Generalized or social anxiety disorder (%) | 195 (20.35) | 2 (5.56) |
| Current antidepressant use, number (%) | 151 (15.80) | 5 (13.9) |
| Task metrics | ||
| Testing time, number (%) | ||
| Morning testing (8:00–11:59; %) | 492 (51.40) | 19 (52.80) |
| Evening testing (18:00–21:59; %) | 458 (47.80) | 17 (47.2) |
| Time taken (min), mean (SD; range) | 33.13 (9.63; 22–151) | 37.06 (15.30; 26–105) |
| Mean clicking calibration, mean (SD; range) | 60.6 (16.10, 8–206) | 74.10 (123.00, 0–721) |
| Psychiatric questionnaire measures | ||
| SHAPS, mean (SD; range) | 9.15 (6.28; 0–36) | 10.90 (6.97; 1–33) |
| DARS, mean (SD; range) | 54.50 (9.18, 17–68) | 53.70 (9.77, 36–68) |
| AES, mean (SD; range) | 55.70 (9.42; 25–72) | 55.10 (9.51; 37–71) |
| M.I.N.I., current MDD (%) | 56 (5.85) | |
| Circadian questionnaire measures | ||
| MEQ, mean (SD; range) | 52.80 (10.6, 18–81) | 52.08 (7.87, 34–71) |
| MCTQ, mean time in min (SD; range) | 03:56 (89 min; 00:14–11:05) | 04:03 (87 min; 01:05–09:05) |
| Metabolic questionnaire measures | ||
| BMI, mean (SD; range) | 26.90 (6.29, 15.20–63.30) | 27.02 (5.77, 19.10–46.90) |
| FINDRISC, mean (SD; range) | 7.46 (5.09, 0–25) | 8.56 (5.26, 0–22) |
-
Note. SES, subjective socioeconomic status; IQR, interquartile range; SHAPS, Snaith Hamilton pleasure scale; DARS, Dimensional Anhedonia Rating Scale; AES, Apathy Evaluation Scale; M.I.N.I., Mini-International Neuropsychiatric Interview; MDD, major depressive disorder; MEQ, Morningness–Eveningness questionnaire; MCTQ, Munich Chronotype Questionnaire; BMI, body mass index; FINDRISC, Finish Diabetes Risk Score.
Table 2
Demographic characteristics and descriptive questionnaire measures in the early and late chronotype participants.
| Early chronotype | Late chronotype | Significance | |
|---|---|---|---|
| Sample size (%) | 102 (51.78%) | 95 (48.22%) | |
| Demographics | |||
| Age, mean (SD; range) | 51.80 (14.10; 20–78) | 35.80 (14.40; 19–68) | p < 0.001 |
| Gender, number (%) | p < 0.05 | ||
| Male | 42 (41.18) | 55 (57.89) | |
| Female | 60 (58.82) | 40 (42.11) | |
| Testing time | |||
| Start testing time, number (%) | p < 0.01 | ||
| Morning testing (8:00–11:59) | 63 (31.98) | 38 (19.29) | |
| Evening testing (18:00–21:59) | 39 (19.80) | 57 (28.93) | |
| Psychiatric comorbidities | |||
| Current or past, number (%) | |||
| Any | 22 (21.60) | 40 (42.10) | p < 0.01 |
| Major depressive disorder | 4 (3.92) | 22 (23.16) | p < 0.001 |
| Generalized or social anxiety disorder | 18 (17.65) | 24 (25.26) | p = 0.258 |
| Current antidepressant use, number (%) | 9 (8.82) | 26 (27.40) | p < 0.1 |
| Psychiatric questionnaire measures | |||
| SHAPS, mean (SD; range) | 9.65 (6.38) | 11.80 (5.92) | p < 0.05 |
| DARS, mean (SD; range) | 54.00 (9.37) | 52.70 (9.39) | p = 0.322 |
| AES, mean (SD; range) | 56.00 (9.72) | 50.60 (10.10) | p < 0.001 |
| M.I.N.I., current MDD (%) | 3 (2.94) | 15 (15.79) | p < 0.01 |
-
Note. SES, subjective socioeconomic status; IQR, interquartile range; SHAPS, Snaith–Hamilton Pleasure Scale; DARS, Dimensional Anhedonia Rating Scale; AES, Apathy Evaluation Scale; M.I.N.I., Mini-International Neuropsychiatric Interview; MDD, major depressive disorder; MEQ, Morningness–Eveningness Questionnaire; MCTQ, Munich Chronotype Questionnaire; BMI, body mass index; FINDRISC, Finish Diabeted Risc Score.
Appendix 1—table 1
Mathematical definition of the models included in our model space.
| Model | Cost function | Softmax function | |
|---|---|---|---|
| Linear model 1 | |||
| Linear model 2 | |||
| Linear model 3 | |||
| Parabolic model 1 | |||
| Parabolic model 2 | |||
| Parabolic model 3 | |||
| Exponential model 1 | |||
| Exponential model 2 | |||
| Exponential model 3 | |||
Appendix 1—table 2
Pearson’s correlations between underlying parameters and recovered mean parameter estimates for all models included in the model space.
| Linear models | Parabolic models | Exponential models | |||||||
|---|---|---|---|---|---|---|---|---|---|
| 1 | 2 | 3 | 1 | 2 | 3 | 1 | 2 | 3 | |
| 0.811 | 0.927 | 0.816 | 0.836 | 0.919 | 0.838 | 0.926 | 0.882 | 0.802 | |
| - | 0.919 | 0.841 | - | 0.928 | 0.851 | - | 0.898 | 0.891 | |
| 0.965 | - | 0.932 | 0.978 | - | 0.932 | 0.950 | - | 0.904 | |
Appendix 1—table 3
Mathematical definition of models included an inverse temperature parameter.
| Model | Cost function | Softmax function |
|---|---|---|
| 1 | ||
| 2 | ||
| 3 | ||
| 4 |
Additional files
Download links
A two-part list of links to download the article, or parts of the article, in various formats.
Downloads (link to download the article as PDF)
Open citations (links to open the citations from this article in various online reference manager services)
Cite this article (links to download the citations from this article in formats compatible with various reference manager tools)
A common alteration in effort-based decision-making in apathy, anhedonia, and late circadian rhythm
eLife 13:RP96803.
https://doi.org/10.7554/eLife.96803.4


