Identification of novel myelodysplastic syndromes prognostic subgroups by integration of inflammation, cell-type composition, and immune signatures in the bone marrow
- Comprehensive Cancer Centre, School of Cancer and Pharmaceutical Sciences, Faculty of Life Sciences & Medicine, King's College London, United Kingdom
- Department of Basic and Clinical Neuroscience, King’s College London, United Kingdom
- Department of Biostatistics and Health Informatics, King’s College London, United Kingdom
- NIHR BRC SLAM NHS Foundation Trust, United Kingdom
- Perron Institute for Neurological and Translational Science, University of Western Australia Medical School, Australia
- Nuffield Division of Clinical Laboratory Sciences, Radcliffe Department of Medicine, University of Oxford, United Kingdom
Figures
Figure 1
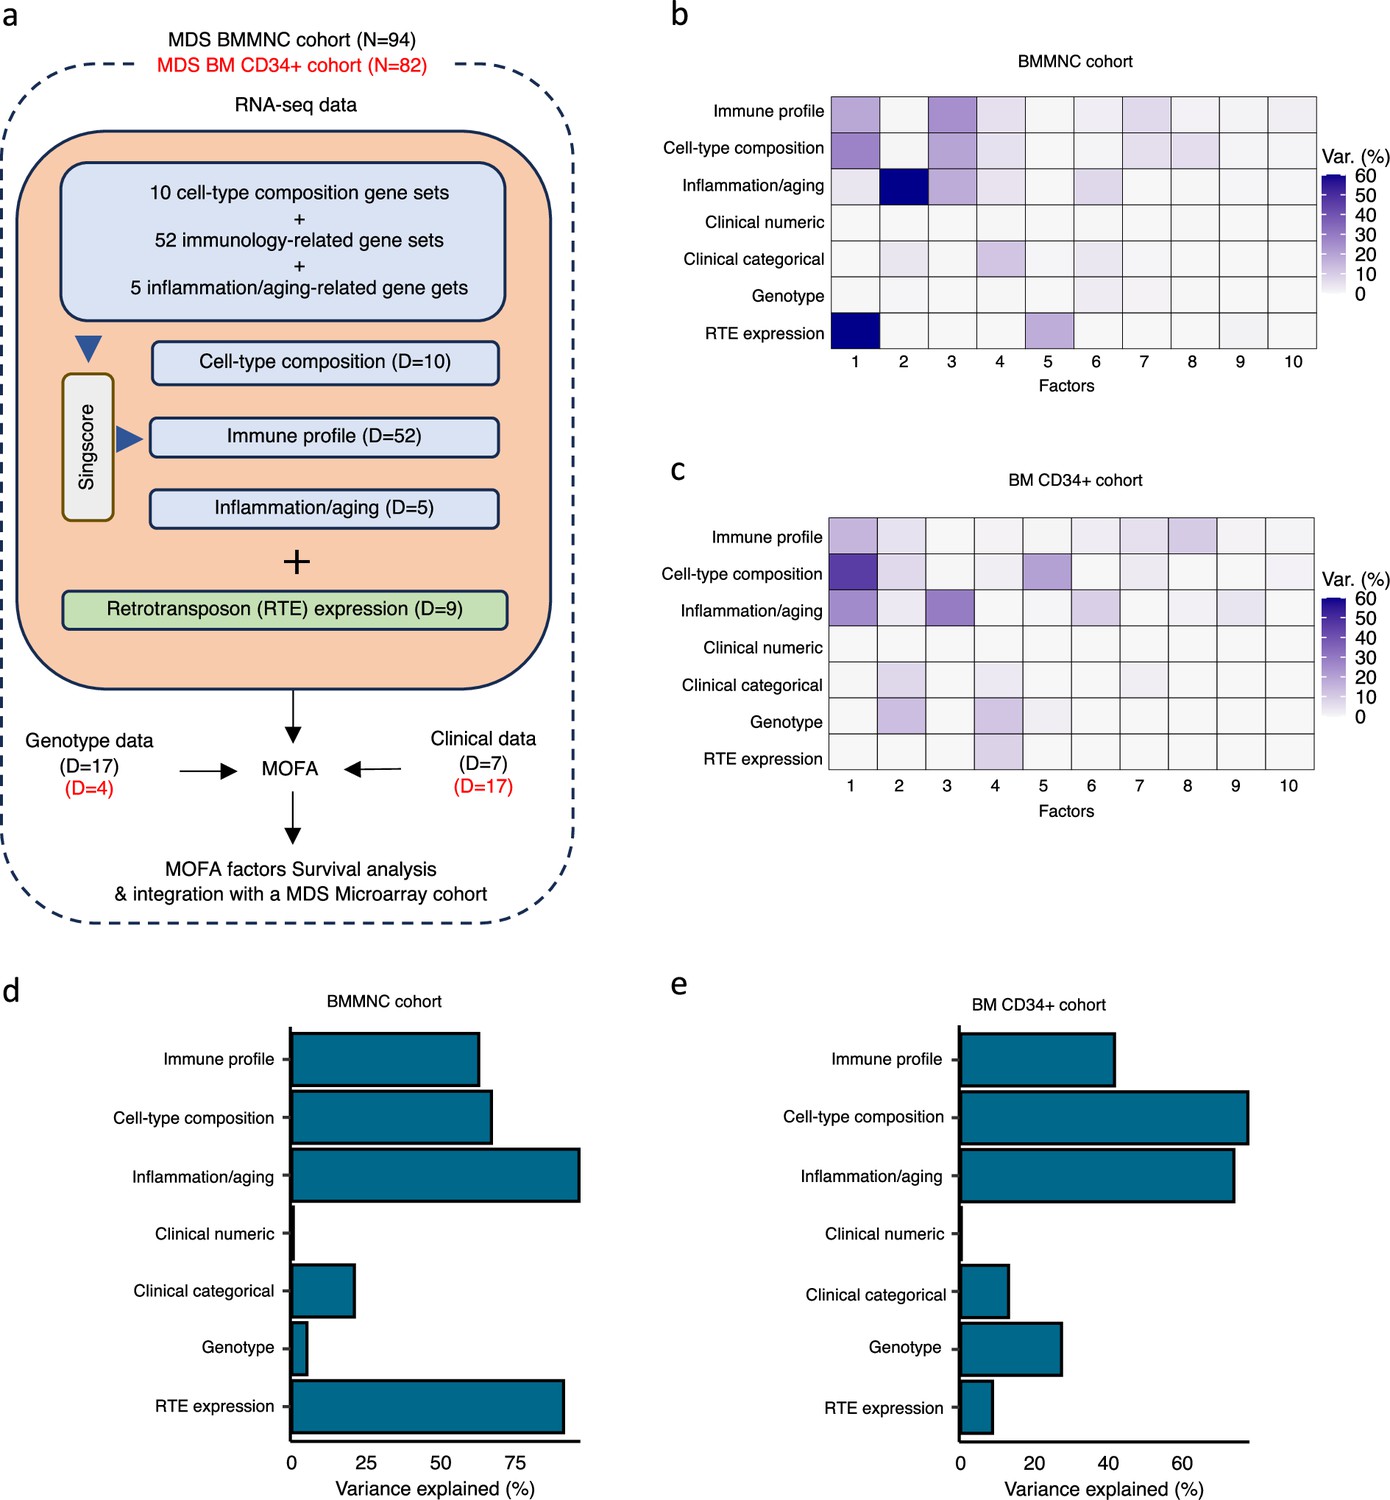
Schematic of multi-omics factor analysis (MOFA) workflow overview, downstream analyses, and factor determination in the bone marrow mononuclear cell (BMMNC) and bone marrow (BM) CD34 + cohorts.
(a) RNA-seq, genotype, and clinical data were obtained from BMMNC samples of 94 myelodysplastic syndromes (MDS) patients from Shiozawa et al. and BM CD34 + samples of 82 patients from Pellagatti et al. studies. We generated seven views of the data where three of which were derived from RNA-seq data after applying Singscore: immune profile, cell-type composition, and inflammation/aging. The other four views were clinical numeric and categorical (Supplementary file 4), genotype, and retrotransposable element (RTE) expression. The data were put through MOFA to identify latent factors and the variance decomposition by factors. The number of features (dimensions) per view is abbreviated by ‘D.’ (b, c) The determined factors for the BMMNC and BM CD34 + cohorts and the percentage of explained variance for each view per identified factor were shown. (d, e) Bar charts depict the total variance explained for each biological data view by all the factors combined in the BMMNC and BM CD34 + cohorts.
Figure 2 with 5 supplements
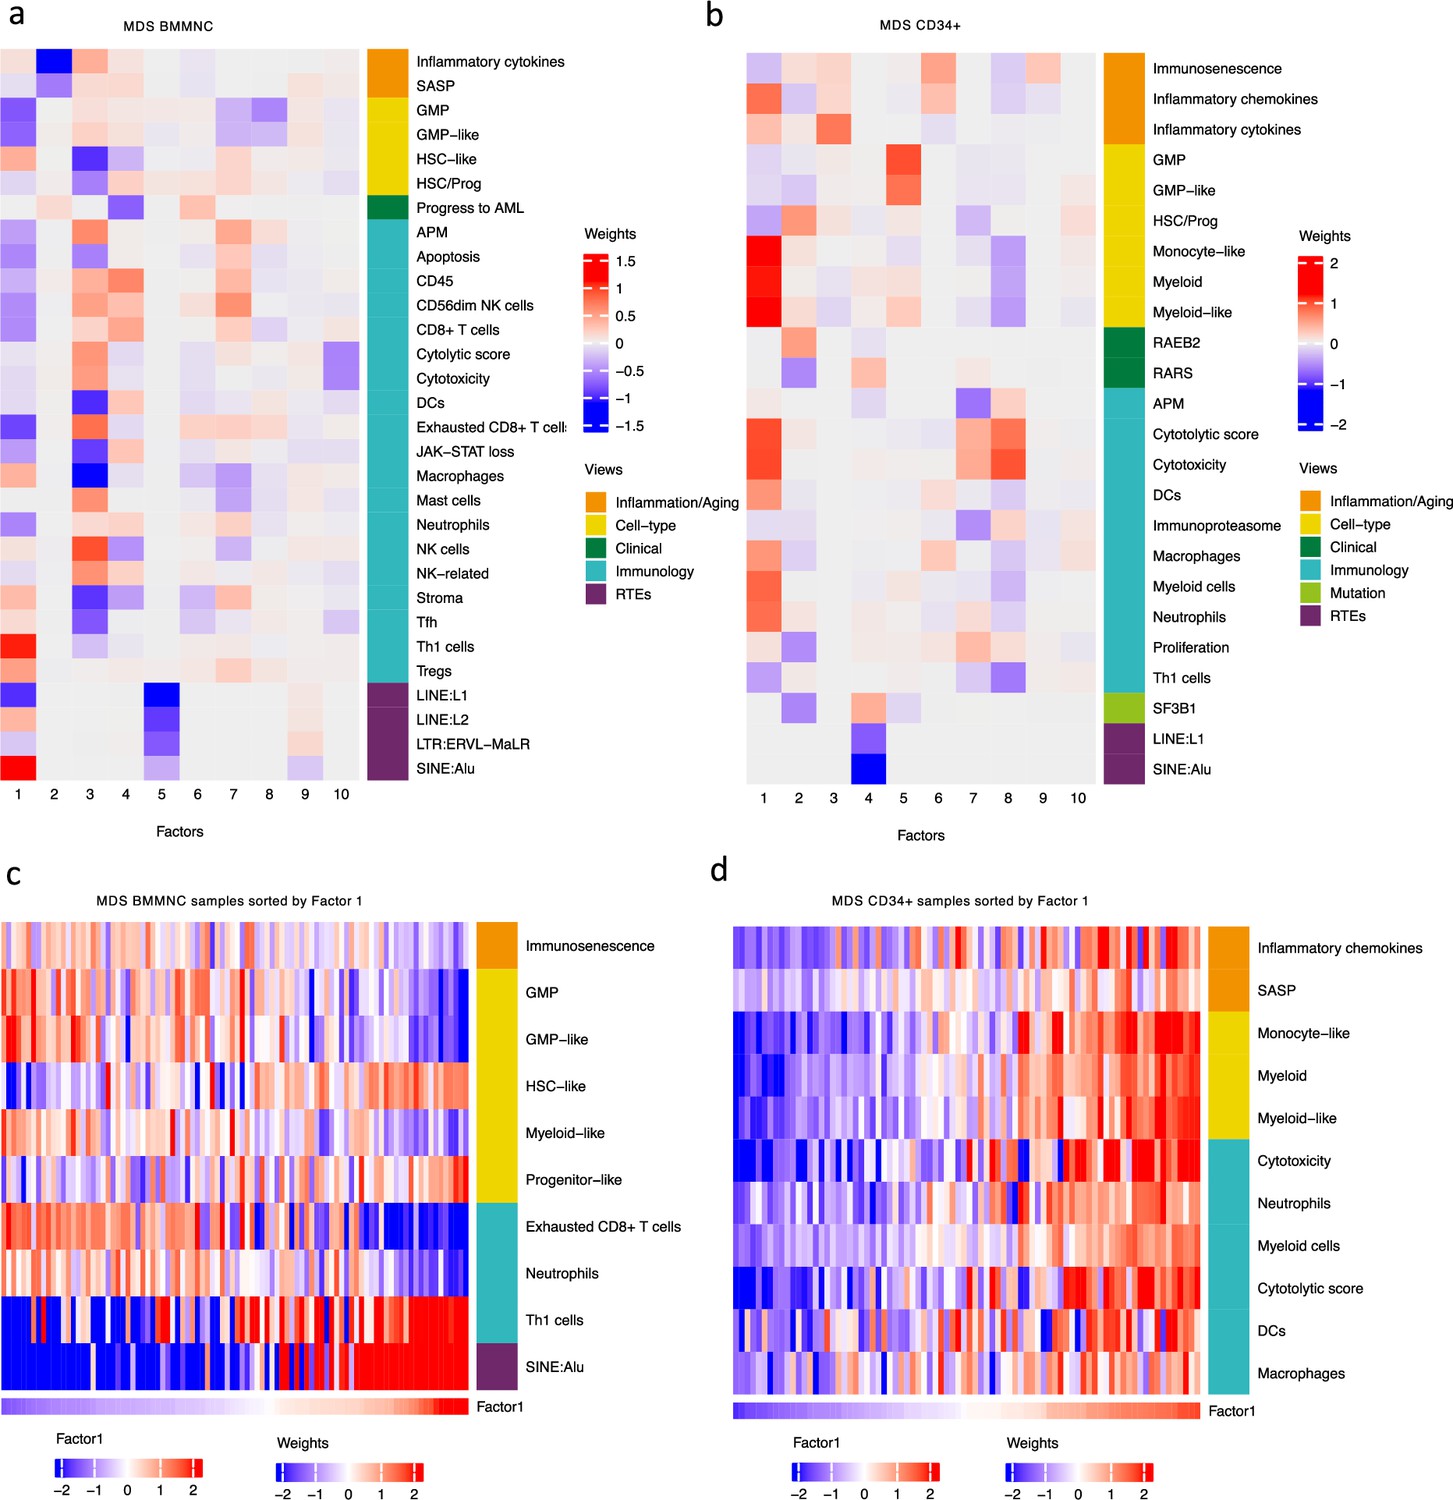
Breakdown of important features for each factor generated by multi-omics factor analysis (MOFA).
(a, b) The important features with high weights for each biological view per factor were shown for the BMMNC and bone marrow (BM) CD34+. Blue represents features with the inverse correlation with the factor, and red shows the positive correlation. (c, d) Characterisation of Factor 1 in the BMMNC and BM CD34 + cohorts, showing only those features highly influencing Factor 1 for the patients in these cohorts. Patients were sorted by Factor 1 values.
Figure 2—figure supplement 1
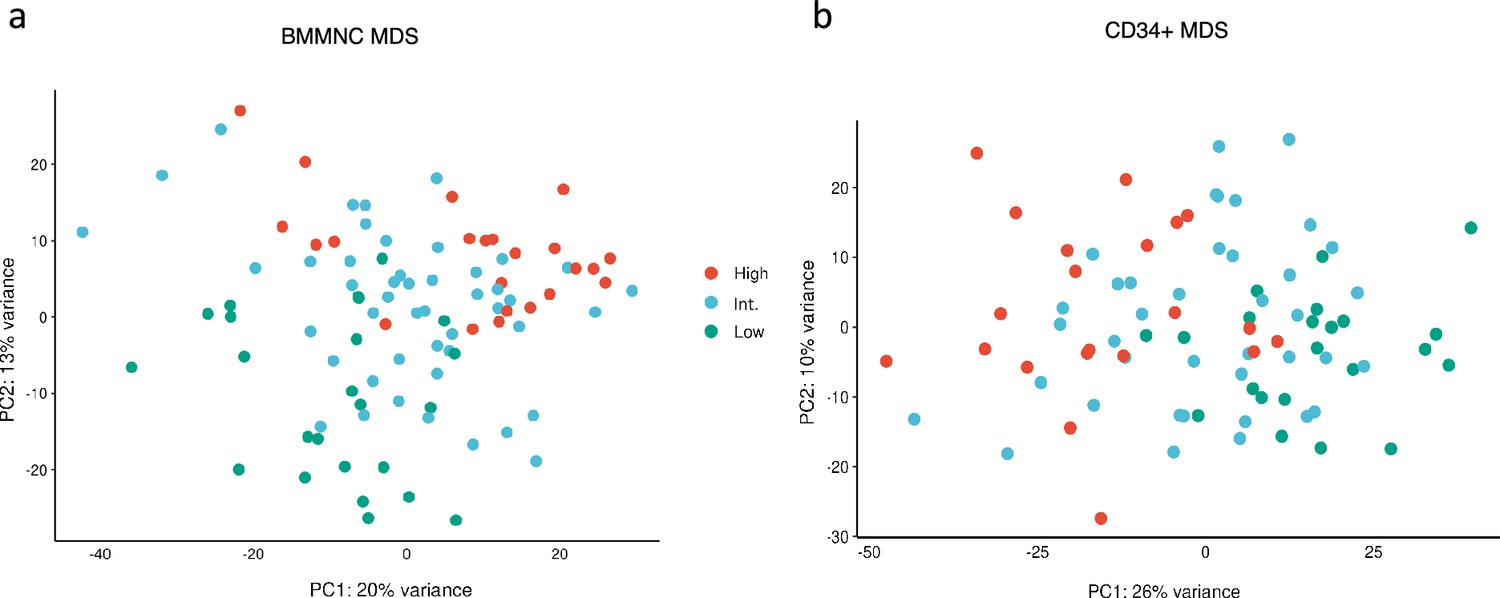
Factor 1 from the bone marrow mononuclear cell (BMMNC) and CD34 + myelodysplastic syndromes (MDS) cohorts stratified the patients in the gene expression principal component analysis (PCA) plots.
(a, b) Principal component analysis on gene expression values of the BMMNC and CD34 + cohorts revealed separate clusters for patients split based on low (first quartile), intermediate (second and third quartile), and high (fourth quartile) levels of Factor 1 in both cohorts. In both plots, the intermediate group is in between the high and low groups in the PCA plots.
Figure 2—figure supplement 2
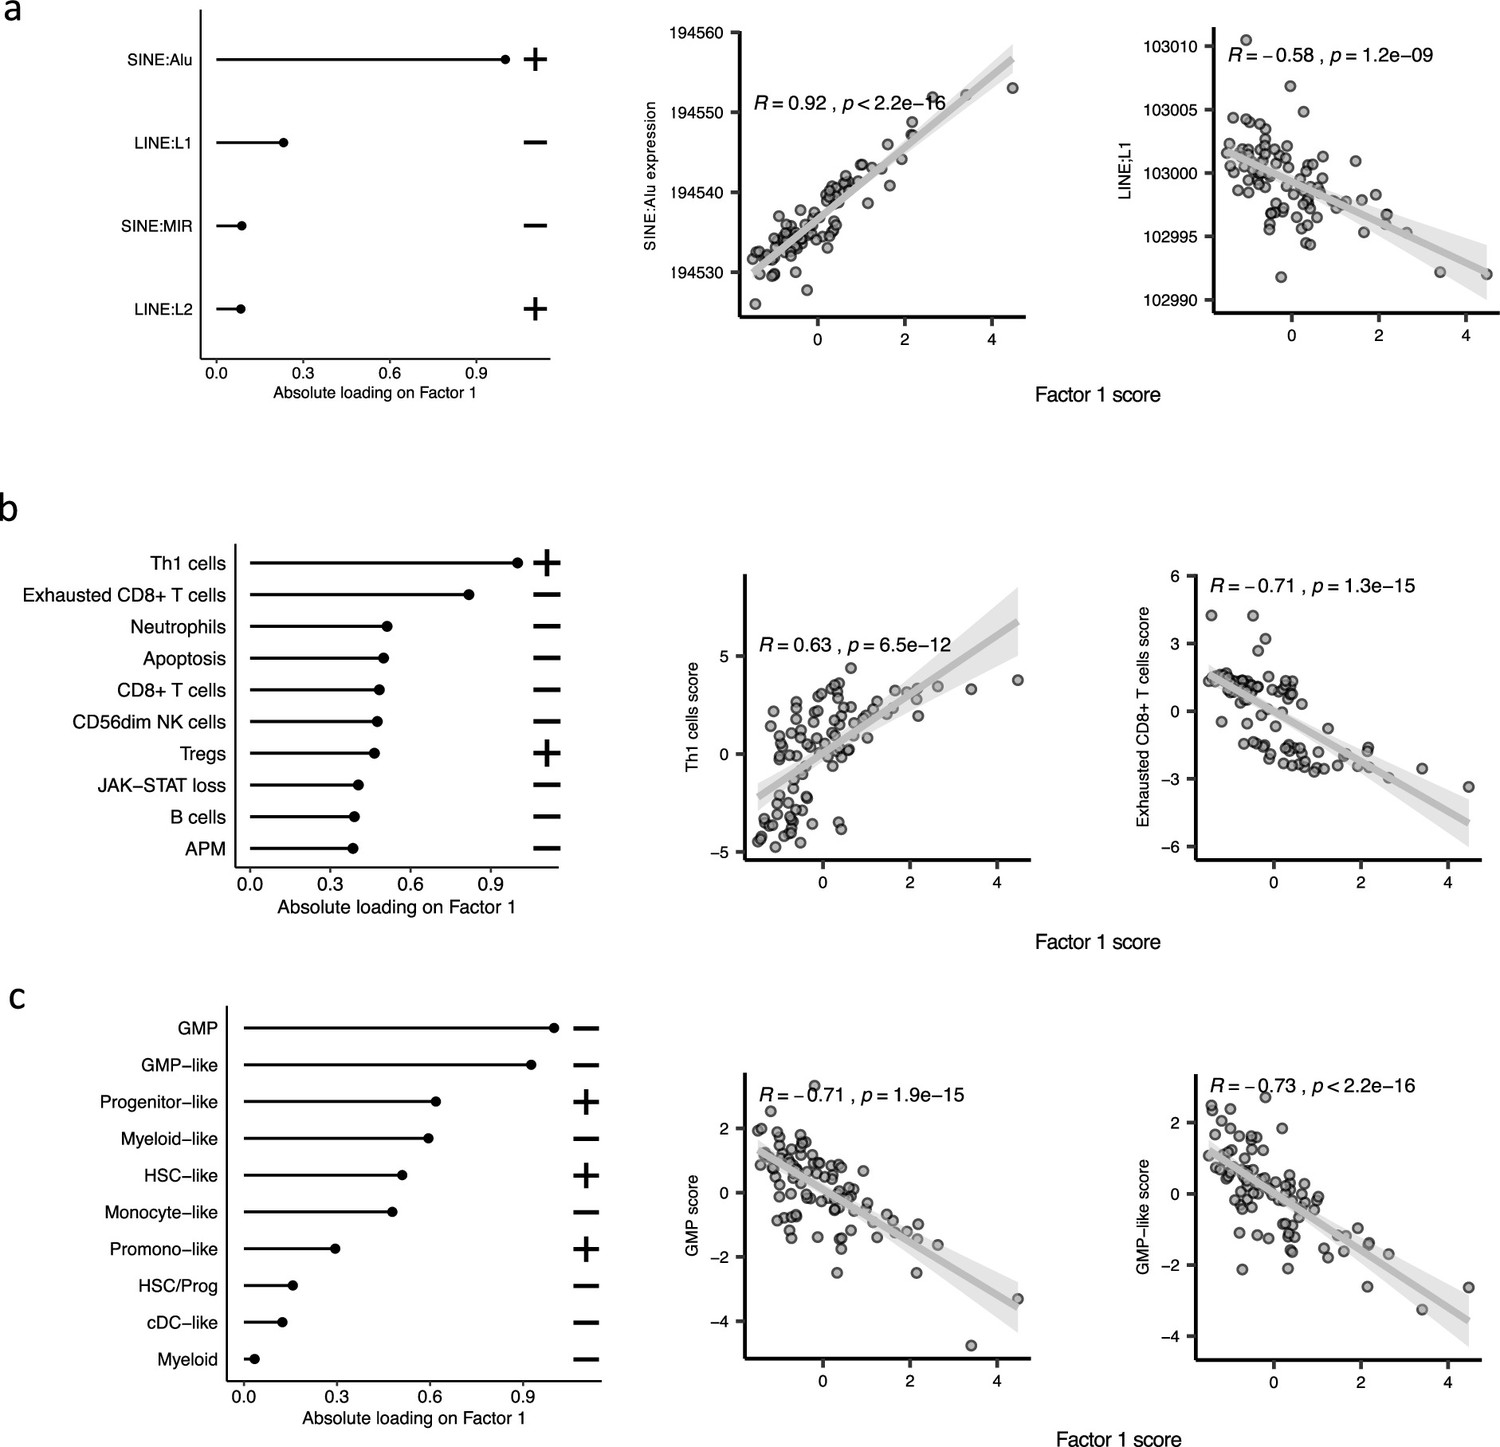
The top features influencing Factor 1 form various biological views in the bone marrow mononuclear cell (BMMNC) cohort.
(a–c) Absolute loadings of the top features and their positive or inverse correlations with Factor 1 from retrotransposable element (RTE) expression, immune profile, and cell-type biological views, respectively. Pearson correlation coefficients (R) and p-values were displayed on top of the scatter plots.
Figure 2—figure supplement 3
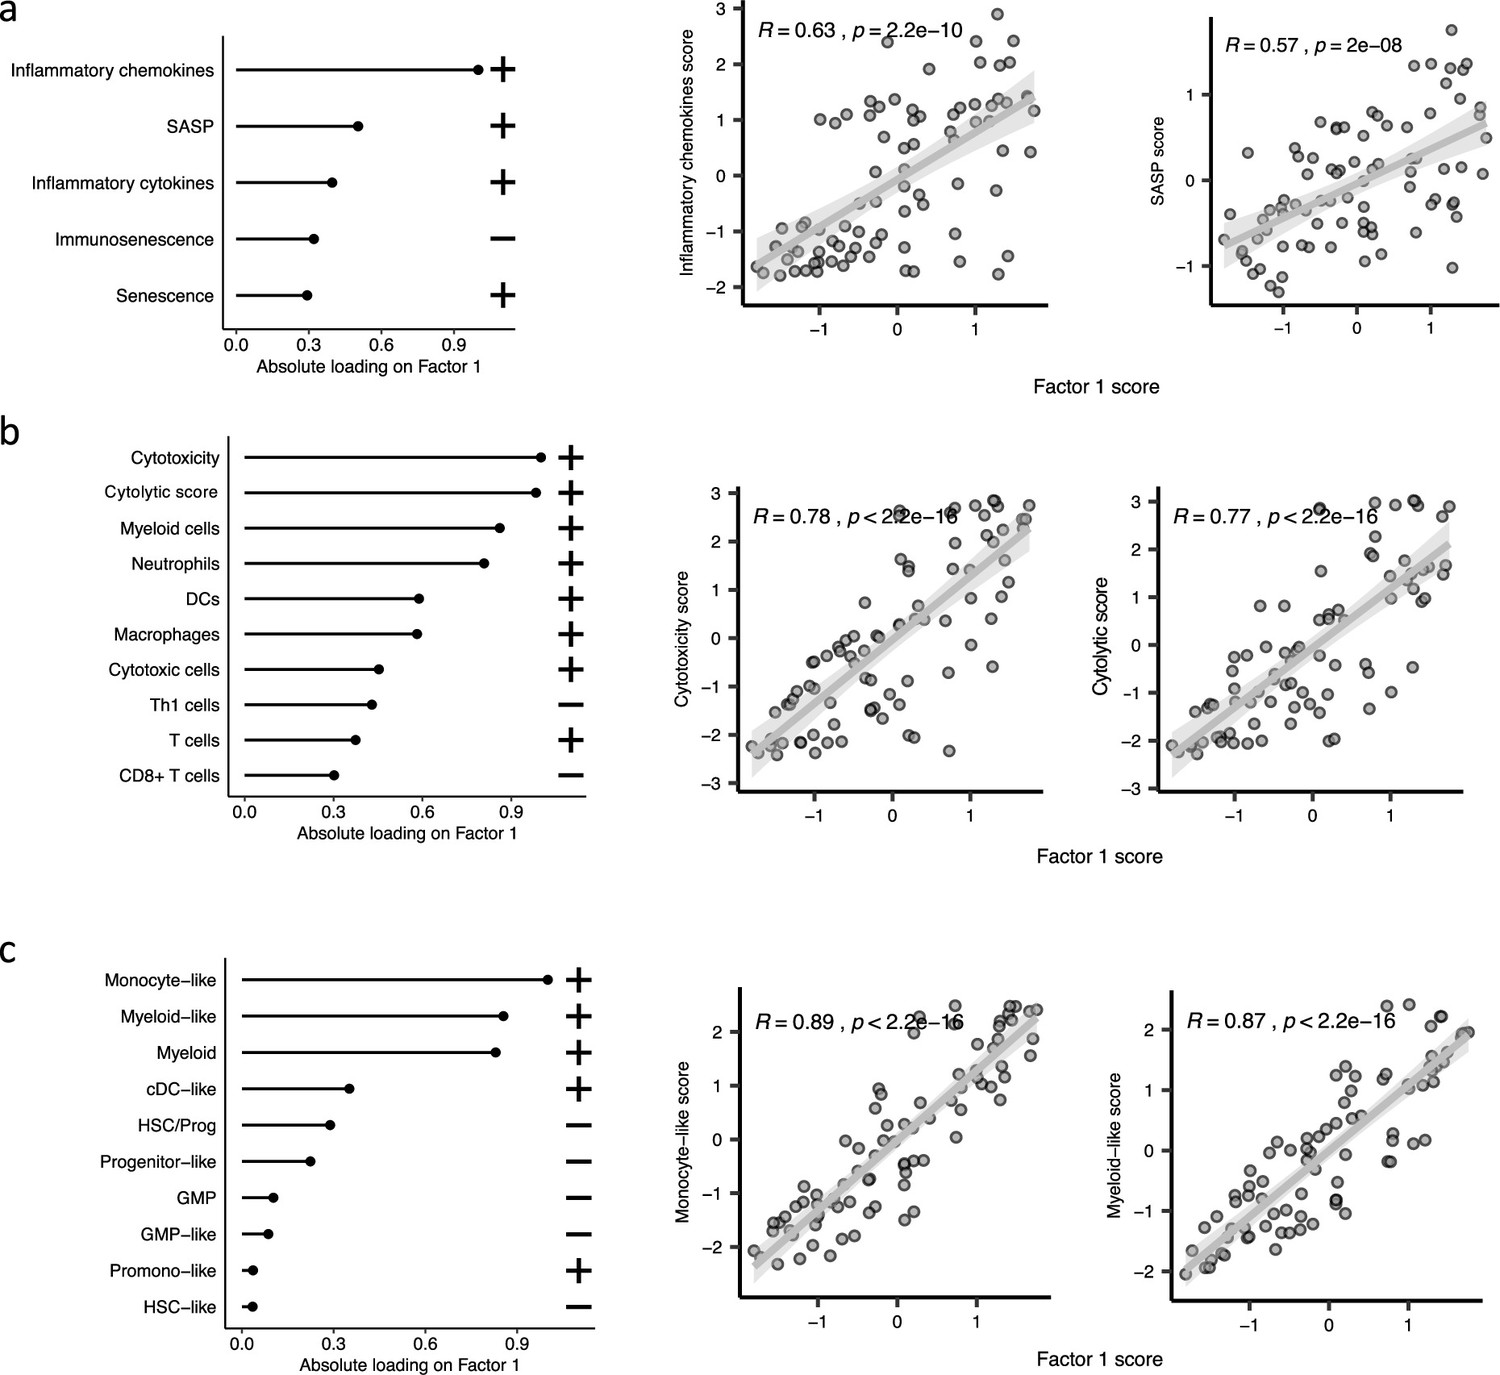
The top features influencing Factor 1 form various biological views in the CD34 + cohort.
(a–c), Absolute loadings of the top features and their positive or inverse correlations with Factor 1 from inflammation/aging, immune profile, and cell-type biological views, respectively. Pearson correlation coefficients (R) and p-values were displayed on top of the scatter plots.
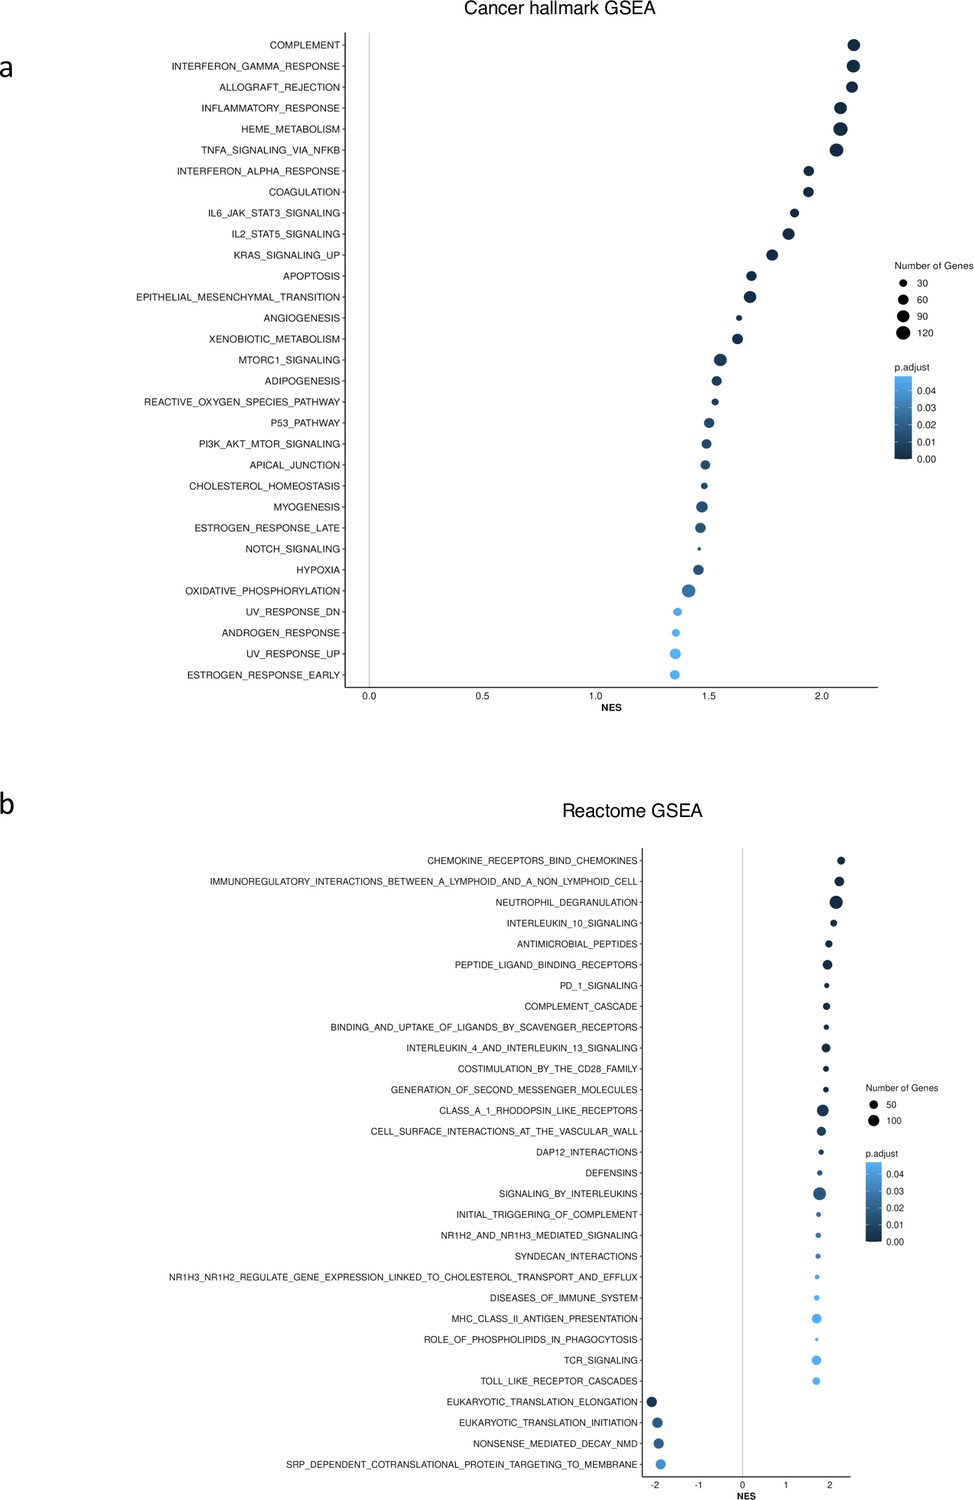
Figure 2—figure supplement 4
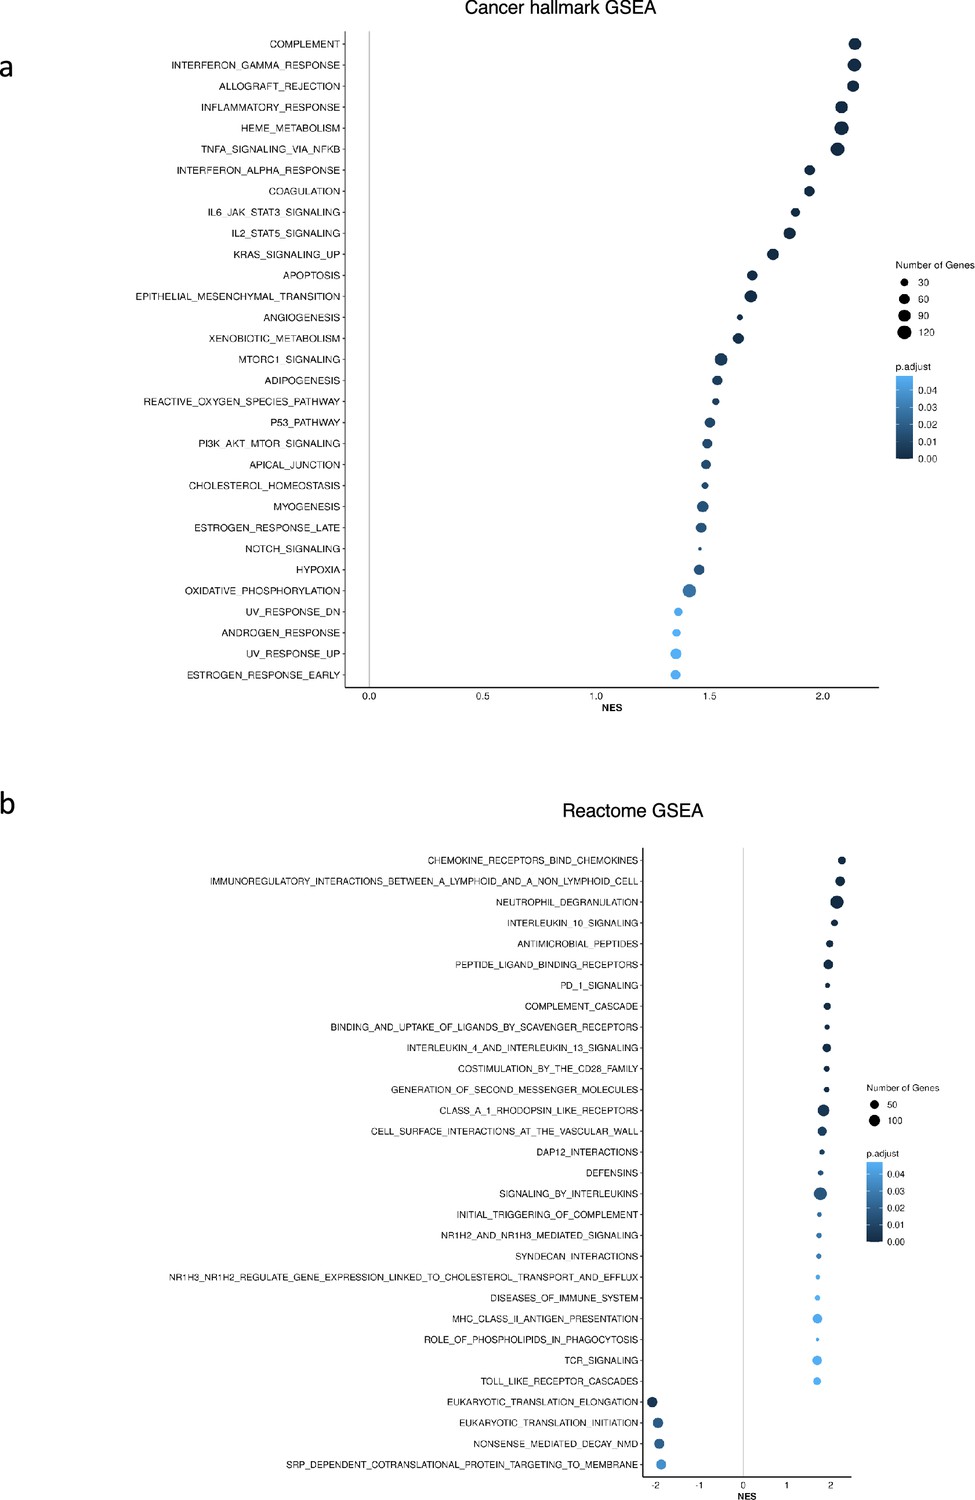
Gene set enrichment analysis (GSEA) identified upregulation of inflammation related pathways in patients having high (fourth quartile) versus low (first quartile) levels of Factor 1 in the CD34 + cohort.
(a), Upregulation of inflammatory, Interferons, TNFA, and JAK-STAT signalling pathways within cancer hallmark gene sets. (b) GSEA analysis using Reactome gene sets shows upregulation of gene sets associated with chemokines, Neutrophils deregulation, and IL10 signalling.
Figure 2—figure supplement 5
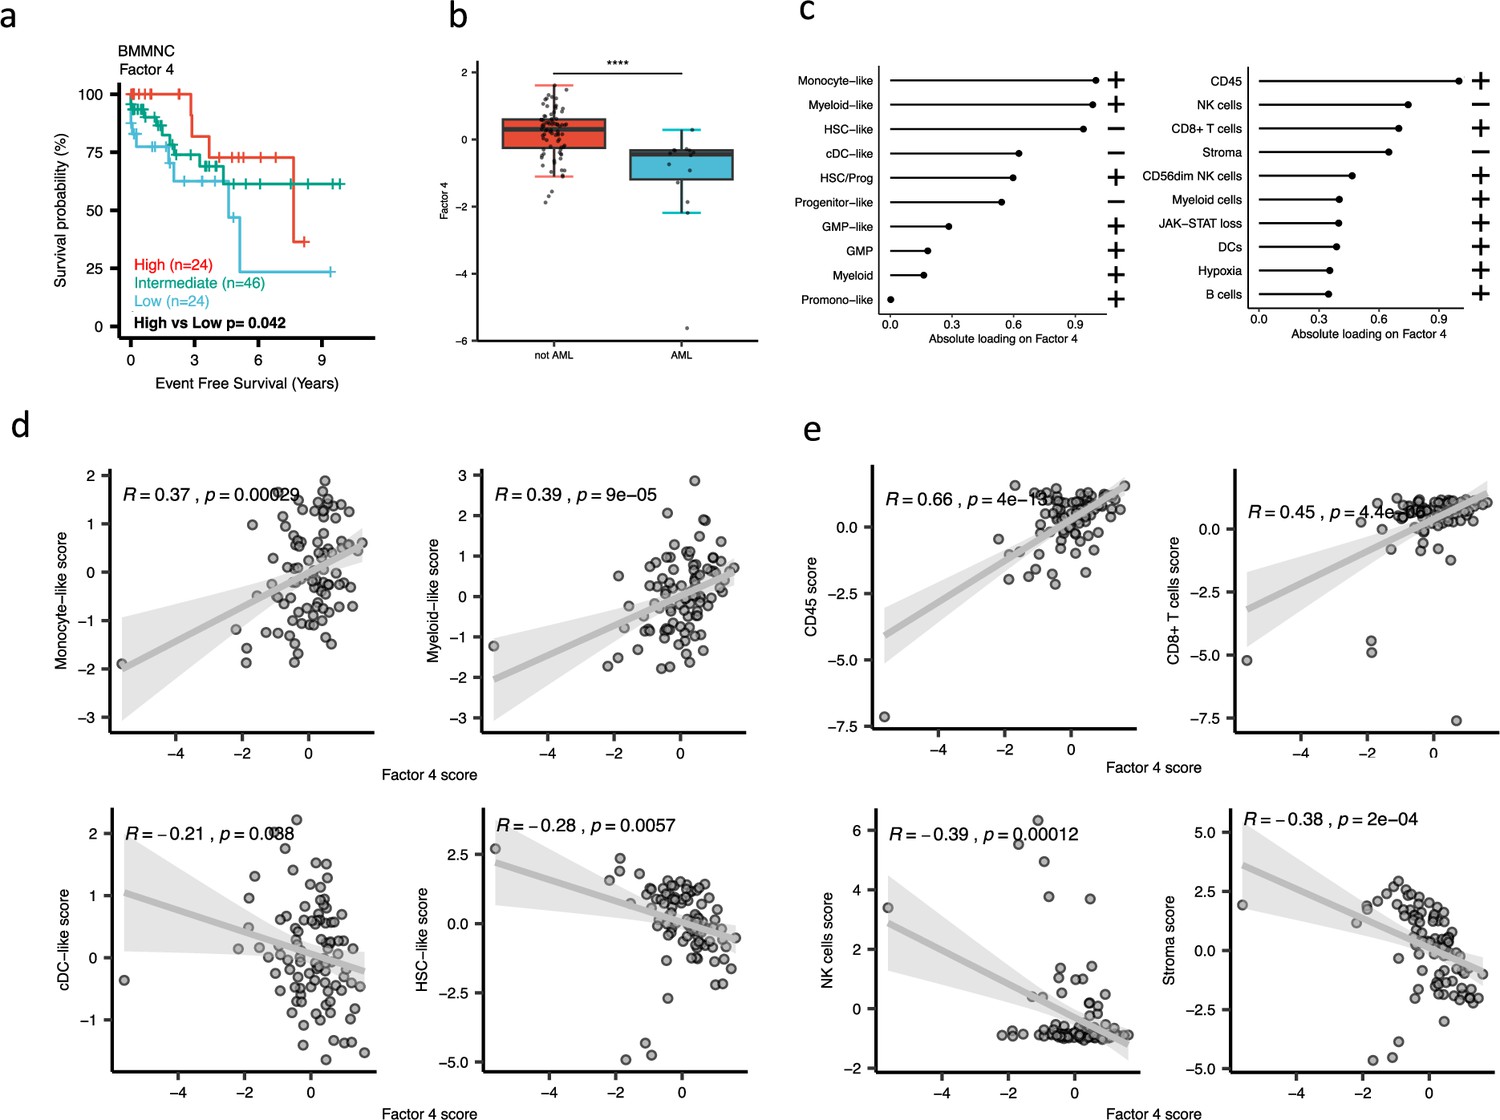
Characterisation of Factor 4 in the bone marrow mononuclear cell (BMMNC) cohort using gene signatures from multiple biological views.
(a) Kaplan-Meier plots for the BMMNC cohort where patients were split based on low (first quartile), intermediate (second and third quartile), and high (fourth quartile) levels of Factor 4. The p-value was calculated using a log-rank test on event-free survival values of high versus low groups. (b) Boxplot depicting a low level of Factor 4 for patients who progressed to AML. The significance was calculated with the Wilcox rank-sum test, and the significance was shown by **** (p<0.0001). (c) The absolute loading of the top features affecting Factor 4 in cell-type composition and immunology biological views in the BMMNC cohort. (d, e) Positive or inverse correlations of selected top factors from the cell-type composition and immunology biological views with Factor 4. Pearson correlation coefficients (R) and p-values were displayed on top of the scatter plots.
Figure 3
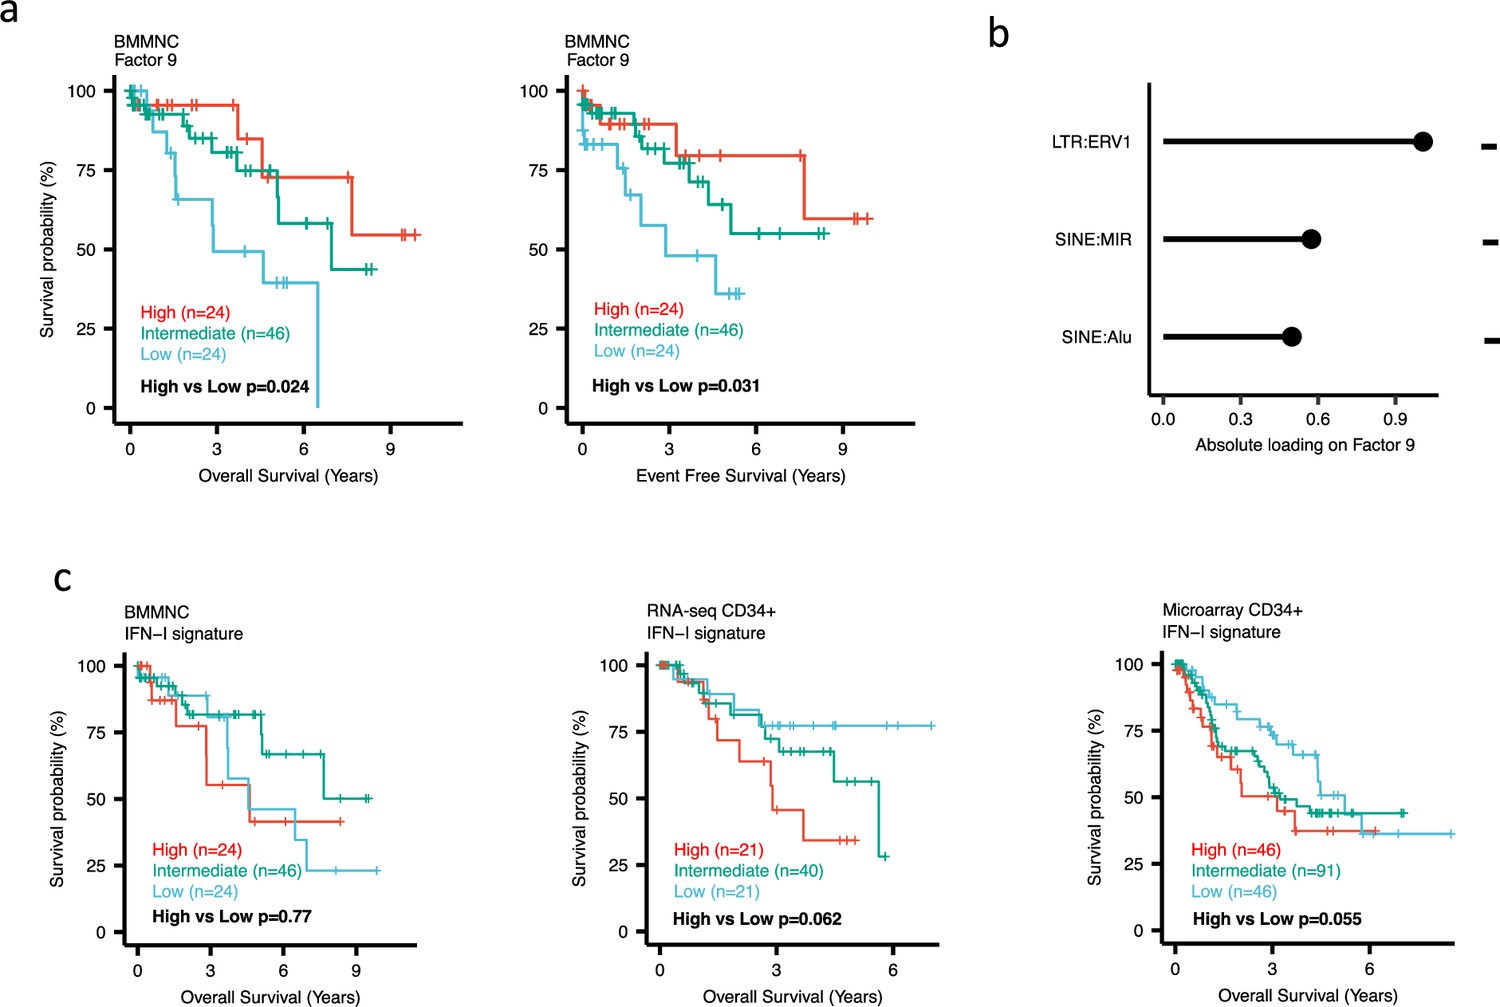
Impact of Factors 9 and IFN-I levels on myelodysplastic syndromes (MDS) prognosis.
(a) Kaplan-Meier plots for the bone marrow mononuclear cell (BMMNC) cohort where patients were split based on low (first quartile), intermediate (second and third quartile), and high (fourth quartile) levels of Factor 9. (b) The absolute loading of the top three features affecting Factor 9 in retrotransposable element (RTE) expression view in the BMMNC cohort. (c) Kaplan-Meier plots where patients were split into quartiles (high 25%, low 25%, and intermediate 50%) for survival analyses depending on their IFN-I signature score levels in the BMMNC, RNA-seq CD34+, and Microarray CD34 + cohorts. All p-values were calculated using a log-rank test on overall and event-free survival values of high versus low groups.
Figure 4
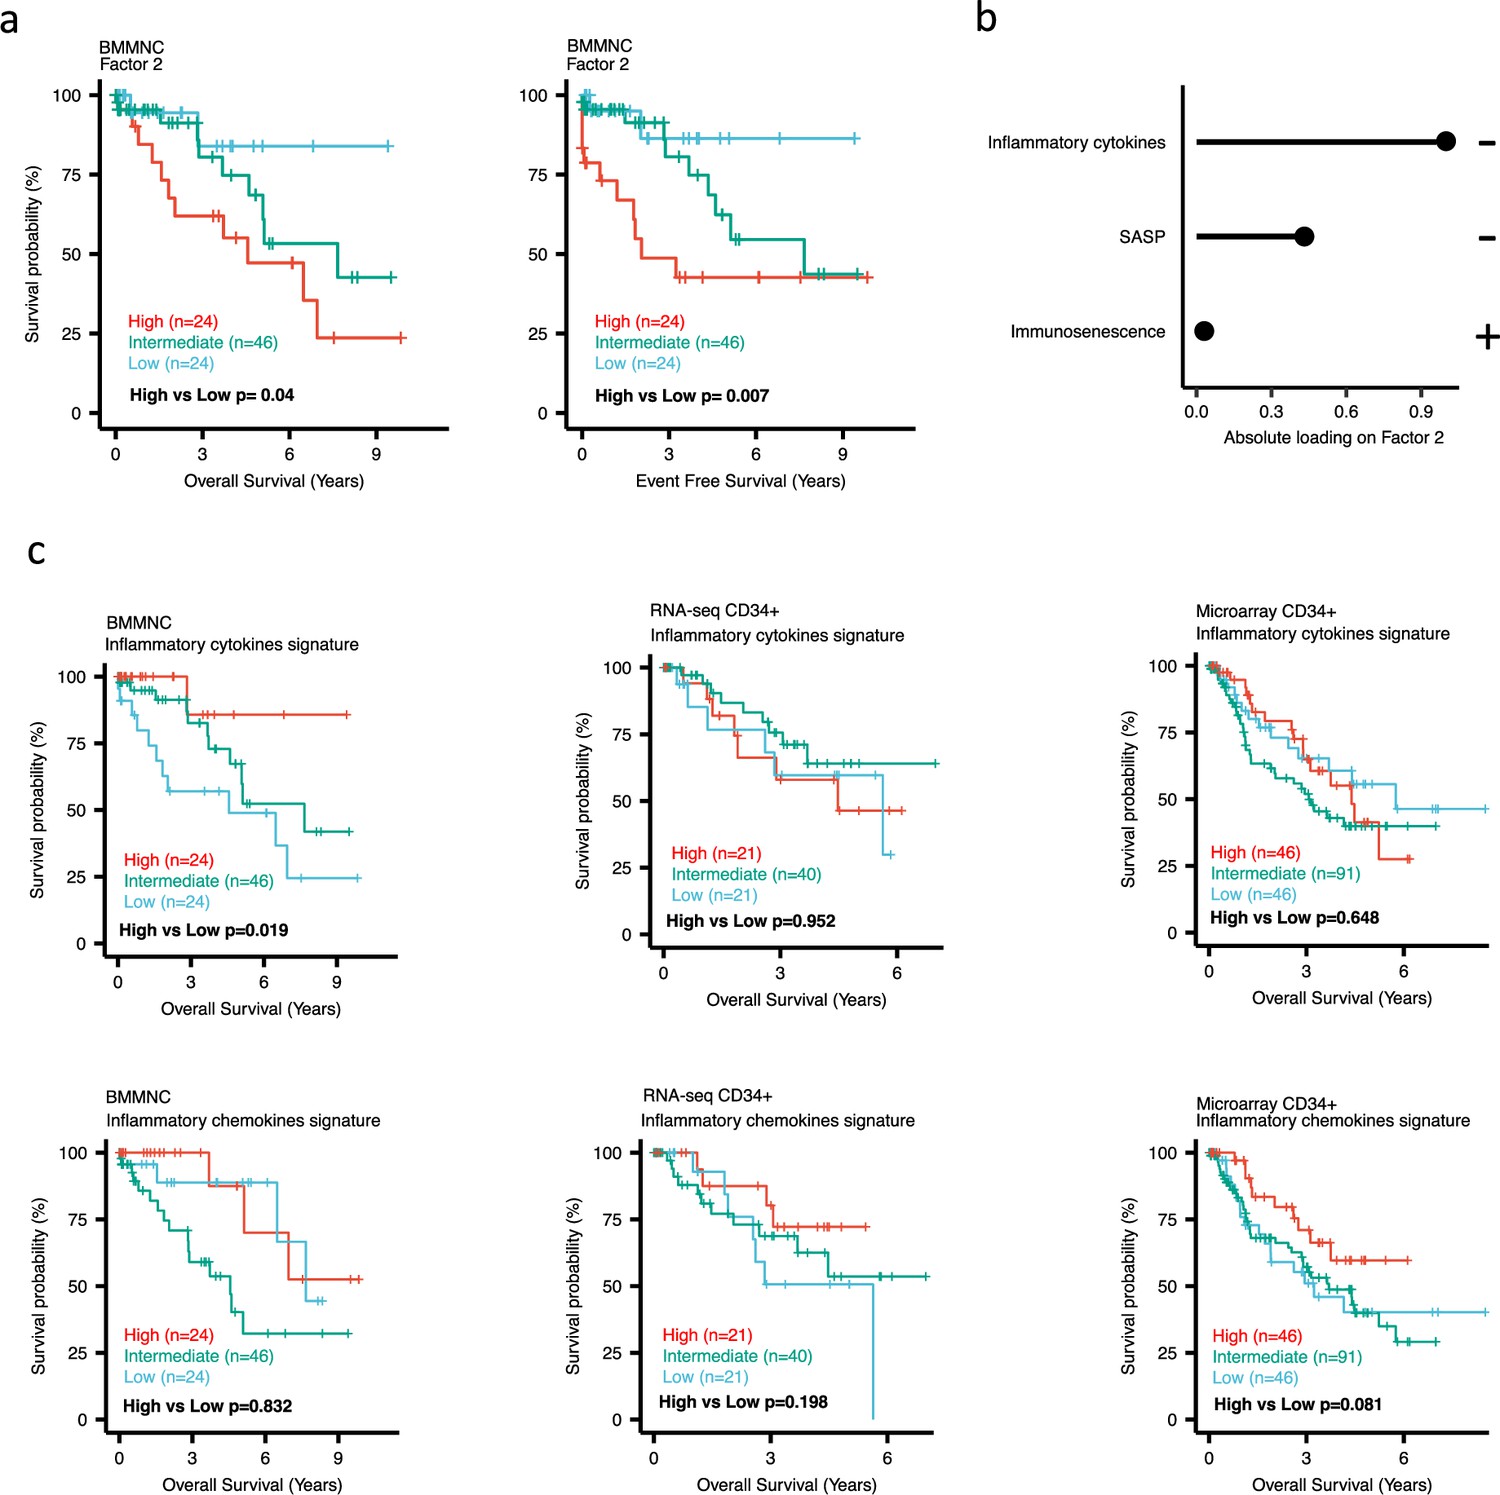
Impact of Factors 2 and inflammation levels on myelodysplastic syndromes (MDS) prognosis.
(a) Kaplan-Meier plots for the bone marrow mononuclear cell (BMMNC) cohort where patients were split based on low (first quartile), intermediate (second and third quartile), and high (fourth quartile) levels of Factor 2. (b) The absolute loading of the top three features affecting Factor 2 in inflammation/aging biological view in the BMMNC cohort. (c) Kaplan-Meier plots where patients were split into quartiles (high 25%, low 25%, and intermediate 50%) for survival analyses depending on their inflammatory cytokines and chemokines levels in the BMMNC, RNA-seq CD34+, and Microarray CD34 + cohorts. All p-values were calculated using a log-rank test on overall and event-free survival values of high versus low groups.
Figure 5 with 1 supplement
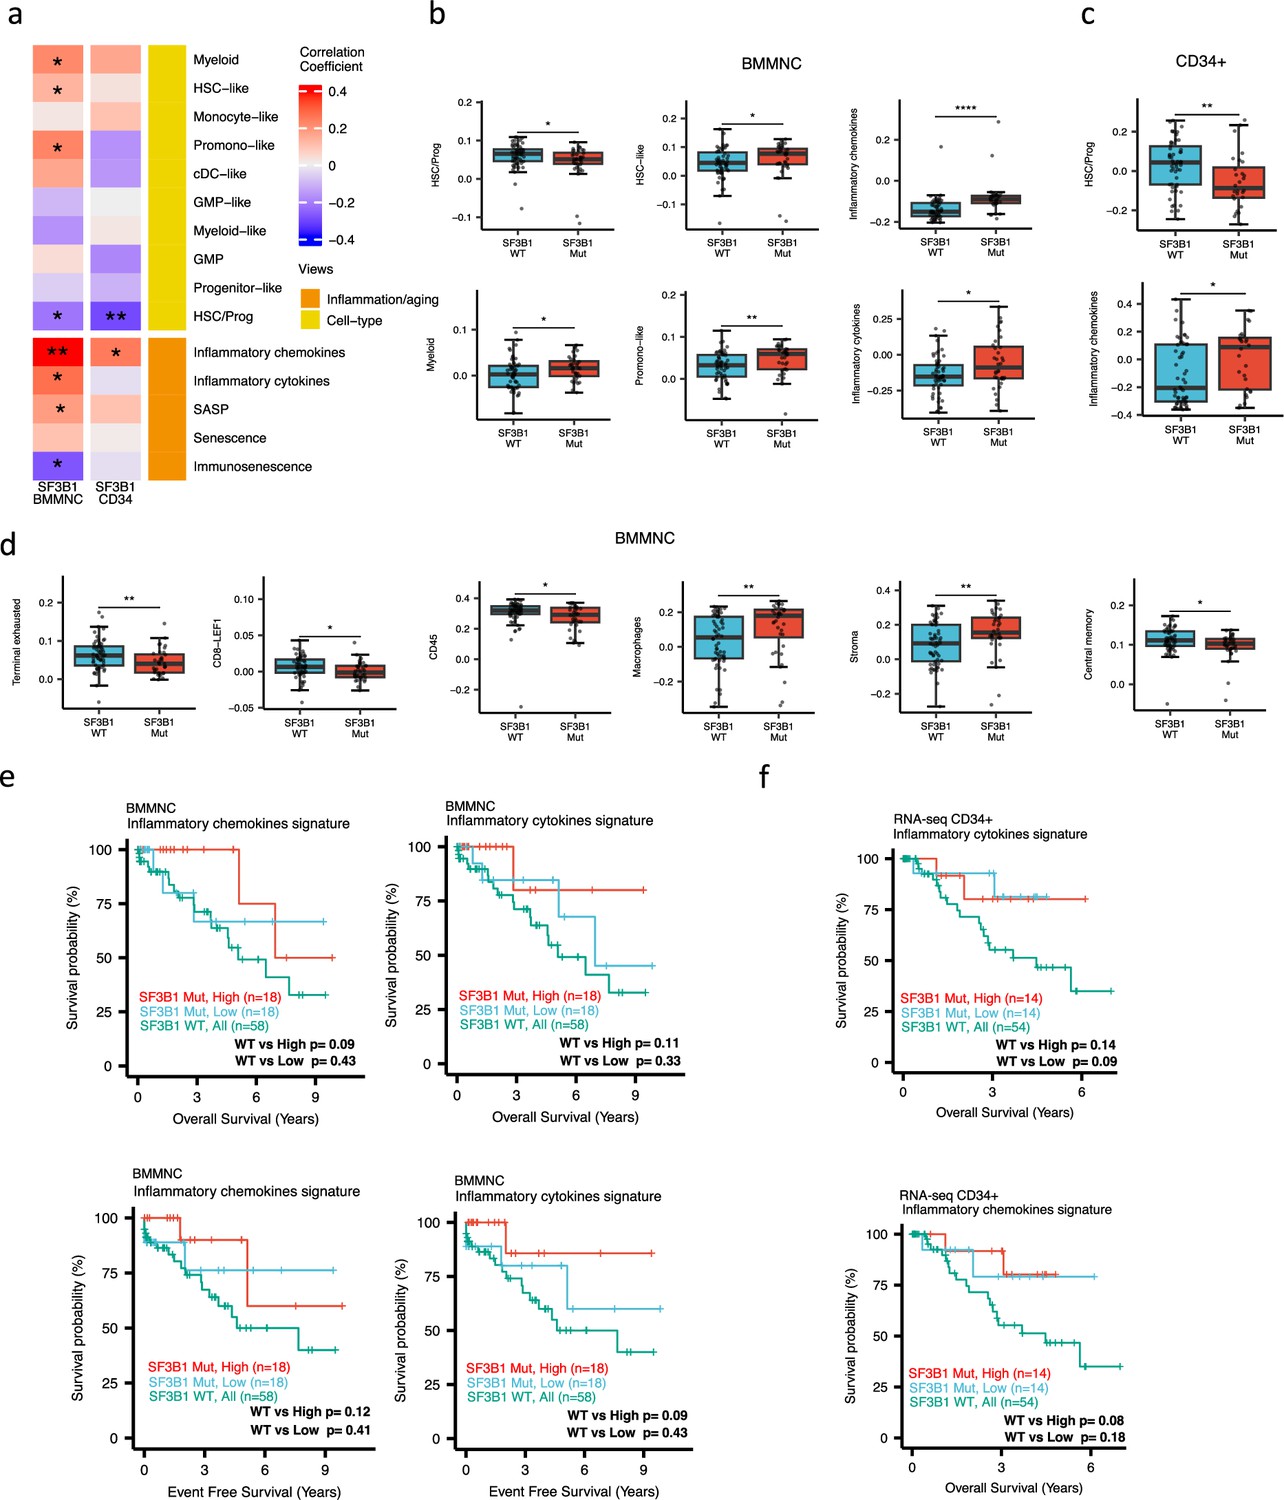
Characterisation of SF3B1 mutant myelodysplastic syndrome (MDS) using gene signatures from multiple biological views.
(a) Association of a subset of inflammation/aging and cell-type features with SF3B1 mutation in the BMMNC and bone marrow (BM) CD34 + cohorts, with red depicting a positive correlation and blue an inverse correlation with SF3B1 mutation. The significances were calculated with the Wilcox rank-sum test, and the significant associations were shown by * (p<0.05), ** (p<0.01), or *** (p<0.001). (b, c) Boxplots comparing the levels of the significant individual features from the cell type and inflammation/aging biological views for SF3B1 mutant versus SF3B1 wild-type (WT) cases in the BMMNC (nMut = 36 vs. nWT = 58) and CD34+ (nMut = 28 vs. nWT = 54) cohorts. (d) Boxplots comparing the levels of the significant individual features from the immune profile biological views for SF3B1 mutant versus SF3B1 WT cases in the BMMNC cohort. (e, f) Kaplan-Meier plots displaying overall and event-free survivals for SF3B1 mutant cases split by high and low levels of inflammatory cytokines and chemokines versus SF3B1 mutant WT in the BMMNC and CD34+ cohorts. Event-free survival data was only available for the BMMNC cohort. All p-values were calculated using a log-rank test on overall and event-free survival values of SF3B1 mutant high and low versus wild-type (WT) groups.
Figure 5—figure supplement 1
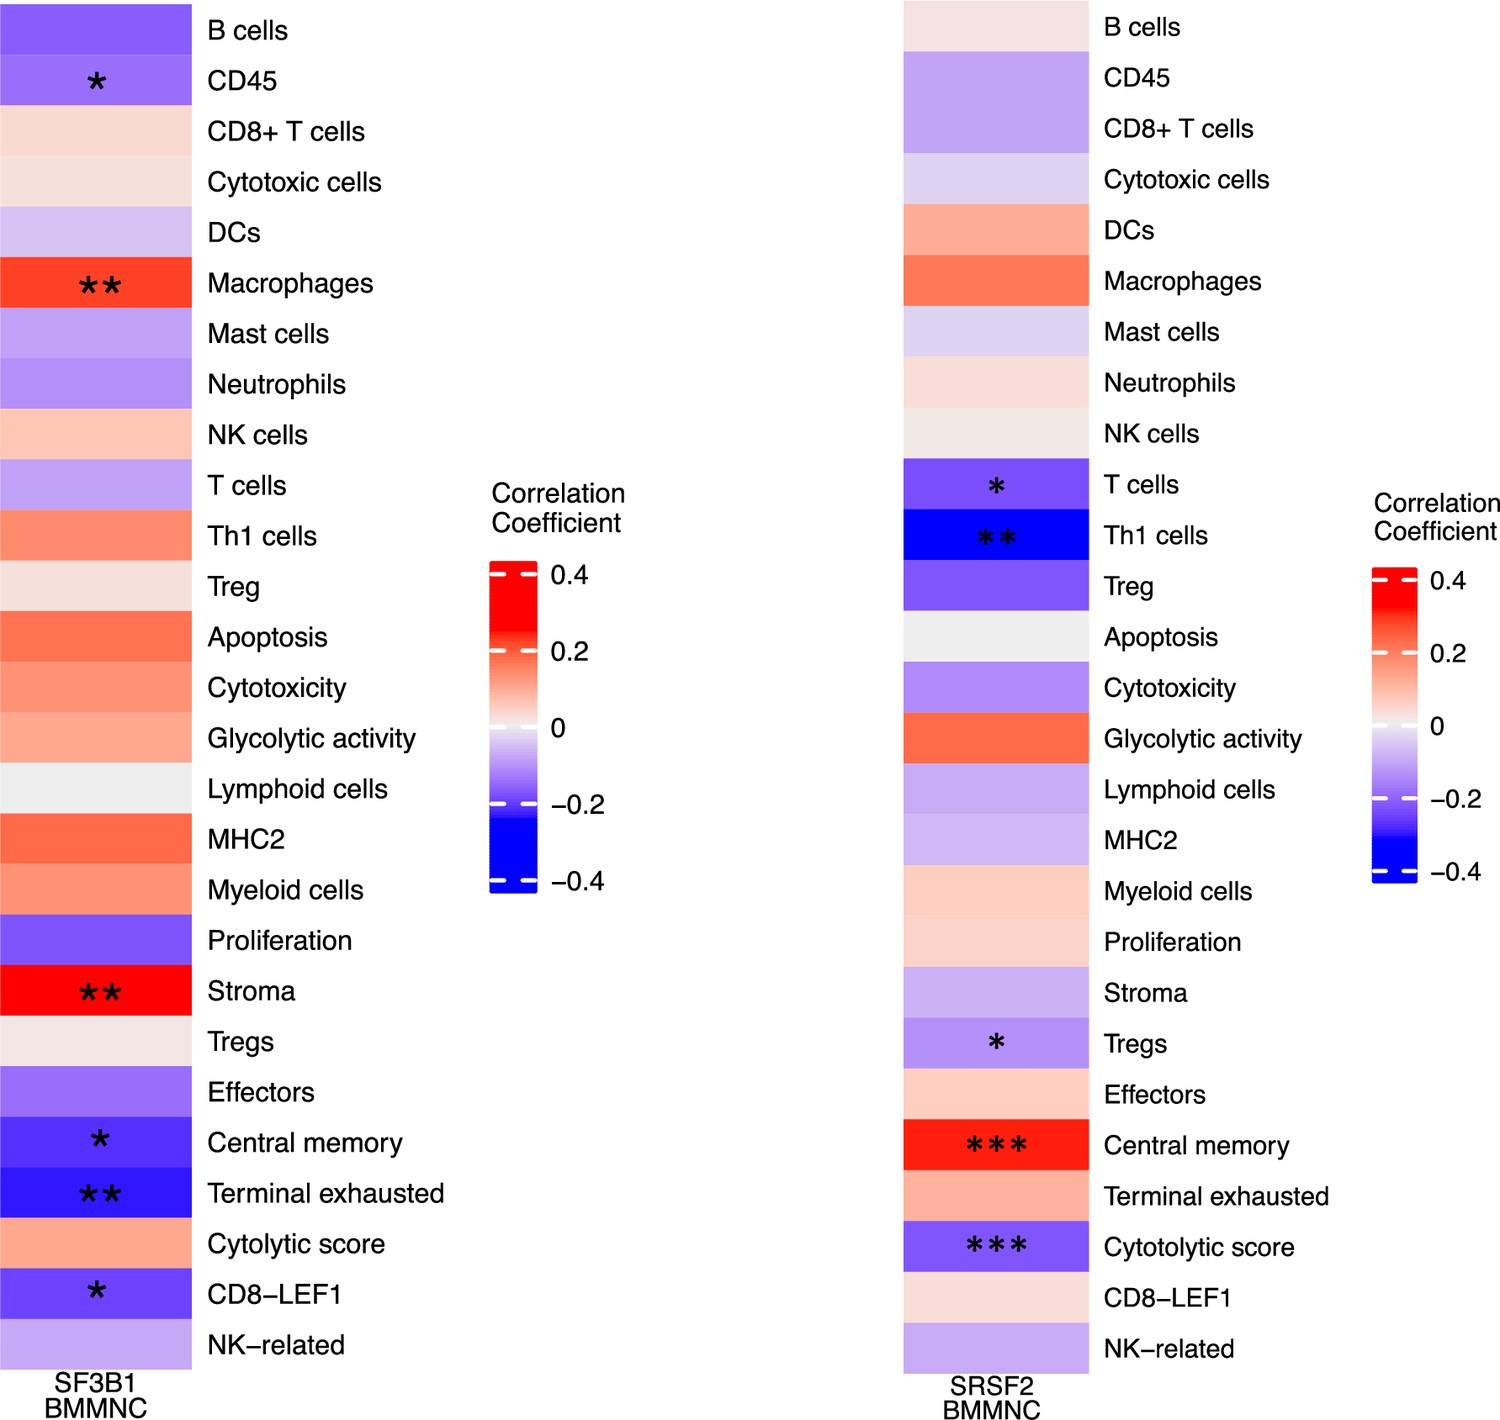
Correlation of selected immune profile gene sets with SF3B1 and SRSF2 mutations in the myelodysplastic syndromes (MDS) bone marrow mononuclear cell (BMMNC) cohort.
(a–b) Correlation of a subset of immune profile features with SF3B1 and SRSF2 mutations in the BMMNC cohort, with red depicting a positive correlation and blue an inverse correlation with these mutations. The significances were calculated with the Wilcox rank-sum test, and the significant associations were shown by *(p<0.05), **(p<0.01), or ***(p<0.001).
Figure 6 with 1 supplement
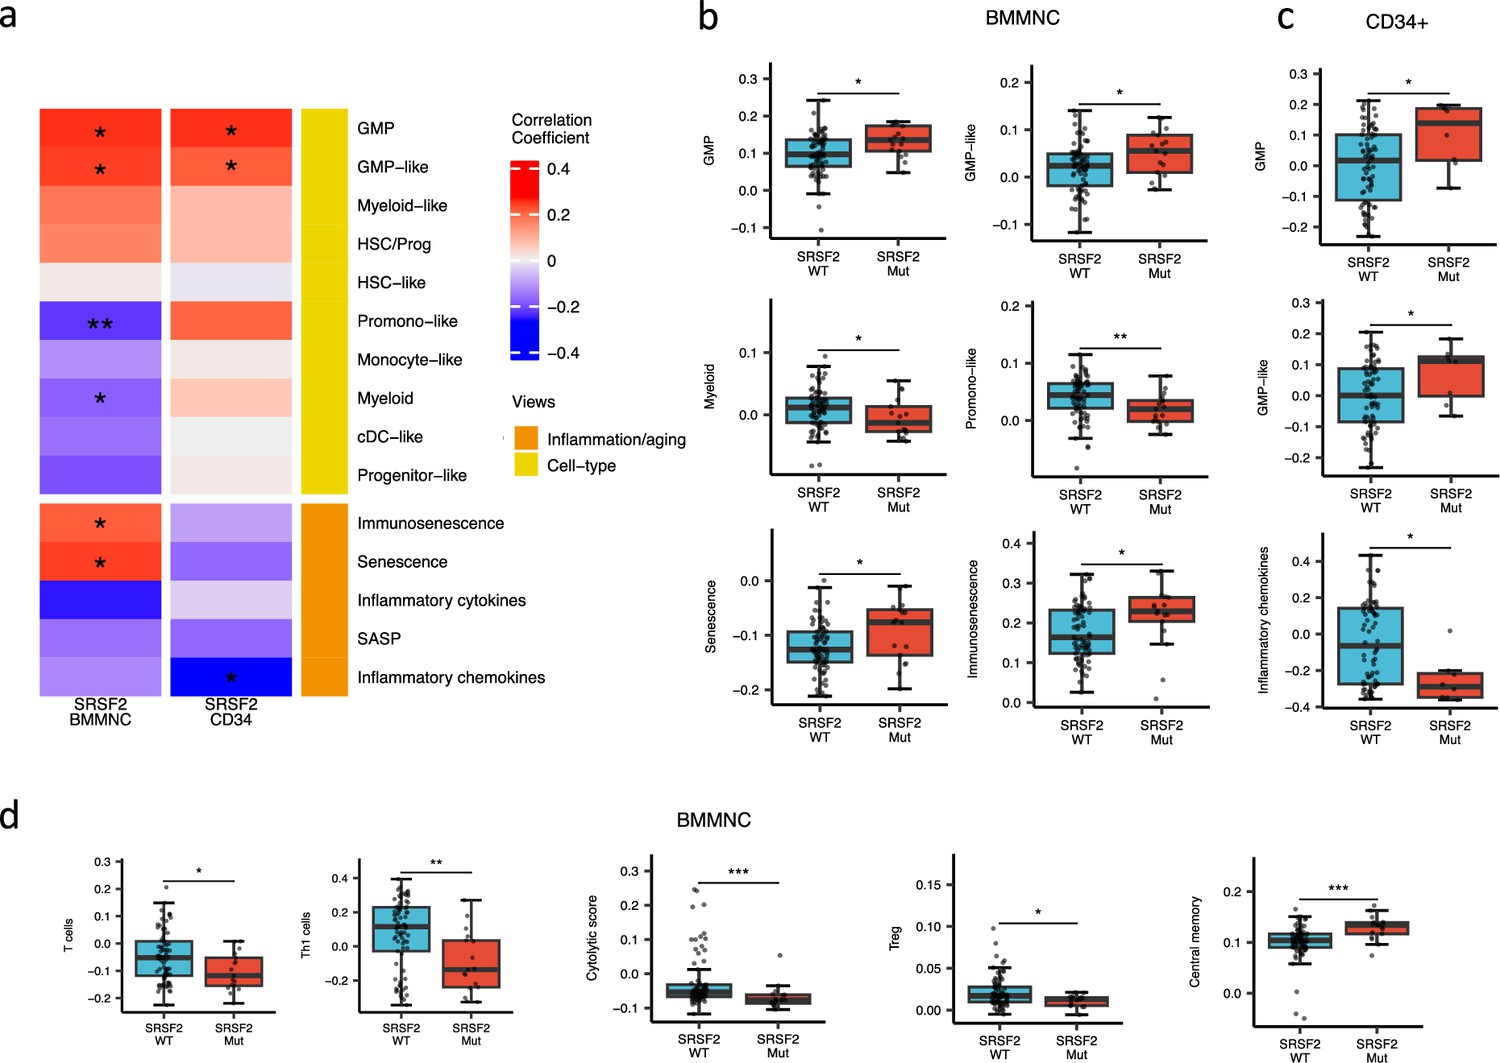
SRSF2 mutant myelodysplastic syndrome (MDS) is catheterised by high GMP content and high levels of senescence and immunosenescence.
(a) Association of a subset of inflammation/aging and cell-type features with SRSF2 mutation in the bone marrow mononuclear cell (BMMNC) and bone marrow (BM) CD34 + cohorts, with red depicting a positive correlation and blue an inverse correlation with SRSF2 mutation. The significances were calculated with the Wilcox rank-sum test, and the significant associations were shown by * (p<0.05), ** (p<0.01), or *** (p<0.001). (b–c) Boxplots comparing the levels of the significant individual features from the cell-type and inflammation/aging biological views for SRSF2 mutant versus SRSF2 wild-type (WT) cases in the BMMNC (nMut = 17 vs. nWT = 77) and CD34+ (nMut = 8 vs. nWT = 74) cohorts, respectively. (d) Boxplots comparing the levels of the significant individual features from the immune profile biological views for SRSF2 mutant versus SRSF2 WT cases in the BMMNC cohort.
Figure 6—figure supplement 1
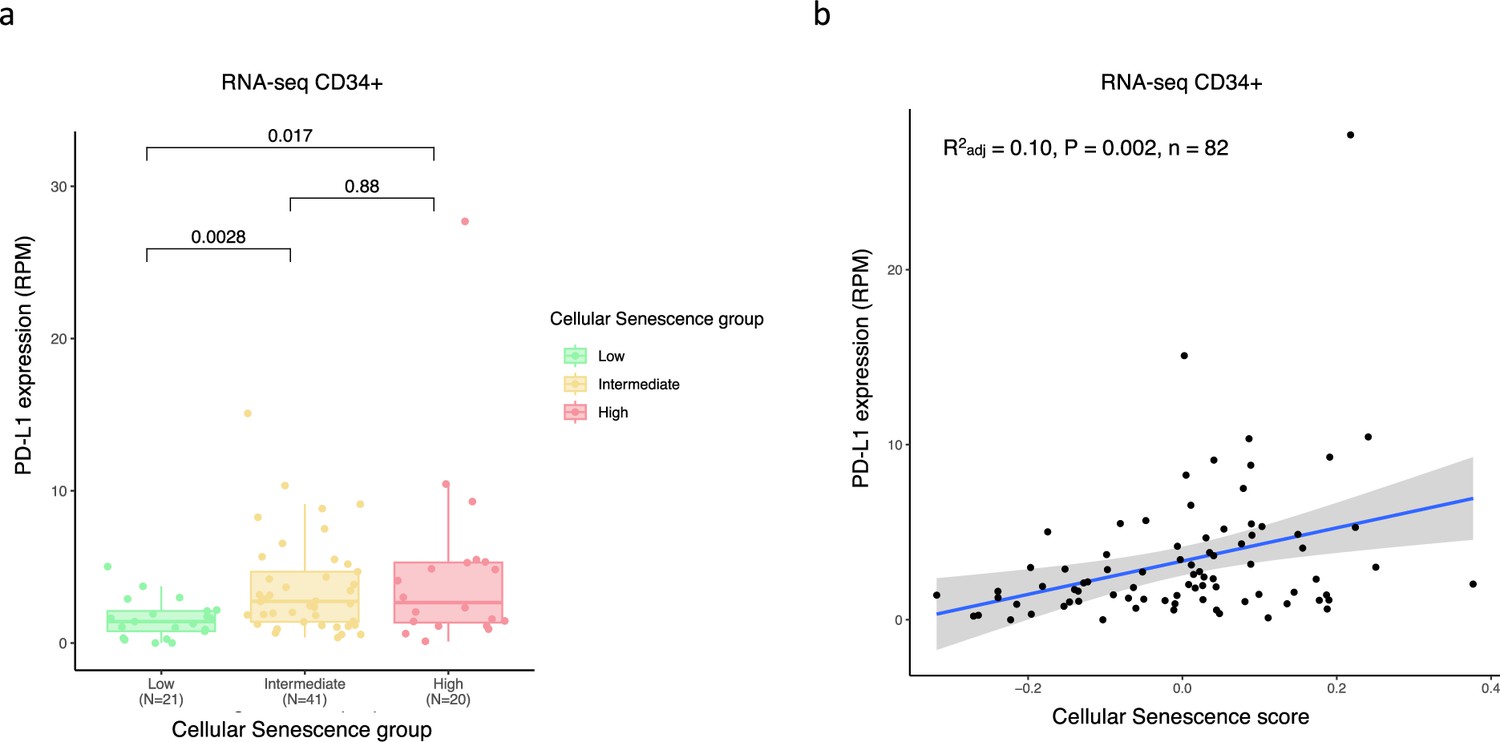
Positive correlation between programmed death-ligand 1 (PD-L1) expression and senescence score in bone marrow (BM) CD34 + RNA seq cohort.
(a) Boxplot showing higher expression of PD-L1 gene in patient groups with high (fourth quartile) and intermediate (second and third quartile) vs low (firstt quartile) senescence levels. The significances were calculated with the Wilcox rank-sum. (b) Scatter plot displaying a positive correlation between PD-L1 expression and senescence score.
Author response image 1
GSEA showed no upregulation of inflammation and interferon pathways for SF3B1 and SRSF2 mutant in CD34+ cohort.
Author response image 2

Comparison of IPSS-R risk categories and MOFA risk and protective factors.
Author response image 3

Cellular composition gene signature scores for CMML and SRSF2 mutant versus other cases.
CMML cases with SRSF2 mutation show a significant higher level of GMP and GMP-like scores compared to other MDS cases.
Tables
Table 1
Association of Factors in the bone marrow mononuclear cell (BMMNC) cohort to overall survival and event-free survival.
Univariate and multivariate (controlling for sex and age) Cox regression were undertaken for patients in the BMMNC cohort to determine the relationship between the identified multi-omics factor analysis (MOFA) factors and overall survival (OS)/event-free survival (EFS). The regression was done using 95% confidence intervals, with the outcome shown as hazard ratios (HR). The table depicts P-values for both univariate and multivariate analyses for each Factor. Statistical significance was achieved with Factors 2, 4, and 9 for univariate and/or multivariate Cox regression analyses.
| Overall survival | Event-free survival | |||||||
|---|---|---|---|---|---|---|---|---|
| Univariate | Multivariate | Univariate | Multivariate | |||||
| Factors | Hazard ratio (CI) | p-value | Hazard ratio (CI) | p-value | Hazard ratio (CI) | p-value | Hazard ratio (CI) | p-value |
| Factor 1 | 0.74 (0.47–1.18) | 0.209 | 0.36 (0.16–0.81) | 0.013* | 0.76 (0.48–1.20) | 0.242 | 0.69 (0.34–1.38) | 0.294 |
| Factor 2 | 1.55 (0.95–2.53) | 0.082 | 1.64 (0.71–3.78) | 0.248 | 1.70 (1.04–2.77) | 0.033* | 2.27 (1.07–4.81) | 0.033* |
| Factor 3 | 0.56 (0.22–1.41) | 0.218 | 0.33 (0.07–1.54) | 0.157 | 0.47 (0.18–1.22) | 0.121 | 0.28 (0.06–1.34) | 0.11 |
| Factor 4 | 0.41 (0.26–0.65) | <0.001* | 0.39 (0.17–0.90) | 0.028* | 0.48 (0.34–0.66) | <0.001* | 0.66 (0.36–1.20) | 0.176 |
| Factor 5 | 0.76 (0.52–1.10) | 0.148 | 0.68 (0.40–1.15) | 0.148 | 0.80 (0.55–1.17) | 0.250 | 0.84 (0.49–1.44) | 0.527 |
| Factor 6 | 1.27 (0.85–1.91) | 0.238 | 1.26 (0.71–2.23) | 0.431 | 1.28 (0.85–1.93) | 0.230 | 1.21 (0.72–2.02) | 0.478 |
| Factor 7 | 1.05 (0.66–1.66) | 0.832 | 0.76 (0.40–1.44) | 0.4 | 0.98 (0.62–1.55) | 0.943 | 0.96 (0.56–1.64) | 0.879 |
| Factor 8 | 1.73 (1.06–2.82) | 0.029* | 1.08 (0.57–2.02) | 0.818 | 1.73 (1.07–2.79) | 0.025* | 1.23 (0.62–2.43) | 0.554 |
| Factor 9 | 0.56 (0.38–0.84) | 0.005* | 0.49 (0.28–0.85) | 0.012* | 0.59 (0.40–0.87) | 0.007* | 0.45 (0.26–0.80) | 0.007* |
| Factor 10 | 1.07 (0.69–1.67) | 0.757 | 0.76 (0.43–1.34) | 0.336 | 1.07 (0.69–1.66) | 0.755 | 0.76 (0.42–1.38) | 0.371 |
Table 2
Multiple linear regression analysis to study the association between various mutations (covariates) and inflammatory chemokines and cytokines.
SF3B1 mutation was the only mutation showing a significant association with the inflammatory chemokines level in the multiple linear regression model (p<0.001). The association between SF3B1 mutation and the inflammatory cytokines is also the most significant association among other mutations.
| Inflammatory chemokines | Inflammatory Cytokines | |||||||
|---|---|---|---|---|---|---|---|---|
| Genes | Estimates | Std. error | t-value | p-value | Estimate | Std. error | t-value | p-value |
| ASXL1 (n=21) | –0.001 | 0.019 | –0.036 | 0.972 | –0.052 | 0.039 | –1.319 | 0.191 |
| CBL (n=8) | –0.02 | 0.029 | –0.69 | 0.492 | –0.008 | 0.061 | –0.13 | 0.897 |
| CUX1 (n=9) | –0.006 | 0.027 | –0.218 | 0.828 | –0.091 | 0.057 | –1.596 | 0.115 |
| DNMT3A (n=7) | –0.042 | 0.029 | –1.437 | 0.155 | 0.025 | 0.062 | 0.401 | 0.69 |
| EZH2 (n=6) | 0.024 | 0.031 | 0.776 | 0.44 | –0.13 | 0.066 | –1.967 | 0.053 |
| IDH1 (n=5) | 0.017 | 0.038 | 0.453 | 0.652 | –0.01 | 0.081 | –0.128 | 0.898 |
| JAK2 (n=5) | –0.003 | 0.032 | –0.107 | 0.915 | 0 | 0.068 | –0.004 | 0.997 |
| RUNX1 (n=7) | –0.006 | 0.03 | –0.209 | 0.835 | –0.003 | 0.064 | –0.045 | 0.964 |
| SF3B1 (n=36) | 0.059 | 0.016 | 3.708 | <0.001*** | 0.081 | 0.034 | 2.38 | 0.020* |
| SRSF2 (n=17) | 0 | 0.025 | –0.009 | 0.993 | –0.044 | 0.054 | –0.814 | 0.418 |
| STAG2 (n=5) | –0.039 | 0.035 | –1.123 | 0.265 | –0.159 | 0.074 | –2.153 | 0.035* |
| TET2 (n=21) | 0.031 | 0.02 | 1.523 | 0.132 | 0.013 | 0.043 | 0.304 | 0.762 |
| U2AF1 (n=9) | 0.056 | 0.028 | 1.97 | 0.053 | 0.153 | 0.06 | 2.54 | 0.013* |
Additional files
-
Supplementary file 1
Details of two RNA-seq datasets for MDS.
- https://cdn.elifesciences.org/articles/97096/elife-97096-supp1-v1.xlsx
-
Supplementary file 2
Mutation occurrence in MDS cohorts.
- https://cdn.elifesciences.org/articles/97096/elife-97096-supp2-v1.xlsx
-
Supplementary file 3
List of gene sets from previously published articles.
- https://cdn.elifesciences.org/articles/97096/elife-97096-supp3-v1.xlsx
-
Supplementary file 4
Categorical and numeric clinical features that were used in MDS cohorts.
- https://cdn.elifesciences.org/articles/97096/elife-97096-supp4-v1.xlsx
-
Supplementary file 5
Univariate and multivariate Cox regression result for patients in the BM CD34 +cohort to determine the relationship between the identified MOFA factors and OS.
- https://cdn.elifesciences.org/articles/97096/elife-97096-supp5-v1.xlsx
-
MDAR checklist
- https://cdn.elifesciences.org/articles/97096/elife-97096-mdarchecklist1-v1.docx
Download links
A two-part list of links to download the article, or parts of the article, in various formats.
Downloads (link to download the article as PDF)
Open citations (links to open the citations from this article in various online reference manager services)
Cite this article (links to download the citations from this article in formats compatible with various reference manager tools)
Identification of novel myelodysplastic syndromes prognostic subgroups by integration of inflammation, cell-type composition, and immune signatures in the bone marrow
eLife 13:RP97096.
https://doi.org/10.7554/eLife.97096.3


