Resting natural killer cells promote the progress of colon cancer liver metastasis by elevating tumor-derived stem cell factor
- Department of General Surgery, The Second Affiliated Hospital and Yuying Children’s Hospital of Wenzhou Medical University, China
- Department of Microbiology and Immunology, Institute of Molecular Virology and Immunology, School of Basic Medical Sciences, Wenzhou Medical University, China
- Department of Pediatric Thoracic Surgery, The Second Affiliated Hospital and Yuying Children’s Hospital of Wenzhou Medical University, China
- Department of Thoracic Surgery, The First Affiliated Hospital of Wenzhou Medical University, China
- Department of General Surgery, The First Affiliated Hospital of Wenzhou Medical University, China
Figures
Figure 1 with 1 supplement
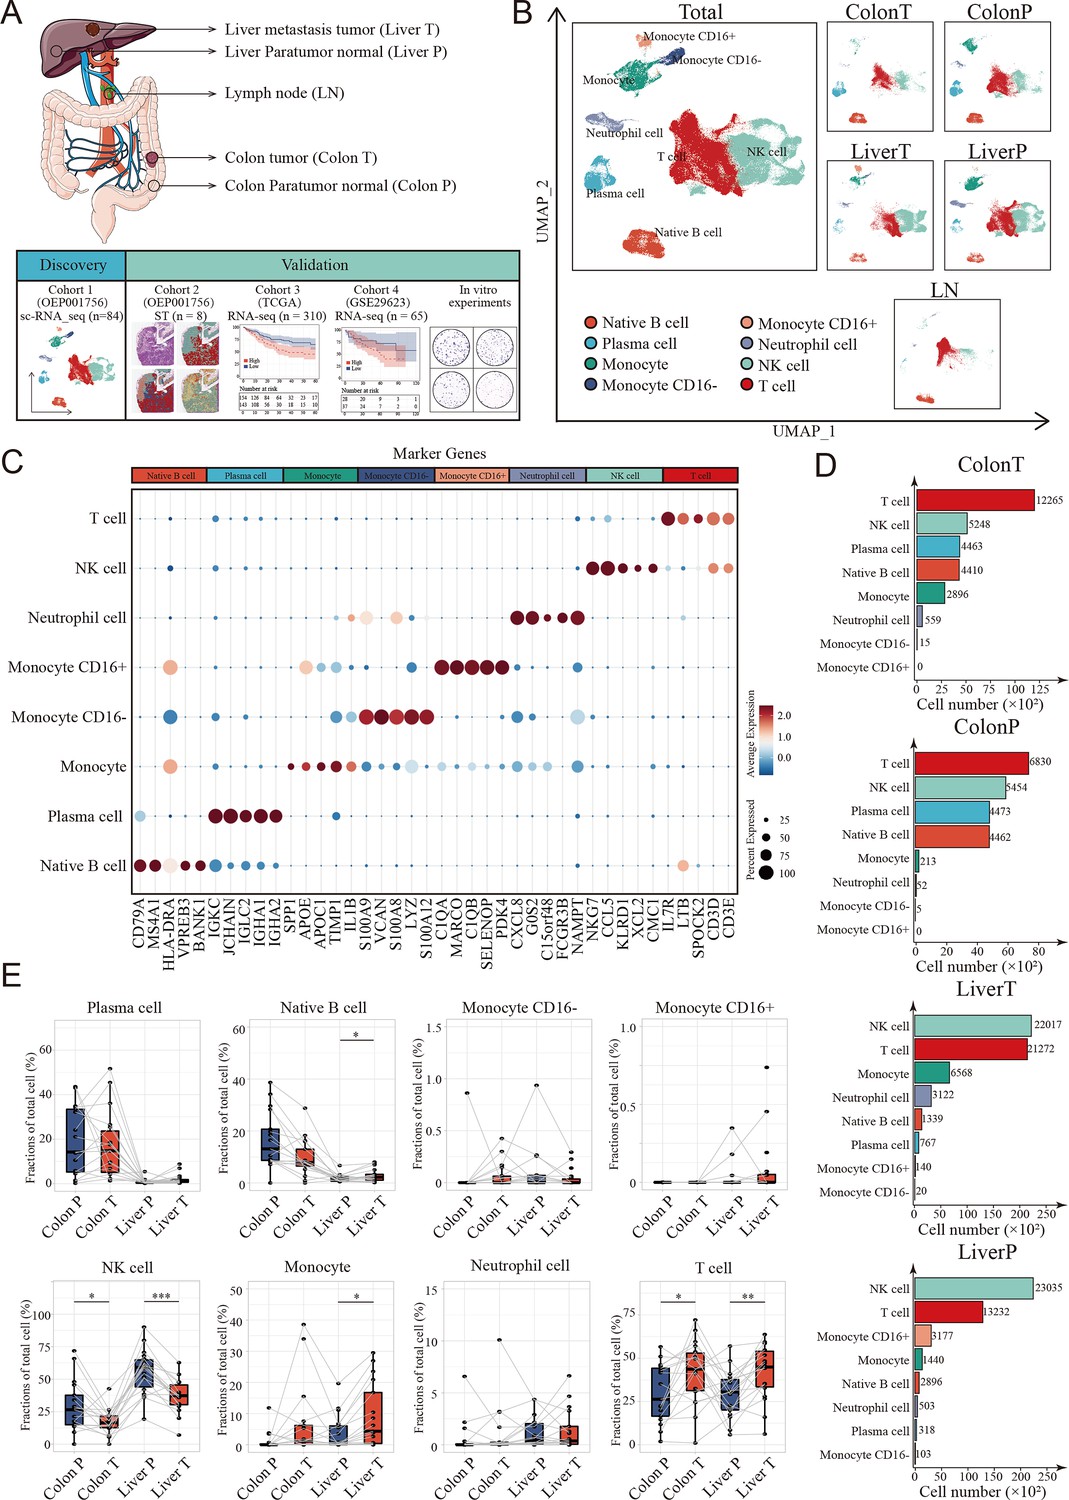
Landscape of tumor immune microenvironment in colon cancer liver metastasis (CCLM) revealed by single-cell transcriptomics.
(A) Schematic overview of the experimental design and analytical workflow. Colon T: colon tumor tissue; Colon P: colon paratumor normal tissue; Liver T: liver metastasis tumor tissue; Liver P: liver paratumor normal tissue; LN: lymph node metastasis tissue. (B) The Uniform Manifold Approximation and Projection (UMAP) plot of all main immune cell types. (C) Dot plots showing average expression of highly variable genes of each cell group. The dot size represents percent of cells expressing the genes in each cluster and the color of dot represents the expression intensity. (D) The cell numbers of main immune cells across tissues. (E) Proportions of all main immune cells. p values were determined by the paired nonparameter test. (*: p<0.05, **:p<0.01, ***:p<0.001).
Figure 1—figure supplement 1
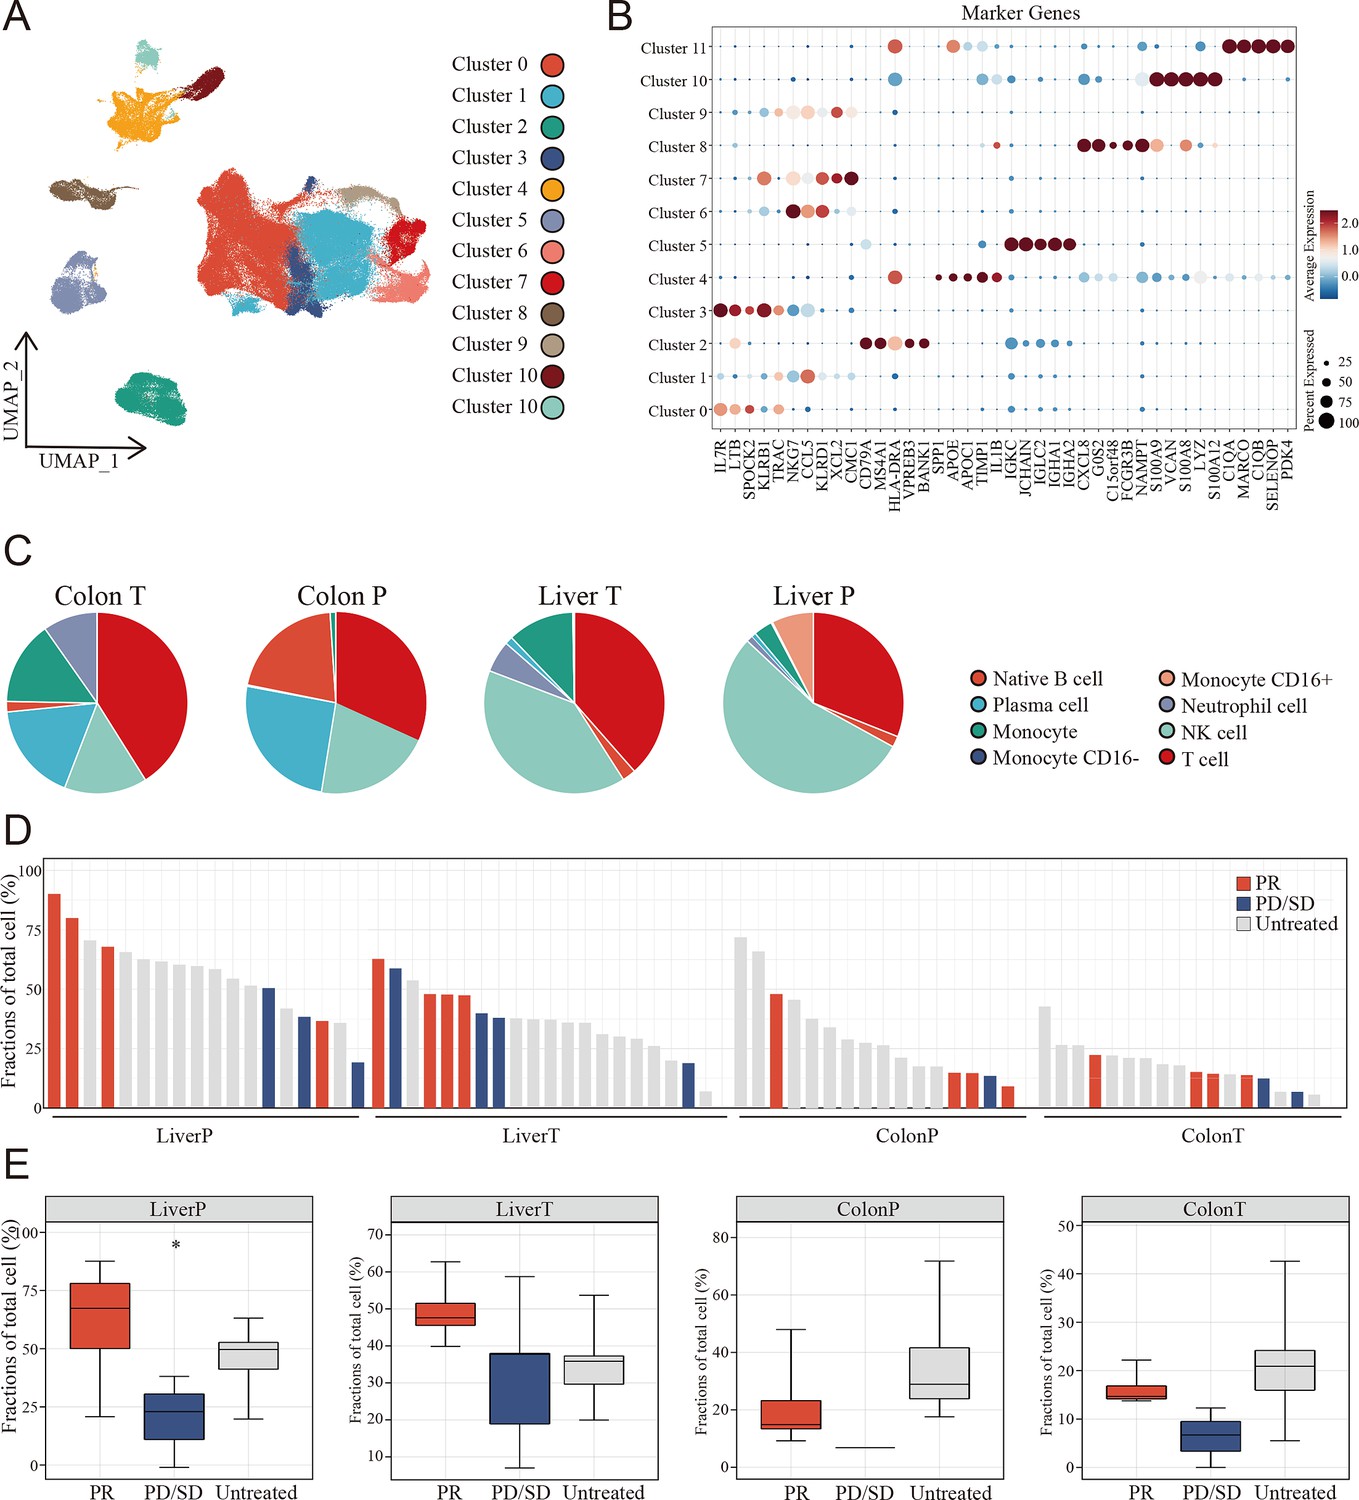
Cluster characterization of the global landscape of colon cancer liver metastasis (CCLM) revealed by single-cell transcriptomics.
(A) The UMAP plot of all 12 cell clusters. (B) Dot plots showing average expression of marker genes in indicated cell clusters. (C) The pie chart of the proportion of main immune cells across tissues. (D) The proportion of natural killer (NK) cells in total immune cells of each sample (including PR, PD/SD, and untreated patients) from the Liver P, Liver T, Colon P, and Colon T. (E) Proportions of NK cells in PR, PD/SD, and untreated patients among Liver P, Liver T, Colon P, and Colon T groups. (*: p<0.05, **:p<0.01, ***:p<0.001).
Figure 2 with 2 supplements
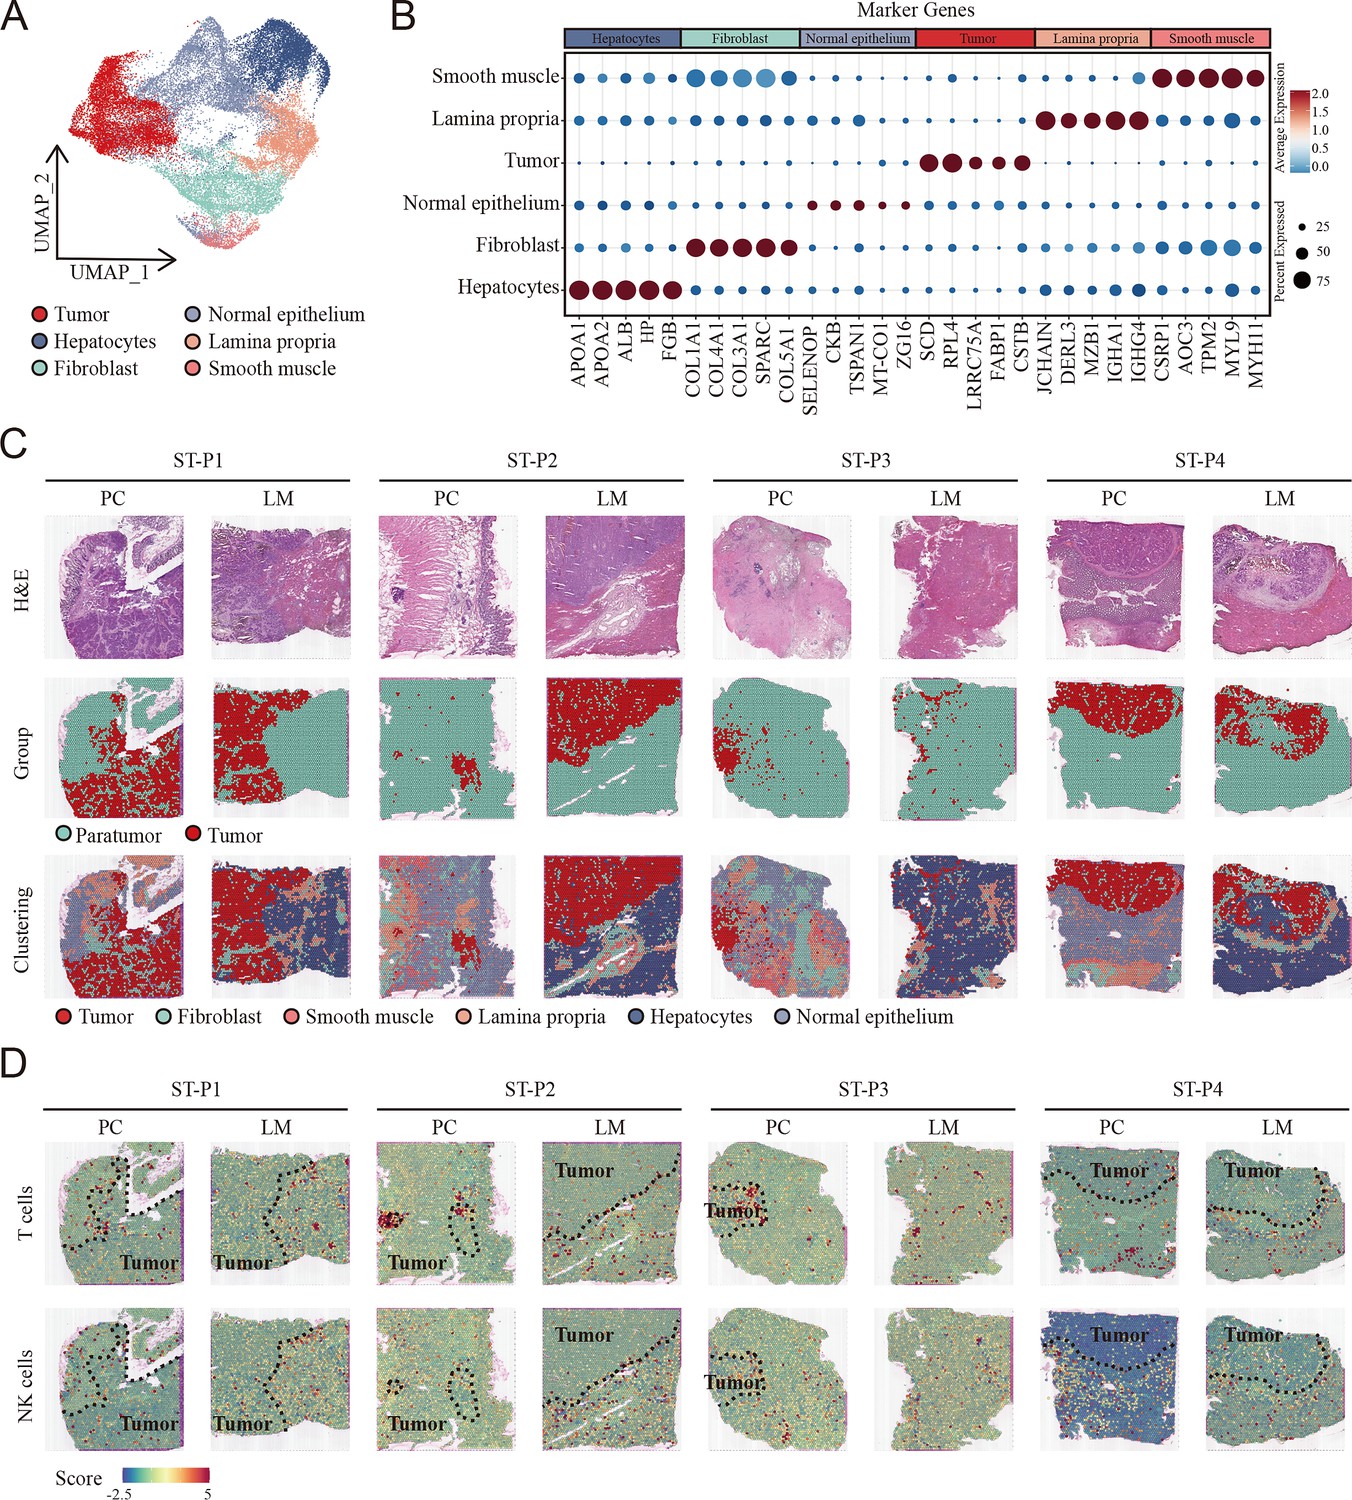
Cellular identification in spatial transcriptomic samples.
(A) UMAP visualization of cell clusters in spatial transcriptomic samples. (B) Dot plots showing average expression of markers in indicated cell clusters. (C) Overview of the spatial transcriptomic sections. Hematoxylin and eosin (H&E) staining of spatial transcriptomic sections (upper). Tumor tissue and paratumor tissue identification of each section (middle). Spatial cluster distribution of each section (lower). PC: primary cancer; LM: liver metastasis; ST-P1: spatial transcriptomic dataset patient 1; ST-P1: spatial transcriptomic dataset patient 1; ST-P2: spatial transcriptomic dataset patient 2; ST-P3: spatial transcriptomic dataset patient 3; ST-P4: spatial transcriptomic dataset patient 4. (D) The signature scores of T cells (upper) and natural killer (NK) cells (lower) in colon cancer and liver metastasis in the spatial transcriptomic sections.
Figure 2—figure supplement 1
Cellular identification in spatial transcriptomic samples.
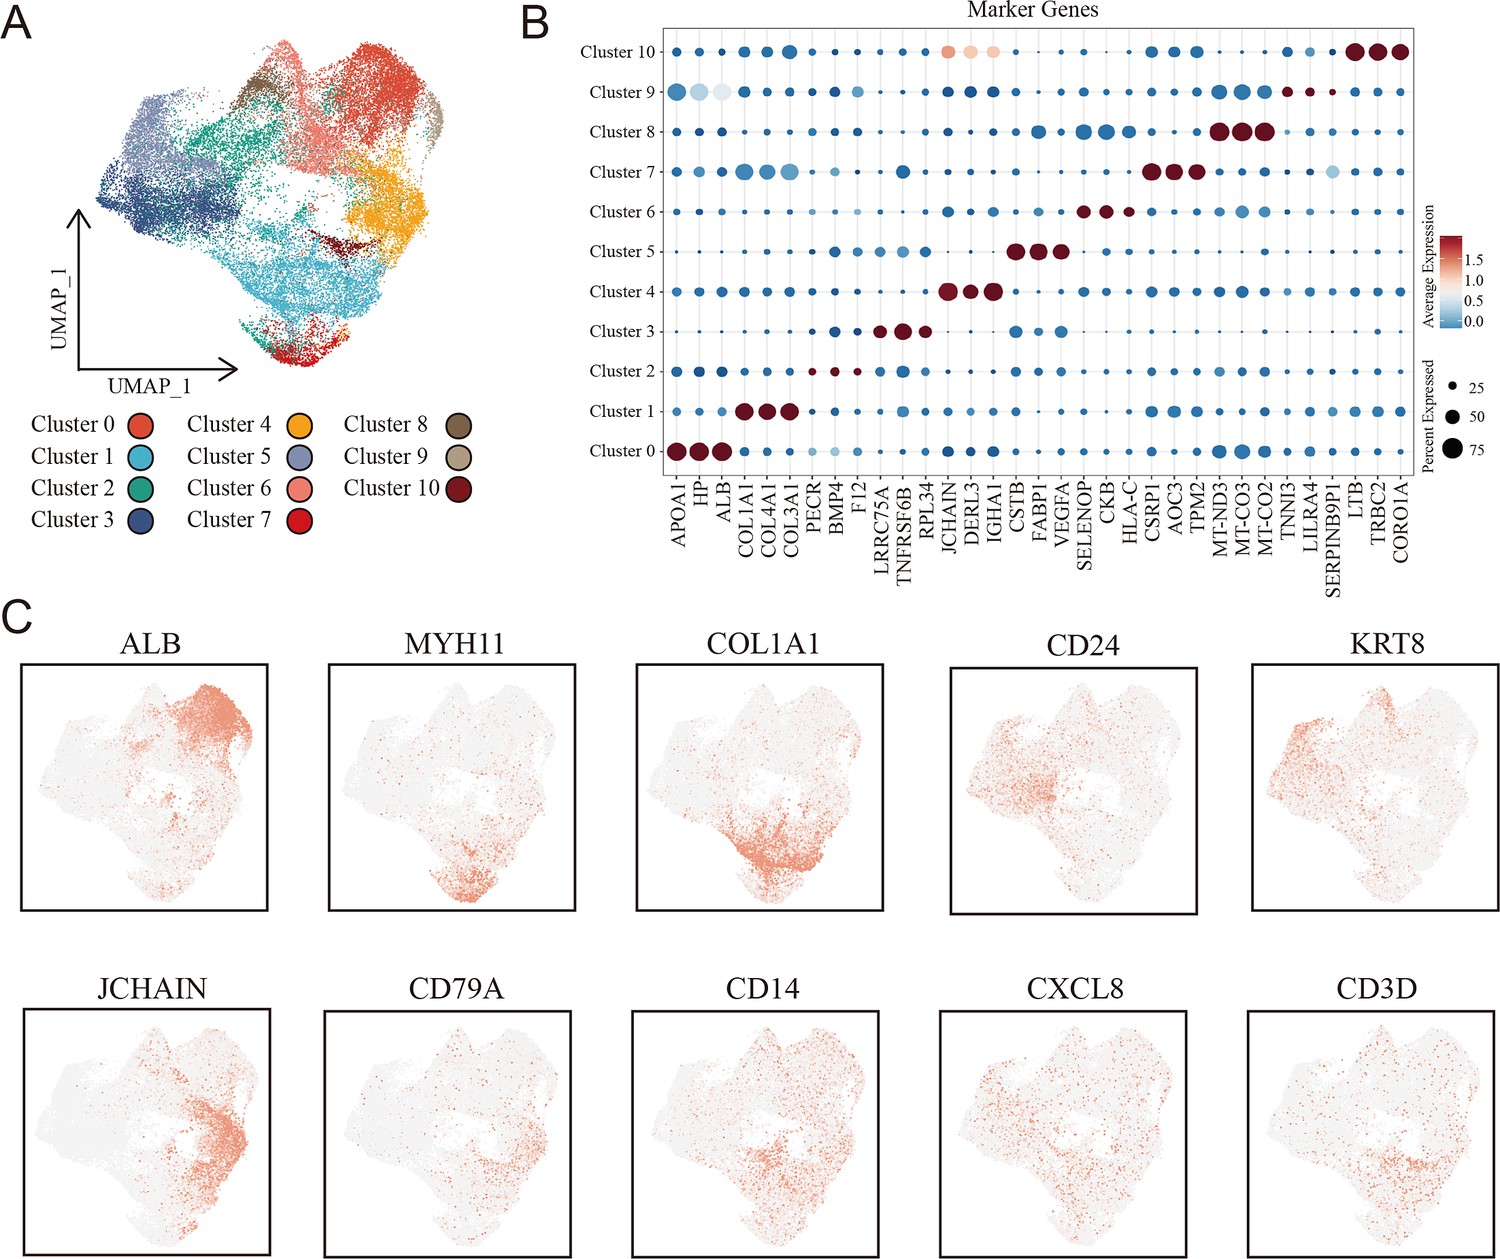
(A) The UMAP plot of all 11 cell clusters. (B) Dot plots showing average expression of marker genes in indicated cell clusters. (C) Expression of key markers across all samples.
Figure 2—figure supplement 2
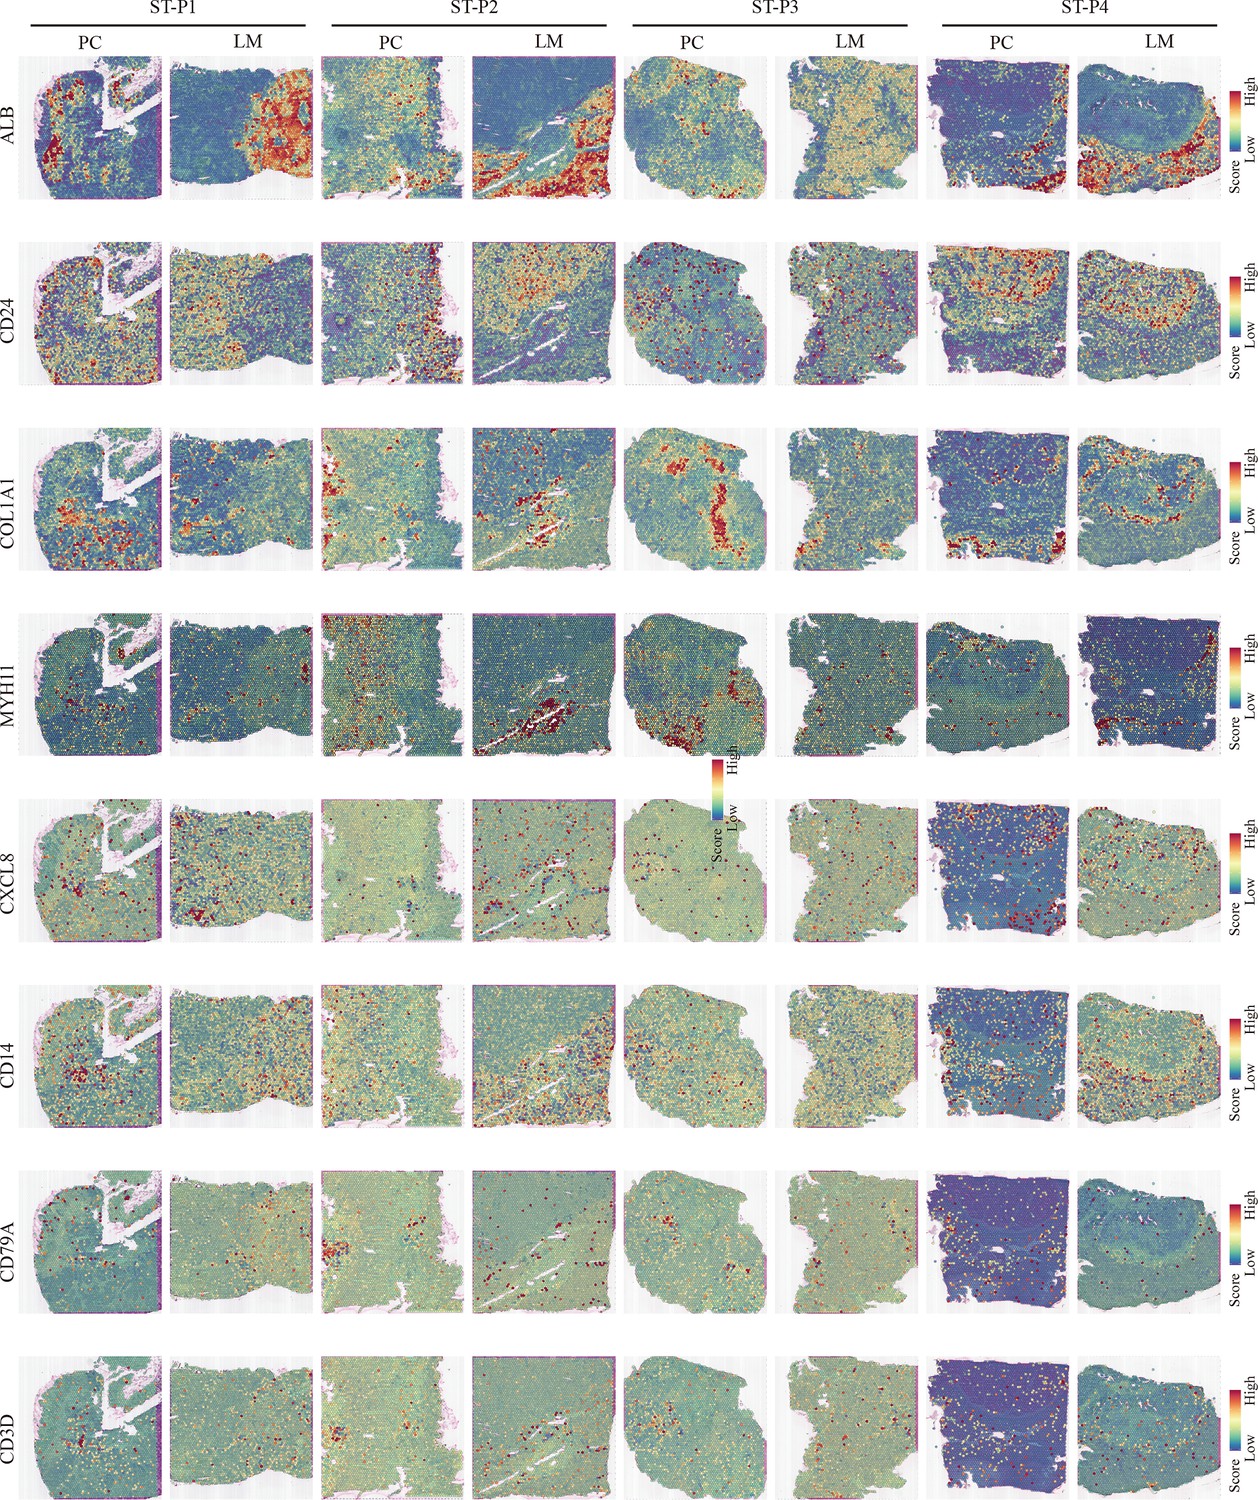
Gene expression features of each sample.
The feature plots showed the expression distributions of ALB, CD24, COL1A1, MYH11, CXCL8, CD14, CD79A, and CD3D in each spatial transcriptomic section.
Figure 3
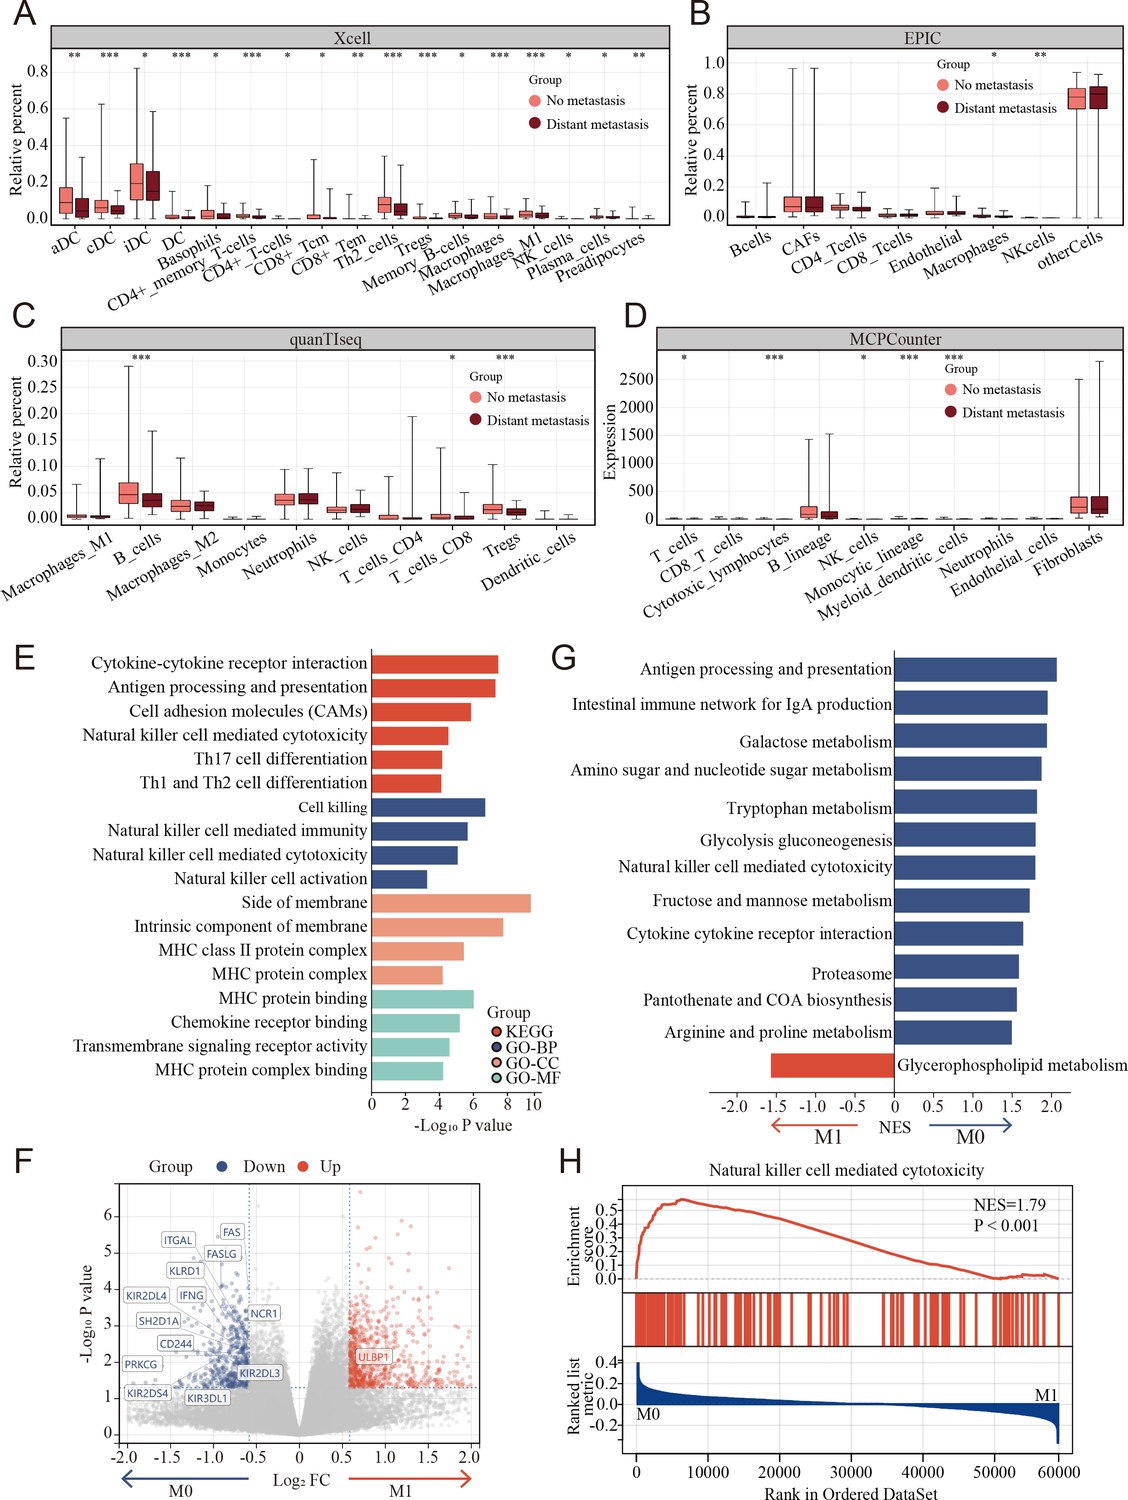
Clinical and biological relationship between natural killer (NK) cells and metastasis of colon cancer revealed by bulk RNA transcriptomics.
(A–D) The relationship of immune cell percentage determined by xCell, EPIC, quanTIseq, and MCPCounter between metastasis and non-metastasis tumor in TCGA COAD cohort. (*: p<0.05, **:p<0.01, ***:p<0.001) (E) Gene Ontology (GO) and Kyoto Encyclopedia of Genes and Genomes (KEGG) enriched pathway bar chart of differentially expressed genes (DEGs) in metastasis versus non-metastasis colon cancer. (F) Volcano plot showing nearly all the genes enriched in pathway of NK cell-mediated cytotoxicity were downregulated in the metastasis colon cancer. (G) Gene set enrichment analysis (GSEA) of KEGG gene set. (H) Natural killer cell-mediated cytotoxicity was enriched in the non-metastasis colon cancer.
Figure 4
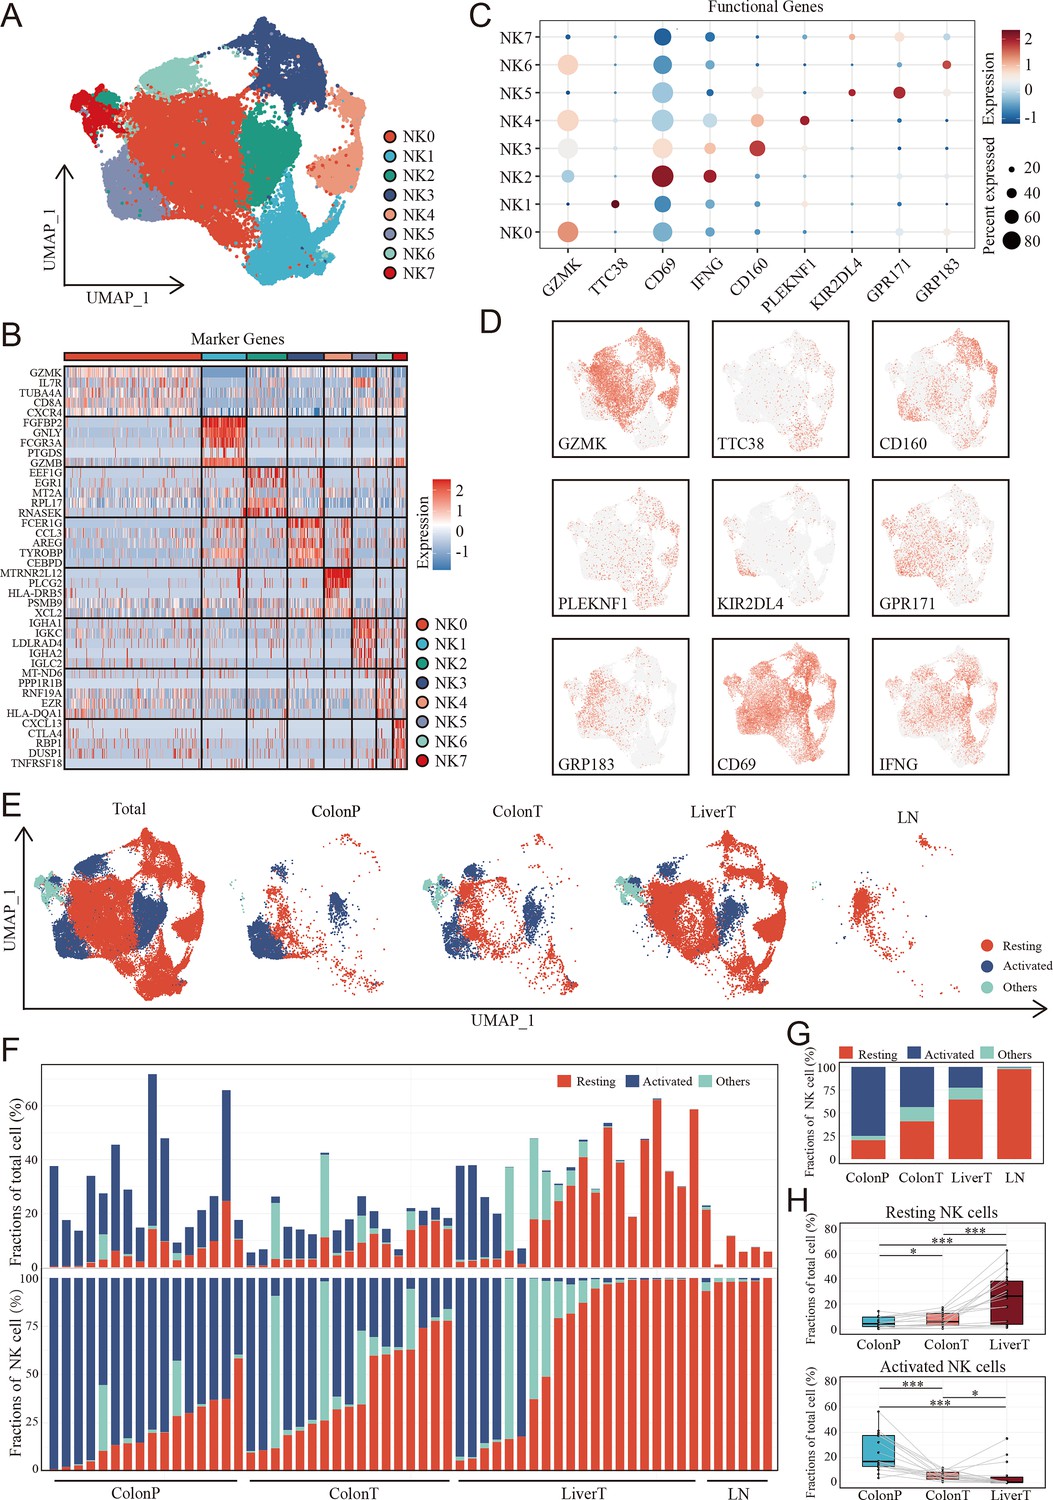
The landscape of natural killer (NK) cells in the disease progression of colon cancer liver metastasis (CCLM).
(A) The UMAP plot of NK cells from CCLM. (B) Unsupervised clustering identifies eight subsets of NK cells. (C) Expression of key markers that distinguish resting and activated subsets of NK cells. (D) Expression of key resting and activated NK cell markers across all samples. (E) The UMAP plot of distribution of resting and activated NK cells from ColonP, ColonT, LiverT, and LN. (F) Cellular landscape of each sample from the ColonP, ColonT, LiverT, and LN. The proportion of NK cells subsets in total immune cells (upper). The proportion of NK cells subsets in total NK cells (lower). (G) Number of cells identified from each group (ColonP, ColonT, LiverT, and LN) by cell type proportion. (H) Proportions of resting (upper) and activated (lower) subsets of NK cells. p values were determined by the paired nonparameter test. (*: p<0.05, **:p<0.01, ***:p<0.001).
Figure 5 with 1 supplement
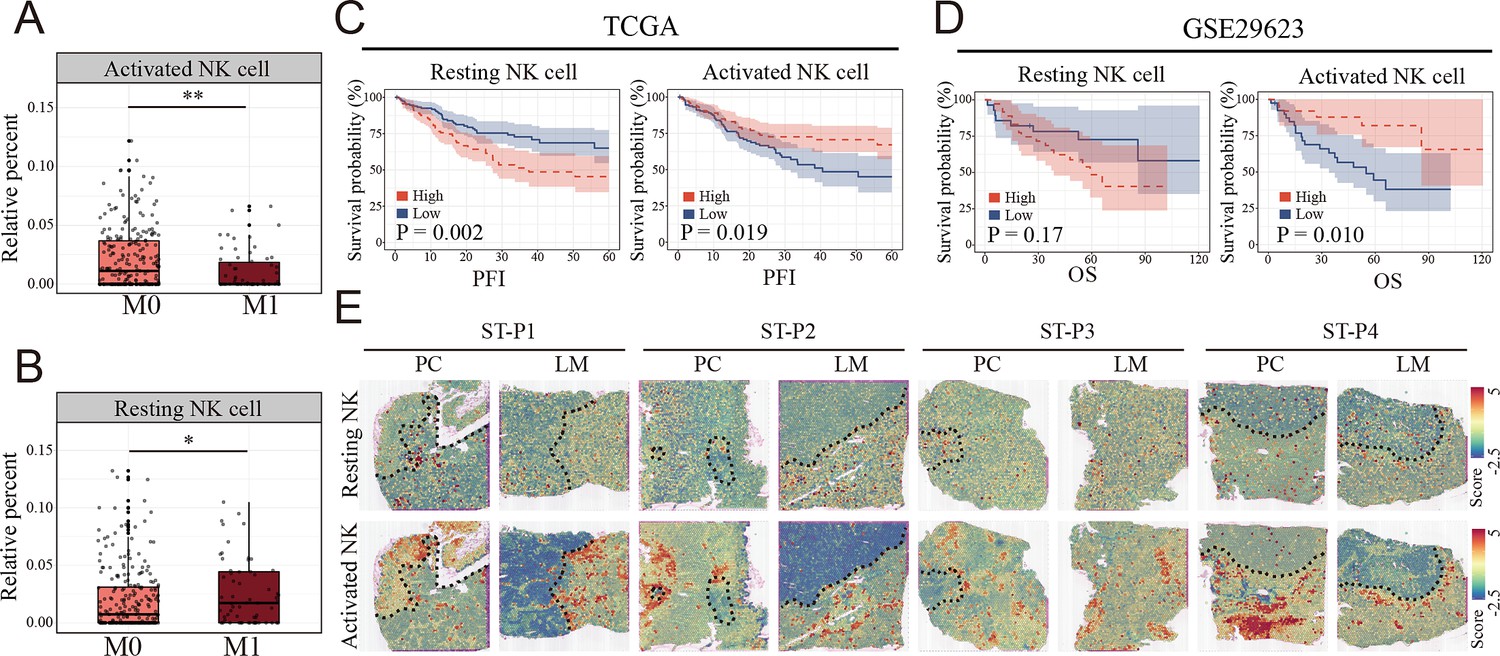
Clinical relationship between natural killer (NK) cells subsets and metastasis of colon cancer revealed by bulk RNA and spatial transcriptomics.
(A, B) The relationship of activated and resting NK cell percentage determined by CIBERSORT and tumor metastasis in TCGA COAD cohort. M0: non-metastasis colon cancer; M1: metastasis colon cancer. (*: p<0.05, **:p<0.01, ***:p<0.001) (C, D) K–M survival plots show that high resting NK cell and low activated NK cell predicted poor prognosis in TCGA COAD and GSE29623 cohort. PFI: progression-free interval; OS: overall survival. (E) The signature scores of resting (upper) and activated NK cells (lower) in colon cancer and liver metastasis in the spatial transcriptomic sections.
Figure 5—figure supplement 1
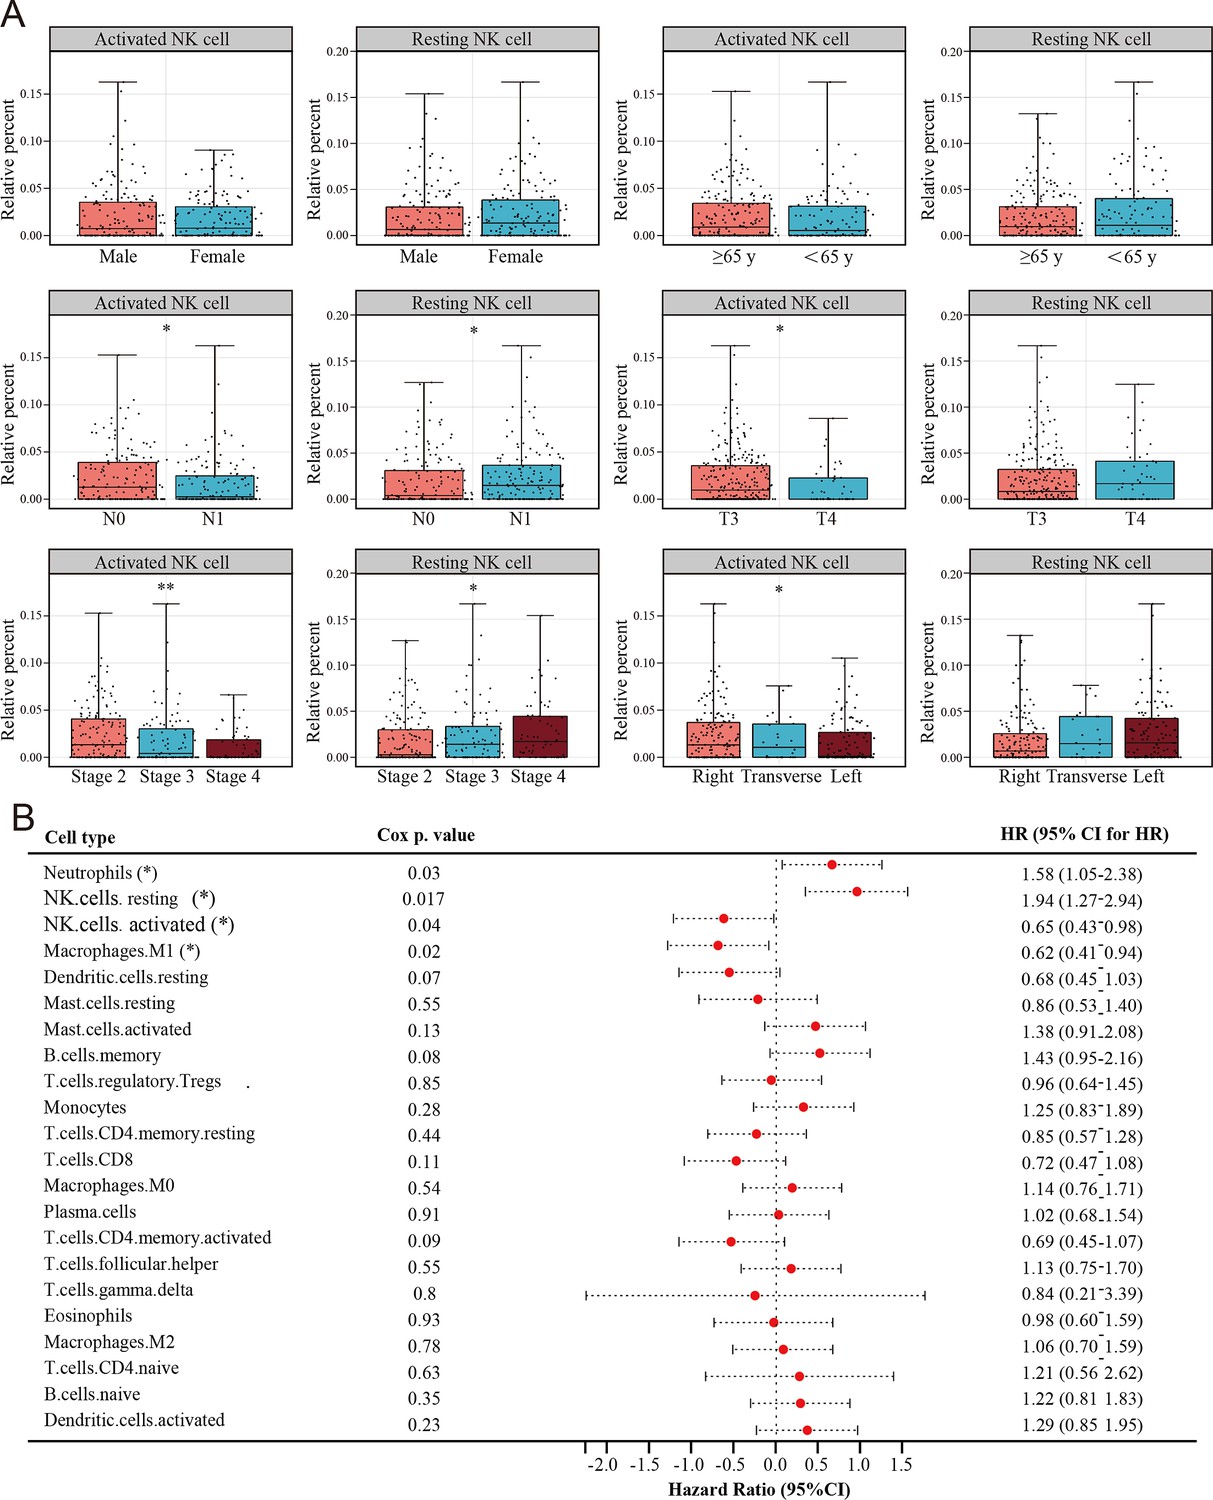
Clinical relationship between natural killer (NK) cells subsets and colon cancer revealed by TCGA COAD cohort.
(A) The relationship of activated and resting NK cell and clinical characteristics of colon cancer in TCGA COAD cohort. (B) The relationship of 22 immune cells percentage determined by CIBERSORT and prognosis of colon cancer in TCGA COAD cohort.we have amended. (*: p<0.05, **:p<0.01, ***:p<0.001).
Figure 6 with 1 supplement
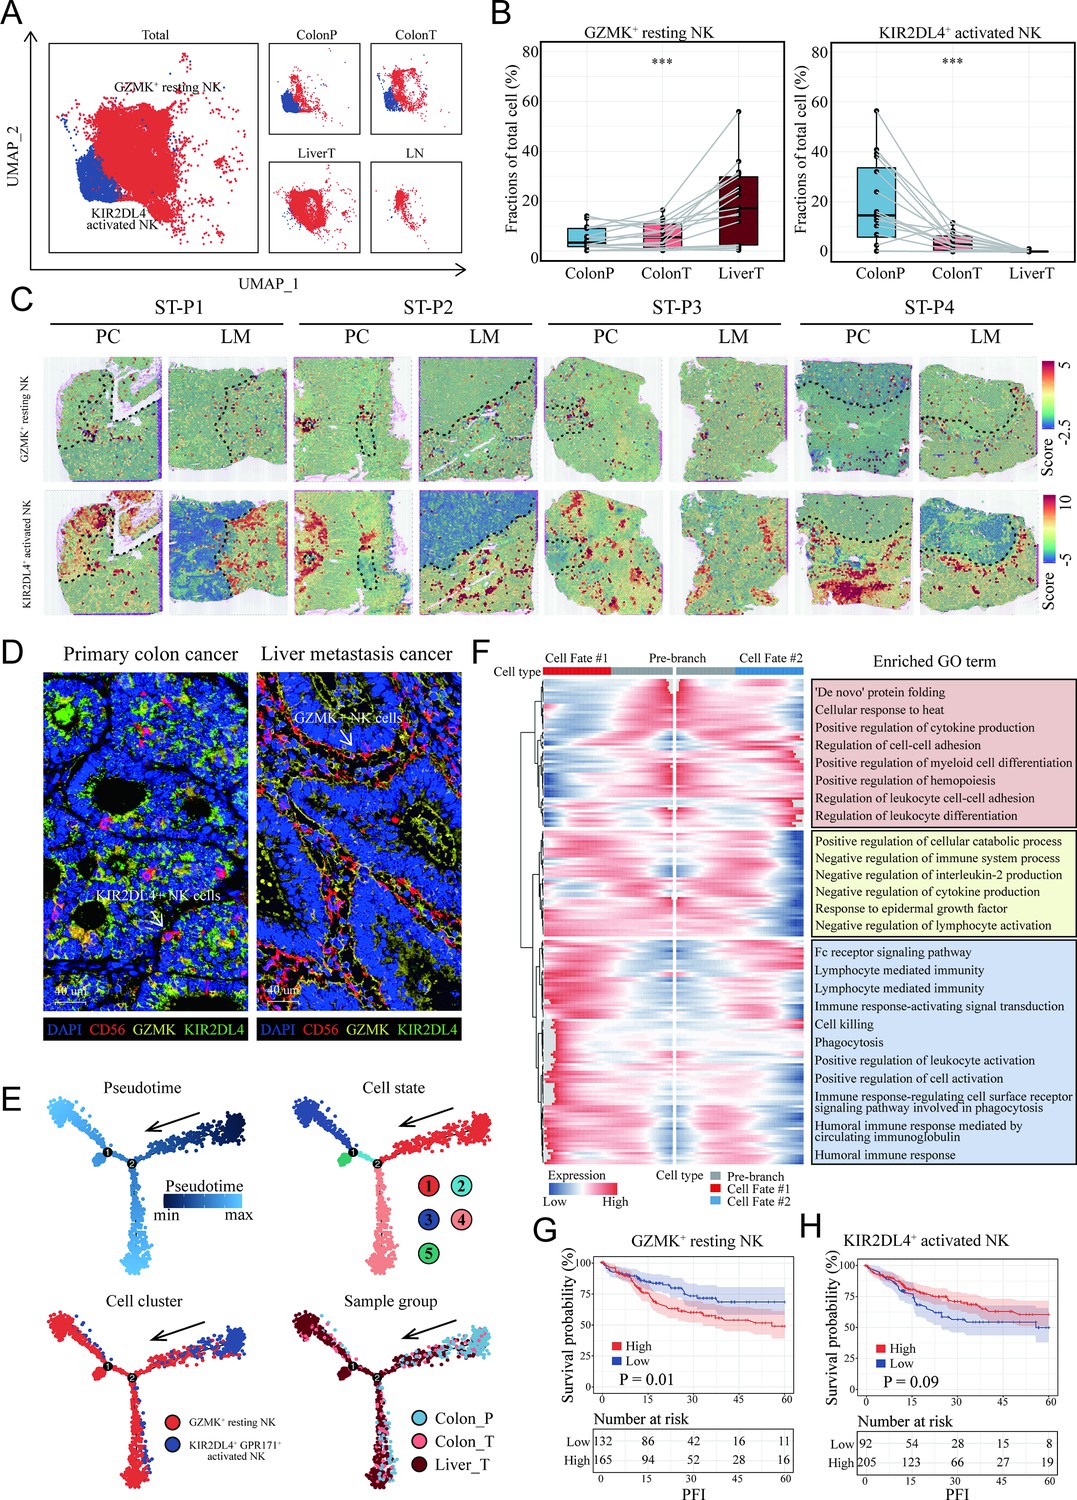
Characterization and developmental course of differential subsets of natural killer (NK) cells in colon cancer liver metastasis (CCLM).
(A) The UMAP plot of KIR2DL4+ activated NK cells, GZMK+ resting NK cells from CCLM. (B) Proportions of KIR2DL4+ activated NK cells, GZMK+ resting NK cells in total immune cells. p values were determined by the paired nonparameter test. (*: p<0.05, **:p<0.01, ***:p<0.001) (C) The signature scores of GZMK+ resting NK cells (upper) and KIR2DL4+ activated NK cells (lower) in colon cancer and liver metastasis in the spatial transcriptomic sections. (D) mIHC of GZMK+ and KIR2DL4+ NK cells in primary colorectal cancer and liver metastasis cancer. (E) Monocle analysis showing the developmental trajectory of NK cells. Color as in pseudotime, cell state, subsets of NK cells, and sample group. (F) The heatmap shows the expression patterns of the top 50 significant genes in branched expression analysis modeling, associated Gene Ontology (GO) terms (using DAVID v6.7) are given on the right of the corresponding gene clusters. (G, H) The Kaplan–Meier curve shows COAD patients survival with different GZMK+ resting NK cells and KIR2DL4+ activated NK cells infiltration.
Figure 6—figure supplement 1
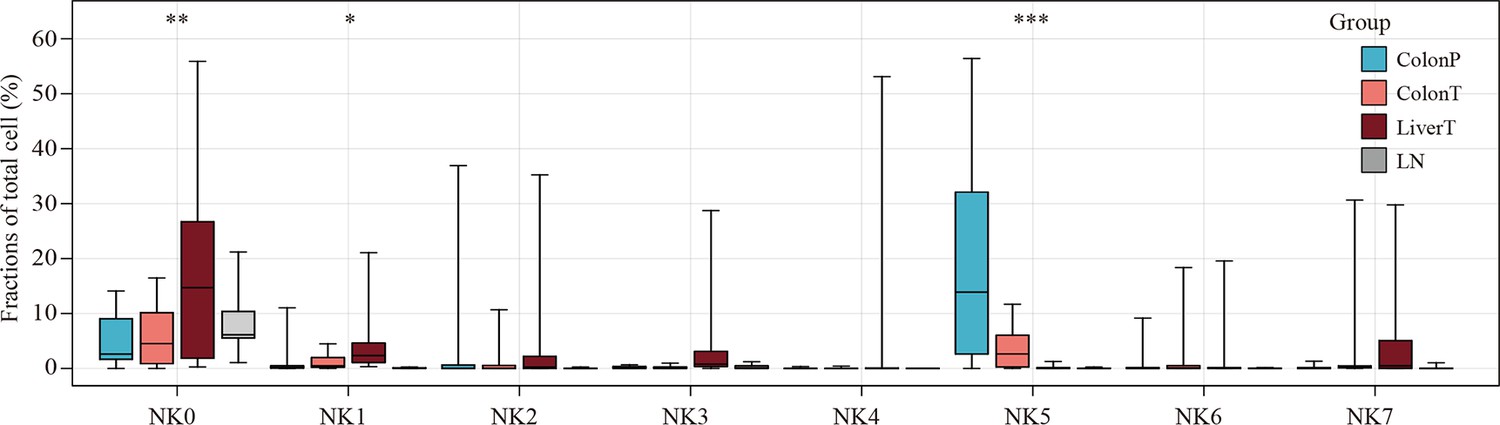
The proportions of eight clusters of NK cells in Colon P, Colon T, Liver T and LN.(*: p<0.05, **:p<0.01, ***:p<0.001).
Figure 7 with 5 supplements
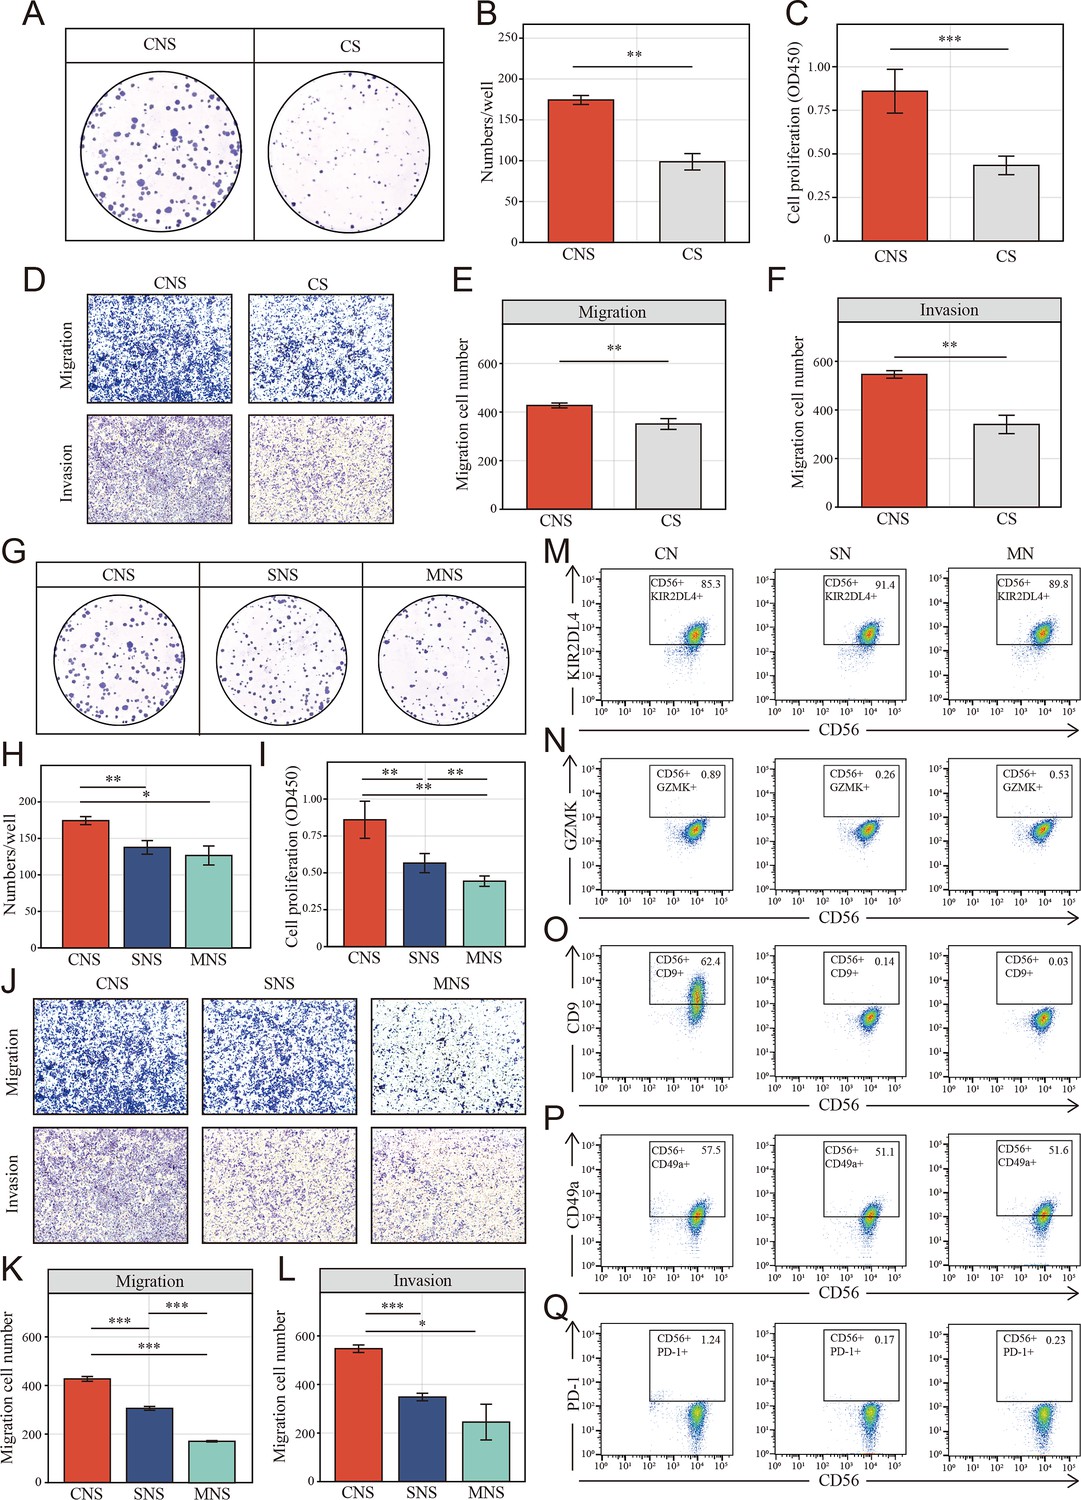
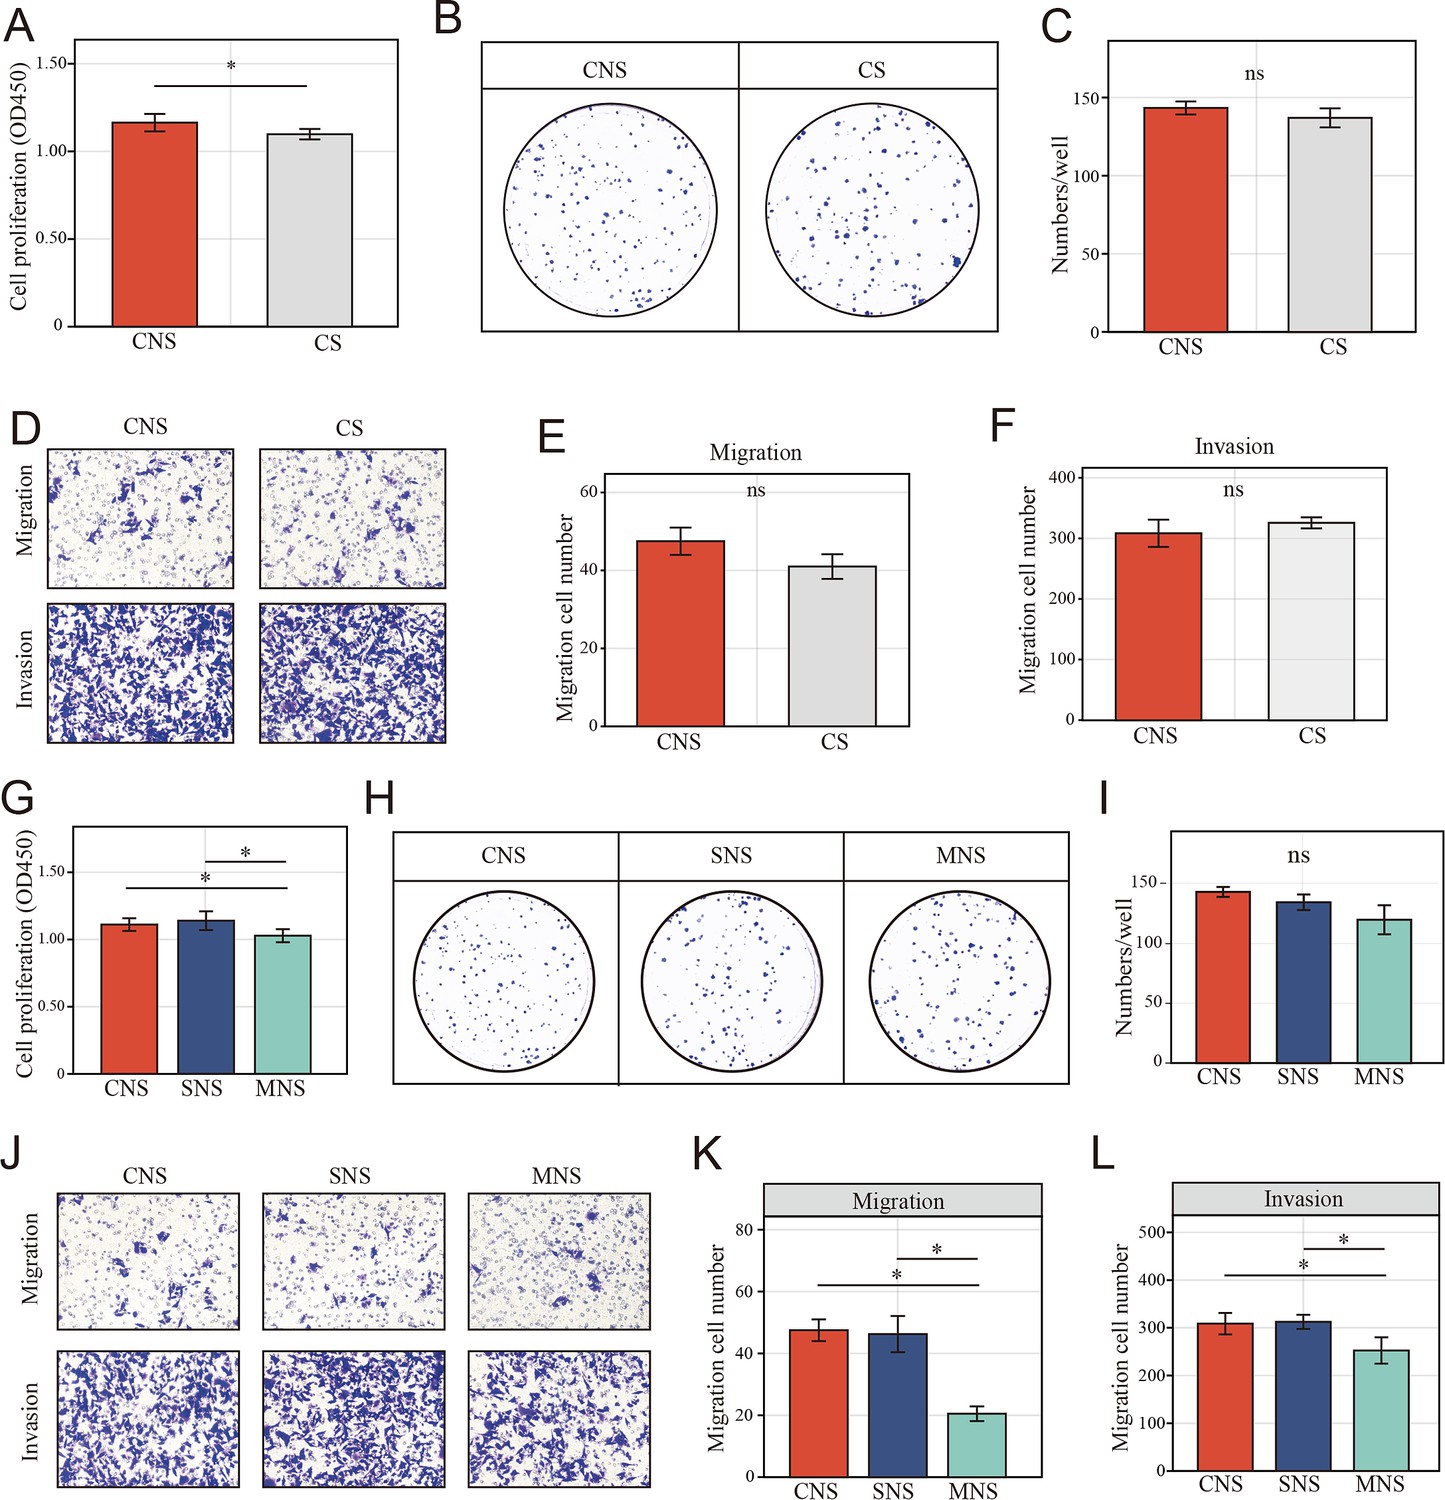
Colon cancer cells (HCT-116) educated NK cells shift toward tumor-promoting status depends on cell-to-cell interaction.
(A, B) Clone formation assay showed the natural killer (NK) cell-mediated inductive effect on cell proliferation of colon cancer cell (HCT-116). Colon cancer cells were cultured in the supernatant from different co-culture system in transwell devices. CNS: colon cancer cells were cultured in the supernatant from co-culture system that NK cells and cancer cells were cultured in direct contact (CNS); CS: cancer cells cultured directly in supernatant of cancer cells. (C) Cell Counting Kit-8 (CCK-8) assay showed the NK cell-mediated inductive effect on cell proliferation of colon cancer cell among CNS and CS groups. (D–F) The NK cell-mediated inductive effect on migration and invasion of colon cancer cell among CNS and CS groups. (G-I) Clone formation assay and CCK-8 assay showed the NK cell-mediated inductive effect on cell proliferation of colon cancer cell among CNS, SNS, and MNS groups. SNS: colon cancer cells were cultured in the supernatant from co-culture system that NK cells were cultured in supernatant of cancer cells; MNS: colon cancer cells were cultured in the supernatant from co-culture system that NK cells were cultured in fresh medium. (J-L) The NK cell–mediated inductive effect on on migration and invasion of colon cancer cell (HCT-116) among CNS, SNS, and MNS groups. (M-Q) Phenotype switch (KIR2DL4, GZMK, CD9, CD49a, and PD-1) of NK cells was induced by cell-to-cell interactions with cancer cells. CN: NK cells were co-cultured with colon cancer cells; SN: NK cells were cultured in supernatant of cancer cells; MN: NK cells were cultured in fresh medium. (*: p<0.05, **:p<0.01, ***:p<0.001).
Figure 7—figure supplement 1
Natural killer (NK) cell-mediated tumor-promoting effect in colon cancer cells (DLD-1).
(A) Clone formation assay showed the NK cell-mediated inductive effect on cell proliferation of DLD-1 cell between CNS and CS groups. (B, C) Cell Counting Kit-8 (CCK-8) assay showed the NK cell-mediated inductive effect on cell proliferation of DLD-1 cell between CNS and CS groups. (D–F) The NK cell-mediated inductive effect on migration and invasion of DLD-1 cell between CNS and CS groups. (G) CCK-8 assay showed the NK cell-mediated inductive effect on cell proliferation of DLD-1 cell among CNS, SNS, and MNS groups. (H, I) Clone formation assay showed the NK cell-mediated inductive effect on cell proliferation of DLD-1 cell among CNS, SNS, and MNS groups. (J–L) The NK cell-mediated inductive effect on migration and invasion of DLD-1 cell among CNS, SNS, and MNS groups. (*: p<0.05, **:p<0.01, ***:p<0.001).
Figure 7—figure supplement 2
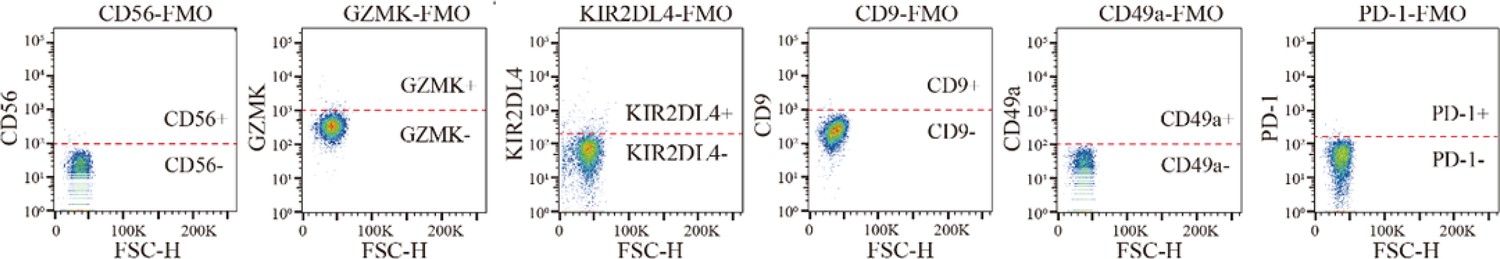
The positive gate locations of CD56, GZMK, KIR2DL4, CD9, CD49a, and PD-1 defined according to the Fluorescence Minus One (FMO) control.
Figure 7—figure supplement 3
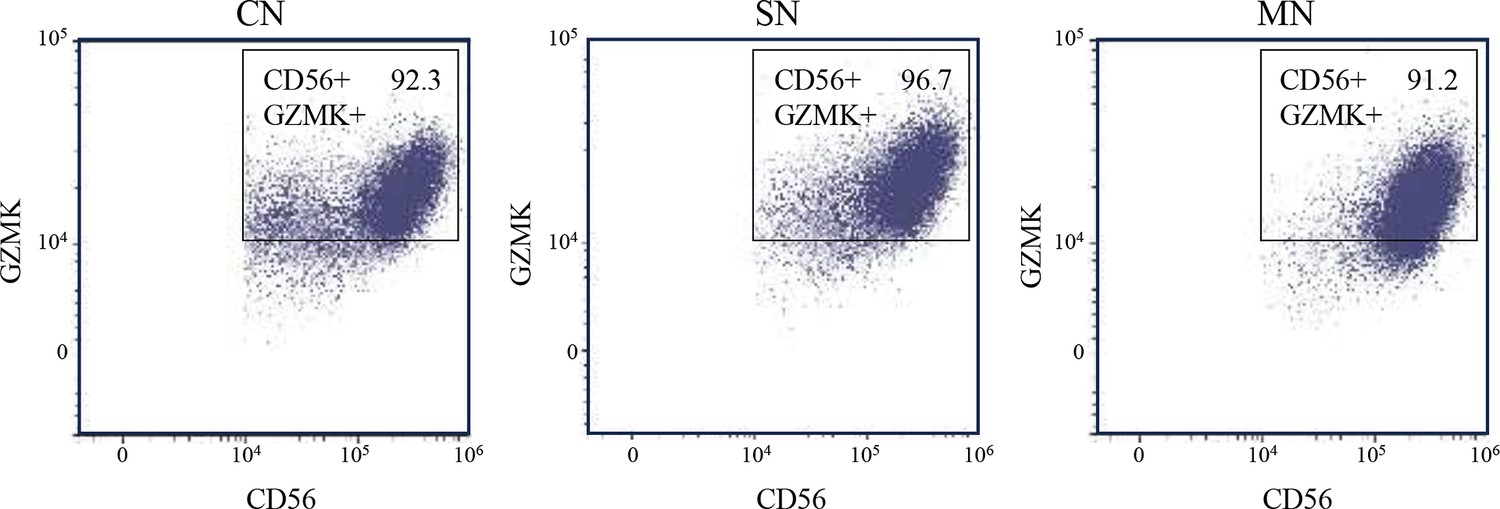
Phenotype switch (CD56+, GZMK+) of natural killer (NK) cells was analyzed by fluorescence-activated cell sorting (FACS) after fixation and permeabilization in different co-cultured groups.
Figure 7—figure supplement 4
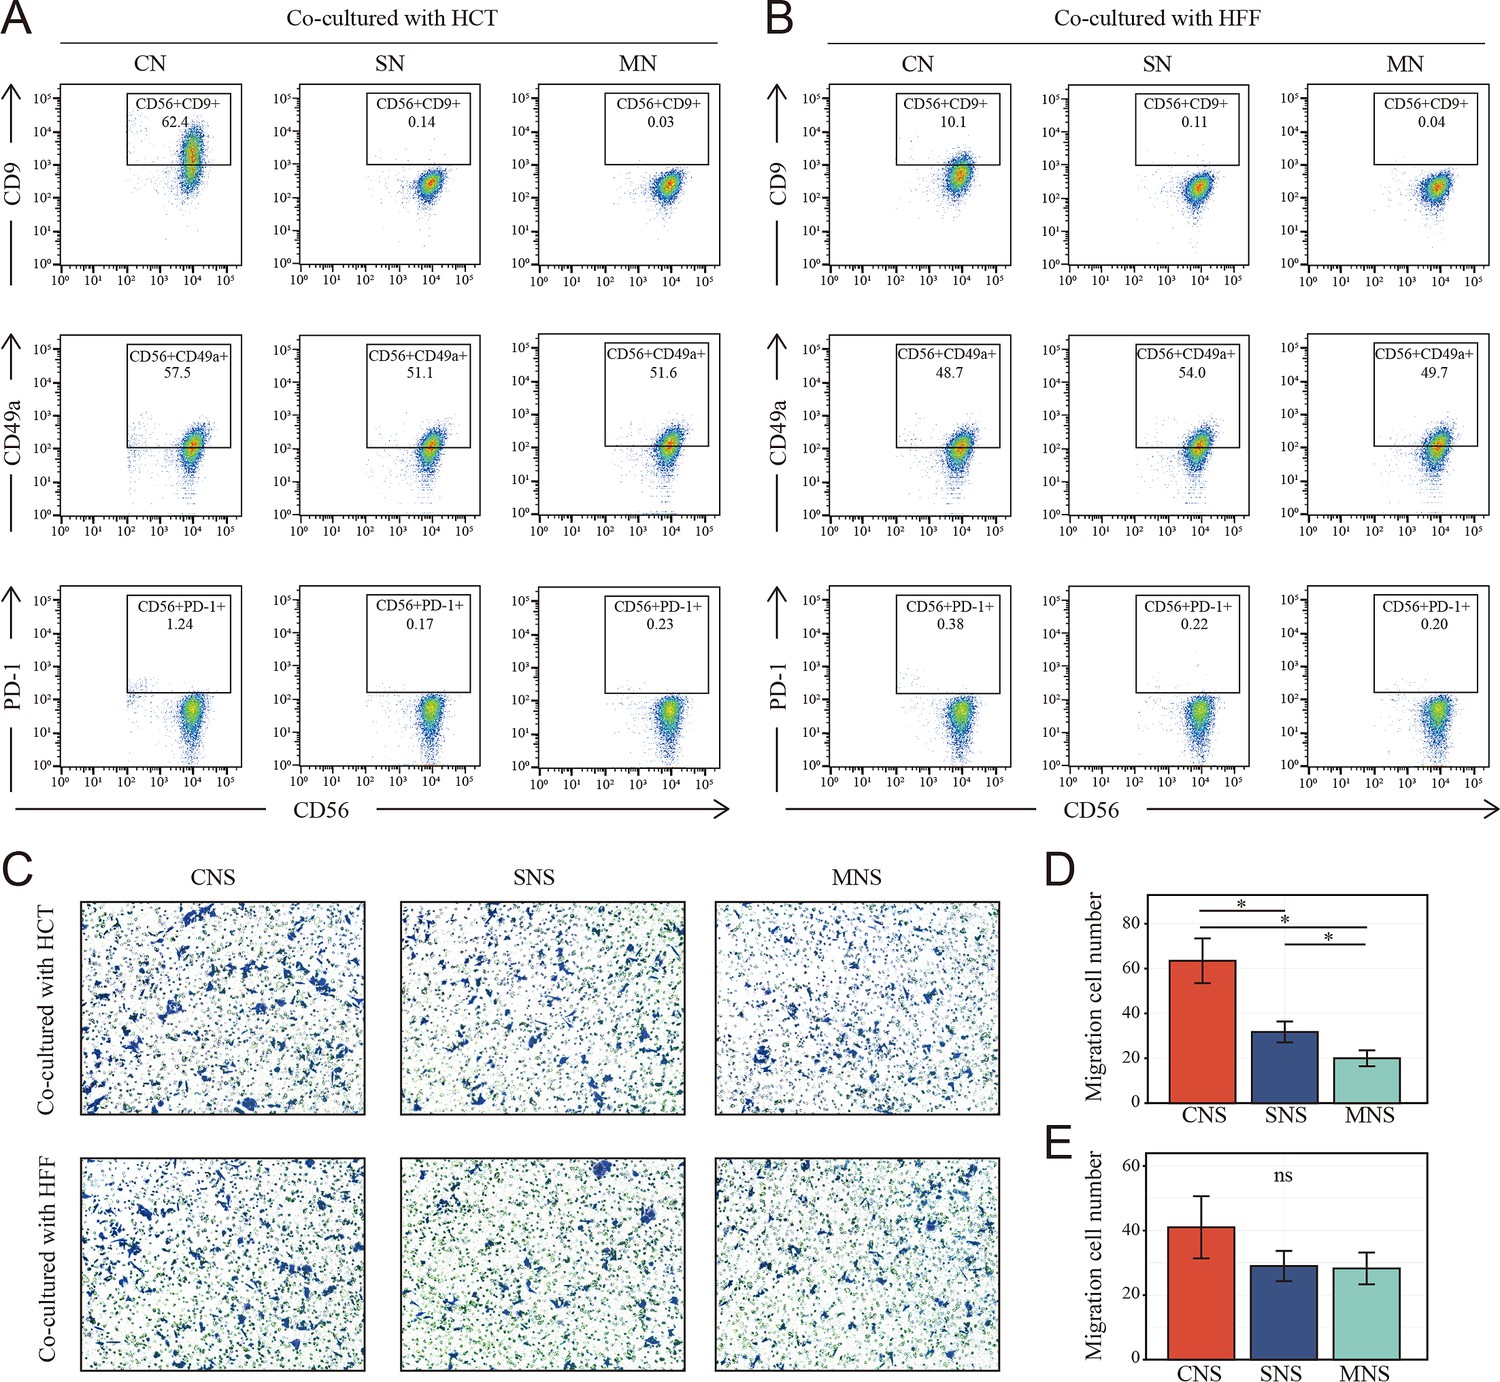
Phenotype switch of natural killer (NK) cells in different co-cultured system and the corresponding NK cell-mediated effect on cell migration of fresh colon cancer cell (HCT-116).
(A, B) NK cells underwent phenotype switch (high expression of CD9) when cocultured with human colon cancer cell line (HCT-116) and human fibroblast cell line (HFF-1), the phenotype switch was more obvious when co-cultured with HCT. CN: NK cells cocultured with HCT/HFF; SN: NK cells cocultured with supernatant of HCT/HFF; MN: NK cells cocultured in fresh medium. (C–E) Transwell assay showed the only tumor co-cultured NK mediated the inductive effect on cell migration of colon cancer cell (HCT-116). CNS: colon cancer cells were cultured in the supernatant from co-culture system that NK and HCT/HFF were cultured in direct contact; SNS: colon cancer cells were cultured in the supernatant from co-culture system that NK cocultured with supernatant of HCT/HFF; MNS: colon cancer cells were cultured in the fresh medium. (*: p<0.05, **:p<0.01, ***:p<0.001).
Figure 7—figure supplement 5
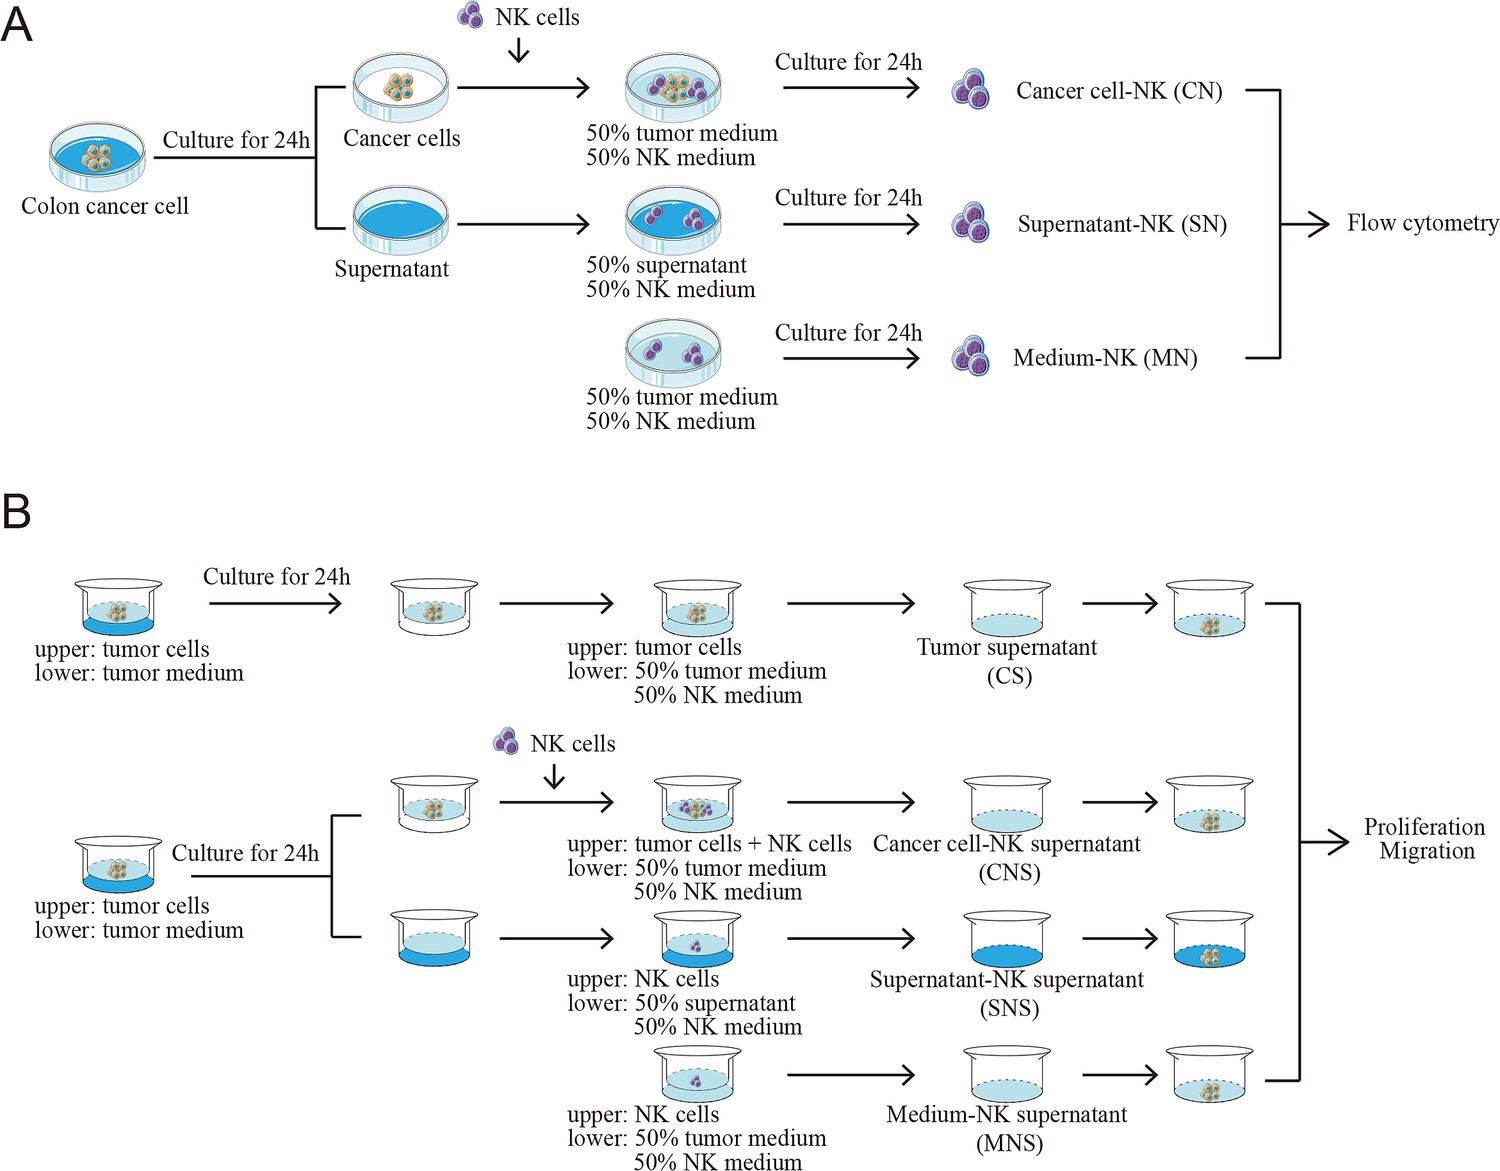
Schematic overview of the in vitro experimental design.
(A) Schematic overview of coculture experiments design. (B) Schematic overview of coculture experiments design in transwells.
Figure 8 with 1 supplement
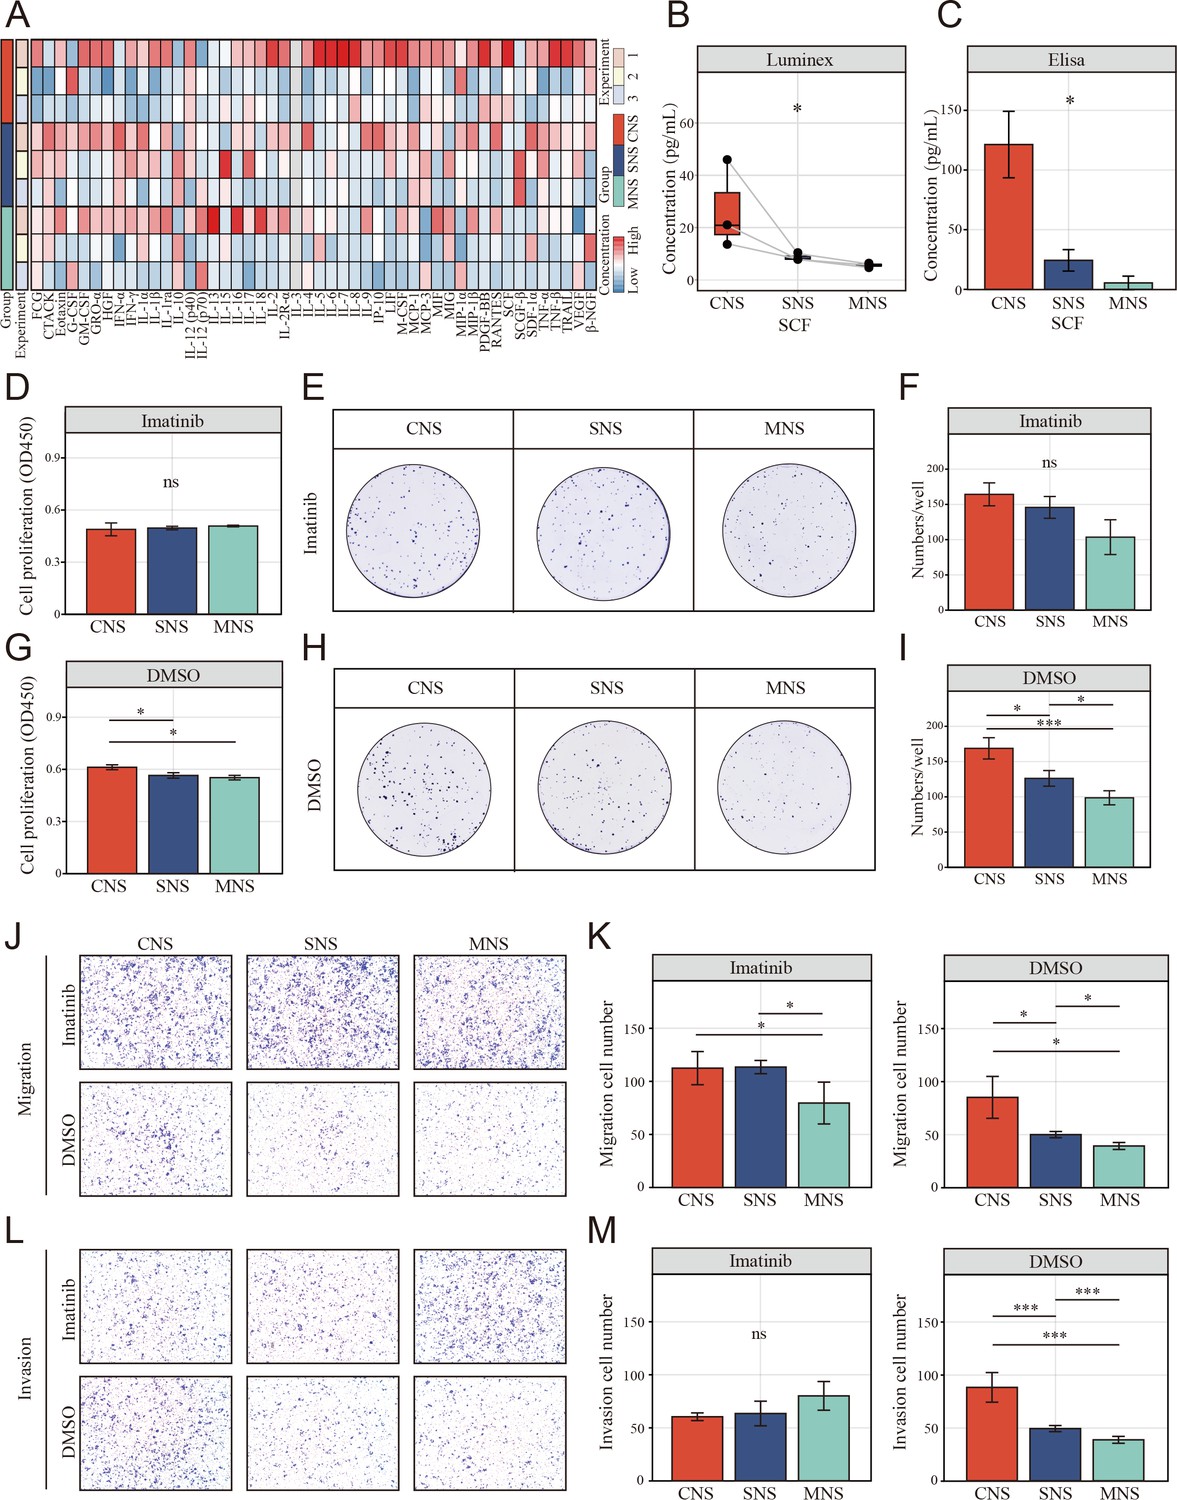
The resting natural killer (NK) cell promotes tumor malignant phenotype via elevating tumor-derived sSCF.
(A) Luminex liquid suspension chip detection of 48 common chemotactic and inflammatory cytokines in CNS, SNS, and MNS group. (B, C) Concentration of SCF determined by luminex liquid suspension chip and ELISA in CNS, SNS, and MNS group. (D, E) Cell Counting Kit-8 (CCK-8) assay showed the proliferation of HCT-116 cells was inhibited by imatinib mesylate, evaluated by a CCK-8 assay. Cells were incubated in the supernatant from different co-culture system with DMSO or 2 µM imatinib mesylate. (F–I) Clone formation assay showed the proliferation of HCT-116 cells was inhibited by imatinib mesylate. (J–M) The NK cell-mediated inductive effect on migration and invasion of HCT-116 was inhibited by imatinib mesylate. (*: p<0.05, **:p<0.01, ***:p<0.001).
Figure 8—figure supplement 1
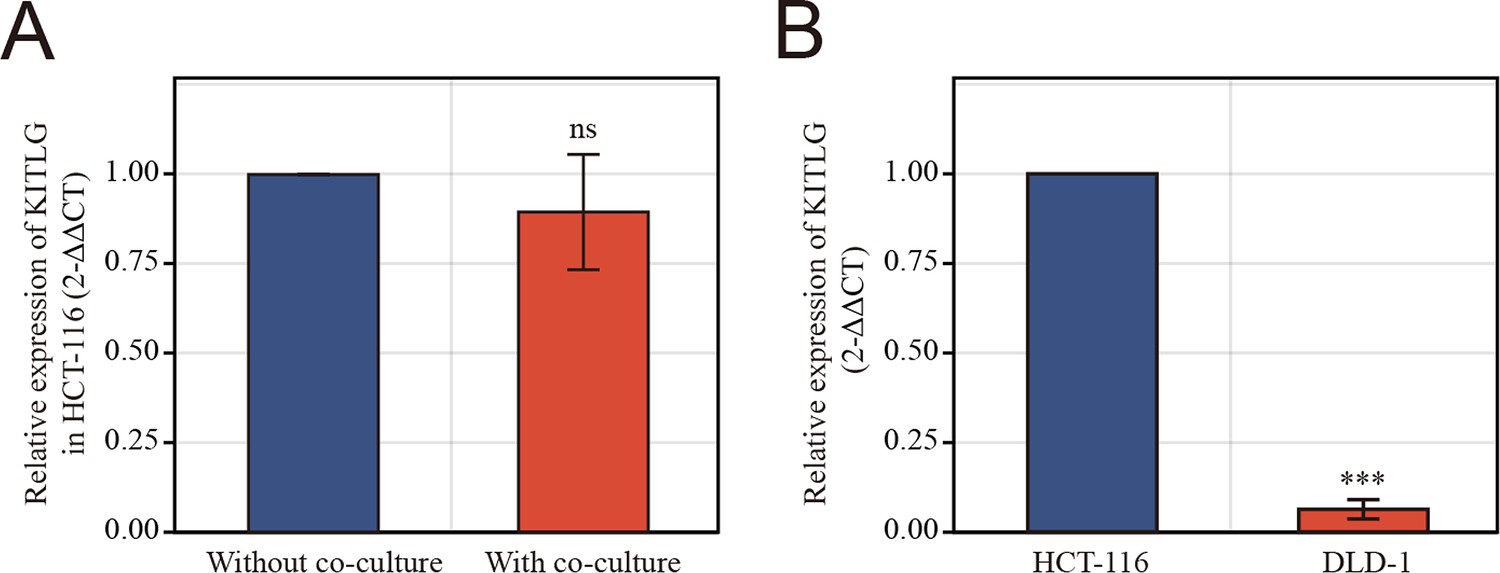
Relative KITLG expression in different groups.
(A) Real-time quantitative reverse transcription polymerase chain reaction (RT-qPCR) analysis of KITLG expression in HCT-116 with and without co-cultured with natural killer (NK) cells. (B) RT-qPCR analysis of KITLG expression in HCT-116 and DLD-1 cells. (*: p<0.05, **:p<0.01, ***:p<0.001, ns: no significance).
Figure 9
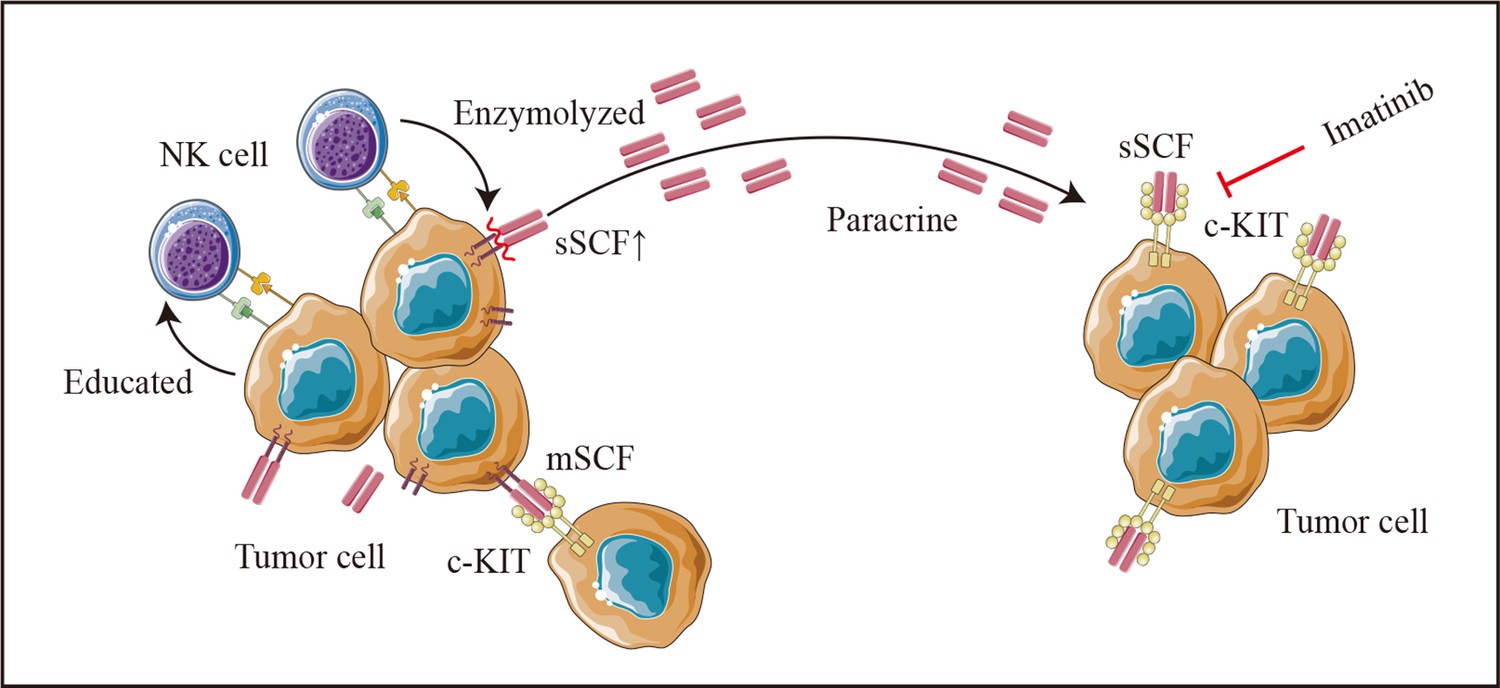
Schematic diagram.
Colon cancer cells (HCT-116 cells) educate natural killer (NK) cells as resting status depends on cell-to-cell interaction. Tumor-educated NK cells subsequent enhances tumor malignancy in a paracrine manner by elevating tumor-derived sSCF.
Author response image 1

The positive gate locations of CD56, GZMK, KIR2DL4, CD9, CD49a, PD-1 defined according to the FMO control.
Author response image 2

Phenotype switch of NK cells in different co-cultured system and the corresponding NK cell-mediated effect on cell migration of fresh colon cancer cell (HCT-116).
A-B: NK cells underwent phenotype switch (high expression of CD9) when cocultured with HCT and HFF, the phenotype switch was more obvious when co-cultured with HCT. CN: NK cells cocultured with HCT/HFF; SN: NK cells cocultured with supernatant of HCT/HFF; MN: NK cells cocultured in fresh medium. C-E: Transwell assay showed the only tumor co-cultured NK mediated the inductive effect on cell migration of colon cancer cell (HCT-116). CNS: Colon cancer cells were cultured in the supernatant from co-culture system that NK and HCT/HFF were cultured in direct contact; SNS: Colon cancer cells were cultured in the supernatant from co-culture system that NK cocultured with supernatant of HCT/HFF; MNS: Colon cancer cells were cultured in the fresh medium.
Author response image 3

Phenotype switch (CD56+, GZMK+) of NK cells was analyzed by FACS after fixation and permeabilization in different co-cultured groups.
CN: NK cells cocultured with colon cancer cells; SN: NK cells cocultured with supernatant of cancer cells; MN: NK cells cocultured in fresh medium.
Tables
Author response table 1
The baseline data of patient from single cell sequencing database.
| Patient | Age | Sex | TNM | Neoadjuvant chemotherapy |
|---|---|---|---|---|
| P1 | 71 | Male | T1N0M1 | N |
| P2 | 78 | Female | T3N1M1 | N |
| P3 | 60 | Female | T2N0M1 | N |
| P4 | 26 | Female | T3N1M1 | N |
| P5 | 64 | Male | T2N0M1 | Y (PR, FOLFOX) |
| P6 | 71 | Male | T3N1M1 | N |
| P7 | 52 | Female | T3N1M1 | Y (PR, XELOX) |
| P8 | 53 | Male | T3N0M1 | N |
| P9 | 35 | Male | T1N0M1 | Y (PR, XELOX) |
| P10 | 66 | Male | T3N1M1 | N |
| P11 | 43 | Female | T3N1M1 | N |
| P12 | 68 | Male | T3N1M1 | N |
| P13 | 69 | Female | T3N1M1 | Y (PD, XELOX) |
| P14 | 46 | Female | T3N1M1 | Y (PD, XELOX) |
| P15 | 51 | Female | T3N1M1 | Y (PR, FOLFOX) |
| P16 | 64 | Female | T3N1M1 | N |
| P17 | 49 | Female | T3N1M1 | N |
| P18 | 55 | Male | T3N1M1 | Y (PD, XELOX) |
| P19 | 63 | Female | T2N0M1 | Y (PD, XELOX) |
| P20 | 54 | Male | T3N0M1 | Y (SD, FOLFOX) |
Author response table 2
The baseline data of patient from spatial transcriptome database.
| Patient | Age | Sex | TNM | Treatment |
|---|---|---|---|---|
| ST-P1 | 73 | Male | T3N0M1 | N |
| ST-P2 | 67 | Female | T3N1M1 | N |
| ST-P3 | 72 | Male | T3N1M1 | Y (XELOX) |
| ST-P4 | 68 | Female | T3N1M1 | Y (XELOX) |
Additional files
-
Supplementary file 1
Characterized genes for Single-cell transcriptomic analysis.
- https://cdn.elifesciences.org/articles/97201/elife-97201-supp1-v1.docx
-
Supplementary file 2
Characterized genes for spatial transcriptomic analysis.
- https://cdn.elifesciences.org/articles/97201/elife-97201-supp2-v1.docx
-
Supplementary file 3
Characterized genes of natural killer (NK) subsets.
- https://cdn.elifesciences.org/articles/97201/elife-97201-supp3-v1.docx
-
Supplementary file 4
Characterized genes of natural killer NK of different status.
- https://cdn.elifesciences.org/articles/97201/elife-97201-supp4-v1.docx
-
Supplementary file 5
Fluorescence Minus One control of CD56, CD9, PD-1 and CD49a.
- https://cdn.elifesciences.org/articles/97201/elife-97201-supp5-v1.docx
-
Supplementary file 6
Fluorescence Minus One control of KIR2DL4 and GZMK.
- https://cdn.elifesciences.org/articles/97201/elife-97201-supp6-v1.docx
-
Supplementary file 7
Primers for quantitative real-time PCR (qPCR).
- https://cdn.elifesciences.org/articles/97201/elife-97201-supp7-v1.docx
-
MDAR checklist
- https://cdn.elifesciences.org/articles/97201/elife-97201-mdarchecklist1-v1.pdf
-
Source code 1
Source code used in this study.
- https://cdn.elifesciences.org/articles/97201/elife-97201-code1-v1.zip
Download links
A two-part list of links to download the article, or parts of the article, in various formats.
Downloads (link to download the article as PDF)
Open citations (links to open the citations from this article in various online reference manager services)
Cite this article (links to download the citations from this article in formats compatible with various reference manager tools)
Resting natural killer cells promote the progress of colon cancer liver metastasis by elevating tumor-derived stem cell factor
eLife 13:RP97201.
https://doi.org/10.7554/eLife.97201.3


