Investigating working memory updating processes of the human subcortex using 7T MRI
- Integrative Model-Based Neuroscience Research Unit, University of Amsterdam, Netherlands
- Cognitive Psychology Unit, Institute of Psychology and Leiden Institute for Brain and Cognition, Leiden University, Netherlands
- Full brain picture Analytics, Netherlands
- Department of Psychology, Shandong Normal University, China
- Norwegian University of Science and Technology, Norway
Figures
Figure 1

Example of the reference-back paradigm, including functional magnetic resonance imaging (fMRI) timing, as used in the experiment.
In each trial, participants are tasked with indicating whether the probe stimulus ('X' or 'O') matches or differs from the stimulus presented in the most recent red frame, which serves as the working memory referent. In reference trials (red frame), participants are required to update their working memory with the currently displayed item. On the other hand, in comparison trials (blue frame), participants make the ‘same/different' decision but do not update their working memory.
Figure 2
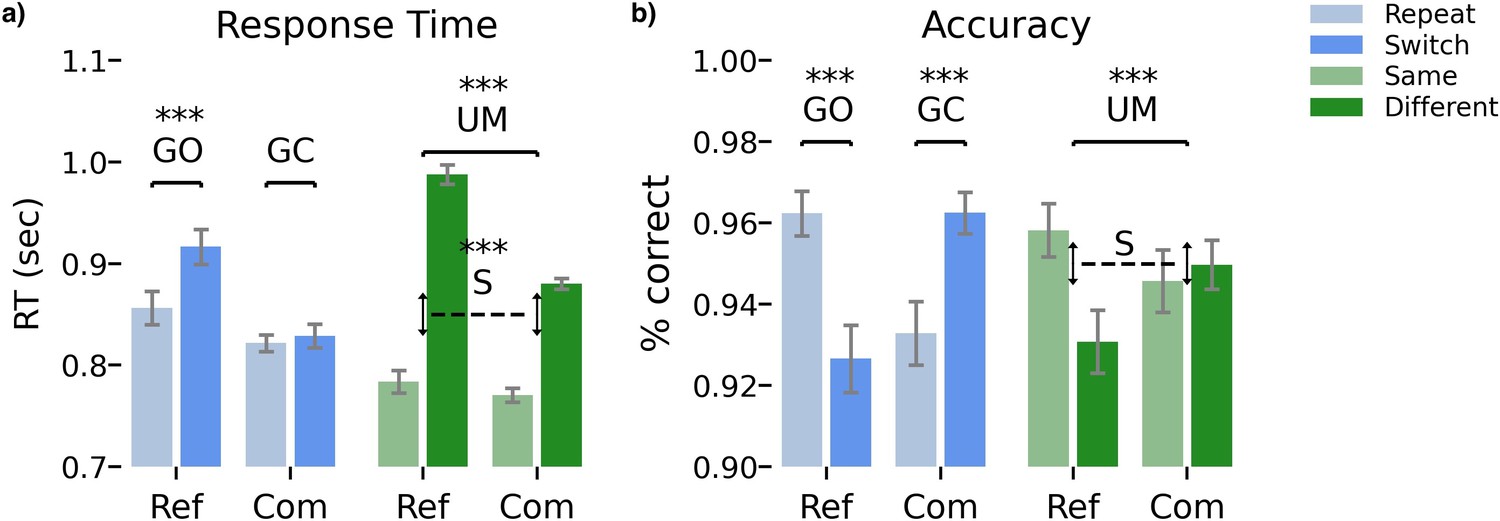
The figure illustrates the mean response times (and standard error of the mean) in relation to two factors.
(a) whether the condition was switched or repeated and (b) whether the stimulus/response matched the previous reference stimulus or differed from it. The figure also displays the associated behavioral contrasts and their significance levels. See Reference-back task for detailed information on how the contrasts were computed. Ref = reference trials; Com = comparison trials; GO = gate opening; GC = gate closing; S=substitution; UM = updating mode. ***=p<0.001.
-
Figure 2—source data 1
Behavioral measures from the experimental design.
- https://cdn.elifesciences.org/articles/97874/elife-97874-fig2-data1-v1.csv
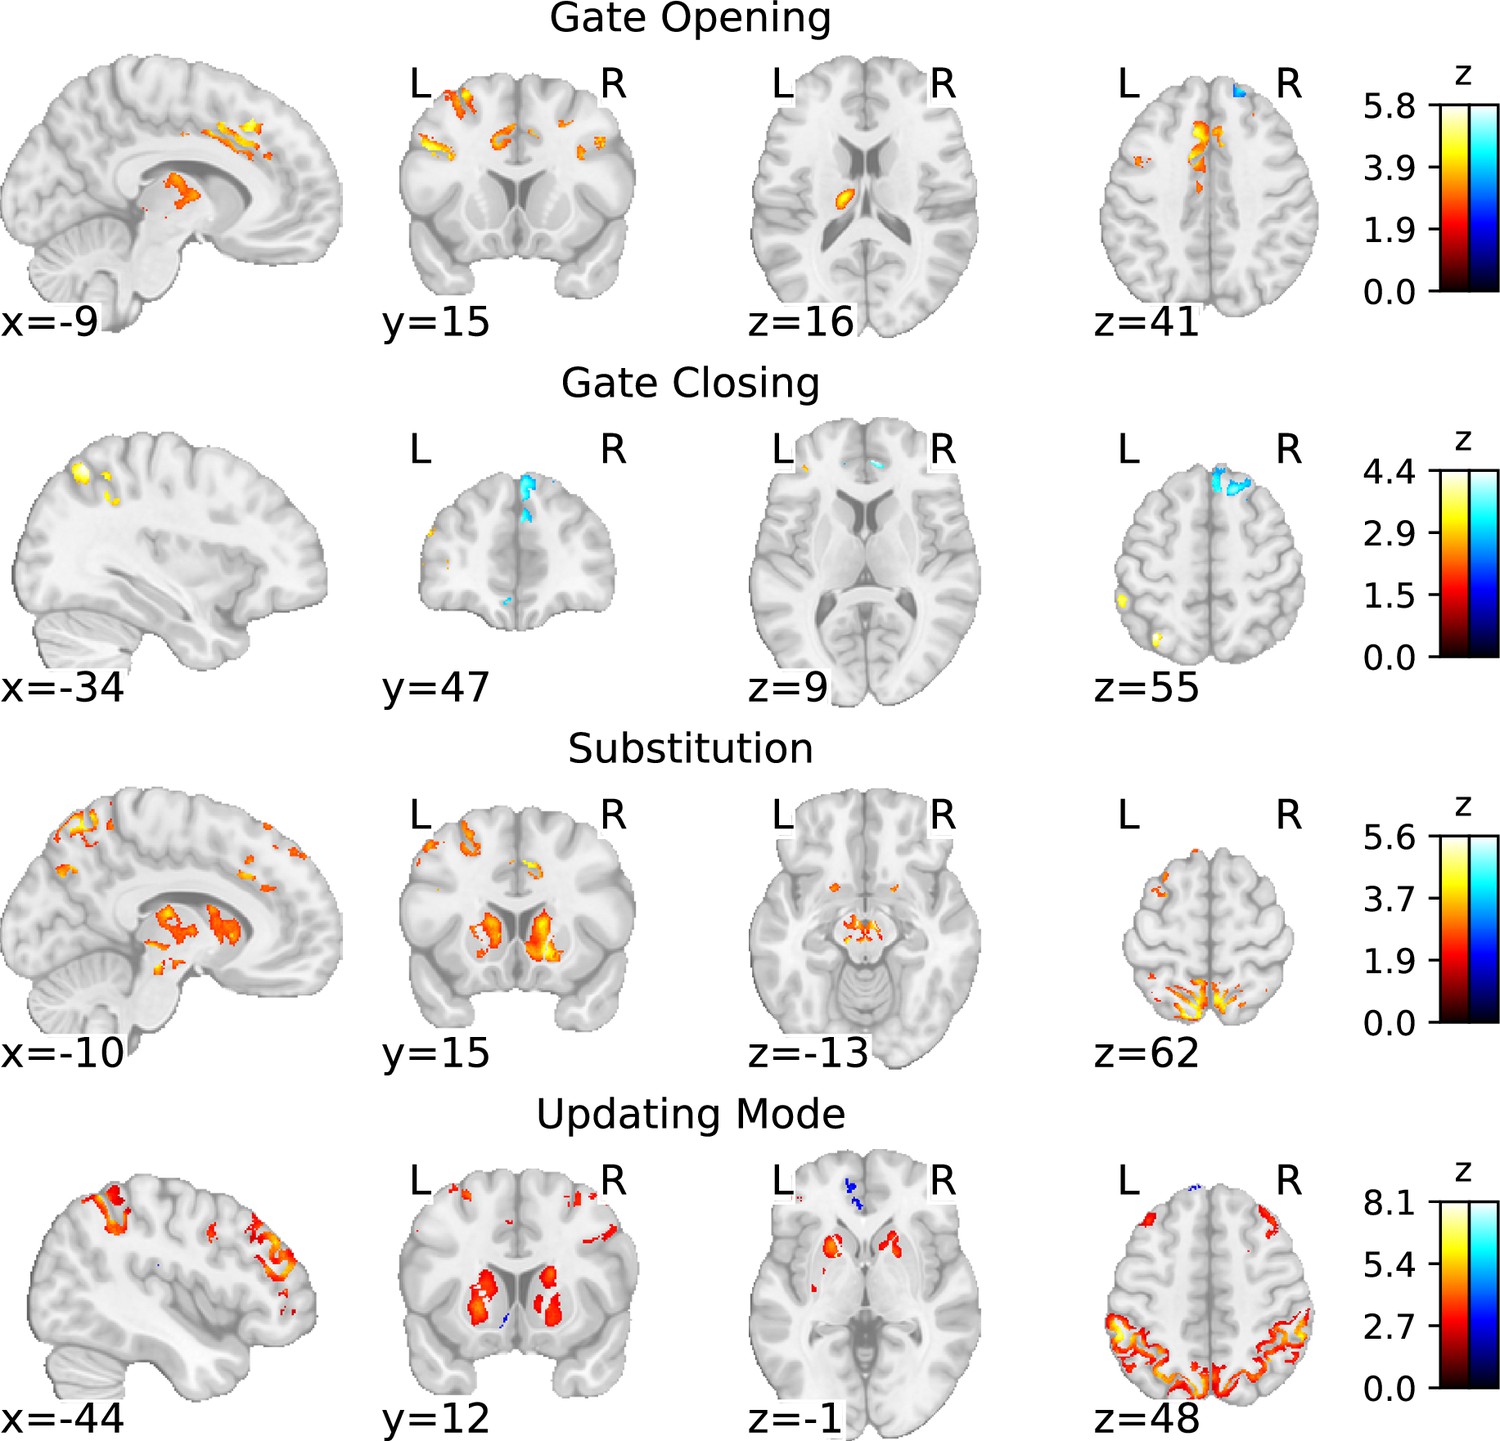
Figure 3

Statistical parametric map of the ‘gate opening’ contrast with a threshold determined using the family-wise error rate (FWER) method (p<0.05; corresponding to a threshold of z=2.3).
Figure 4

Statistical parametric map of the ‘gate closing’ contrast with a threshold determined using the family-wise error rate (FWER) method (p<0.05; corresponding to a threshold of z=2.3).
Figure 5

Statistical parametric map of the ‘substitution’ contrast with a threshold determined using the family-wise error rate (FWER) method (p<0.05; corresponding to a threshold of z=2.3).
Figure 6

Statistical parametric map of the ‘updating mode’ contrast with a threshold determined using the family-wise error rate (FWER) method (p<0.05; corresponding to a threshold of z=2.3).
Figure 7
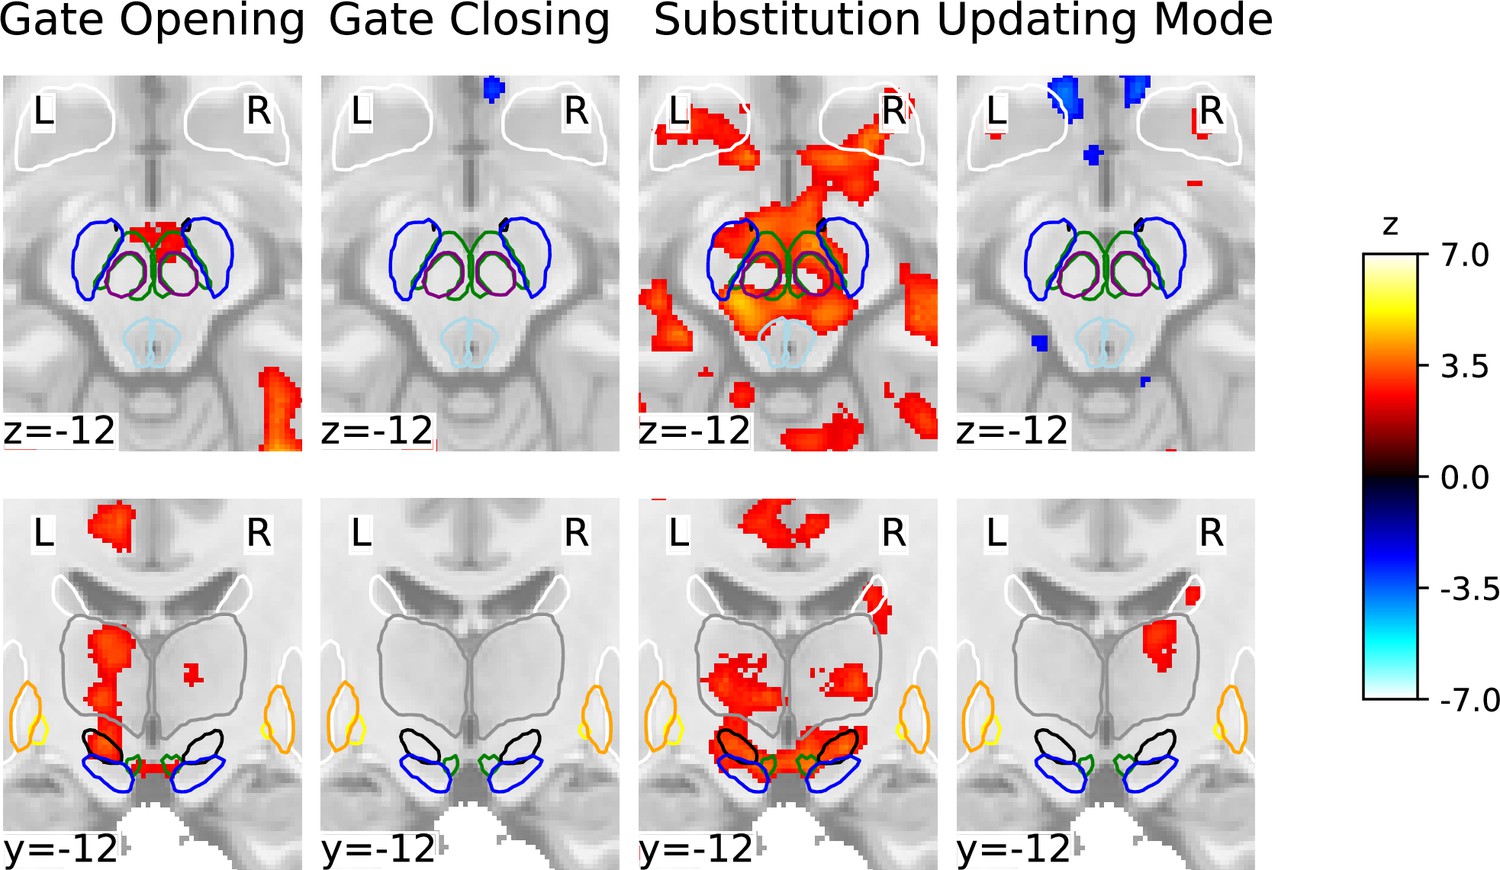
Subcortical statistical parametric mapping of the four contrasts with a focus on the midbrain (top row), and midbrain and thalamic regions (bottom row) using a family-wise error rate (FWER) threshold of 2.3.
Coordinates are in MNI2009cAsym (1 mm) space. For orientation purposes, the MASSP atlas is overlaid: substantia nigra (SN) (blue), ventral tegmental area (VTA) (black), red nucleus (purple), subthalamic nucleus (green), periaqueductal gray (light blue), globus pallidus interna (GPi) (yellow), globus pallidus externa (GPe) (orange), striatum (white), and thalamus (gray).
Figure 8
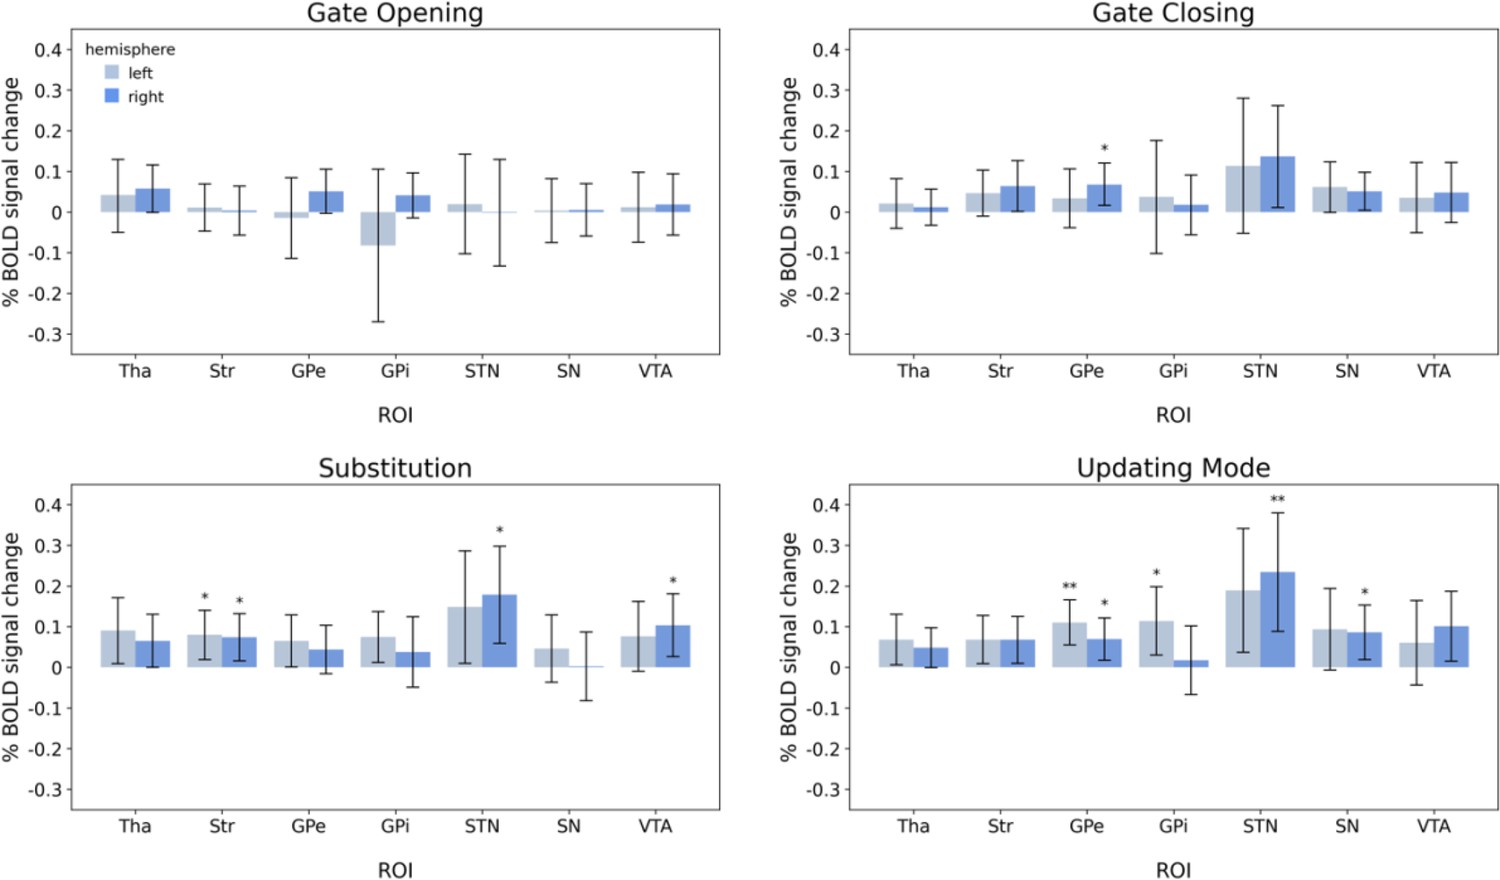
Results of the region-of-interest-wise GLMs using the individually parcellated masks derived from MASSP.
Error bars represent the 95% credible intervals. Abbreviations indicate thalamus (Tha), striatum (Str), globus pallidus externa (GPe), globus pallidus interna (GPi), subthalamic nucleus (STN), substantia nigra (SN), and ventral tegmental area (VTA). * indicate moderate evidence and ** indicate strong evidence that the observed BOLD signal change is larger than 0.
Figure 9
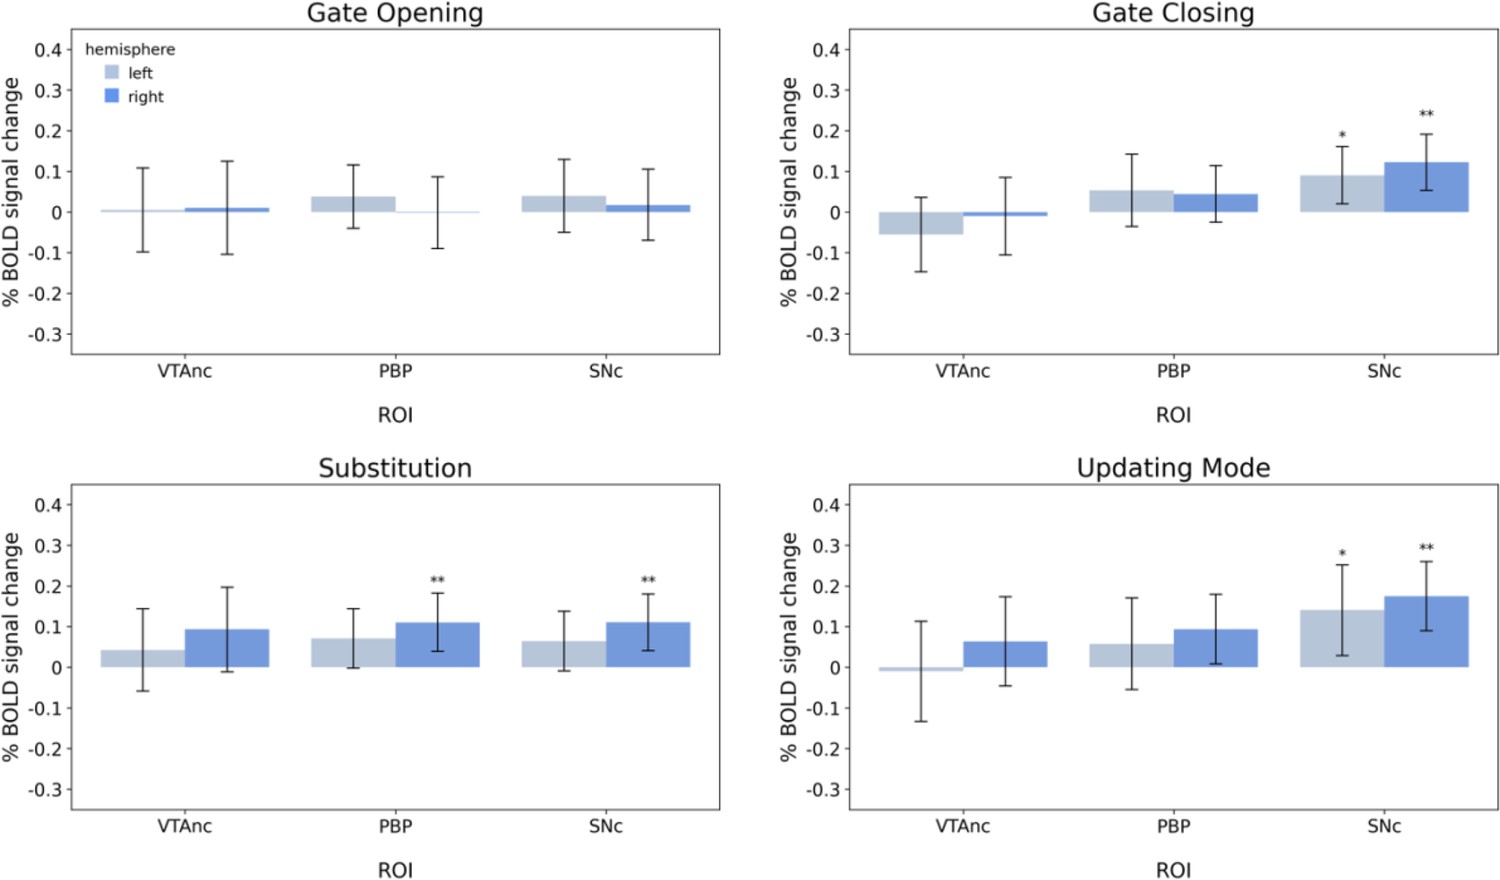
Results of the region-of-interest-wise GLMs using the probabilistic atlas from Pauli et al., 2018.
Error bars represent the 95% credible intervals. Abbreviations indicate ventral tegmental area (VTA) nucleus, parabrachial pigmented (PBP) nucleus, and substantia nigra pars compacta (SNc). * indicate moderate evidence and ** indicate strong evidence that the observed BOLD signal change is larger than 0.
Appendix 1—figure 1
Results of the voxel-wise cluster-based region-of-interest (ROI) analysis using ROI-wide false discovery rate (FDR) correction (q<0.05) are illustrated.
Each row shows the BOLD signal change within the ROIs for one of the four working memory process contrasts, respectively.
Appendix 1—figure 2
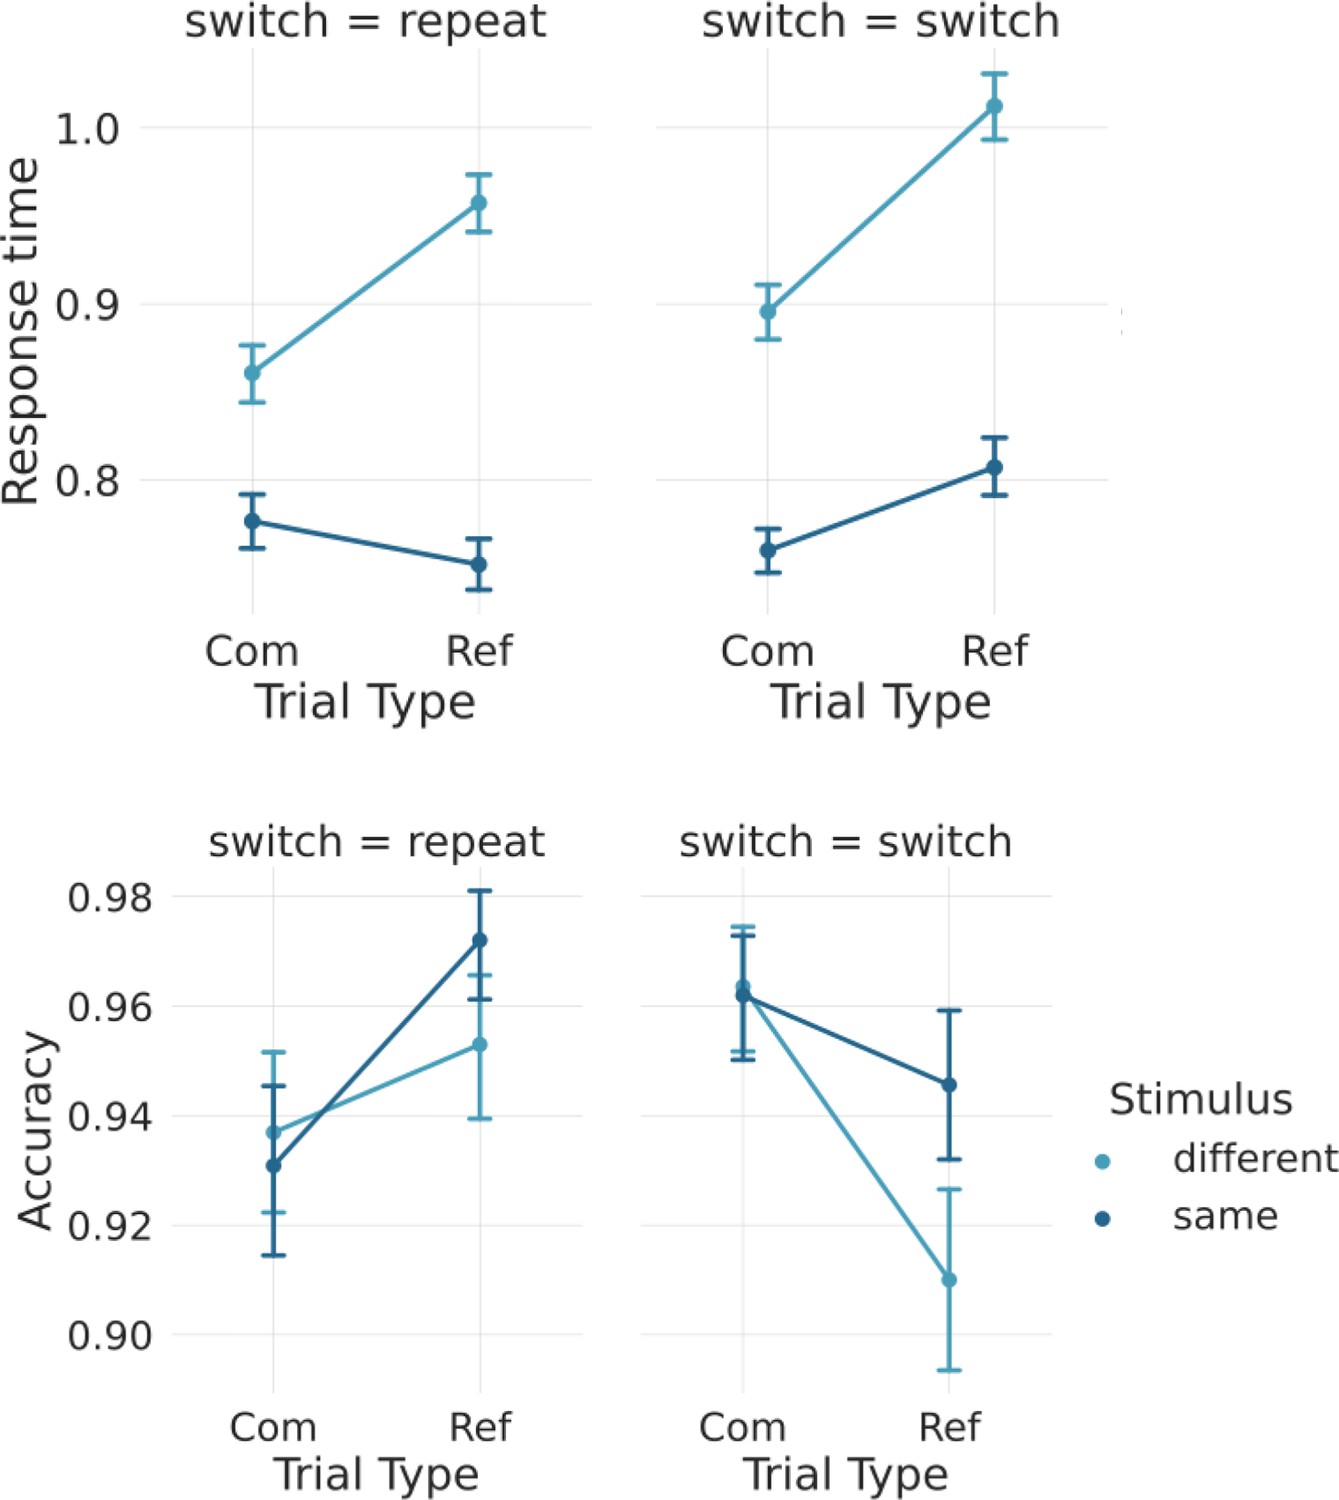
The graph outlines the nonsignificant three-way interactions of the factors Trial-type (comparison, reference), Gate-Switch (repeat, switch), and Stimulus/Match (same, different) for both reaction time (RT; top) and accuracy (bottom), respectively.
The results indicate that the difference in RT between same and different trials is more pronounced in reference trials compared to comparison trials, suggesting that additional time is required for substitution of the WM item in the reference condition. However, in contrast to previous studies, a larger gate-switching cost, representing the difference between switch and repeat conditions, is only found in reference trials (gate opening) and not in comparison trials (gate closing). The error bars in the figures represent bootstrapped 95% confidence intervals.
-
Appendix 1—figure 2—source data 1
Behavioral measures from the experimental design.
- https://cdn.elifesciences.org/articles/97874/elife-97874-app1-fig2-data1-v1.csv
Tables
Table 1
Hierarchical descriptive statistics for the behavioral data.
| Response time | Accuracy | |||||
|---|---|---|---|---|---|---|
| Trial type | Switch type | Response type | Mean (s) | SD | Mean (%) | SD |
| Reference | Repeat | Same | 0.751 | 0.243 | 97.205 | 0.164 |
| Different | 0.957 | 0.269 | 95.298 | 0.211 | ||
| Switch | Same | 0.807 | 0.274 | 94.560 | 0.227 | |
| Different | 1.012 | 0.291 | 91.001 | 0.286 | ||
| Comparison | Repeat | Same | 0.776 | 0.262 | 93.085 | 0.254 |
| Different | 0.861 | 0.253 | 93.693 | 0.243 | ||
| Switch | Same | 0.76 | 0.216 | 96.196 | 0.191 | |
| Different | 0.896 | 0.255 | 96.357 | 0.187 | ||
Table 2
Contrast weights for defining the four distinct working memory updating subprocessess.
| Trial type | reference | comparison | |||||||
|---|---|---|---|---|---|---|---|---|---|
| Gate switch | repeat | switch | repeat | switch | |||||
| Response | same | different | same | different | same | different | same | different | |
| Contrast | |||||||||
| Gate opening | - | - | + | + | |||||
| Gate closing | - | - | + | + | |||||
| Substitution | - | + | + | - | |||||
| Updating mode | + | + | - | - | |||||
Table 3
List of peak activation in MNI coordinates from the whole-brain analysis.
| MNI | |||||||
|---|---|---|---|---|---|---|---|
| hem | Voxels | x | y | z | Z | ||
| Gate opening | |||||||
| preSMA | l | 13380 | –6.0 | 12.0 | 50.0 | 6.387 | |
| Occipital fusiform gyrus | l | 8915 | –29.0 | –63.0 | –7.0 | 5.144 | |
| MFG | r | 849 | 34.0 | 9.0 | 29.0 | 5.129 | |
| Insular | l | 724 | –30.0 | 29.0 | –1.0 | 5.025 | |
| Precuneus cortex | l | 5482 | 7.0 | –67.0 | 25.0 | 4.422 | |
| Brainstem | 841 | 0.0 | –33.0 | –29.0 | 4.338 | ||
| Primary somatosensory cortex | r | 2043 | 41.0 | –16.0 | 50.0 | 4.219 | |
| M1 | l | 976 | –27.0 | –28.0 | 64.0 | 4.064 | |
| Primary somatosensory cortex | l | 566 | –53.0 | –14.0 | 40.0 | 3.958 | |
| M1 | r | 81 | 11.0 | –24.0 | 81.0 | 3.363 | |
| Primary somatosensory cortex | r | 34 | 66.0 | –8.0 | 30.0 | 3.284 | |
| Primary motor cortex | l | 92 | –35.0 | –20.0 | 45.0 | 3.188 | |
| Gate closing | |||||||
| Inferior parietal cortex | l | 3769 | –27.0 | –64.0 | 36.0 | 4.560 | |
| Inferior temporal gyrus | l | 716 | –52.0 | –65.0 | –12.0 | 4.376 | |
| VI (cerebellum) | r | 2418 | 28.0 | –61.0 | –28.0 | 4.316 | |
| Fusiform gyrus | l | 957 | –33.0 | –80.0 | –20.0 | 4.284 | |
| V (cerebellum) | l | 1680 | –50.0 | 42.0 | 9.0 | 4.091 | |
| Fusiform gyrus | r | 14 | 35.0 | –79.0 | –21.0 | 3.070 | |
| Substitution | |||||||
| M1 | l | 68499 | –45.0 | –13.0 | 38.0 | 6.834 | |
| Putamen | l | 1813 | –20.0 | 5.0 | 0.0 | 5.530 | |
| BA 9 (dlPFC) | l | 714 | –22.0 | 56.0 | 33.0 | 4.763 | |
| Insular | l | 108 | –31.0 | 17.0 | 10.0 | 3.389 | |
| Brainstem | 32 | –19.0 | –32.0 | –33.0 | 3.184 | ||
| M1 | r | 15 | 25.0 | –25.0 | 68.0 | 2.974 | |
| BA 9 (dlPFC) | l | 21 | –31.0 | 41.0 | 45.0 | 2.892 | |
| Parahippocampal gyrus | l | 12 | –28.0 | –30.0 | –20.0 | 2.825 | |
| Visual cortex V1 | r | 12 | 29.0 | –62.0 | 5.0 | 2.803 | |
| Cingulate gyrus | r | 15 | 5.0 | –51.0 | 19.0 | 2.728 | |
| Inferior parietal lobule | l | 13 | –57.0 | –44.0 | 34.0 | 2.652 | |
| Visual cortex V4 | r | 19 | 22.0 | –71.0 | –1.0 | 2.633 | |
| Updating mode | |||||||
| BA 40 (PPC) | l | 24635 | –56.0 | –41.0 | 55.0 | 8.084 | |
| MFG | l | 19609 | –36.0 | 0.0 | 65.0 | 6.160 | |
| BA 9 (dlPFC) | l | 5254 | –44.0 | 38.0 | 33.0 | 5.816 | |
| Fusiform gyrus | r | 12503 | 30.0 | –70.0 | –17.0 | 5.776 | |
| Putamen | l | 1486 | –21.0 | 15.0 | –2.0 | 4.983 | |
| Caudate | r | 1702 | 17.0 | 13.0 | 16.0 | 4.384 | |
| Inferior temporal gyrus | r | 45 | 49.0 | –38.0 | –16.0 | 3.162 | |
| Precuneus cortex | r | 19 | 18.0 | –60.0 | 31.0 | 2.754 |
Table 4
Results from the Bayesian one-sample t-test on the beta values derived from the region-of-interest (ROI)-wise GLMs are reported for each contrast and ROI.
Moderate or higher evidence for ROI activity is indicated by bold font. Bayes factors favoring the alternative hypothesis are reported under BF10, and Bayes factors favoring the null hypothesis in column BF01.
| ROI | hem | BF10 | BF01 | Error % | |
|---|---|---|---|---|---|
| Gate opening | Tha | l | 0.287 | 3.489 | 0.037 |
| r | 1.070 | 0.934 | 0.023 | ||
| Str | l | 0.197 | 5.072 | 0.041 | |
| r | 0.185 | 5.407 | 0.041 | ||
| GPe | l | 0.192 | 5.213 | 0.041 | |
| r | 0.952 | 1.050 | 0.024 | ||
| GPi | l | 0.266 | 3.755 | 0.038 | |
| r | 0.510 | 1.962 | 0.031 | ||
| STN | l | 0.193 | 5.184 | 0.041 | |
| r | 0.184 | 5.440 | 0.041 | ||
| SN | l | 0.184 | 5.421 | 0.041 | |
| r | 0.186 | 5.372 | 0.041 | ||
| VTA | l | 0.190 | 5.250 | 0.041 | |
| r | 0.207 | 4.831 | 0.040 | ||
| Gate closing | Tha | l | 0.229 | 4.364 | 0.039 |
| r | 0.208 | 4.799 | 0.040 | ||
| Str | l | 0.643 | 1.556 | 0.028 | |
| r | 1.239 | 0.807 | 0.021 | ||
| GPe | l | 0.275 | 3.636 | 0.038 | |
| r | 3.582 | 0.279 | 6.359×10⁻⁷ | ||
| GPi | l | 0.211 | 4.746 | 0.040 | |
| r | 0.205 | 4.874 | 0.040 | ||
| STN | l | 0.444 | 2.255 | 0.033 | |
| r | 1.568 | 0.638 | 0.019 | ||
| SN | l | 1.104 | 0.905 | 0.022 | |
| r | 1.537 | 0.651 | 0.019 | ||
| VTA | l | 0.254 | 3.936 | 0.038 | |
| r | 0.404 | 2.478 | 0.034 | ||
| Substitution | Tha | l | 1.722 | 0.581 | 0.018 |
| r | 1.138 | 0.879 | 0.022 | ||
| Str | l | 3.846 | 0.260 | 5.752×10⁻⁷ | |
| r | 3.292 | 0.304 | 7.157×10⁻⁷ | ||
| GPe | l | 1.232 | 0.812 | 0.021 | |
| r | 0.502 | 1.992 | 0.031 | ||
| GPi | l | 2.367 | 0.422 | 1.108×10⁻⁶ | |
| r | 0.264 | 3.791 | 0.038 | ||
| STN | l | 1.486 | 0.673 | 0.019 | |
| r | 8.206 | 0.122 | 1.685×10⁻⁷ | ||
| SN | l | 0.326 | 3.065 | 0.036 | |
| r | 0.184 | 5.434 | 0.041 | ||
| VTA | l | 0.779 | 1.284 | 0.026 | |
| r | 4.089 | 0.245 | 5.267×10⁻⁷ | ||
| Updating mode | Tha | l | 1.605 | 0.623 | 0.019 |
| r | 1.035 | 0.967 | 0.023 | ||
| Str | l | 1.943 | 0.515 | 1.415×10⁻⁶ | |
| r | 2.233 | 0.448 | 1.192×10⁻⁶ | ||
| GPe | l | 90.327 | 0.011 | 1.536×10⁻⁸ | |
| r | 3.956 | 0.253 | 5.523×10⁻⁷ | ||
| GPi | l | 4.451 | 0.225 | 4.633×10⁻⁷ | |
| r | 0.199 | 5.024 | 0.040 | ||
| STN | l | 2.862 | 0.349 | 8.649×10⁻⁷ | |
| r | 14.117 | 0.071 | 5.350×10⁻⁸ | ||
| SN | l | 0.908 | 1.101 | 0.025 | |
| r | 3.273 | 0.306 | 7.215×10⁻⁷ | ||
| VTA | l | 0.348 | 2.877 | 0.035 | |
| r | 2.185 | 0.458 | 1.225×10⁻⁶ |
Table 5
Results from the Bayesian one-sample t-test on the beta values derived from the region-of-interest (ROI) GLMs using the masks from Pauli et al., 2018, are reported for each contrast and ROI.
Moderate or higher evidence for ROI activity is indicated by bold font. Bayes factors favoring the alternative hypothesis are reported under BF10, and Bayes factors favoring the null hypothesis in column BF01.
| ROI | hem | BF10 | BF01 | Error % | |
|---|---|---|---|---|---|
| Gate opening | VTAnc | l | 0.190 | 5.256 | 0.041 |
| r | 0.184 | 5.436 | 0.041 | ||
| PBP | l | 0.351 | 2.851 | 0.035 | |
| r | 0.185 | 5.392 | 0.041 | ||
| SNc | l | 0.267 | 3.741 | 0.038 | |
| r | 0.198 | 5.048 | 0.041 | ||
| Gate closing | VTAnc | l | 0.388 | 2.578 | 0.034 |
| r | 0.213 | 4.705 | 0.040 | ||
| PBP | l | 0.340 | 2.944 | 0.035 | |
| r | 0.414 | 2.415 | 0.033 | ||
| SNc | l | 3.348 | 0.299 | 6.990×10⁻⁷ | |
| r | 32.293 | 0.031 | 4.835×10⁻⁹ | ||
| Substitution | VTAnc | l | 0.184 | 5.429 | 0.041 |
| r | 0.459 | 2.178 | 0.032 | ||
| PBP | l | 0.774 | 1.292 | 0.026 | |
| r | 3.913 | 0.256 | 5.609×10⁻⁷ | ||
| SNc | l | 0.754 | 1.326 | 0.027 | |
| r | 13.330 | 0.075 | 6.138×10⁻⁸ | ||
| Updating mode | VTAnc | l | 0.224 | 4.474 | 0.040 |
| r | 0.343 | 2.916 | 0.035 | ||
| PBP | l | 0.265 | 3.777 | 0.038 | |
| r | 1.304 | 0.767 | 0.021 | ||
| SNc | l | 3.105 | 0.322 | 7.757×10⁻⁷ | |
| r | 142.529 | 0.007 | 2.305×10⁻⁴ | ||
| Note: For all tests, the alternative hypothesis specifies that the population mean differs from 0. BF10 1–3 indicates weak evidence, BF10 3–10 moderate evidence, and BF10 >10 strong evidence. | |||||
Appendix 1—table 1
List of peak activation in MNI coordinates from the cluster-based region-of-interest (ROI) analysis.
| MNI | ||||||||
|---|---|---|---|---|---|---|---|---|
| ROI | hem | Voxels | x | y | z | Z | ||
| Gate opening | ||||||||
| dlPFC | BA8 | l | 401 | –7.0 | 26.0 | 46.0 | 5.733 | |
| BA8 | r | 205 | 9.0 | 25.0 | 45.0 | 4.667 | ||
| BA9 | l | 239 | –46.0 | 15.0 | 32.0 | 5.122 | ||
| BA9 | r | 179 | 34.0 | 9.0 | 29.0 | 5.129 | ||
| BA46 | l | 94 | –51.0 | 22.0 | 27.0 | 4.746 | ||
| mPFC | BA24 | l | 123 | –9.0 | 4.0 | 40.0 | 4.154 | |
| BA32 | l | 219 | –9.0 | 11.0 | 45.0 | 4.667 | ||
| Subcortex | Tha | l | 401 | –14.0 | –17.0 | 16.0 | 4.613 | |
| Gate closing | ||||||||
| dlPFC | BA46 | l | 57 | –50.0 | 42.0 | 9.0 | 4.091 | |
| PPC | BA7 | l | 306 | –34.0 | –63.0 | 55.0 | 4.392 | |
| BA40 | l | 89 | –45.0 | –47.0 | 39.0 | 4.111 | ||
| Substitution | ||||||||
| dlPFC | BA8 | l | 258 | –7.0 | 25.0 | 35.0 | 4.704 | |
| BA8 | r | 7 | 4.0 | 15.0 | 42.0 | 4.473 | ||
| BA9 | l | 159 | –22.0 | 56.0 | 33.0 | 4.763 | ||
| mPFC | BA32 | r | 119 | 9.0 | 13.0 | 40.0 | 4.533 | |
| PPC | BA7 | l | 1839 | –14.0 | –70.0 | 62.0 | 5.256 | |
| BA7 | r | 293 | 5.0 | –61.0 | 63.0 | 4.675 | ||
| BA40 | l | 335 | –63.0 | –52.0 | 30.0 | 4.822 | ||
| Subcortex | Tha | l | 1151 | –25.0 | –26.0 | –8.0 | 5.129 | |
| Tha | r | 448 | 6.0 | –23.0 | 2.0 | 4.963 | ||
| Ca | l | 701 | –14.0 | 11.0 | 10.0 | 4.875 | ||
| Ca | r | 1021 | 15.0 | 16.0 | –5.0 | 4.710 | ||
| Pu | l | 402 | –20.0 | 5.0 | 0.0 | 5.530 | ||
| Pu | r | 296 | 16.0 | 15.0 | –5.0 | 4.791 | ||
| GPe | l | 204 | –20.0 | 5.0 | 0.0 | 5.530 | ||
| SN | l | 46 | –11.0 | –24.0 | –13.0 | 4.236 | ||
| SN | r | 19 | 11.0 | –16.0 | –10.0 | 3.962 | ||
| VTA | l | 129 | –2.0 | –22.0 | –19.0 | 4.911 | ||
| VTA | r | 145 | 2.0 | –22.0 | –19.0 | 4.349 | ||
| Updating mode | ||||||||
| dlPFC | BA8 | l | 143 | –26.0 | 5.0 | 60.0 | 5.423 | |
| BA8 | r | 30 | 24.0 | 19.0 | 65.0 | 4.008 | ||
| BA9 | l | 832 | –44.0 | 38.0 | 33.0 | 5.816 | ||
| BA9 | r | 491 | 32.0 | 38.0 | 26.0 | 4.509 | ||
| BA46 | l | 686 | –45.0 | 42.0 | 17.0 | 5.695 | ||
| BA46 | r | 525 | 46.0 | 37.0 | 14.0 | 4.238 | ||
| mPFC | BA32 | l | 20 | –4.0 | 10.0 | 45.0 | 3.367 | |
| PPC | BA7 | l | 2520 | –7.0 | –77.0 | 52.0 | 6.111 | |
| BA7 | r | 248 | 38.0 | –40.0 | 42.0 | 5.465 | ||
| BA40 | l | 2140 | –56.0 | –41.0 | 55.0 | 8.084 | ||
| BA40 | r | 1870 | 49.0 | –41.0 | 56.0 | 6.155 | ||
| Subcortex | Ca | l | 474 | –15.0 | 9.0 | 10.0 | 4.369 | |
| Ca | r | 559 | 17.0 | 13.0 | 16.0 | 4.384 | ||
| Pu | l | 445 | –21.0 | 15.0 | –2.0 | 4.983 | ||
| Pu | r | 326 | 18.0 | 9.0 | –8.0 | 4.268 | ||
| GPe | l | 13 | –17.0 | 9.0 | –1.0 | 3.864 | ||
Appendix 1—table 2
List of peak activation in MNI coordinates from the cluster-based region-of-interest (ROI) analysis using the dopaminergic nuclei’ masks from Pauli et al., 2018, after false discovery rate (FDR) correction (q<0.05).
The data suggests no activation in the ventral tegmental area (VTA) nucleus and parabrachial pigmented (PBP) nucleus, after FDR correction was applied.
| MNI | |||||||
|---|---|---|---|---|---|---|---|
| ROI | hem | Voxels | x | y | z | Z | |
| Substitution | |||||||
| SNc | l | 16 | –10.0 | –25.0 | –13.0 | 4.489 | |
| r | 56 | 10.0 | –17.0 | –10.0 | 4.178 |
Appendix 1—table 3
Significance testing of mean response time (RT) effects using a general linear mixed model with a Gaussian link function.
| Effect | df | F | p |
|---|---|---|---|
| Trial type | 1, 36.20 | 73.520 | <0.001 |
| Switch type | 1, 44.45 | 32.521 | <0.001 |
| Response type | 1, 33.82 | 263.189 | <0.001 |
| Trial type × switch type | 1, 56.82 | 19.802 | <0.001 |
| Trial type × response type | 1, 33.59 | 29.062 | <0.001 |
| Switch type × response type | 1, 166.02 | 6.005 | 0.015 |
| Trial type × switch type × response type | 1, 33.17 | 3.836 | 0.059 |
-
Note: Type III sum of squares.
-
Trial type = reference/comparison, match = same/different, switch = repeat/switch.
Appendix 1—table 4
Significance testing of accuracy effects using a generalized linear mixed model with a probit link function.
| Effect | df | F | p |
|---|---|---|---|
| Trial type | 1 | 0.167 | 0.683 |
| Switch type | 1 | 5.666 | 0.017 |
| Response type | 1 | 0.306 | 0.580 |
| Trial type × switch type | 1 | 9.996 | 0.002 |
| Trial type × response type | 1 | 42.588 | <0.001 |
| Switch type × response type | 1 | 0.086 | 0.770 |
| Trial type × switch type × response type | 1 | 0.007 | 0.934 |
-
Note: Type III sum of squares.
-
Trial type = reference/comparison, match = same/different, switch = repeat/switch.
Appendix 1—table 5
Inferential statistics of the response time and accuracy data analysis.
| Estimate | SE | df | z | p* | ||
|---|---|---|---|---|---|---|
| Response time | ||||||
| Gate opening | 0.120 | 0.018 | 34 | 6.547 | <0.001 | |
| Gate closing | 0.014 | 0.015 | 34 | 0.949 | 0.797 | |
| Substitution | 0.125 | 0.020 | 34 | 6.107 | <0.001 | |
| Updating mode | 0.070 | 0.015 | 34 | 4.598 | <0.001 | |
| Accuracy | ||||||
| Gate opening | –0.062 | 0.014 | ∞ | –4.463 | <0.001 | |
| Gate closing | 0.049 | 0.013 | ∞ | 3.802 | <0.001 | |
| Substitution | –0.021 | 0.012 | ∞ | –1.792 | 0.073 | |
| Updating mode | 0.048 | 0.013 | ∞ | 3.726 | <0.001 |
-
*
p-Values are adjusted using Holm adjustment.
Additional files
-
Transparent reporting form
- https://cdn.elifesciences.org/articles/97874/elife-97874-transrepform1-v1.pdf
-
Appendix 1—figure 2—source data 1
Behavioral measures from the experimental design.
- https://cdn.elifesciences.org/articles/97874/elife-97874-app1-fig2-data1-v1.csv
Download links
A two-part list of links to download the article, or parts of the article, in various formats.
Downloads (link to download the article as PDF)
Open citations (links to open the citations from this article in various online reference manager services)
Cite this article (links to download the citations from this article in formats compatible with various reference manager tools)
Investigating working memory updating processes of the human subcortex using 7T MRI
eLife 13:RP97874.
https://doi.org/10.7554/eLife.97874.3


