Secondary structure of the SARS-CoV-2 genome is predictive of nucleotide substitution frequency
- ITQB NOVA, Universidade NOVA de Lisboa, Portugal
Figures
Figure 1 with 2 supplements

Basepairing is predictive of synonymous substitution frequency.
Distribution of frequencies of synonymous substitutions for the most common substitutions (each approximately corresponding to 5% or more of observed substitutions), expressed as the estimated mutational fitness, which is a logarithmic comparison of the observed versus the expected number of occurrences of each type of substitution in the SARS-CoV-2 phylogenetic tree (Bloom and Neher, 2023). Distributions are grouped by substitution type and whether positions are basepaired in a full-genome secondary structure model of SARS-CoV-2 in Huh7 cells (Lan et al., 2022) . Boxplots indicate the median and interquartile range. The median relative substitution rate (ratio of median rates of substitutions at unpaired and paired positions) is shown above each type of substitution.
Figure 1—figure supplement 1

Basepairing dependence of effect of 5′ context on synonymous C→U substitution frequency.
Distribution of frequencies of synonymous substitutions for C→U substitutions, expressed as the estimated mutational fitness, which is a logarithmic comparison of the observed versus the expected number of occurrences of each type of substitution in the SARS-CoV-2 phylogenetic tree. Boxplots indicate the median and interquartile range. Distributions are grouped by the identity at the 5′ position and by whether positions are basepaired in a full-genome secondary structure model of SARS-CoV-2.
Figure 1—figure supplement 2

Basepairing dependence of effect of 3′ context on synonymous C→U substitution frequency.
Distribution of frequencies of synonymous substitutions for C→U substitutions, expressed as the estimated mutational fitness, which is a logarithmic comparison of the observed versus the expected number of occurrences of each type of substitution in the SARS-CoV-2 phylogenetic tree. Boxplots indicate the median and interquartile range. Distributions are grouped by the identity at the 3′ position and by whether positions are basepaired in a full-genome secondary structure model of SARS-CoV-2.
Figure 2 with 1 supplement
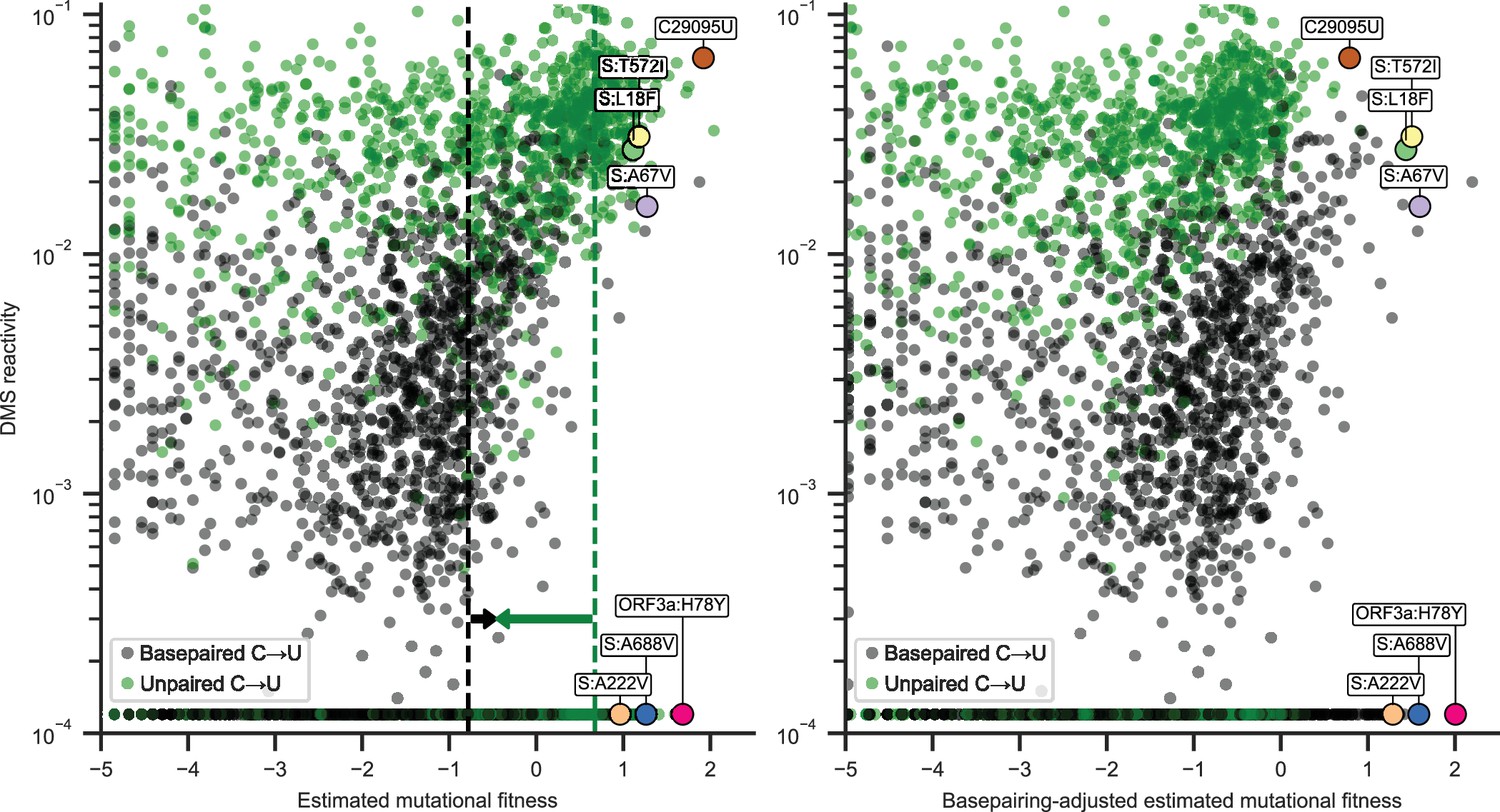
Estimated mutational fitness correlates with secondary structure for nonsynonymous C→U substitutions.
Scatter plots compare mutational fitness to average dimethyl sulfate (DMS) reactivity for positions with potential nonsynonymous C→U substitutions. The minimum observed DMS reactivity value is assigned to positions lacking data. Points are colored by basepairing in the full genome secondary structure model. Nonsynonymous C→U substitutions at basepaired positions are highlighted, which rank highly for mutational fitness and characterize major SARS-CoV-2 lineages. Synonymous C29095U at an unpaired position is also highlighted. Left: estimated mutational fitness based only on observed versus expected occurrences of C→U at each position. Dashed lines indicate the median estimated mutational fitness for synonymous substitutions at paired and unpaired positions. Arrows indicate the magnitudes of adjustments made to mutational fitness that result in median fitness of synonymous substitutions at paired (+0.32) and unpaired (−1.13) positions identical to the unadjusted median for all synonymous substitutions (−0.46). Right: mutational fitness adjusted by constants derived from the medians of mutational fitness for synonymous substitutions at basepaired, unpaired, and all potential C→U positions.
Figure 2—figure supplement 1
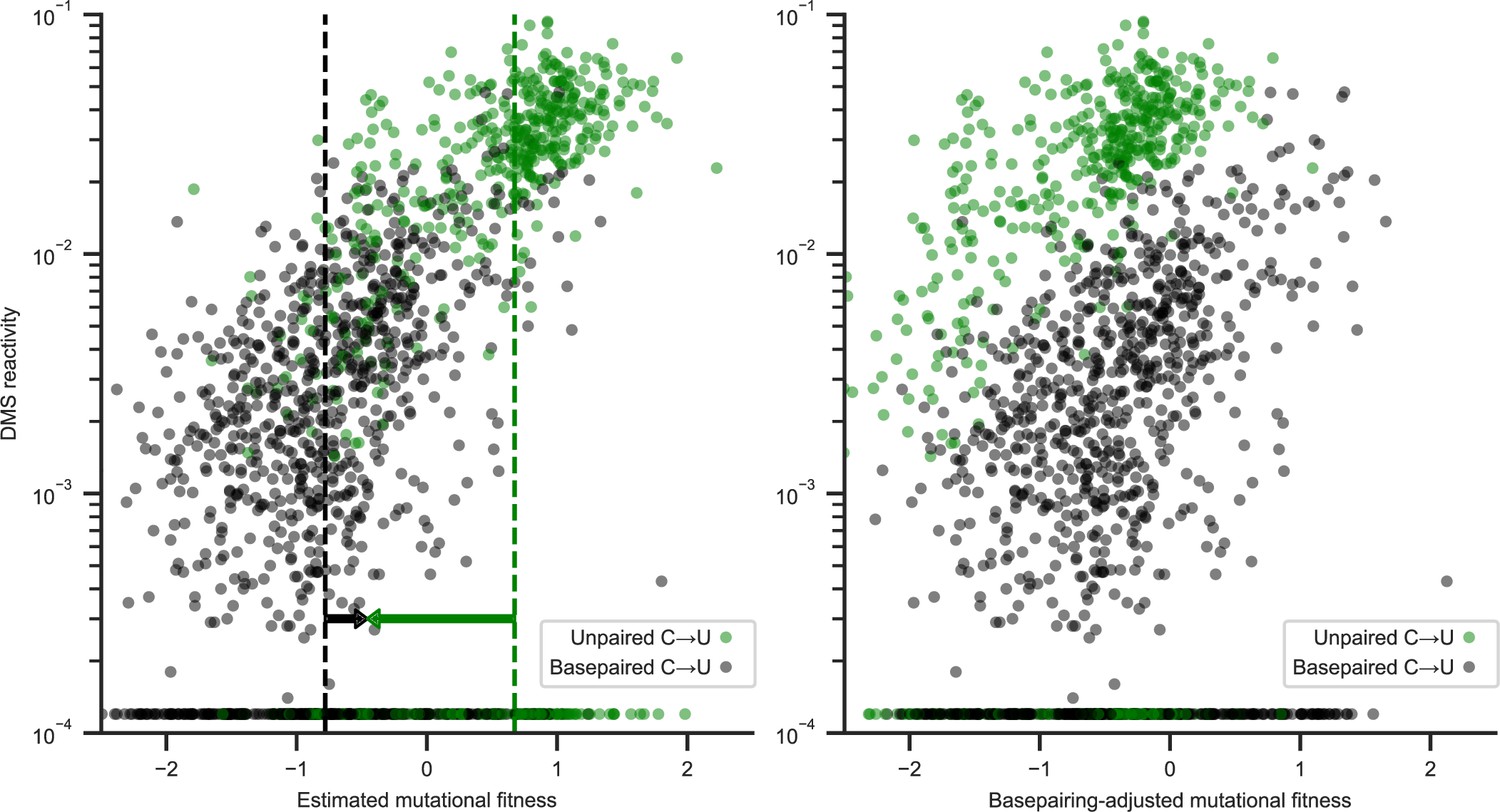
Estimated mutational fitness correlates with secondary structure for synonymous C→U substitutions.
Scatter plots compare mutational fitness to average dimethyl sulfate (DMS) reactivity for positions with potential synonymous C→U substitutions. The minimum observed DMS reactivity value is assigned to positions lacking data. Points are colored by basepairing in the full genome secondary structure model. Left: estimated mutational fitness based only on observed versus expected occurrences of C→U at each position. Dashed lines indicate the median estimated mutational fitness for synonymous substitutions at paired and unpaired positions (identical to Figure 2). Arrows indicate the magnitudes of adjustments made to mutational fitness that result in median fitness of synonymous substitutions at paired (+0.32) and unpaired (−1.13) positions identical to the unadjusted median for all synonymous substitutions (−0.46). Right: mutational fitness adjusted by constants derived from the medians of mutational fitness for synonymous substitutions at basepaired, unpaired, and all potential C→U positions.
Additional files
Download links
A two-part list of links to download the article, or parts of the article, in various formats.
Downloads (link to download the article as PDF)
Open citations (links to open the citations from this article in various online reference manager services)
Cite this article (links to download the citations from this article in formats compatible with various reference manager tools)
Secondary structure of the SARS-CoV-2 genome is predictive of nucleotide substitution frequency
eLife 13:RP98102.
https://doi.org/10.7554/eLife.98102.3


