Intestinal microbiome dysbiosis increases Mycobacteria pulmonary colonization in mice by regulating the Nos2-associated pathways
- Department of Tuberculosis, The First Affiliated Hospital of Xinxiang Medical University, China
- Department of Pathogenic Biology, School of Basic Medical Science, Xinxiang Medical University, China
Figures
Figure 1 with 1 supplement
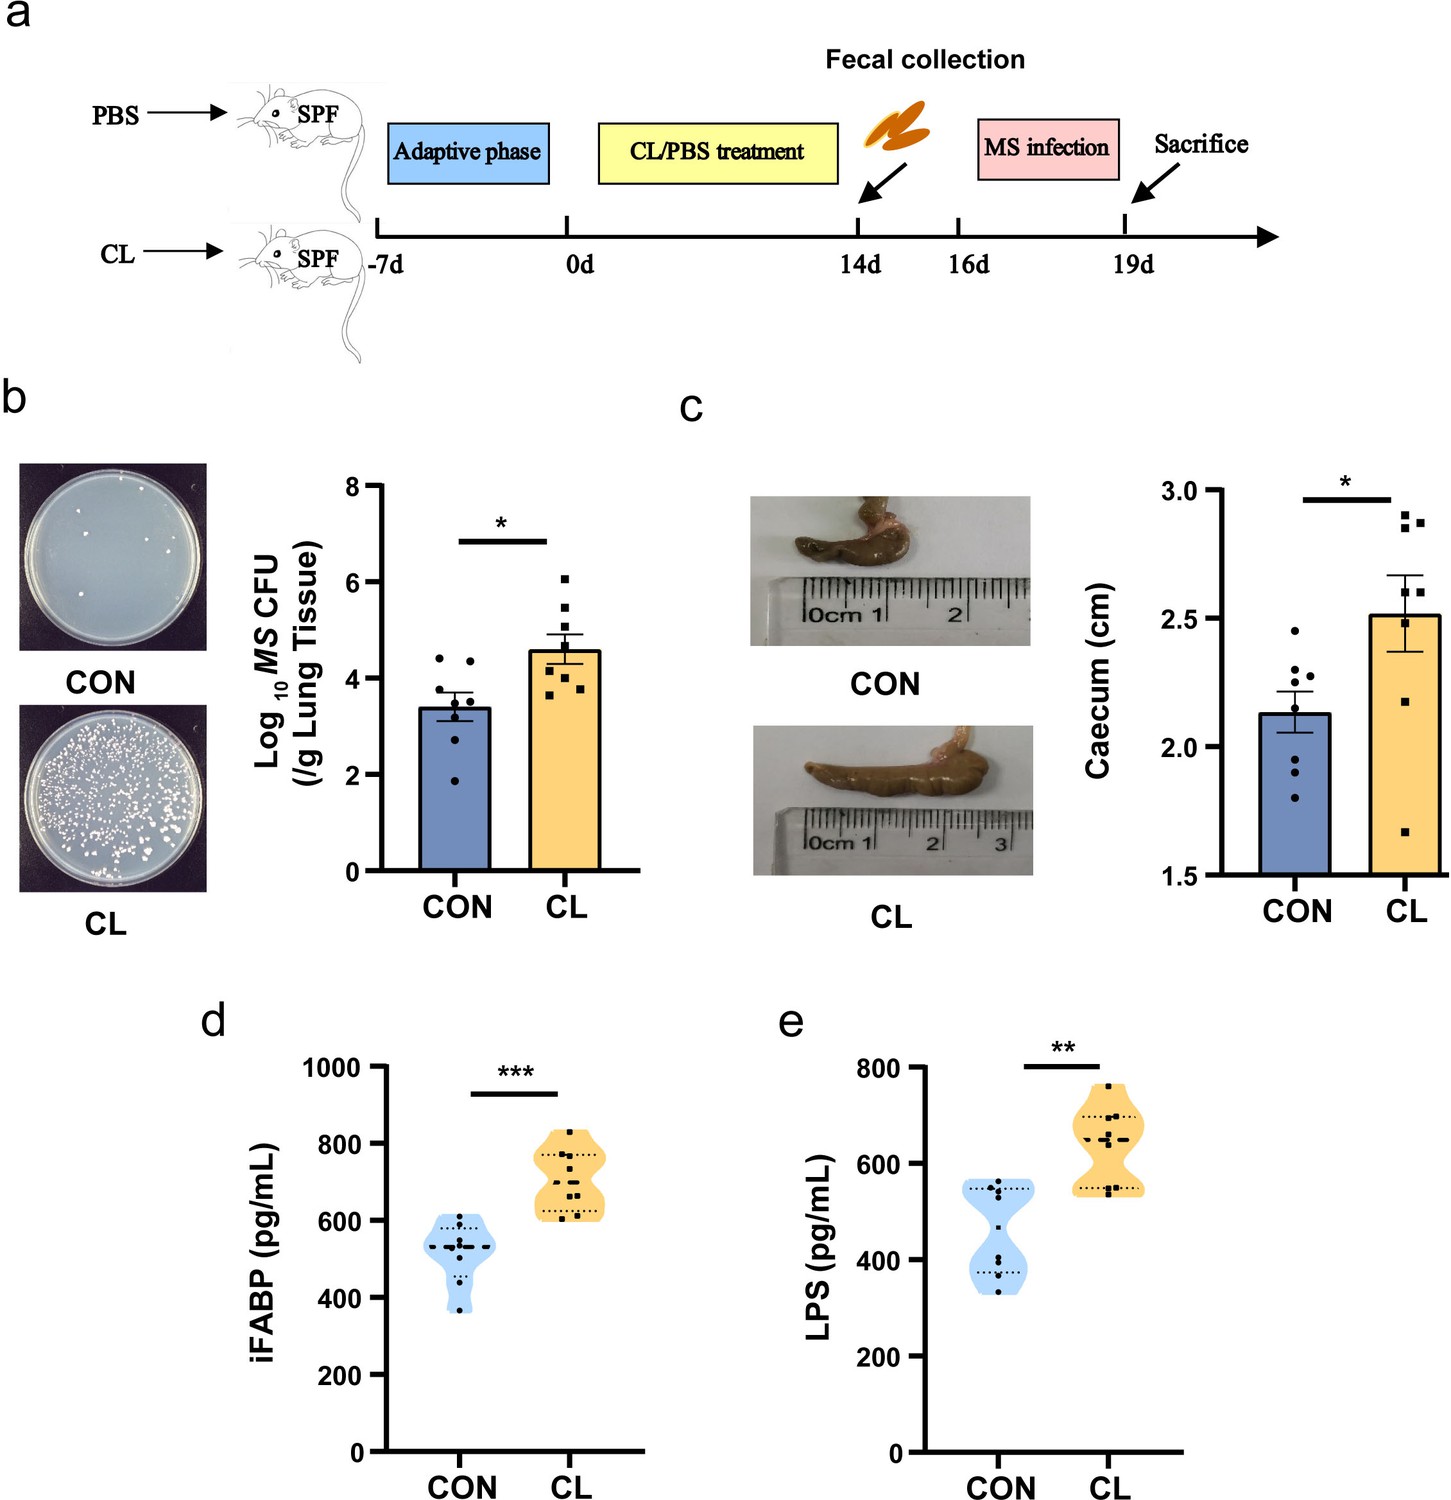
Clindamycin increases MS pulmonary colonization in mice.
(a) The experimental procedures of clindamycin-inducing gut microbiota dysbiosis model in mice. (b) The colonization of MS in the lungs of mice after infection at 72 hr. (c) The length of cecum after clindamycin treatment. (d) The level of iFABP in serum. (e) LPS concentration in serum. CL: clindamycin treatment group (n = 8), CON: control group (n = 8). MS: Mycobacterium smegmatis, iFABP: intestinal fatty acid binding protein, LPS: lipopolysaccharides. *p < 0.05, **p < 0.01, ***p < 0.001.
-
Figure 1—source data 1
Effect of clindamycin on MS pulmonary colonization and intestinal permeability of mice.
- https://cdn.elifesciences.org/articles/99282/elife-99282-fig1-data1-v1.xlsx
Figure 1—figure supplement 1

Pathological sections of intestinal and lung tissue of mice with CL treatment.
(A) Pathological sections of intestinal tissue showed the intestinal epithelial tissues of mice with no obvious alteration after CL treatment vs the CON group, ×20 magnification. (B) Representative histological images of murine intestine and lung infected with Mycobacterium smegmatis (MS) infection, show diffused inflammation and inflammatory cell infiltration. CL: clindamycin treatment, CON: control group, left figure: ×20 magnification; right figure: ×100 magnification. Magnification numerical scale bars are marked with red in the figures.
Figure 2 with 1 supplement
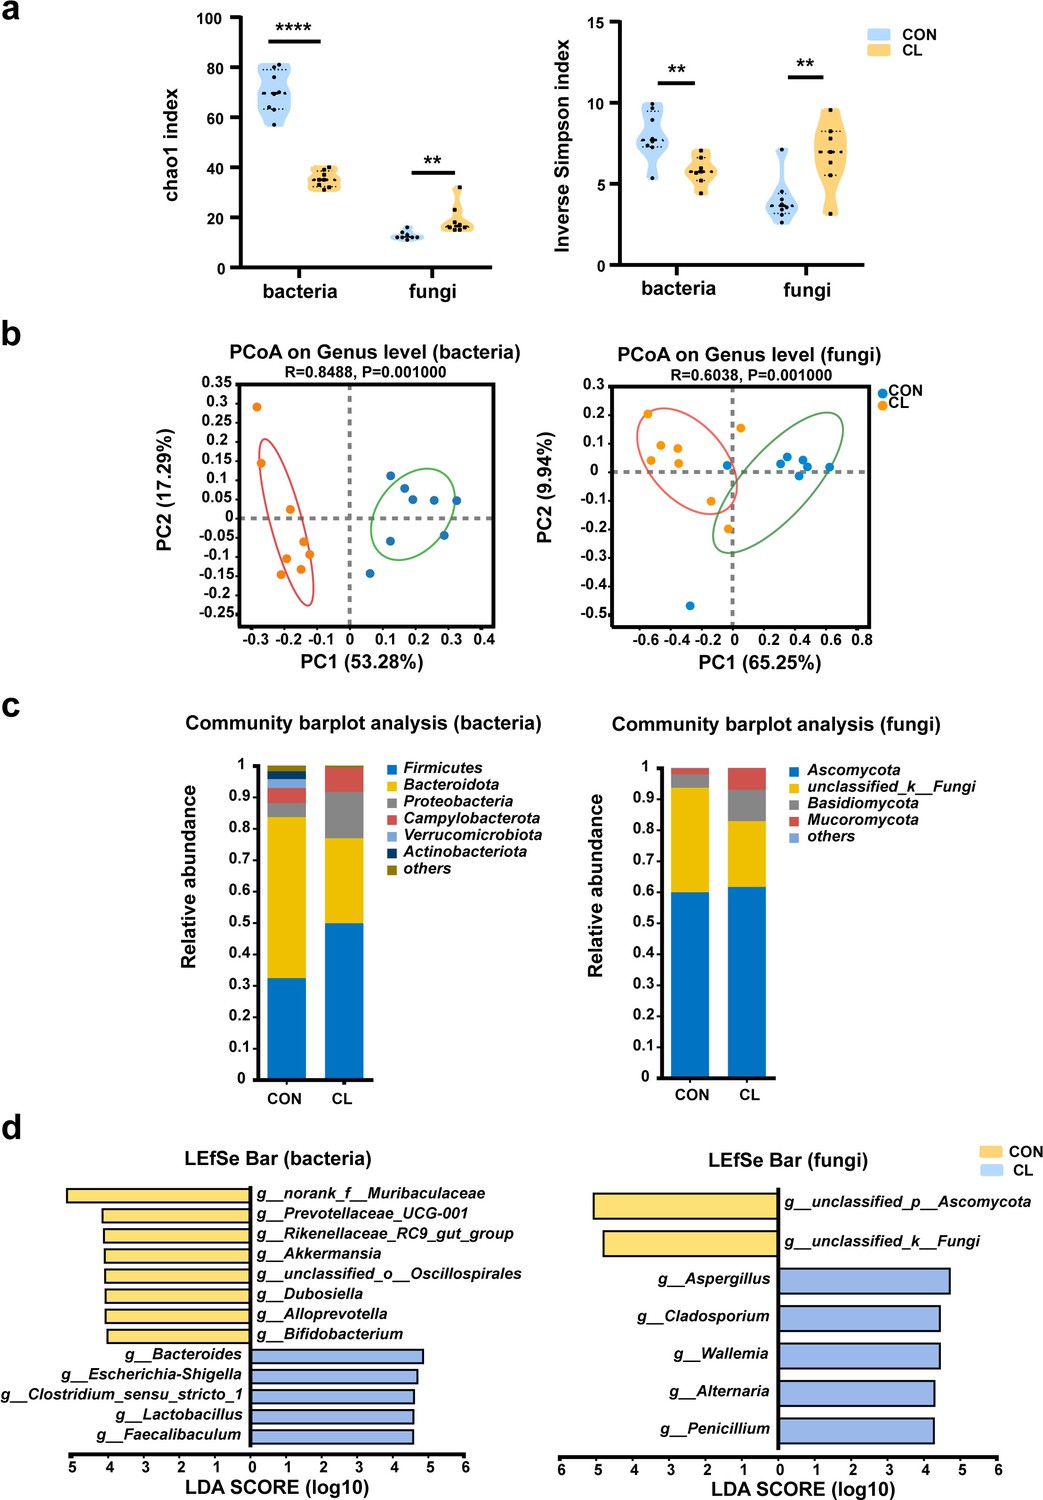
Clindamycin altered the diversity and composition of the gut microbiome in mice.
(a) Chao1 and inverse Simpson indices of gut microbiota. (b) Principal coordinate analysis (PCoA) of gut microbiota based on weighted Unifrac distance. (c) The composition distribution of gut microbiome (bacteria and fungi) at the phylum level. (d) The linear discriminant analysis effect size (LEfSe) analysis of the differentially abundant gut microbiota between the CL and CON groups at the genera level (linear discriminant analysis [LDA] > 4, p < 0.05). CL: clindamycin treatment group (n = 8), CON: control group (n = 8). **p < 0.01, ****p < 0.0001.
-
Figure 2—source data 1
Alpha diversity index of gut microbiome.
- https://cdn.elifesciences.org/articles/99282/elife-99282-fig2-data1-v1.xlsx
Figure 2—figure supplement 1
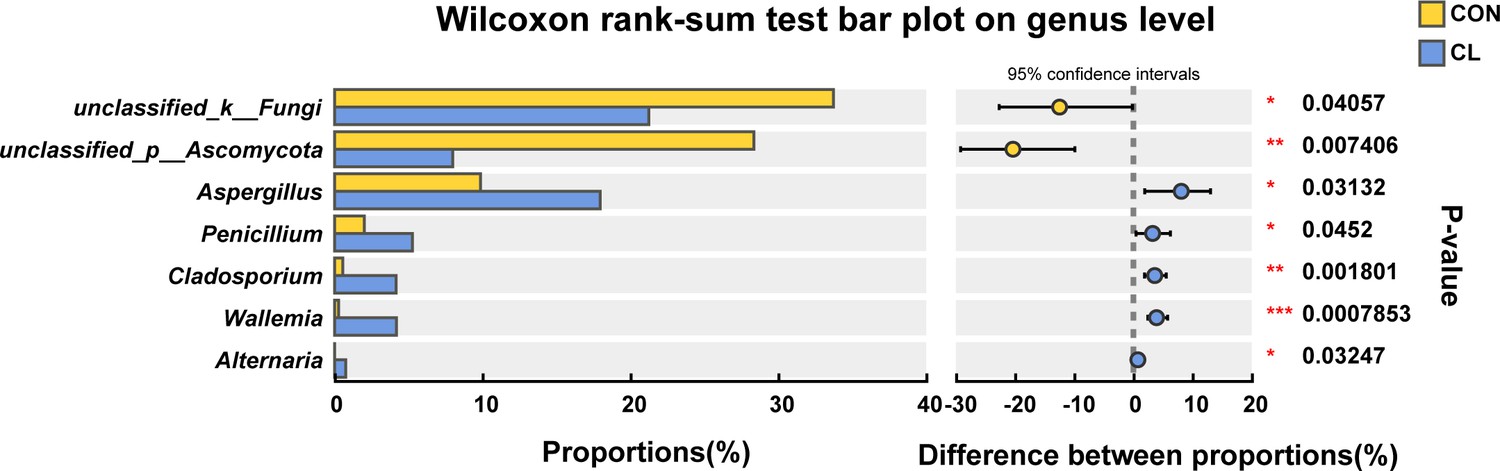
The Wilcoxon rank-sum test of gut fungal relative abundance difference between the CL and CON groups at the genera level.
CL: CL treatment group, CON: control group. *p < 0.05, **p < 0.01, ***p < 0.001.
Figure 3
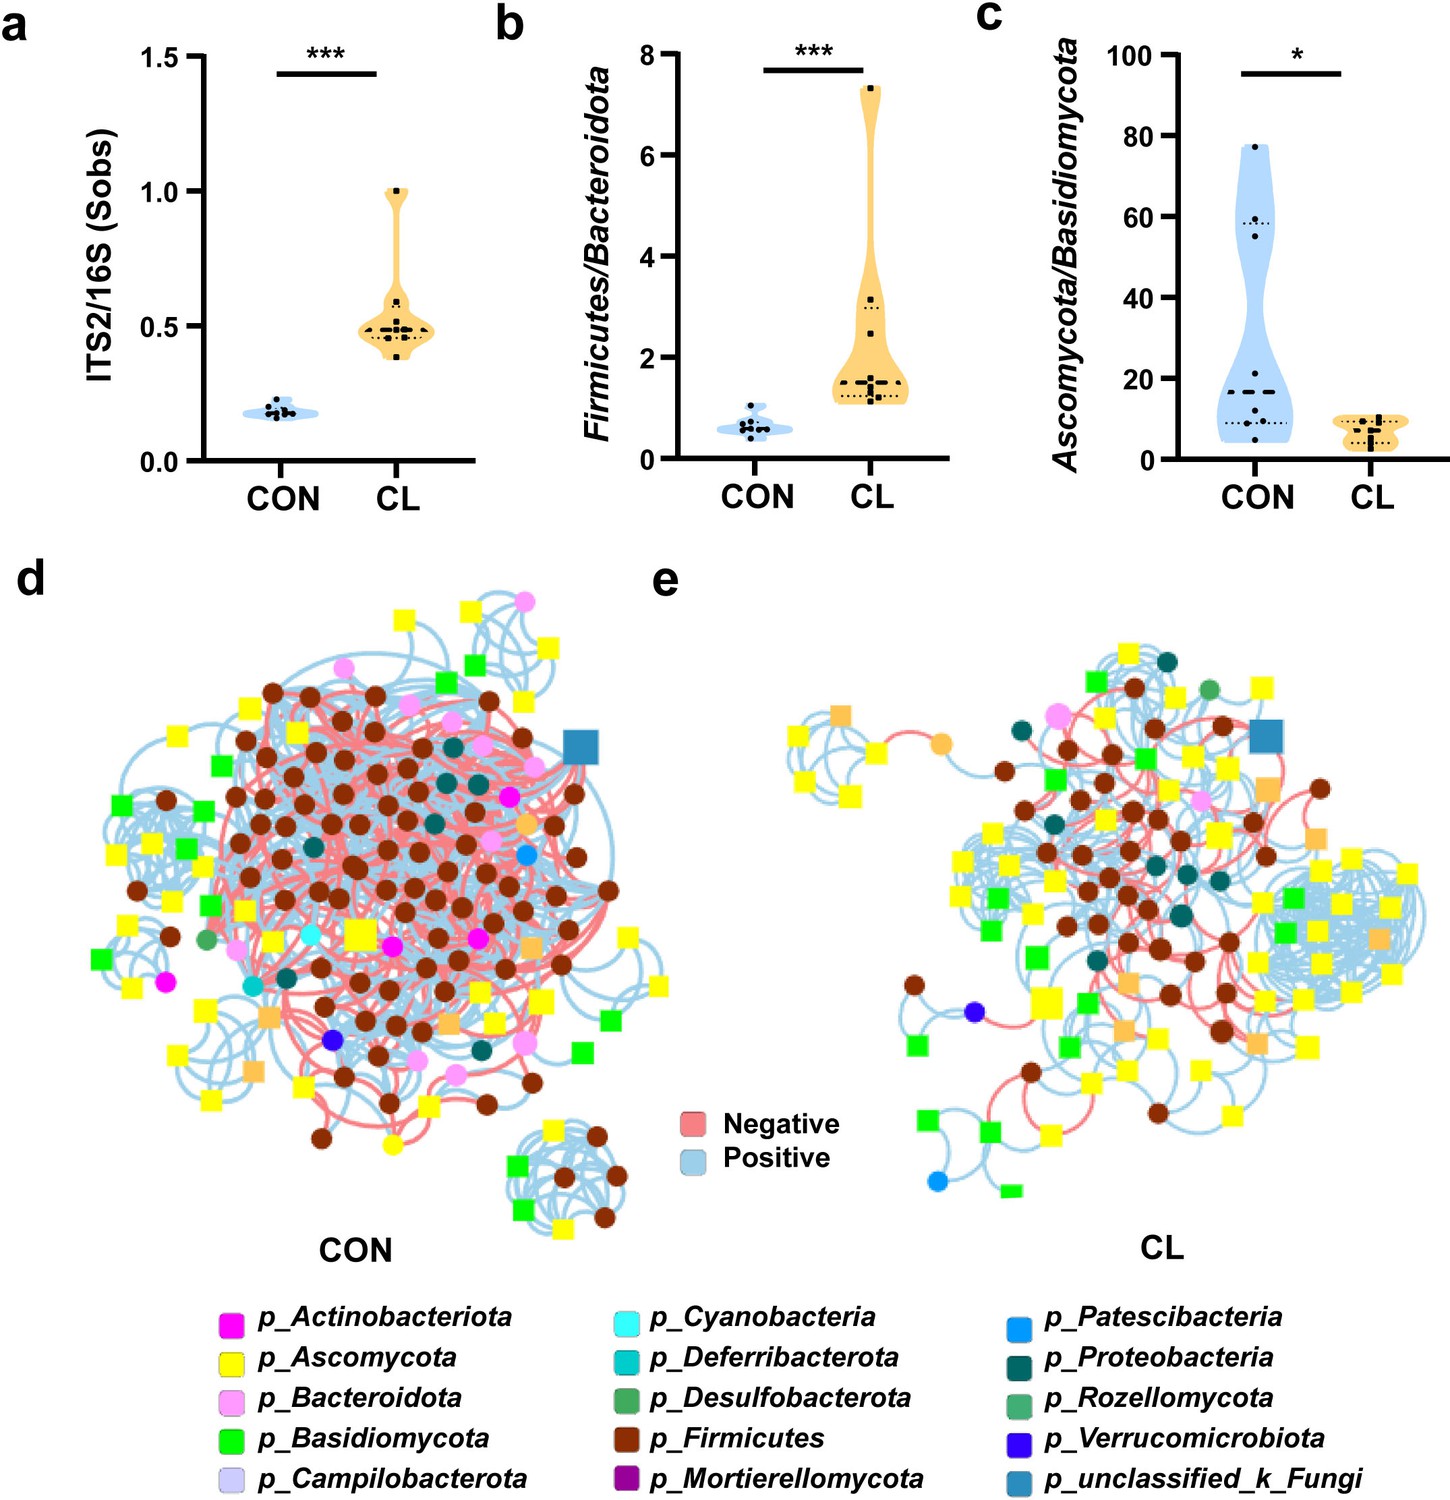
Clindamycin weakens the trans-kingdom network construction of gut bacteria and fungi.
(a) The ratio of ITS2/16S at the genus level. (b) The relative abundant ratio of Firmicutes/Bacteroidota. (c) The relative abundant ratio of Ascomycota/Basidiomycota. (d) The trans-kingdom correlation networks of the CON at the genus level. (e) The trans-kingdom correlation networks of the CL at the genus level. CL: clindamycin treatment group (n = 8), CON: control group (n = 8). *p < 0.05; ***p < 0.001.
-
Figure 3—source data 1
Effects of clindamycin on the gut bacteria and fungi microbiota in mice.
- https://cdn.elifesciences.org/articles/99282/elife-99282-fig3-data1-v1.xlsx
Figure 4 with 2 supplements
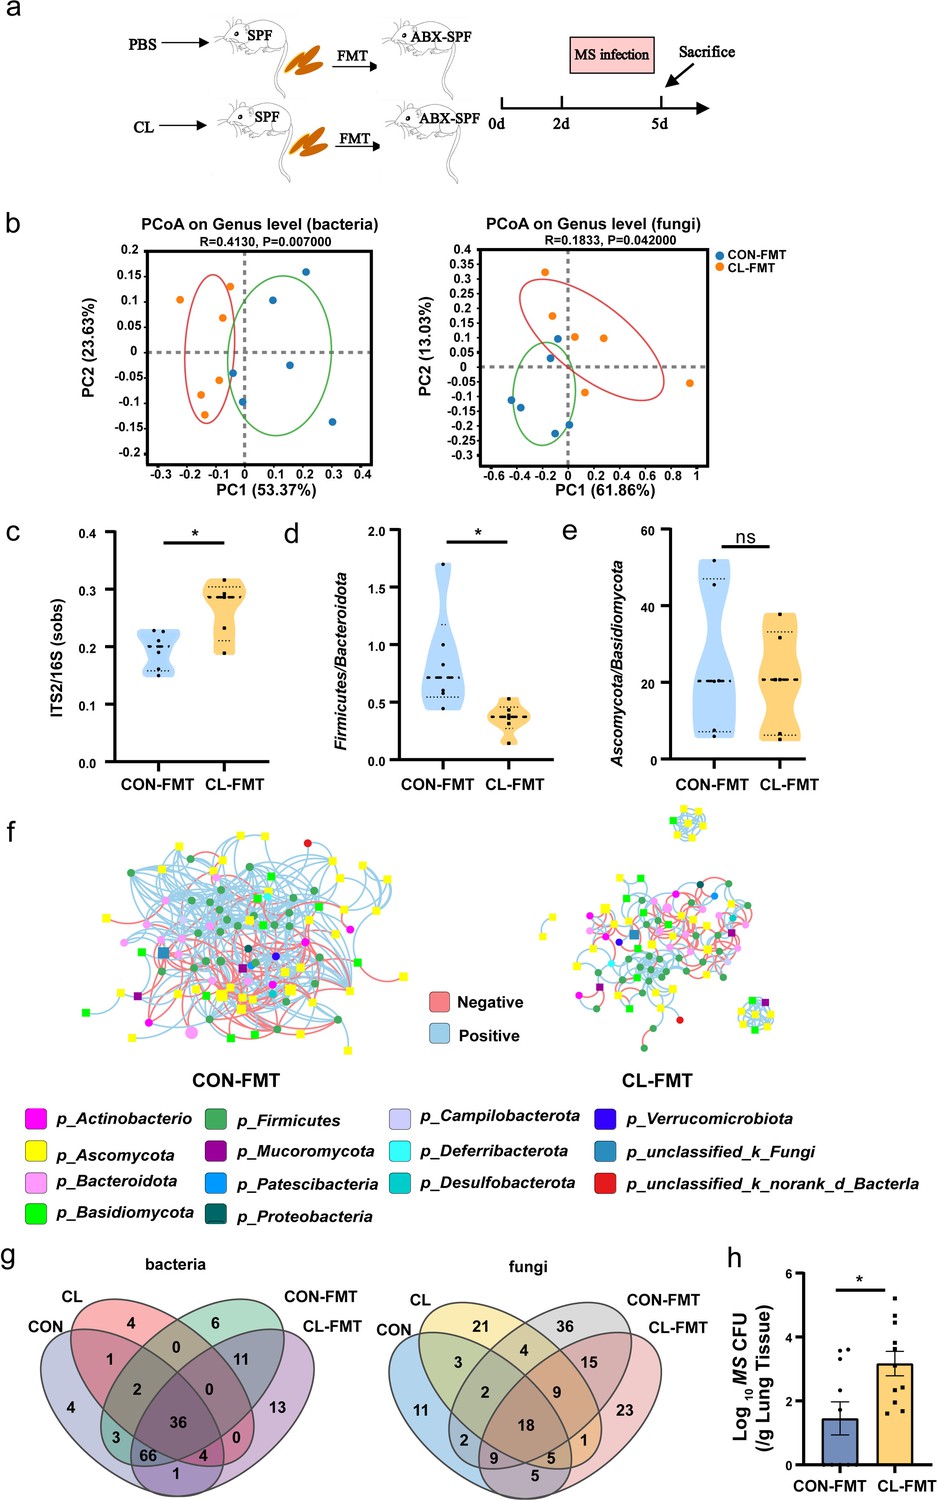
Gut microbiota dysbiosis enhances the susceptibility of MS pulmonary colonization in mice.
(a) The experimental procedures of the feces microbiota transplantation. (b) The principal coordinate analysis (PCoA) of gut microbiota based on weighted Unifrac distance. (c) The ITS2/16S diversity ratio at the genus level. (d) The relative abundant ratio of Firmicutes/Bacteroidota. (e) The relative abundant ratio of Ascomycota/Basidiomycota. (f) The trans-kingdom correlation networks of CON-FMT and CL-FMT groups at the genus level. (g) The Venn diagram of gut bacteria and gut fungi in different groups at the genus level. (h) The load of MS in the lungs of mice after infection at 72 hr. FMT: fecal microbiota transplantation, CON-FMT: the fecal microbiota of the control group was transplanted (n = 6), CL-FMT: the fecal microbiota of the clindamycin treatment group was transplanted (n = 6). MS, Mycobacterium smegmatis. *p < 0.05.
-
Figure 4—source data 1
Effects of FMT on the gut bacteria and fungi microbiota in mice.
- https://cdn.elifesciences.org/articles/99282/elife-99282-fig4-data1-v1.xlsx
Figure 4—figure supplement 1
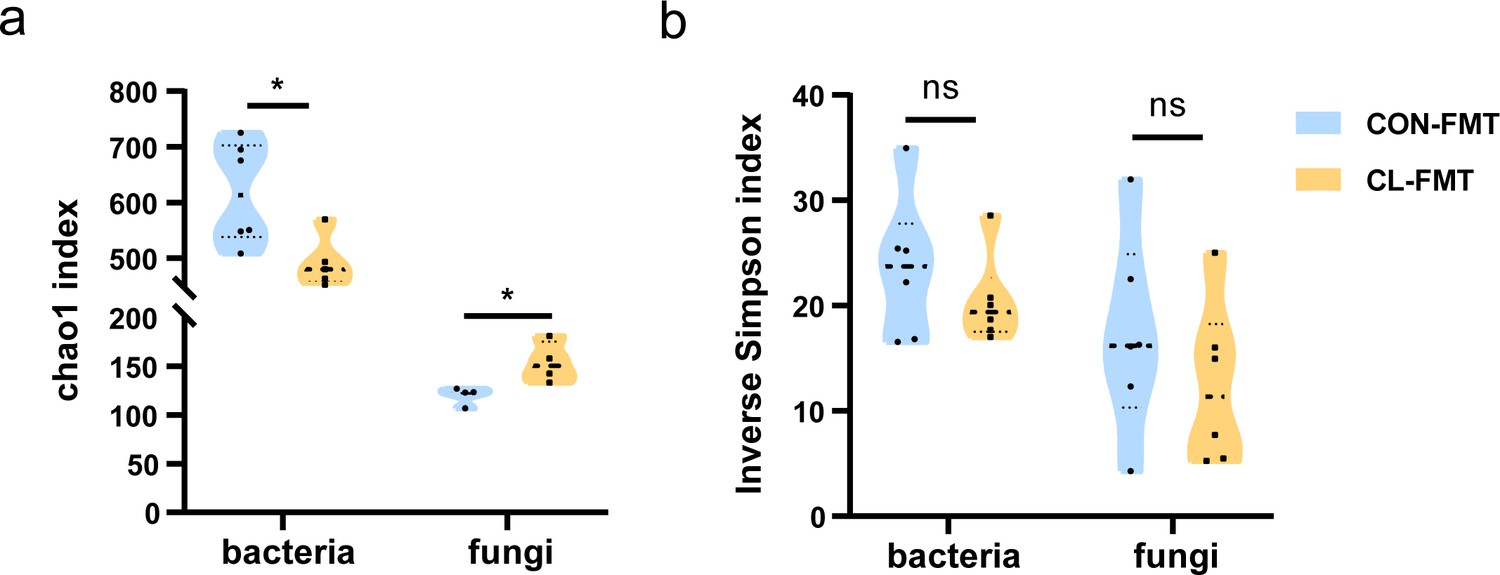
The α-diversity analysis of gut microbiome after fecal microbiota transplantation (FMT).
Compared Chao1 index (a) and inverse Simpson index (b) between the CL-FMT and CON-FMT groups (unpaired Student’s t-tests). CL-FMT: the fecal microbiota of the CL group was transplanted, CON-FMT: the fecal microbiota of the CON group was transplanted. *p < 0.05.
-
Figure 4—figure supplement 1—source data 1
Effects of FMT on the alpha diversity of gut microbiota and intestinal permeability in mice.
- https://cdn.elifesciences.org/articles/99282/elife-99282-fig4-figsupp1-data1-v1.xlsx
Figure 4—figure supplement 2
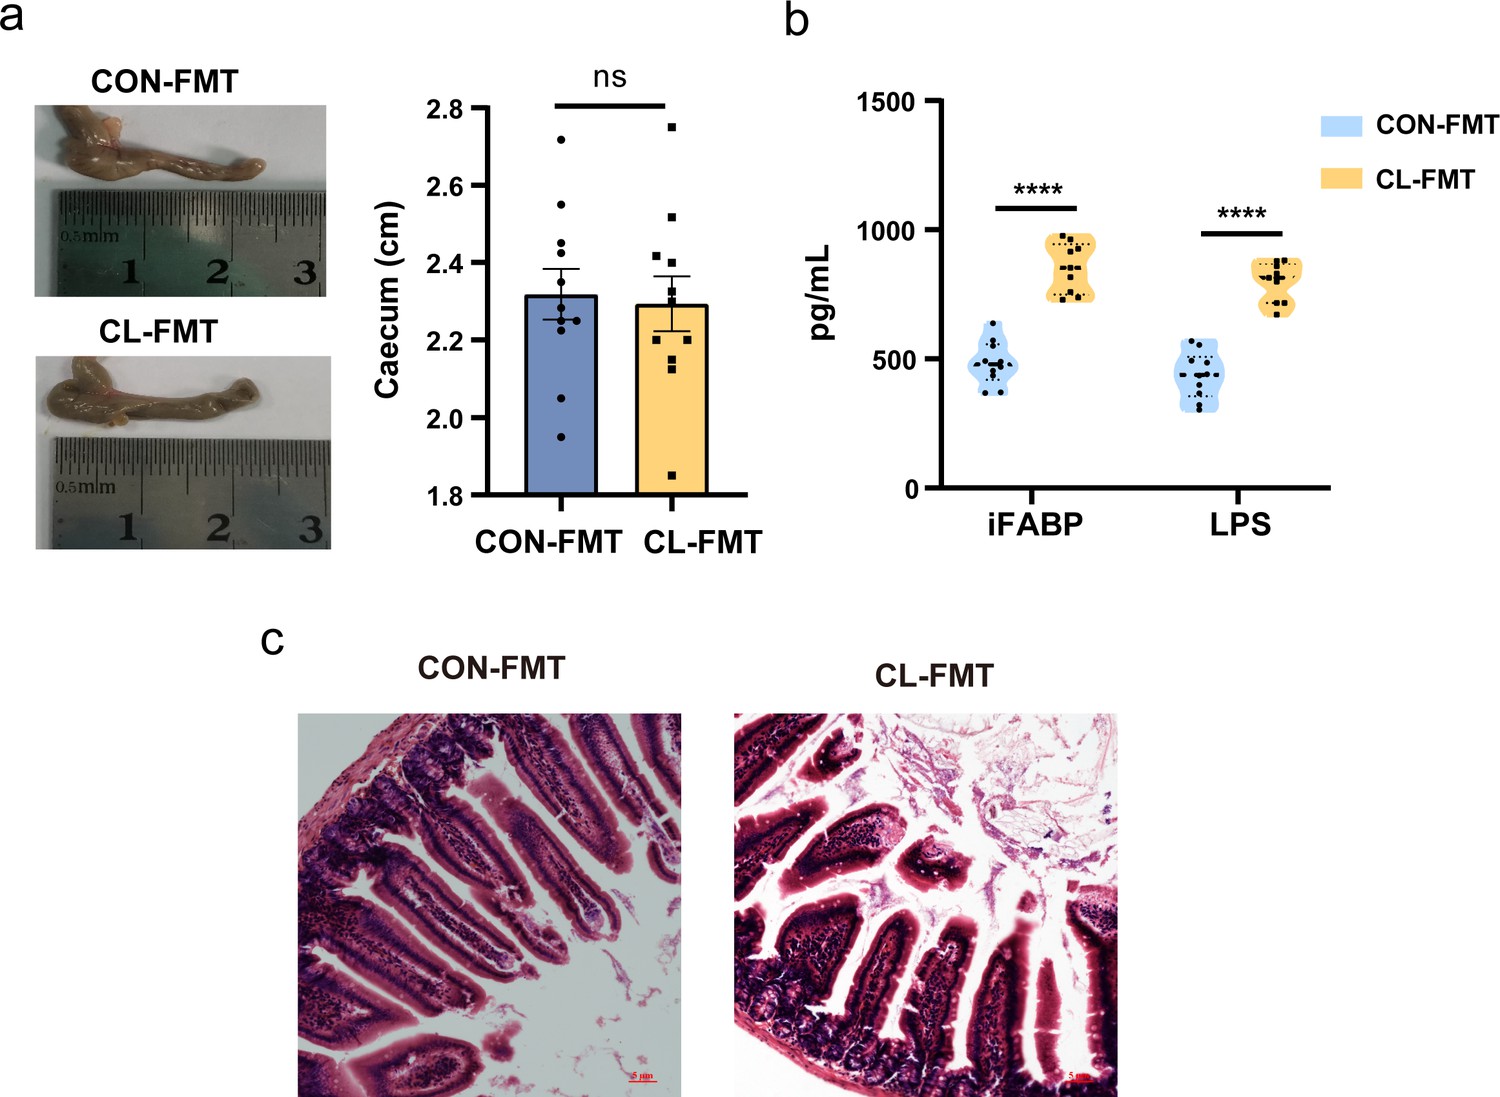
The effect on gut mucosal damage and permeability after fecal microbiota transplantation (FMT).
(a) Compared length of cecum after clindamycin treatment between two groups (unpaired Student’s t-tests). (b) Compared levels of intestinal fatty acid binding protein (iFABP) and lipopolysaccharides (LPS) in serum between two groups (unpaired Student’s t-tests). (c) Compared pathological change between the two groups. Magnification numerical scale bars are marked with red in the figures, ×100 magnification. CL-FMT: the fecal microbiota of the CL group was transplanted, CON-FMT: the fecal microbiota of the CON group was transplanted. ****p < 0.0001.
Figure 5 with 2 supplements
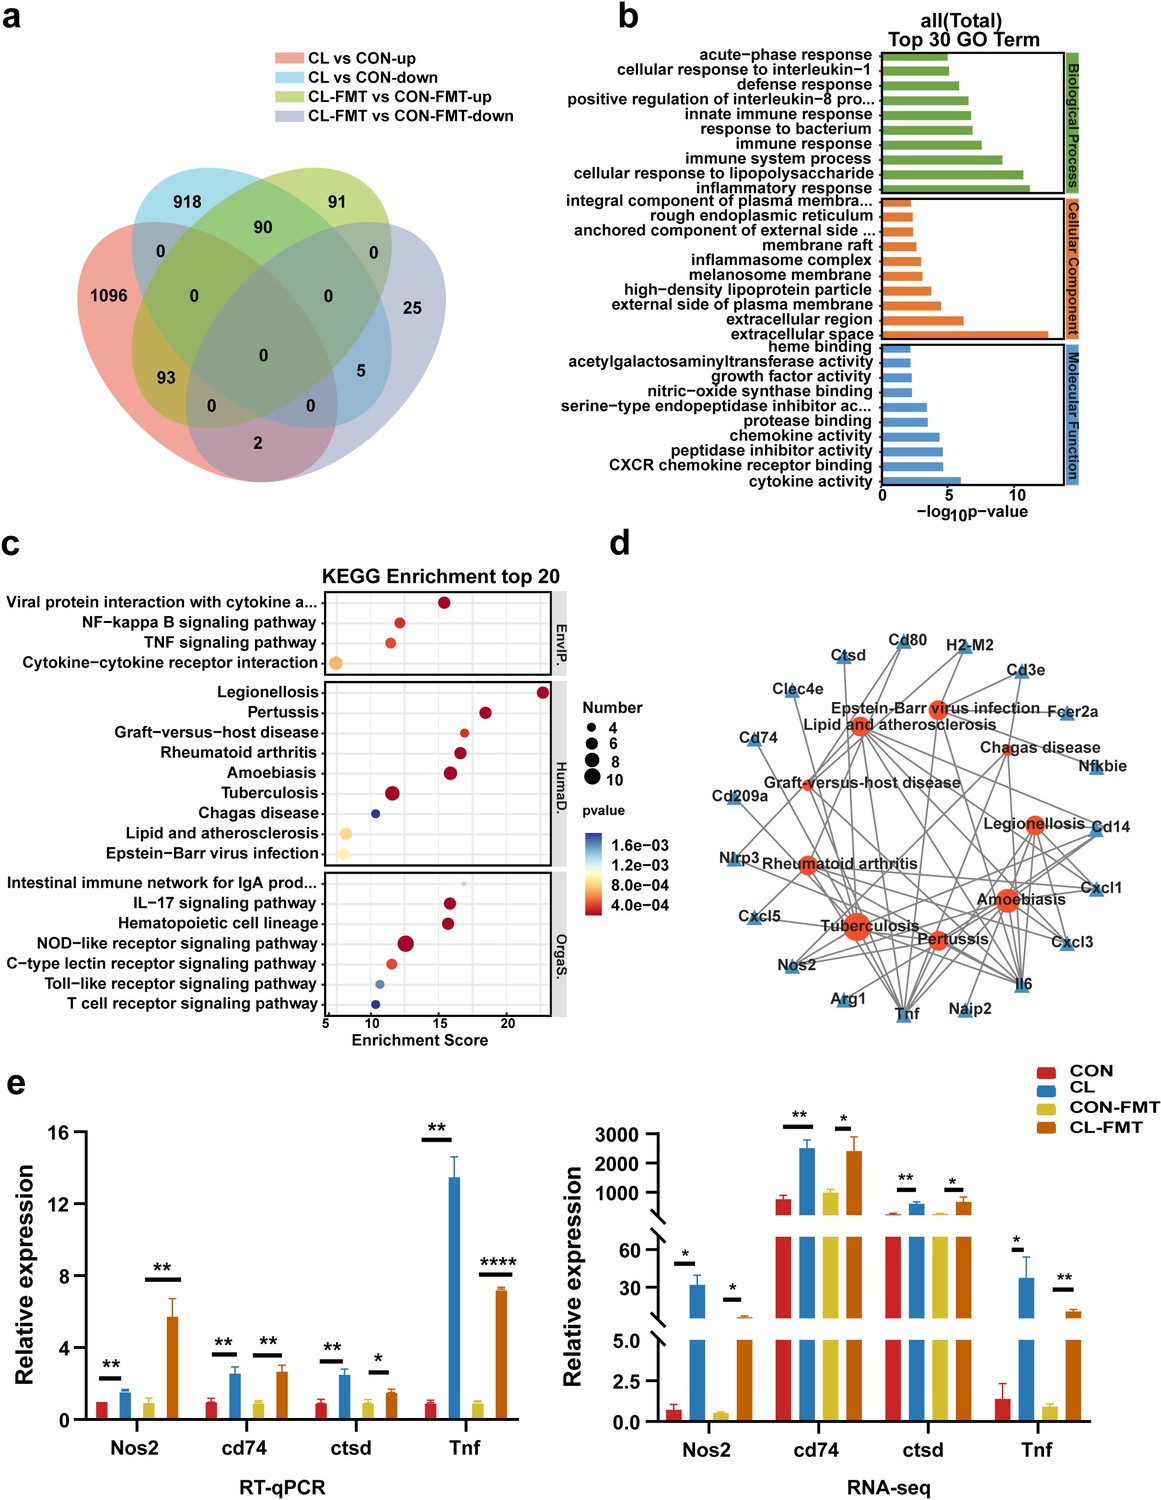
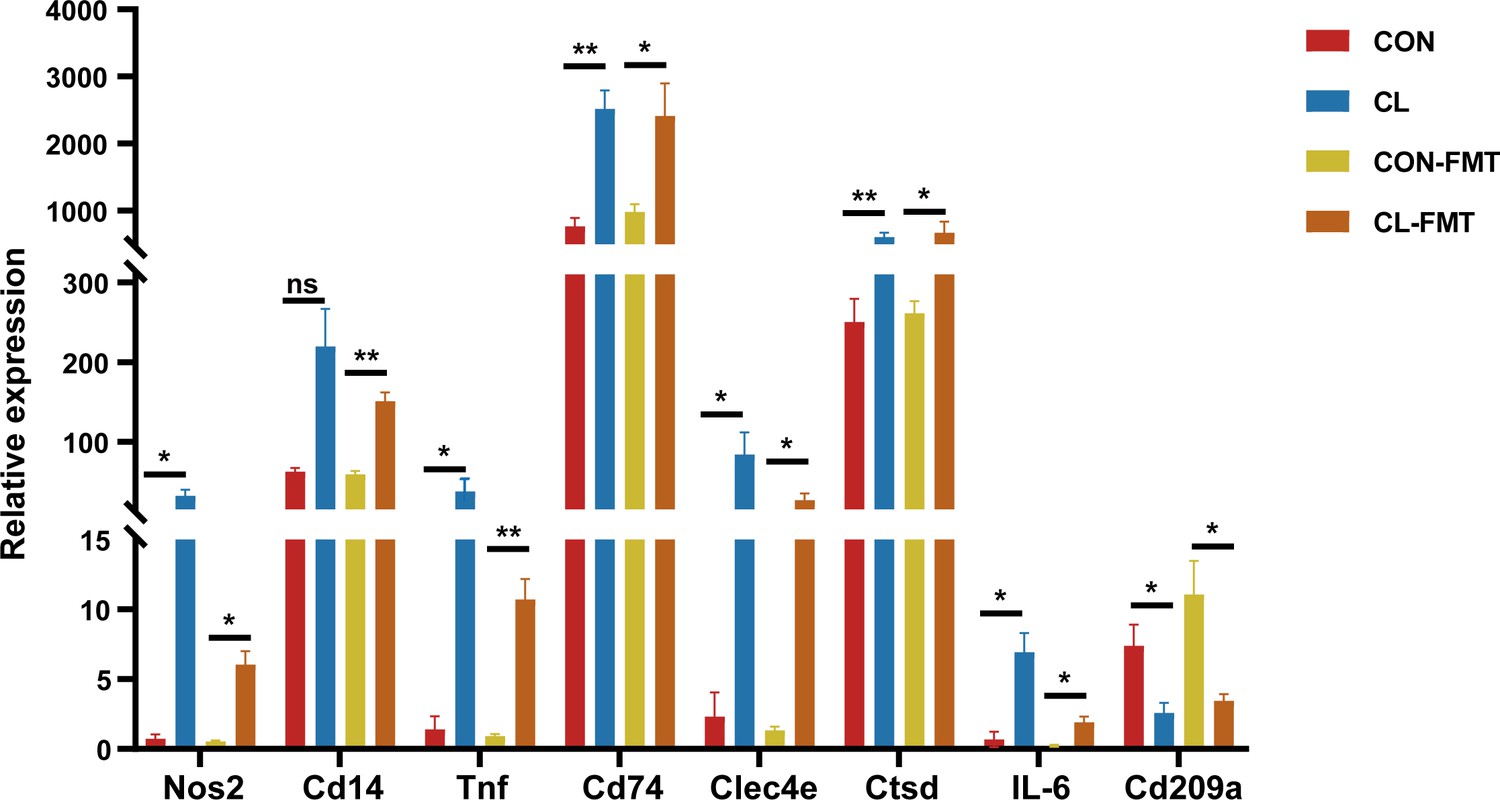
Gut microbiota dysbiosis altered the lung transcriptome of mice.
(a) The Venn diagram of DEGs in the different groups. (b) The top 30 Gene Ontology (GO) enrichment analyses of DEGs. (c) The top 20 Kyoto Encyclopedia of Genes and Genomes (KEGG) enrichment analyses of DEGs. (d) Interaction network analysis of selected DEGs and significant KEGG pathways related to human diseases. (e) The expression levels of Nos2, Ctsd, Cd74, and Tnf with RT-qPCR and RNA-seq. DEGs: differentially expressed genes, CL: clindamycin treatment group, CON: control group; CON-FMT: the fecal microbiota of the control group was transplanted, CL-FMT: the fecal microbiota of the clindamycin treatment group was transplanted. *p < 0.05, **p < 0.01, **** p<0.0001.
-
Figure 5—source data 1
The results of RT-qPCR and RNA-seq of Nos2, Ctsd, Cd74, and Tnf.
- https://cdn.elifesciences.org/articles/99282/elife-99282-fig5-data1-v1.xlsx
Figure 5—figure supplement 1
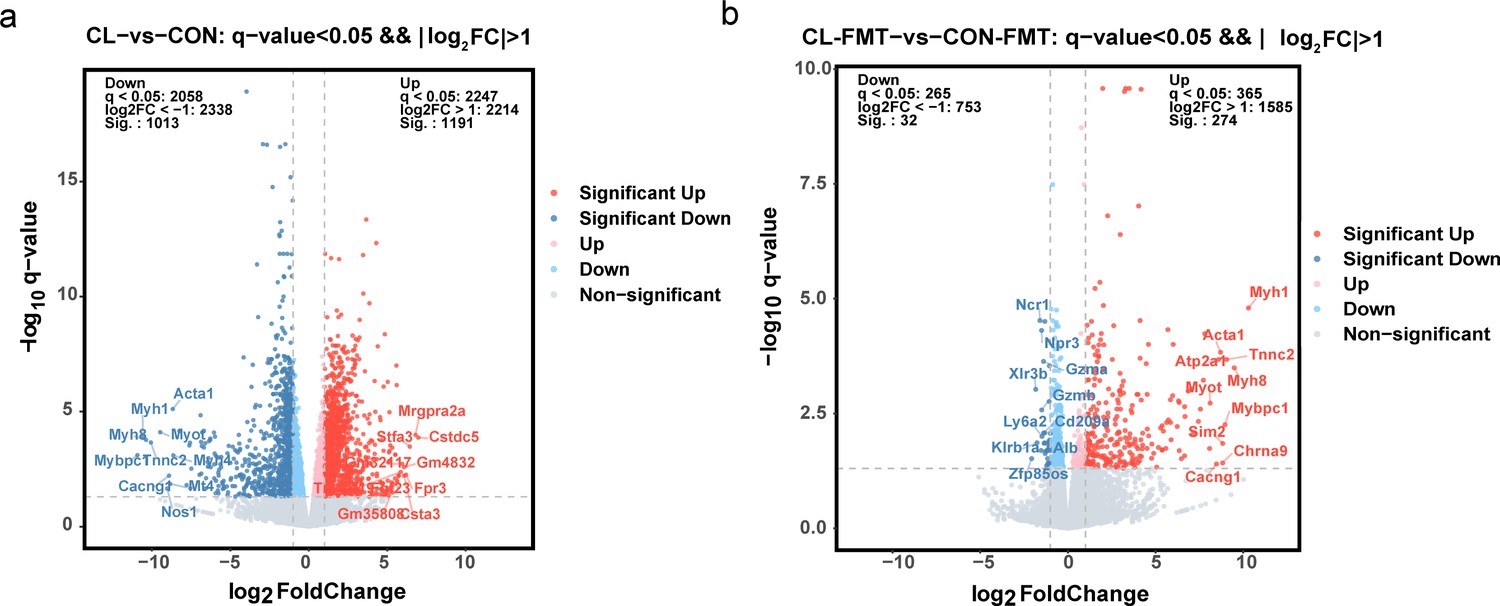
The volcano plot of changes of differentially expressed genes.
(a) Compared differentially expressed genes between CL and CON groups. (b) Compared differentially expressed genes between CL-FMT and CON-FMT groups. CL: CL treatment group, CON: control group, CL-FMT: the fecal microbiota of the CL group was transplanted, CON-FMT: the fecal microbiota of the CON group was transplanted.
-
Figure 5—figure supplement 1—source data 1
RT-qPCR results of DEGs in the different groups.
- https://cdn.elifesciences.org/articles/99282/elife-99282-fig5-figsupp1-data1-v1.xlsx
Figure 5—figure supplement 2
The expression levels of differentially expressed genes (DEGs).
RNA-seq detected the expression levels of the DEGs. CL: CL treatment group, CON: control group, CL-FMT: the fecal microbiota of the CL group was transplanted, CON-FMT: the fecal microbiota of the CON group was transplanted. *p < 0.05; **p < 0.01.
Figure 6
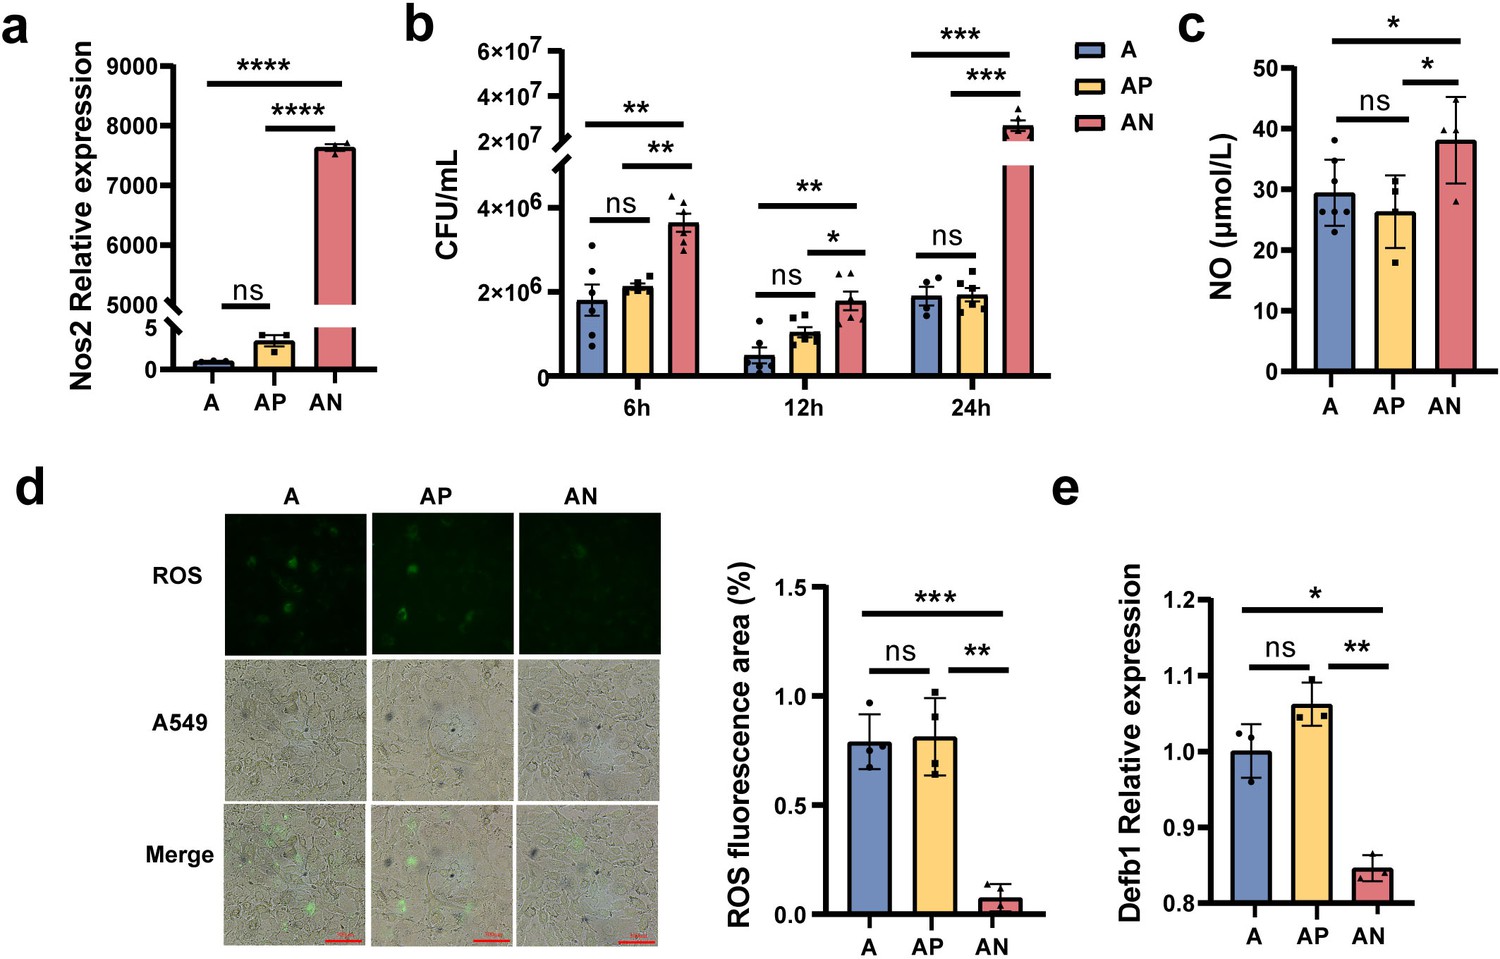
Nos2 regulates the expression of nitric oxide (NO), reactive oxygen species (ROS), and Defb1.
(a) The expression levels of the Nos2 in the A549 cells. (b) The load of Mycobacterium smegmatis (MS) in the A549 cells at different times. (c) The NO concentration in the A549 cells. (d) The concentration of ROS in the A549 cells. (e) The expression levels of Defb1 in A549. A: A549 cells control, AP: transfected A549 cells with blank pcDNA3.1plasmid, AN: transfected A549 cells with Nos2-pcDNA3.1 plasmid. *p < 0.05, **p < 0.01, ***p < 0.001, "****" p<0.0001.
-
Figure 6—source data 1
Effect of Nos2 on the expression of nitric oxide (NO), reactive oxygen species (ROS), Defb1 and the colonization of MS in cells.
- https://cdn.elifesciences.org/articles/99282/elife-99282-fig6-data1-v1.xlsx
Figure 7

Mechanisms of the intestinal microbiome dysbiosis effect on the colonization of MS in the mouse lungs.
Gut microbiome dysbiosis and gut permeability-increasing disrupt the lung transcriptome, and increase Nos2 expression through the ‘gut–lung axis’. Nos2 high expression weakens the intracellular antimicrobial and anti-inflammatory environment by increasing the concentration of NO, decreasing the levels of ROS and Defb1 in the cells, and promoting MS colonization in the lungs of mice. MS: Mycobacterium smegmatis.
Tables
Table 1
Parameters of the trans-kingdom abundance correlation networks.
| CON group | CL group | |
|---|---|---|
| Nodes (n) (fungi/bacteria) | 154 (45/109) | 110 (62/48) |
| Edges (n) | 810 | 357 |
| Relative connectedness* | 5.26 | 3.25 |
| Bacteria–bacteria (%) | 78.77 | 22.69 |
| Bacteria–fungi (%) | 13.70 | 25.21 |
| Fungi–fungi (%) | 7.53 | 52.10 |
-
*
The relative connectedness of the network was calculated as the ratio of edges (the number of significant interactions) and nodes (the number of genera).
Key resources table
| Reagent type (species) or resource | Designation | Source or reference | Identifiers | Additional information |
|---|---|---|---|---|
| Strain, strain background (Mycobacterium smegmatis) | Mycobacterium smegmatis; MS | ATCC | ATCC 19420 Cat#700084 | |
| Cell line (Homo sapiens) | Human alveolar basal epithelial cell (A549) | Servieebio Biochemical Technology Co., Ltd | RRID:CVCL_0023 | |
| Transfected construct (mouse) | pcDNA3.1-Nos2 | Youbio Biochemical Technology Co., Ltd | NCBI GenBank accession No: NM_010927 | |
| Commercial assay or kit | All-in-One Script RT premix | Kryptoner Mei Biotechnology Co., Ltd | #MR0502-2 | |
| Commercial assay or kit | TB Green Premix Ex Taq II | TaKaRa Biotechnology Co., Ltd | #RR820A | |
| Commercial assay or kit | Nitric Oxide (NO) assay kit | Nanjing Jiancheng Biotechnology Research Institute Co., Ltd | #A012-1 | |
| Commercial assay or kit | Reactive oxygen species (ROS) detection kit | Beyotime Biotechnology Co., Ltd | #S0033S | |
| Commercial assay or kit | The commercial ELISA kits of iFABP | Shanghai Enzyme-linked Biotechnology Co., Ltd | #TW9968 | |
| Commercial assay or kit | The commercial ELISA kits of LPS | Shanghai Enzyme-linked Biotechnology Co., Ltd | #TW12543 | |
| Chemical compound, drug | Clindamycin | Dalian Meilun Biotechnology Co., Ltd | CAS: 18323-44-9 | 1 mg/ml |
| Chemical compound, drug | Ampicillin | Shanghai Maclin Biochemical Technology Co., Ltd | CAS: 69-52-3 | 1 mg/ml |
| Chemical compound, drug | Metronidazole | Shanghai Maclin Biochemical Technology Co., Ltd | CAS: 443-48-1 | 1 mg/ml |
| Chemical compound, drug | Neomycin | Shanghai Maclin Biochemical Technology Co., Ltd | CAS: 1405-10-3 | 1 mg/ml |
| Chemical compound, drug | Vancomycin | Shanghai Maclin Biochemical Technology Co., Ltd | CAS: 1404-90-6 | 0.05 mg/ml |
| Other | Middlebrook 7H9/7H10 | Qingdao Haibo Biotechnology Co., Ltd | #HB6270/HB9128 | Mycobacterium culture media |
Additional files
-
Supplementary file 1
The relative abundance of gut bacteria and fungi at the phylum and genera levels.
(a) The relative abundance of bacteria in CL and CON groups at phylum levels. (b) The relative abundance of bacteria in CL and CON groups at general level. (c) The relative abundance of fungi in CL and CON groups at the phylum level. (d) The relative abundance of fungi in CL and CON groups at the genera level. The Wilcoxon rank-sum test was performed between the two groups. CL: CL treatment group, CON: control group.
- https://cdn.elifesciences.org/articles/99282/elife-99282-supp1-v1.docx
-
Supplementary file 2
The Kyoto Encyclopedia of Genes and Genomes (KEGG) enrichment pathways analysis of the lung transcriptome data and the primers of RT-qPCR.
(a) The primary enrichment pathways of differentially expressed genes (DEGs) in KEGG analysis at classification level 1. (b) The primary enrichment pathways of DEGs in KEGG analysis at classification level 2. (c) The primers of RT-qPCR.
- https://cdn.elifesciences.org/articles/99282/elife-99282-supp2-v1.docx
-
MDAR checklist
- https://cdn.elifesciences.org/articles/99282/elife-99282-mdarchecklist1-v1.docx
Download links
A two-part list of links to download the article, or parts of the article, in various formats.
Downloads (link to download the article as PDF)
Open citations (links to open the citations from this article in various online reference manager services)
Cite this article (links to download the citations from this article in formats compatible with various reference manager tools)
Intestinal microbiome dysbiosis increases Mycobacteria pulmonary colonization in mice by regulating the Nos2-associated pathways
eLife 13:RP99282.
https://doi.org/10.7554/eLife.99282.3


