Neural dynamics of visual working memory representation during sensory distraction
- Bernstein Center for Computational Neuroscience Berlin and Berlin Center for Advanced Neuroimaging, Charité Universitätsmedizin Berlin, Corporate member of the Freie Universität Berlin, Humboldt-Universität zu Berlin, and Berlin Institute of Health, Germany
- Max Planck School of Cognition, Germany
- Department of Psychology, Humboldt-Universität zu Berlin, Germany
- Research Training Group 'Extrospection' and Berlin School of Mind and Brain, Humboldt-Universität zu Berlin, Germany
- Institute of Psychology, Otto von Guericke University, Germany
- Max Planck Institute for Human Cognitive and Brain Sciences, Germany
- German Center for Neurodegenerative Diseases, Germany
- Collaborative Research Center 'Volition and Cognitive Control', Technische Universität Dresden, Germany
- Research Cluster of Excellence 'Science of Intelligence', Technische Universität Berlin, Germany
Figures
Figure 1 with 3 supplements
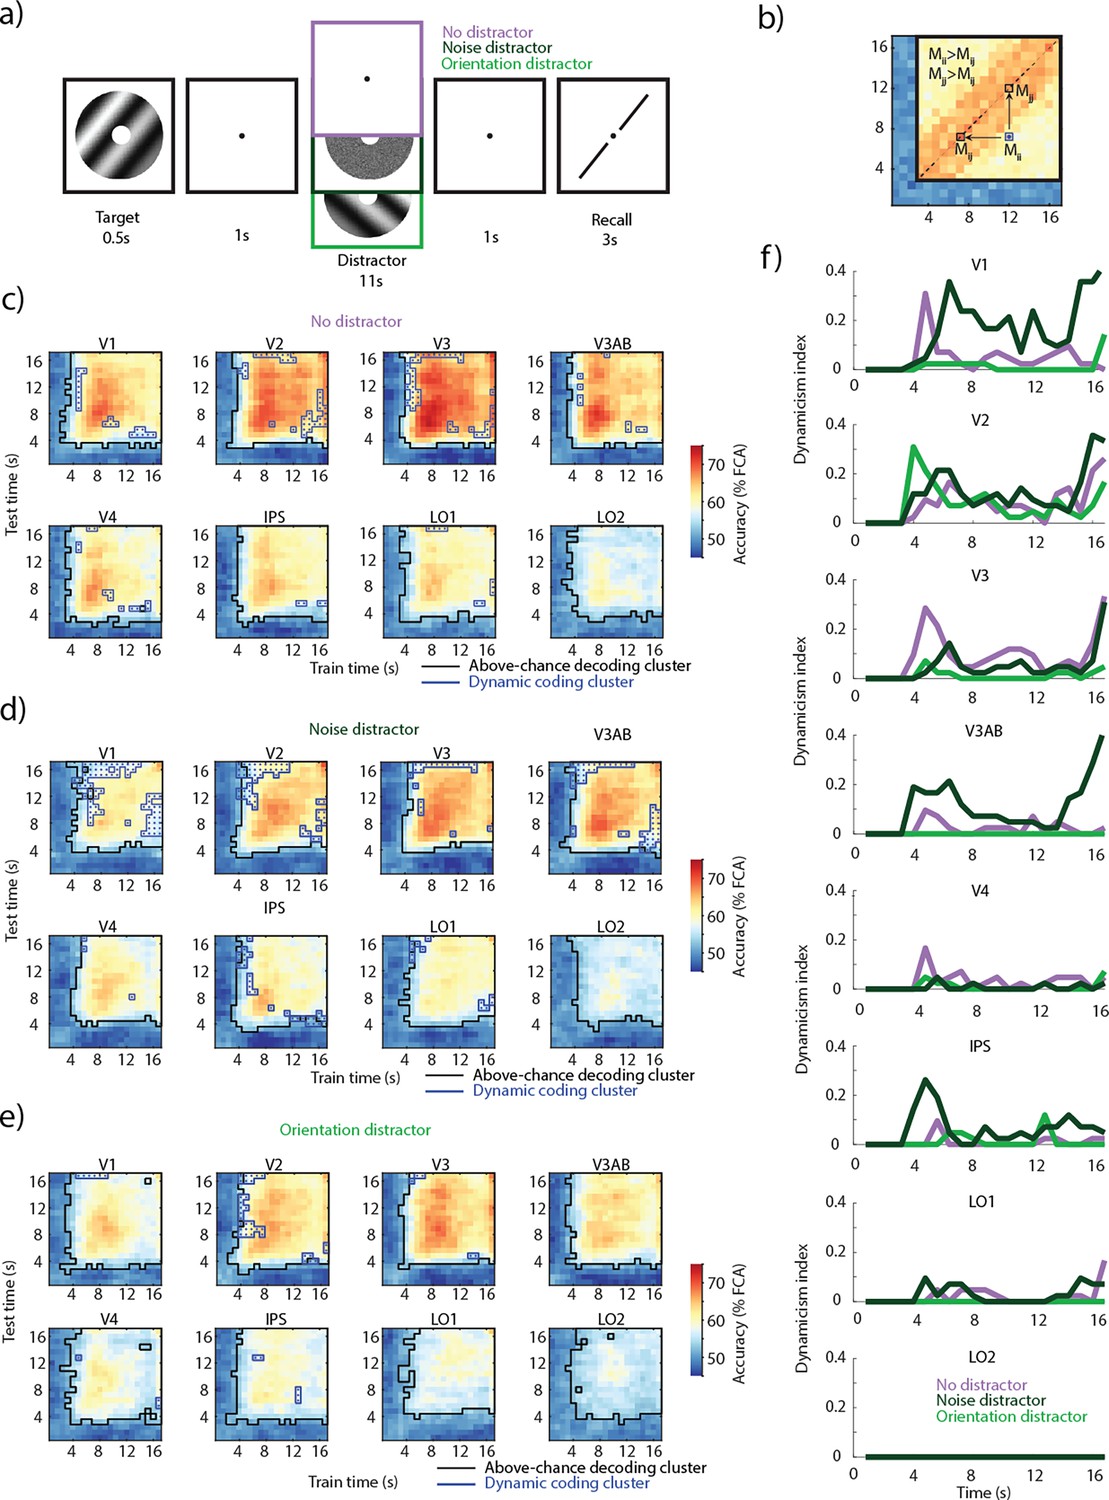
Task and temporal cross-decoding.
(a) On each trial, an oriented grating was presented for 0.5 s followed by a delay period of 13 s (Rademaker et al., 2019). In a third of the trials, a noise distractor was presented for 11 s during the middle of the delay; in another third, another orientation grating was presented; one-third of trials had no-distractor during the delay. (b) Illustration of dynamic coding elements. An off-diagonal element had to have a lower decoding accuracy compared to both corresponding diagonal elements (see Methods for details). (c) Temporal generalization of the multivariate code encoding VWM representations in three conditions across occipital and parietal regions. Across-participant mean temporal cross-decoding of no-distractor trials. Black outlines: matrix elements showing above-chance decoding (cluster-based permutation test; p<0.05). Blue outlines with dots: dynamic coding elements; parts of the cross-decoding matrix where the multivariate code fails to generalize (off-diagonal elements having lower decoding accuracy than their corresponding two diagonal elements; conjunction between two cluster-based permutation tests; p<0.05). (d) Same as c, but noise distractor trials. (e) Same as c, but orientation distractor trials. (f) Dynamicism index; the proportion of dynamic coding elements across time. High values indicate a dynamic non-generalizing code, while low values indicate a generalizing code. Time indicates the time elapsed since the onset of the delay period.
Figure 1—figure supplement 1

Task and temporal cross-decoding of Experiment 2.
(a) On each trial, an oriented grating was presented for 0.5 s followed by a delay period of 13 s. In a third of the trials, a naturalistic distractor was presented for 11 s during the middle of the delay; in another third, a flickering orientation grating was presented; one-third of trials had no-distractor during the delay. (b) Temporal generalization of the multivariate code encoding visual working memory (VWM) representations in three conditions across occipital and parietal regions. Across-participant mean temporal cross-decoding of no-distractor trials. Black outlines: matrix elements showing above-chance decoding (cluster-based permutation test; p<0.05). Blue outlines with dots: dynamic coding elements; parts of the cross-decoding matrix where the multivariate code fails to generalize (off-diagonal elements having lower decoding accuracy than their corresponding two diagonal elements; conjunction between two cluster-based permutation tests; p<0.05). (c) Same as b, but noise distractor trials. Dynamic coding elements depicted in red. (d) Same as c, but orientation distractor trials. (e) Decoding accuracy (feature continuous accuracy [FCA]) across time for train and test on no-distractor trials (purple), train and test on naturalistic distractor trials (dark green), and train and test on flickering orientation distractor trials (light green). Horizontal lines indicate clusters where there is a difference between two time courses (all clusters p<0.05; nonparametric cluster permutation test, see color code on the right).
Figure 1—figure supplement 2

Simulations.
(a) Signal-to-noise ratio (SNR)-dependent decoding accuracy, obtained from simulated voxel responses. SNR decreases from left to right (training axis) and bottom to top (testing axis). (b) SNR-dependent decoding accuracy, obtained from no-distractor data from Experiment 1. SNR first decreases and then increases in both training and test axes. (c) SNR-dependent decoding accuracy, obtained from noise distractor data from Experiment 1. SNR first decreases and then increases in both training and test axes.
Figure 1—figure supplement 3

Selected voxels.
Top: Experiment 1. Number of voxels (left) and proportion of voxels selected in a region of interest (ROI) (right). Error bars indicate SEM across participants. Bottom: same as top, but for Experiment 2.
Figure 2 with 1 supplement
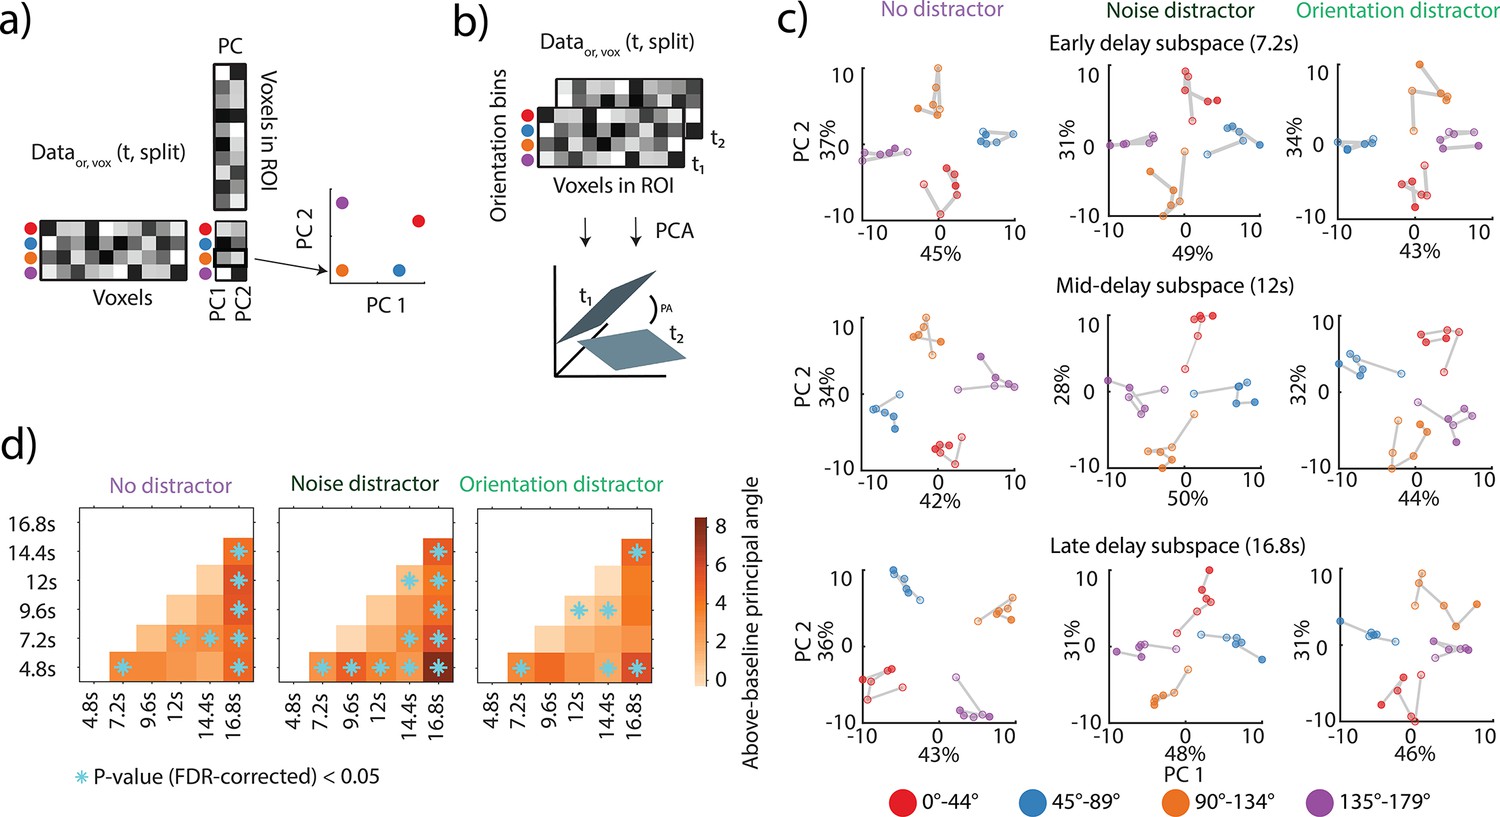
Assessing the dynamics of neural subspaces in V1-V3AB.
(a) Schematic illustration of the neural subspace analysis. A given data matrix (voxels × orientation bins) was subjected to a principal components analysis (PCA), and the first two dimensions were used to define a neural subspace onto which a left-out test data matrix was projected. This resulted in a matrix of two coordinates for each orientation bin and was visualized (see right). The x and y axes indicate the first two principal components. Each color depicts an angular bin. (b) Schematic illustration of the calculation of an above-baseline principal angle (aPA). A principal angle (PA) is the angle between the 2D PCA-based neural subspaces (as in a) for two different time points t1, t2. A small angle would indicate alignment of coding spaces; an angle of above-baseline would indicate a shift in the coding space. The aPA is the angle for a comparison between two time points (t1, t2) minus the angle between cross-validated pairs of the same time points. (c) Each row shows a projection that was estimated for one of two time ranges (middle and late delay) and then applied to all time points (using independent, split-half cross-validated data). Opacity increases from early to late time points. For visualization purposes, the subspaces were estimated on a participant-aggregated region of interest (ROI) (Li and Curtis, 2023). The axes represent the first two principal components, with labels indicating the percent of total explained variance. Figure 2—figure supplement 1 depicts the same projections as neural trajectories. (d) aPA between all pairwise time point comparisons (nonparametric permutation test against null; FDR-corrected p<0.05) averaged across 1000 split-half iterations. Corresponding p-values can be found in Supplementary file 1, table S1.
Figure 2—figure supplement 1

Neural trajectories across time.
Same as Figure 2c, but the time dimension is on the z axis.
Figure 3 with 3 supplements
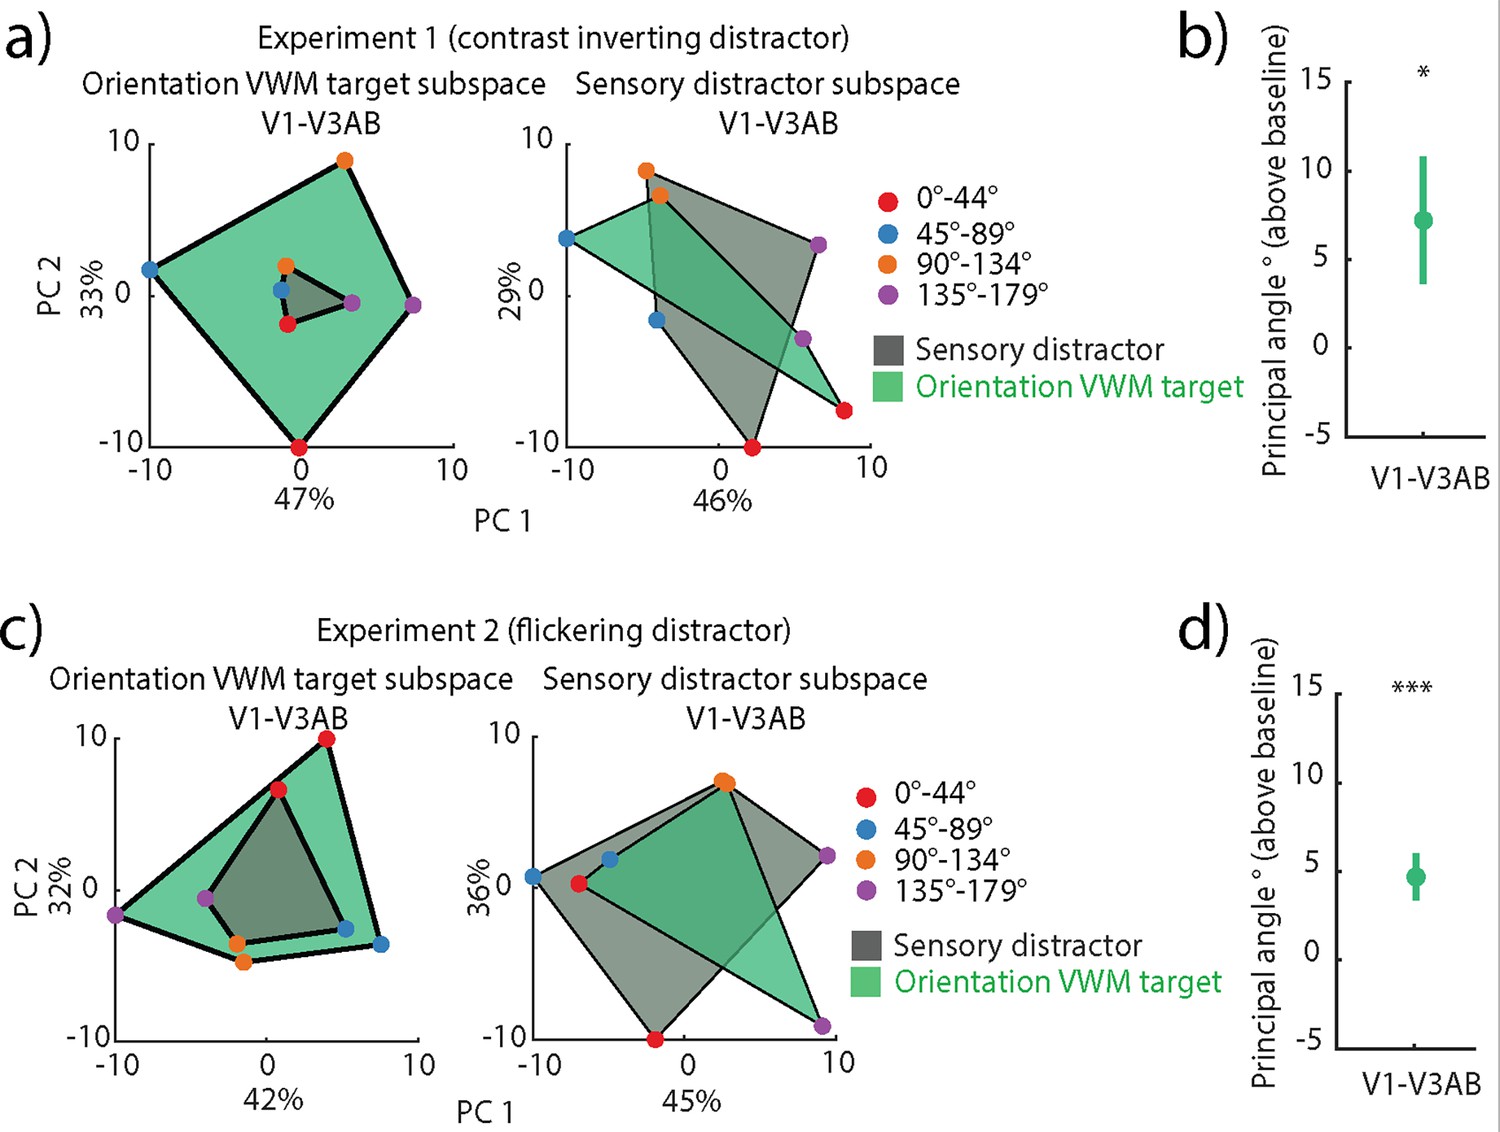
Generalization between target and distractor codes in orientation distractor visual working memory (VWM) trials in V1-V3AB.
(a) Left: projection of left-out target (green) and sensory distractor (gray) onto an orientation VWM target neural subspace. Right: same as left, but the projections are onto the sensory distractor subspace. The axes represent the first two principal components, with labels indicating the percent of total explained variance. (b) Principal angle between the sensory distractor and orientation VWM target subspaces (p=0.0297, one-tailed permutation test of sample mean), averaged across 1000 split-half iterations. Error bars indicate SEM across participants. (c) Same as a, but for flickering orientation distractor trials in the second experiment. (d) Same as b, but for flickering orientation distractor trials in the second experiment (p<0.001, one-tailed permutation test of sample mean). The same figure for individual regions of interest (ROIs) can be seen in Figure 3—figure supplement 3.
Figure 3—figure supplement 1

Temporal cross-decoding of distractor and memory target in orientation distractor trials in Experiment 1.
(a) Across-participant mean temporal cross-decoding of the sensory distractor. Black outlines: matrix elements showing above-chance decoding (cluster-based permutation test; p<0.05). Blue outlines with dots: dynamic coding element (conjunction between two cluster-based permutation tests; p<0.05). (b) Same as a, but the decoder was trained on the target and tested on the sensory distractor in orientation visual working memory (VWM) trials. (c) Same as a, but trained on the sensory distractor and tested on the target.
Figure 3—figure supplement 2

Temporal cross-decoding of distractor and memory target in flickering orientation distractor trials in Experiment 2.
(a) Across-participant mean temporal cross-decoding of the sensory distractor. Black outlines: matrix elements showing above-chance decoding (cluster-based permutation test; p<0.05). Red outlines with dots: dynamic coding element (conjunction between two cluster-based permutation tests; p<0.05). (b) Same as a, but the decoder was trained on the target and tested on the sensory distractor in orientation visual working memory (VWM) trials. (c) Same as a, but trained on the sensory distractor and tested on the target.
Figure 3—figure supplement 3

Stable coding spaces of memory target and distractor in each region of interest (ROI).
(a) Experiment 1. Left: projection of left-out target (green) and sensory distractor (gray) onto an orientation visual working memory (VWM) target neural subspace. Right: same as left, but the projections are onto the sensory distractor subspace. (b) Experiment 2. Same as a, but for flickering orientation distractor trials. (c) Experiment 1. Principal angle between the sensory distractor and orientation VWM target subspaces in each ROI (from V1 to LO2: p=0.019, 0.045, 0.034, 0.034, 0.109, 0.045, 0, 0.034; one-tailed permutation test of sample mean, FDR-corrected), averaged across 1000 split-half iterations. Error bars indicate SEM across participants. (d) Experiment 2. Same as c but for flickering orientation distractor trial (from V1 to LO2: p=0.078, 0, 0, 0.078, 0.263, 0.214, 0.177, 0.263; one-tailed permutation test of sample mean, FDR-corrected).
Figure 4 with 2 supplements
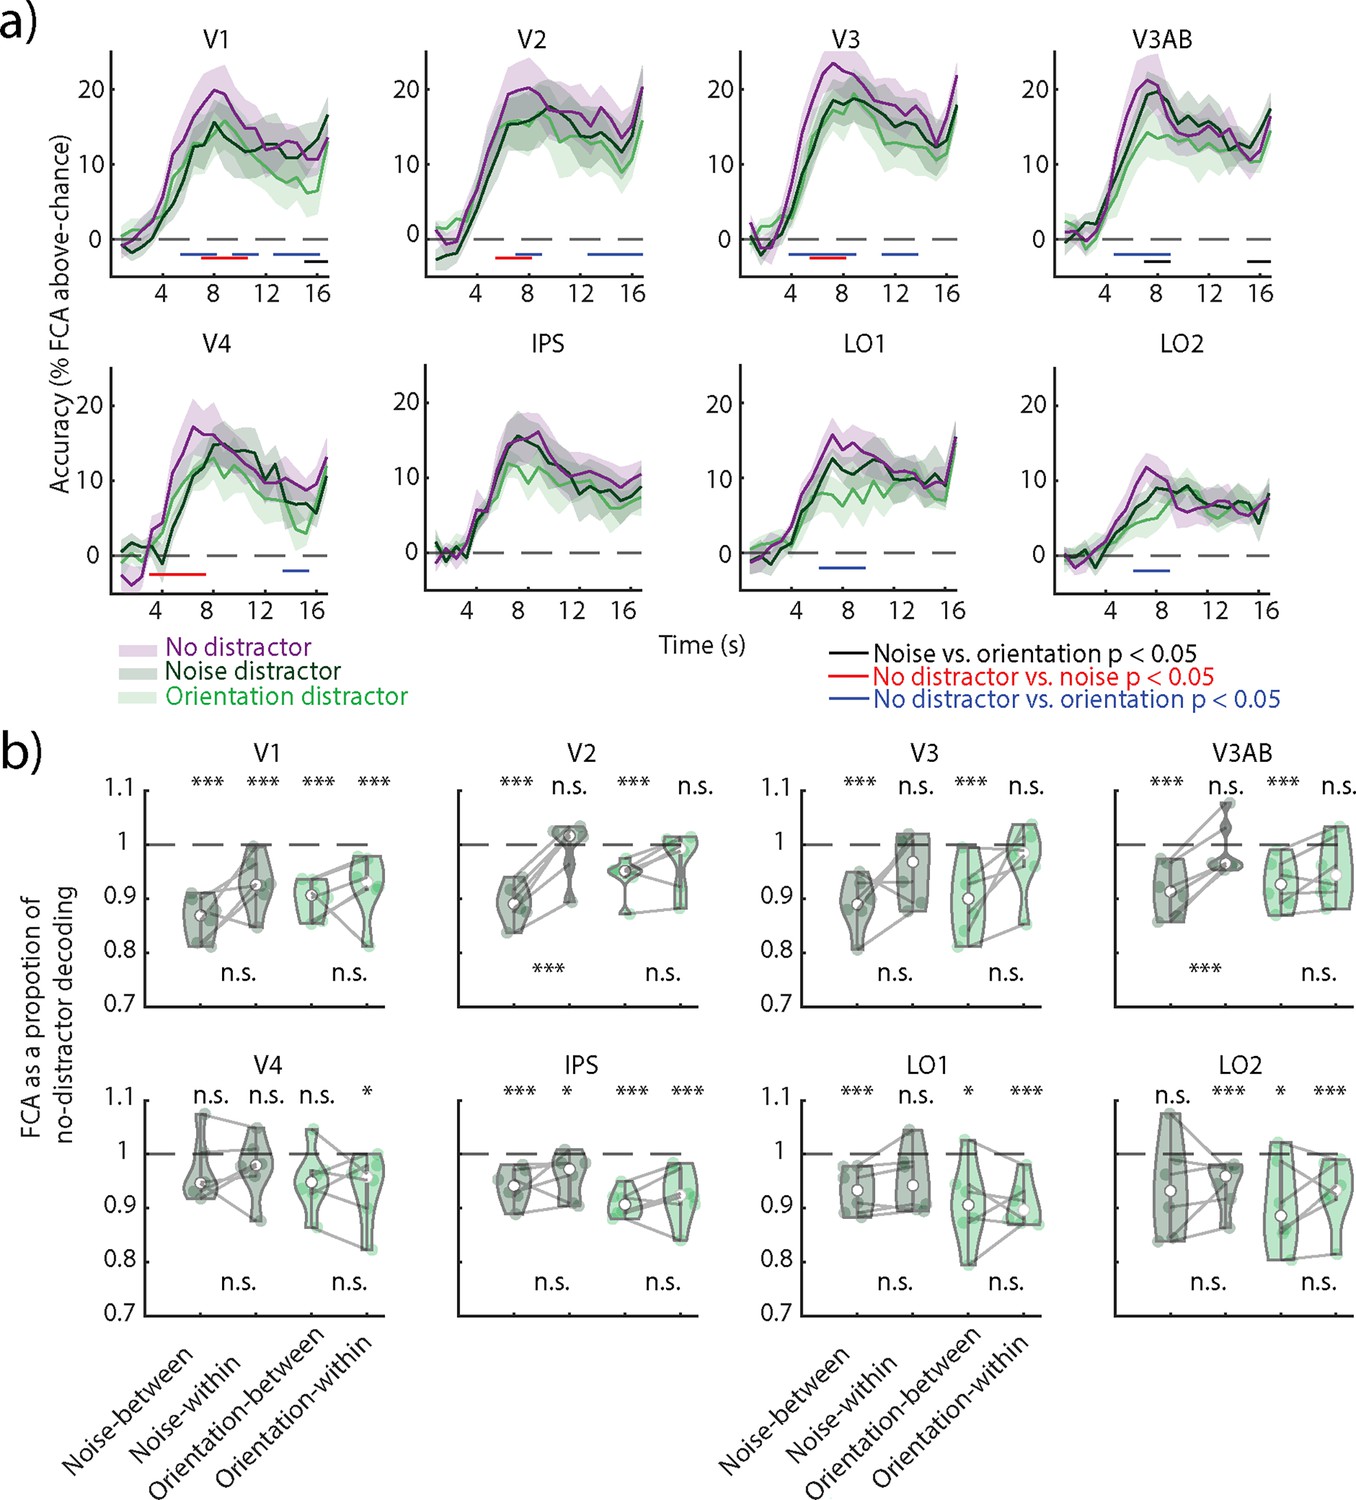
Cross-decoding between distractor and no-distractor conditions in Experiment 1.
(a) Decoding accuracy (feature continuous accuracy [FCA]) across time for train and test on no-distractor trials (purple), train and test on noise distractor trials (dark green), and train and test on orientation distractor trials (light green). Horizontal lines indicate clusters where there is a difference between two time courses (all clusters p<0.05; nonparametric cluster permutation test, see color code on the right). (b) Decoding accuracy as a proportion of no-distractor decoding estimated on the averaged delay period (4–16.8 s). Nonparametric permutation tests compared the decoding accuracy of each analysis to the no-distractor decoding baseline (indicated as a dashed line) and between a decoder trained and tested on distractor trials (noise- or orientation-within) and a decoder trained on no-distractor trials and tested on distractor trials (noise- or orientation-cross). FDR-corrected across regions of interest (ROIs). *p<0.05, ***p<0.001. Corresponding p-values can be found in Supplementary file 1, table S2.
Figure 4—figure supplement 1

Temporal cross-decoding generalization between distractor and no-distractor visual working memory (VWM) trials.
(a) Across-participant mean temporal cross-decoding of noise distractor trials when trained on no-distractor trials. (b) Same as a, but orientation distractor trials trained on no-distractor trials.
Figure 4—figure supplement 2

Cross-decoding between distractor and no-distractor conditions in Experiment 2.
Decoding accuracy as a proportion of no-distractor decoding estimated on the averaged delay period (4–16.8 s). Nonparametric permutation tests compared the decoding accuracy of each analysis to the no-distractor decoding baseline (indicated as a dashed line) and between a decoder trained and tested on distractor trials (noise- or orientation-within) and a decoder trained on no-distractor trials and tested on distractor trials (noise- or orientation-cross). FDR-corrected across regions of interest (ROIs). *p<0.05, **p<0.01, ***p<0.001. Corresponding p-values can be found in Supplementary file 1, table S3.
Additional files
-
Supplementary file 1
Supplementary Tables.
- https://cdn.elifesciences.org/articles/99290/elife-99290-supp1-v1.docx
-
MDAR checklist
- https://cdn.elifesciences.org/articles/99290/elife-99290-mdarchecklist1-v1.docx
Download links
A two-part list of links to download the article, or parts of the article, in various formats.
Downloads (link to download the article as PDF)
Open citations (links to open the citations from this article in various online reference manager services)
Cite this article (links to download the citations from this article in formats compatible with various reference manager tools)
Neural dynamics of visual working memory representation during sensory distraction
eLife 13:RP99290.
https://doi.org/10.7554/eLife.99290.4


