Single-nucleus transcriptomics reveal the cytological mechanism of conjugated linoleic acids in regulating intramuscular fat deposition
- College of Animal Sciences, Zhejiang University, China
- Key Laboratory of Molecular Animal Nutrition, Zhejiang University, China
- Key Laboratory of Animal Feed and Nutrition of Zhejiang Province, China
Figures
Figure 1 with 1 supplement
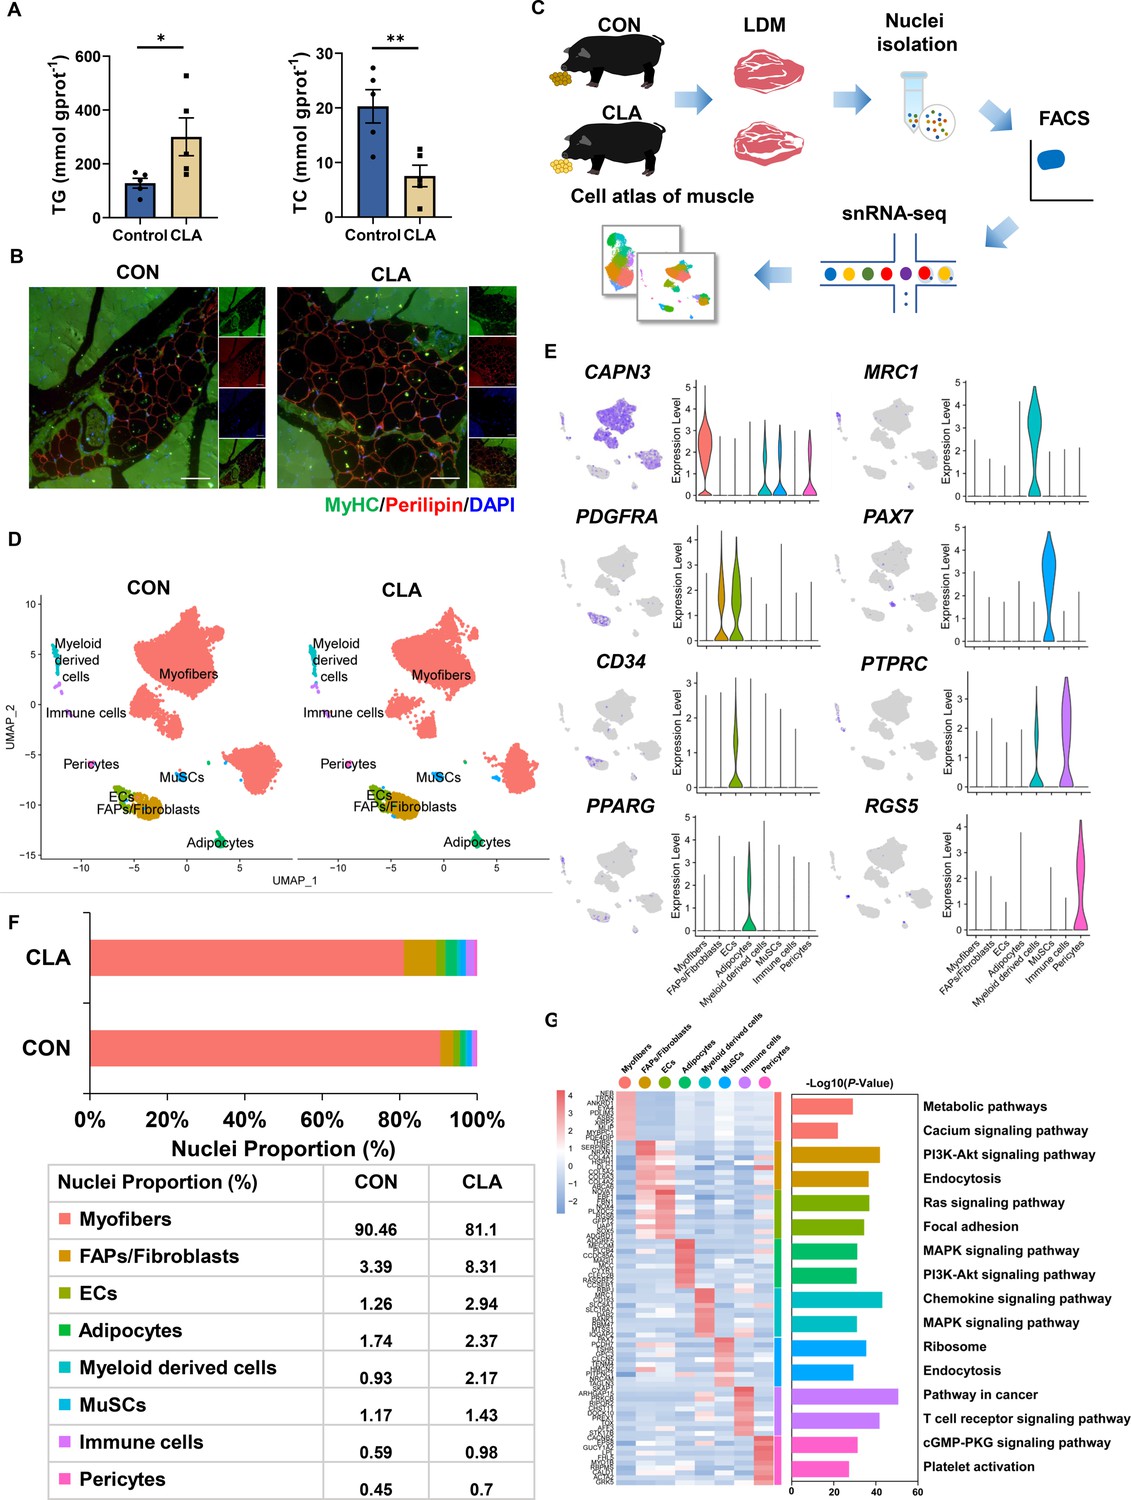
Single-nucleus RNA-sequencing (snRNA-seq) identifies distinct cell populations after conjugated linoleic acids (CLAs) treatment in pig muscles.
(A) TG and TC content of longissimus dorsi muscle (LDM) tissues in control and CLAs groups (n=5). (B) LDM tissues stained with the adipogenic marker perilipin (red), muscle fiber marker MyHC (green), and DAPI (blue) in different groups. Scale bars, 200 and 100 μm, respectively. (C) Scheme of the experimental design for snRNA-seq on different muscles. (D) Uniform Manifold Approximation and Projection (UMAP) visualization of all of the isolated single nuclei from Heigai pig muscles colored by cluster identity. (E) UMAP and violin plot displaying the expression of selected marker genes for each cluster in pigs. (F) Nuclear proportion in each cluster in pig muscles of control and CLAs groups. Each cluster is color-coded. (G) Left, heatmap showing the top 10 most differentially expressed genes between cell types identified. Right, KEGG enrichment for marker genes of each cell type in muscles. Each lane represents a subcluster. Error bars represent SEM. *p<0.05, **p<0.01, two-tailed Student’s t-test.
Figure 1—figure supplement 1
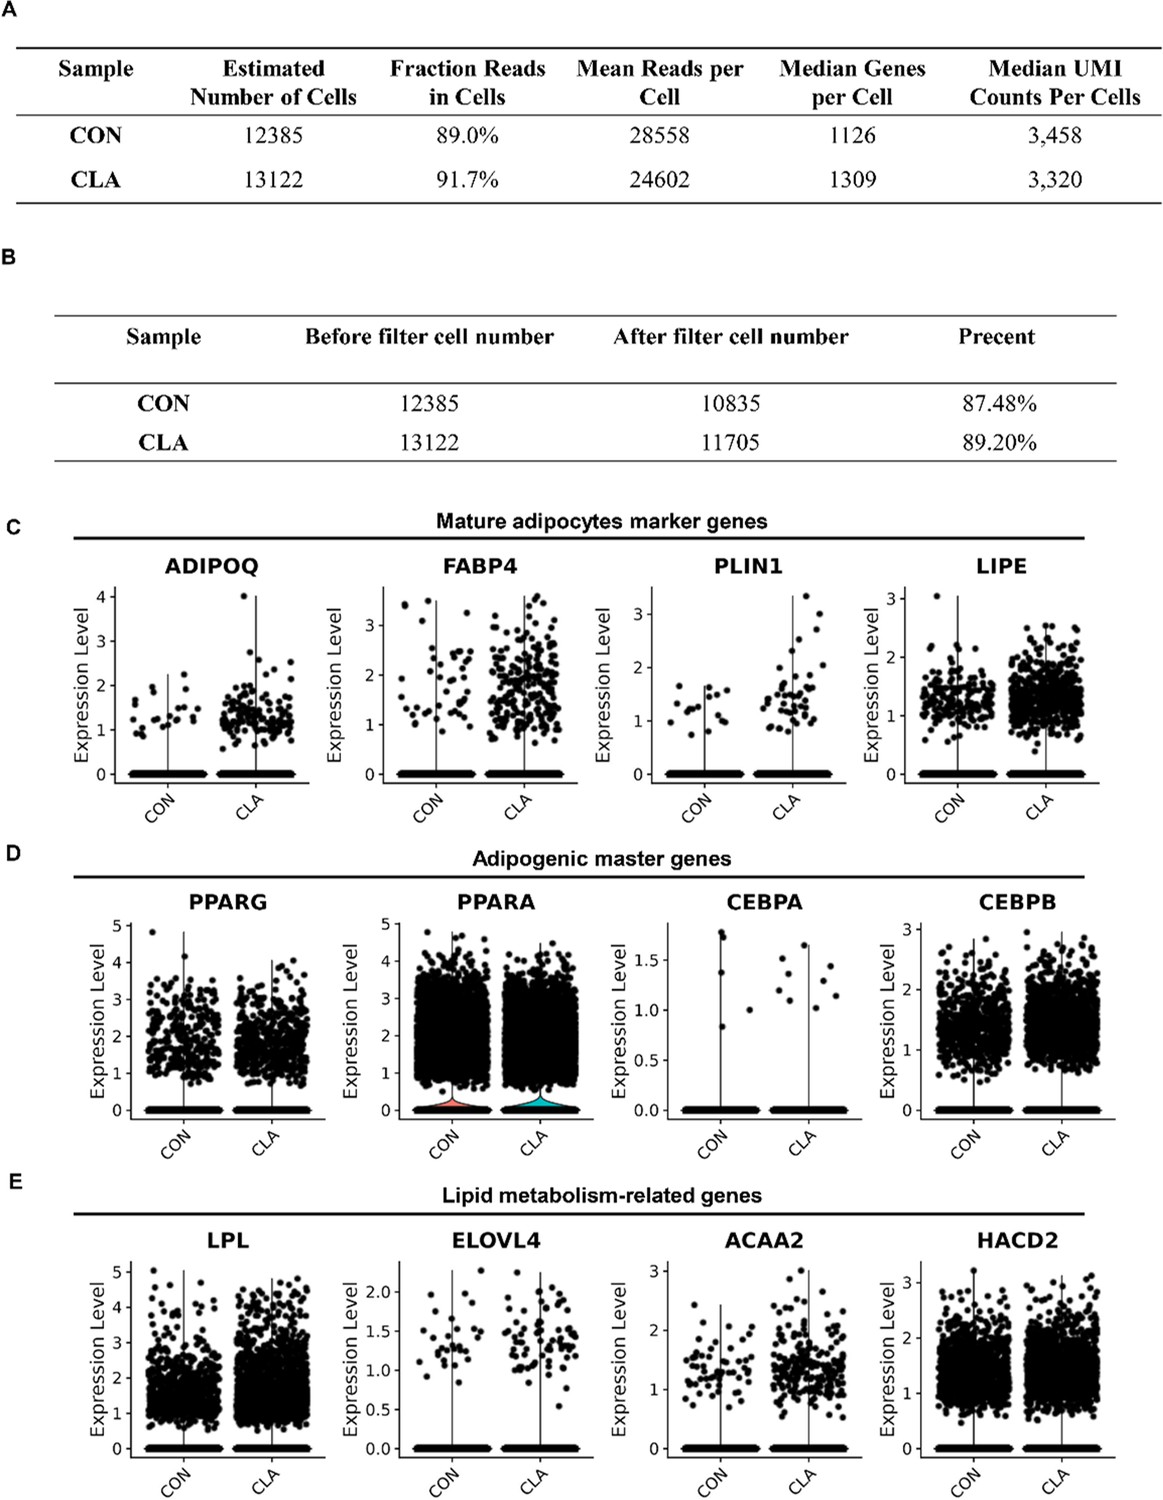
Conjugated linoleic acid (CLA) upregulated the expression of adipogenic-related genes in muscles.
(A) The results obtained from Cell Ranger analyses. (B) Cell number of single-nucleus RNA-sequencing (snRNA-seq) datasets before or after filter from each sample. (C–E) Violin plot displaying the expression of adipogenic master genes (C), mature adipocyte marker genes (D), and lipid metabolism-related genes (E) in different groups.
Figure 2
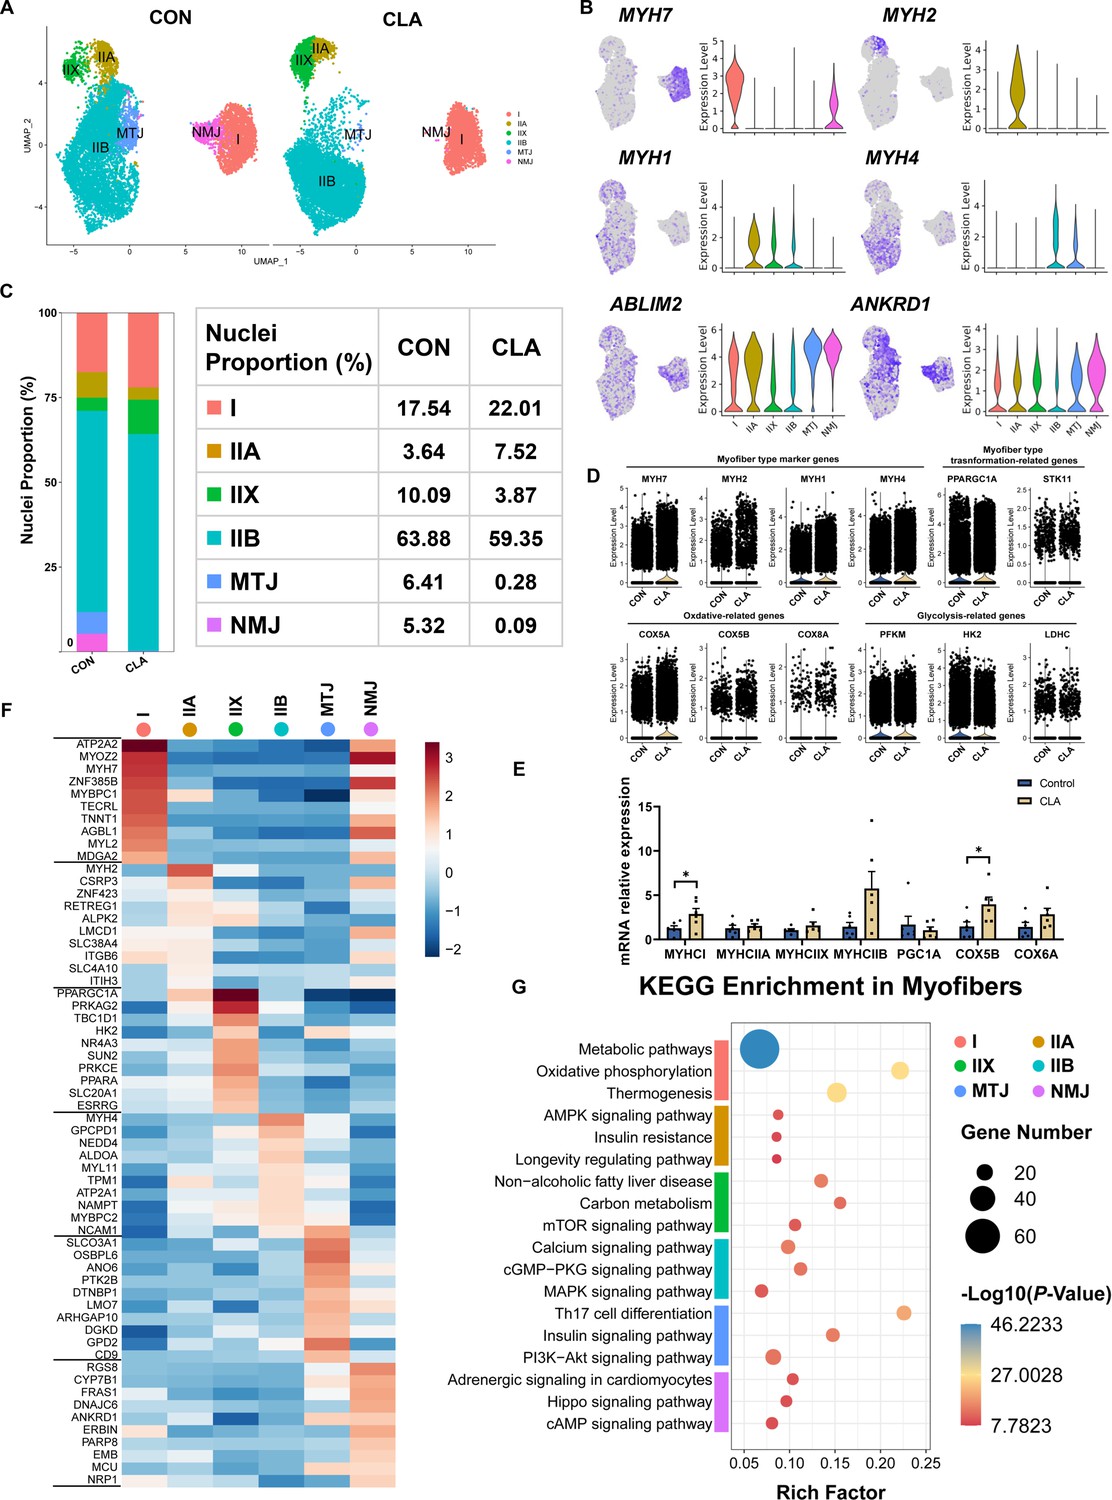
Cell and transcriptional heterogeneity in myofibers.
(A) Uniform Manifold Approximation and Projection (UMAP) plot showing six subclusters of the isolated single nuclei from the control and conjugated linoleic acids (CLAs) muscles. (B) UMAP and violin plot displaying the expression of selected marker genes for each subcluster. (C) Cell proportion in each subcluster in different groups. Each cluster is color-coded. (D) Violin plot showing the expression of myofiber-type marker genes (MYH7, MYH2, MYH1, and MYH4), myofiber-type transformation-related genes (PPARGC1A and STK11), oxidation-related genes (COX5A, COX5B, and COX8A), and glycolysis-related genes (PFKM, HK2, and LDHC) after CLAs treatment. (E) The mRNA expression of myofiber-type-related genes in longissimus dorsi muscle (LDM) muscles after different treatment (n=6). (F) Heatmap representing the top 10 most differently expressed genes between cell subclusters identified. (G) KEGG enrichment for marker genes of each cell type in myofibers. I, type I myonuclei; IIa, type IIa myonuclei; IIx, type IIx myonuclei; IIb, type IIb myonuclei; MTJ, myotendinous junction nuclei; NMJ, neuromuscular junction nuclei. Error bars represent SEM. *p<0.05, two-tailed Student’s t-test.
Figure 3 with 1 supplement

Clustering and transcriptional dynamics of adipocytes.
(A) Uniform Manifold Approximation and Projection (UMAP) plot displaying the isolated single nuclei in three subclusters of adipocytes. (B) Bar plot displaying the cell amounts in each subcluster in different groups. (C) Dot plot showing the expression of three subcluster marker genes in muscle nuclei of Heigai pigs. (D) The mRNA expression of three subcluster marker genes in longissimus dorsi muscle (LDM) muscles after different treatment (n=6). (E) LDM tissues stained with the adipogenic marker perilipin (red), muscle fiber marker MyHC (green), SCD1 (pink), and DAPI (blue) in different groups. Scale bars, 100 μm. (F) Left, heatmap showing the top 10 most differentially expressed genes between cell types identified. Right, KEGG enrichment for marker genes of each cell type in muscles. (G) Unsupervised pseudotime trajectory of the three subtypes of adipocytes by RNA velocity analysis. Trajectory is colored by cell subtypes. The arrow indicates the direction of cell pseudotemporal differentiation. (H) Scheme of the differentiation trajectories in mature adipocytes. Error bars represent SEM. *p<0.05, **p<0.01, two-tailed Student’s t-test.
Figure 3—figure supplement 1
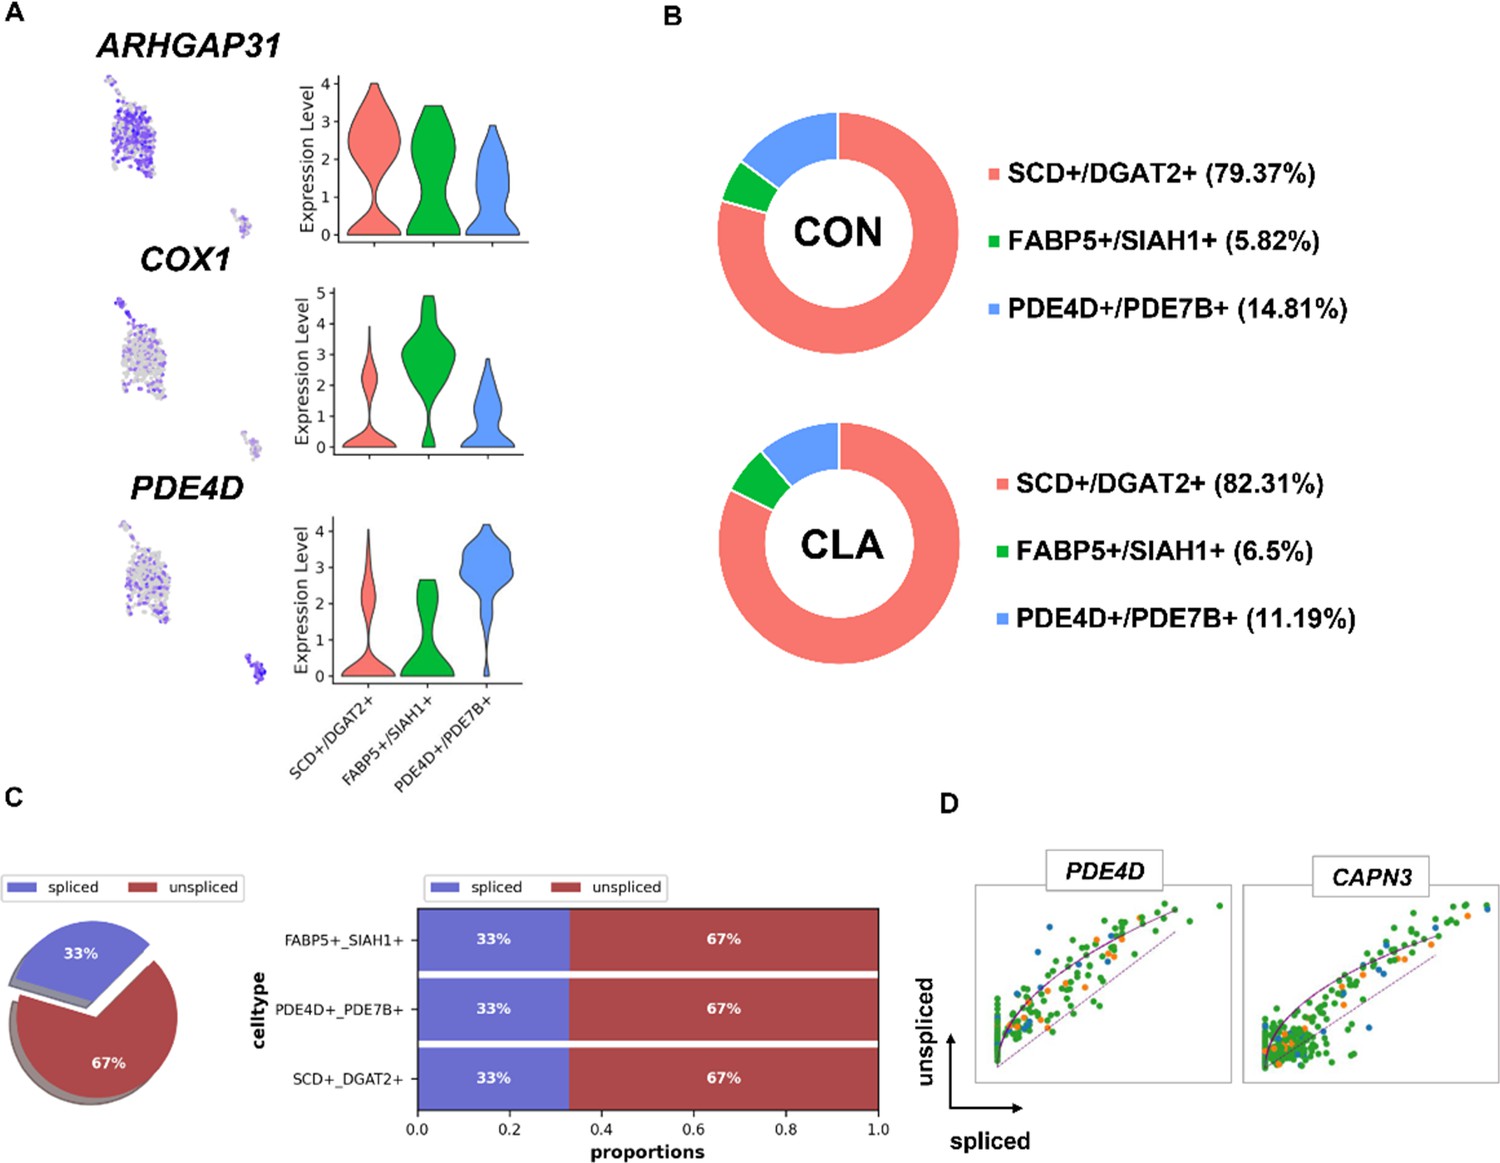
Clustering analysis of adipocytes nuclei.
(A) Uniform Manifold Approximation and Projection (UMAP) plot and violin plot showing the expression of three subcluster marker genes in adipocytes nuclei. (B) Cell proportion in each subcluster in different groups. Each cluster is color-coded. (C) Pie chart showing the proportion of adipocytes that are spliced vs un-spliced. (D) Transcriptional dynamics of marker genes on the UMAPs based on RNA velocity analysis.
Figure 4 with 2 supplements
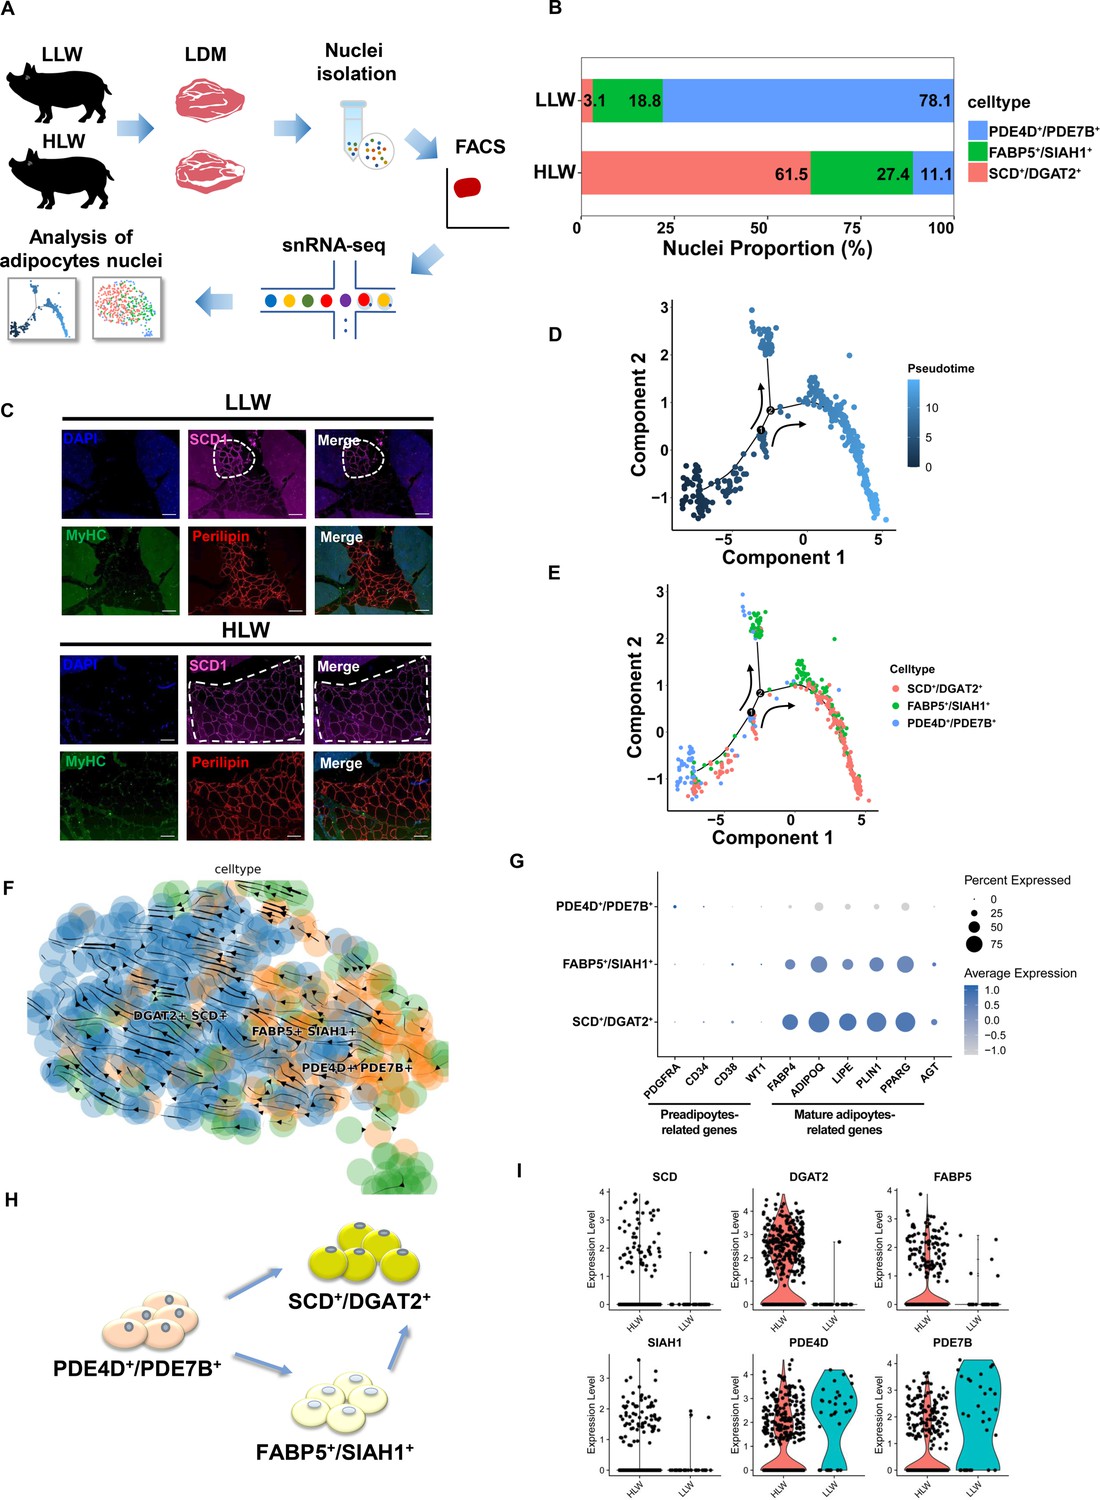
Pseudotemporal and differentiated trajectories of adipocytes in high intramuscular fat (IMF) content Laiwu pig muscles.
(A) Scheme of the experimental design for single-nucleus RNA-sequencing (snRNA-seq) on adipocytes of high IMF content Laiwu pig muscles. (B) Cell proportion of adipocytes subclusters in high IMF content Laiwu pigs (HLW) and low IMF content Laiwu pigs (LLW) groups. Each cluster is color-coded. (C) Longissimus dorsi muscle (LDM) tissues stained with the adipogenic marker perilipin (red), muscle fiber marker MyHC (green), SCD1 (pink), and DAPI (blue) in HLW and LLW groups. Scale bars, 100 μm. (D–E) Pseudotime ordering of all of the adipocytes of subclusters DGAT2+/SCD+, FABP5+/SIAH1+, and PDE4D+/PDE7B+. Each dot represents one nucleus (color-coded by its identity), and each branch represents one cell state. Pseudotime is shown colored in a gradient from dark to light blue, and the start of pseudotime is indicated. Activation of the PDE4D+/PDE7B+ cluster can lead to DGAT2+/SCD+ and FABP5+/SIAH1+ fate. (F) Unsupervised pseudotime trajectory of the three subtypes of adipocytes by RNA velocity analysis. Trajectory is colored by cell subtypes. The arrow indicates the direction of cell pseudotemporal differentiation. (G) Dot plot showing the expression of preadipocytes and mature adipocytes-related genes in different subclusters. (H) Scheme of the differentiation trajectories in mature adipocytes of Laiwu pigs. (I) Violin plot showing the expression of three subcluster marker genes in different groups.
Figure 4—figure supplement 1
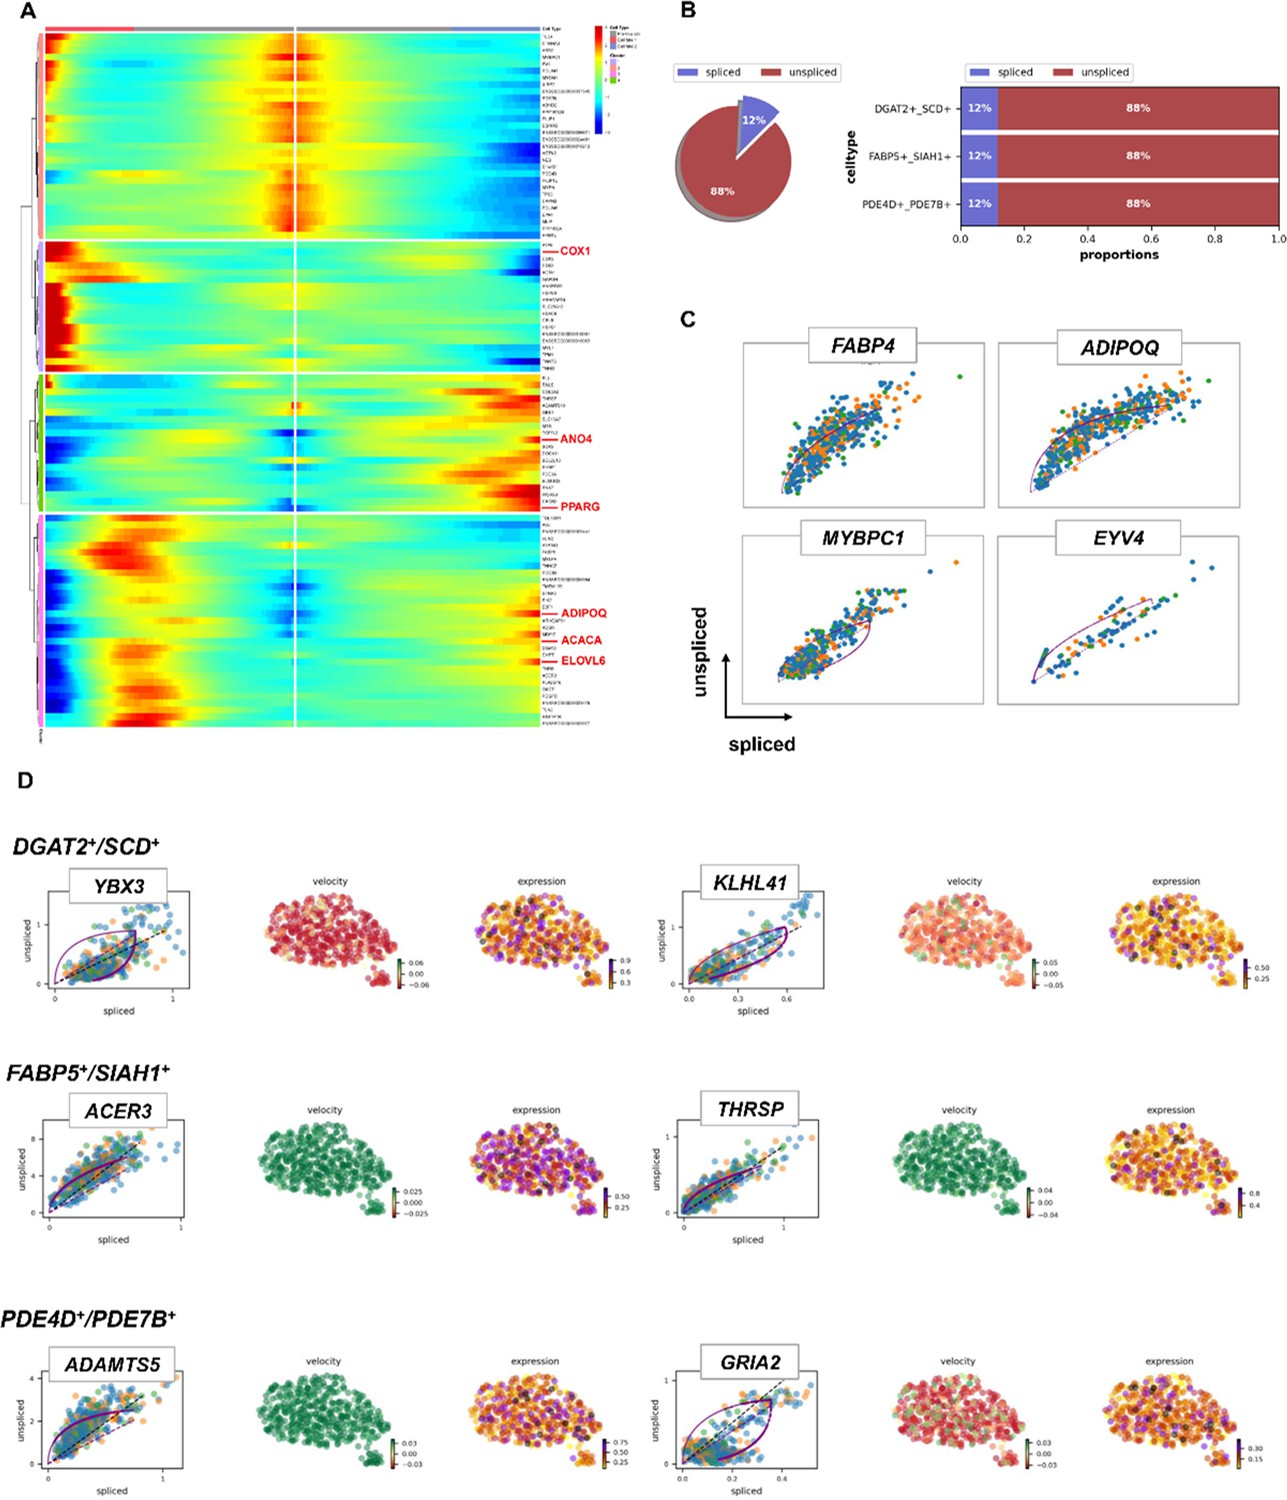
Pseudotime trajectory analysis of adipocytes nuclei by RNA velocity in high IMF content Laiwu pigs (HLW) pigs.
(A) Pseudotemporal heatmap showing gene expression dynamics for significant marker genes. Genes (rows) were clustered into three modules, and cells (columns) were ordered according to pseudotime in different groups. (B) Pie chart showing the proportion of fibro/adipogenic progenitors (FAPs) subtypes that are spliced vs un-spliced. (C) Transcriptional dynamics of marker genes on the Uniform Manifold Approximation and Projections (UMAPs) based on RNA velocity analysis. (D) Transcriptional dynamics of top 2 marker genes on the UMAPs based on RNA velocity analysis.
Figure 4—figure supplement 2
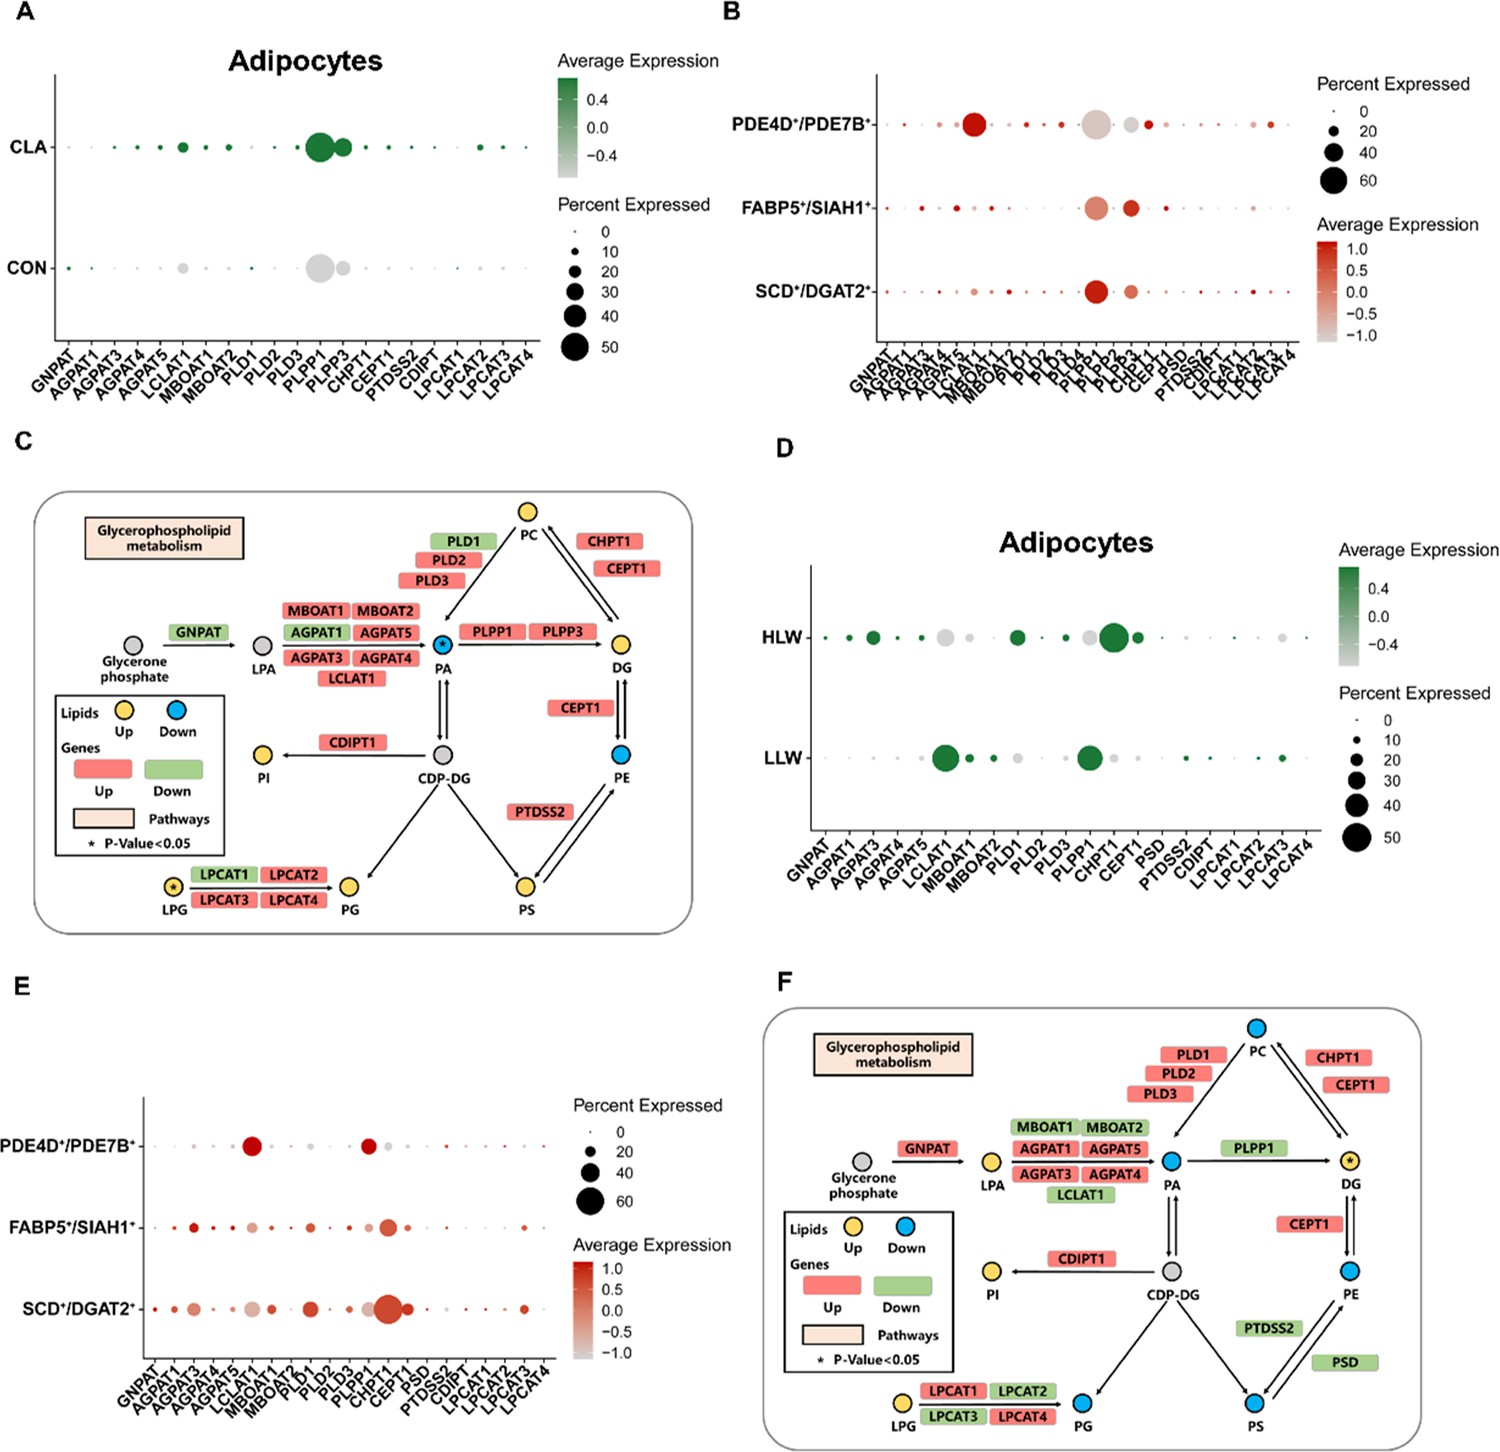
Comparison of gene programs involved in glycerophospholipid metabolism.
(A) Dot plot showing the relative expression of glycerophospholipid metabolism-related genes in CON and conjugated linoleic acid (CLA) group of adipocytes. (B) Dot plot showing the relative expression of glycerophospholipid metabolism-related genes in three subclusters of adipocytes nuclei in Heigai pigs. (C) Selected glycerophospholipid metabolic reactions from KEGG, with indications of quantified lipid classes and acyl chains (circles) and genes (rectangles) significantly regulated compared with the CON group. (D) Dot plot showing the relative expression of glycerophospholipid metabolism-related genes in high IMF content Laiwu pigs (HLW) and low IMF content Laiwu pigs (LLW) groups of adipocytes nuclei. (E) Dot plot showing the relative expression of glycerophospholipid metabolism-related genes in three subclusters of adipocytes nuclei in Laiwu pigs. (F) Selected glycerophospholipid metabolic reactions from KEGG, with indications of quantified lipid classes and acyl chains (circles) and genes (rectangles) significantly regulated compared with the LLW group. Statistical analysis was performed using two-tailed Student’s t-test.
Figure 5
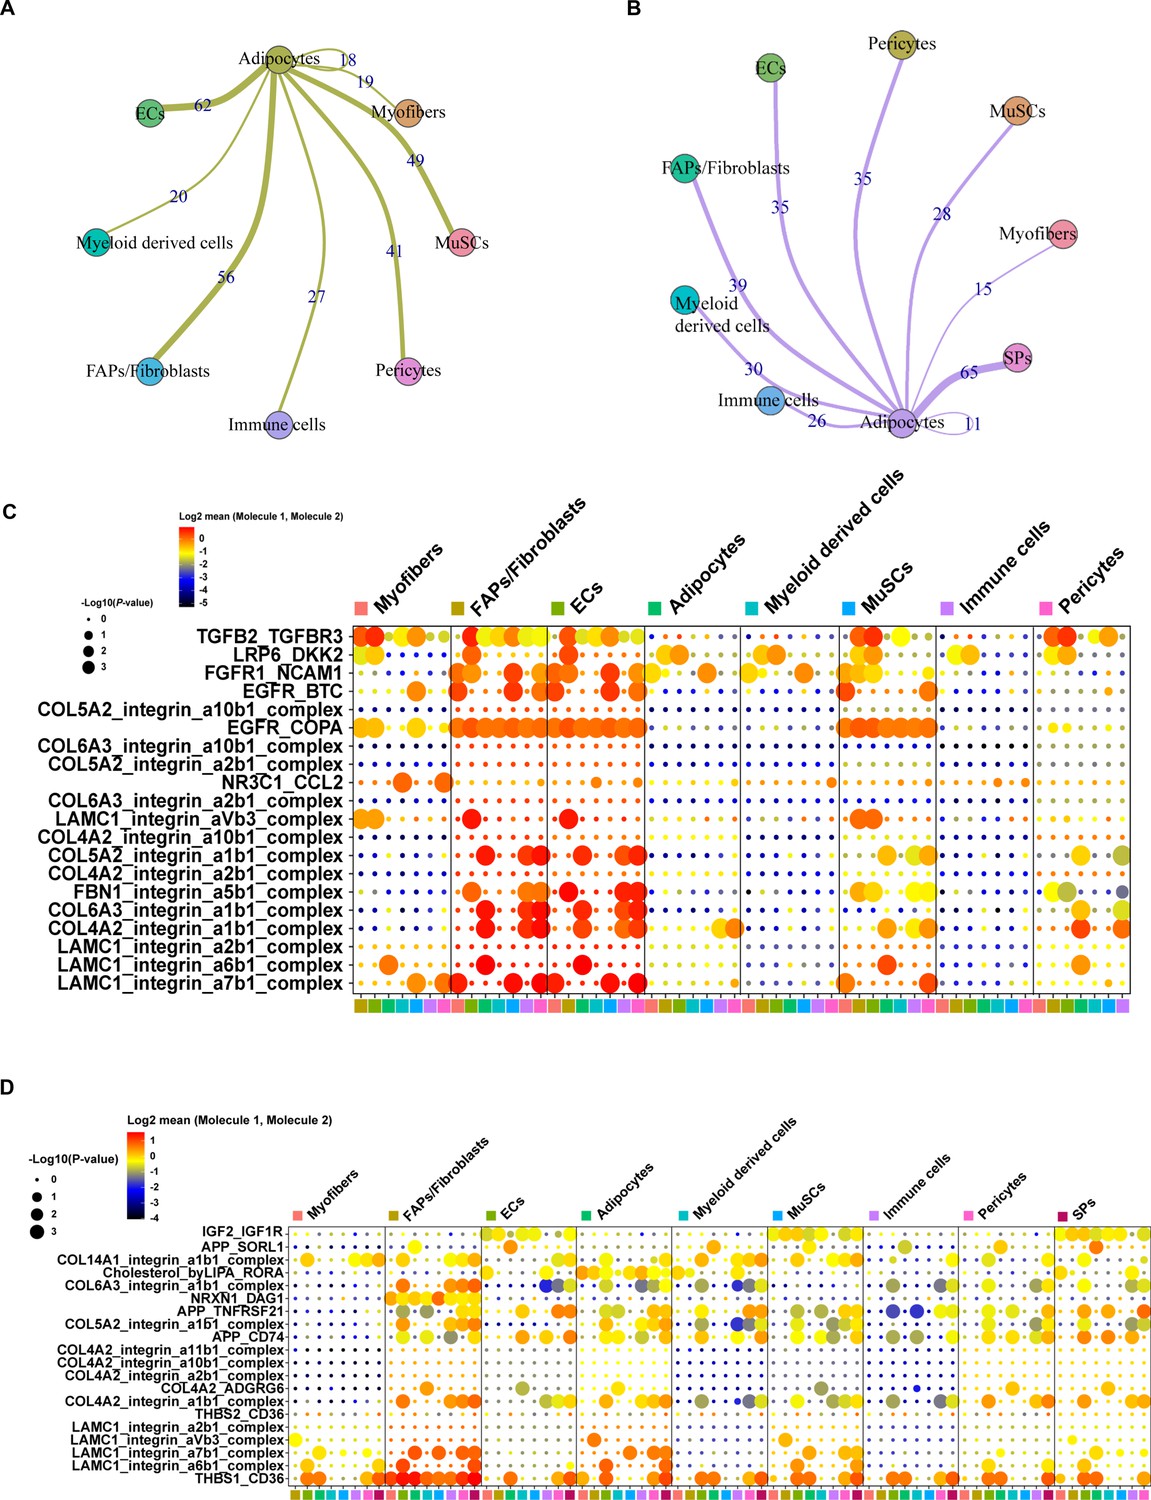
Cell-cell communication analysis of adipocytes in pig muscles.
(A) Cell-cell communication analysis showed the network between adipocytes and other clusters in muscles of Heigai pigs. (B) Cell-cell communication analysis showed the network between adipocytes and other clusters in muscles of Laiwu pigs. (C) Dot plot representing the gene expression and significance of the receptor-ligand relationship in different cell population in muscles of Heigai pigs. (D) Dot plot representing the gene expression and significance of the receptor-ligand relationship in different cell population in muscles of Laiwu pigs. The larger the circle, the smaller the p-value of the relationship in the corresponding cell population, the more significant it is.
Figure 6 with 1 supplement
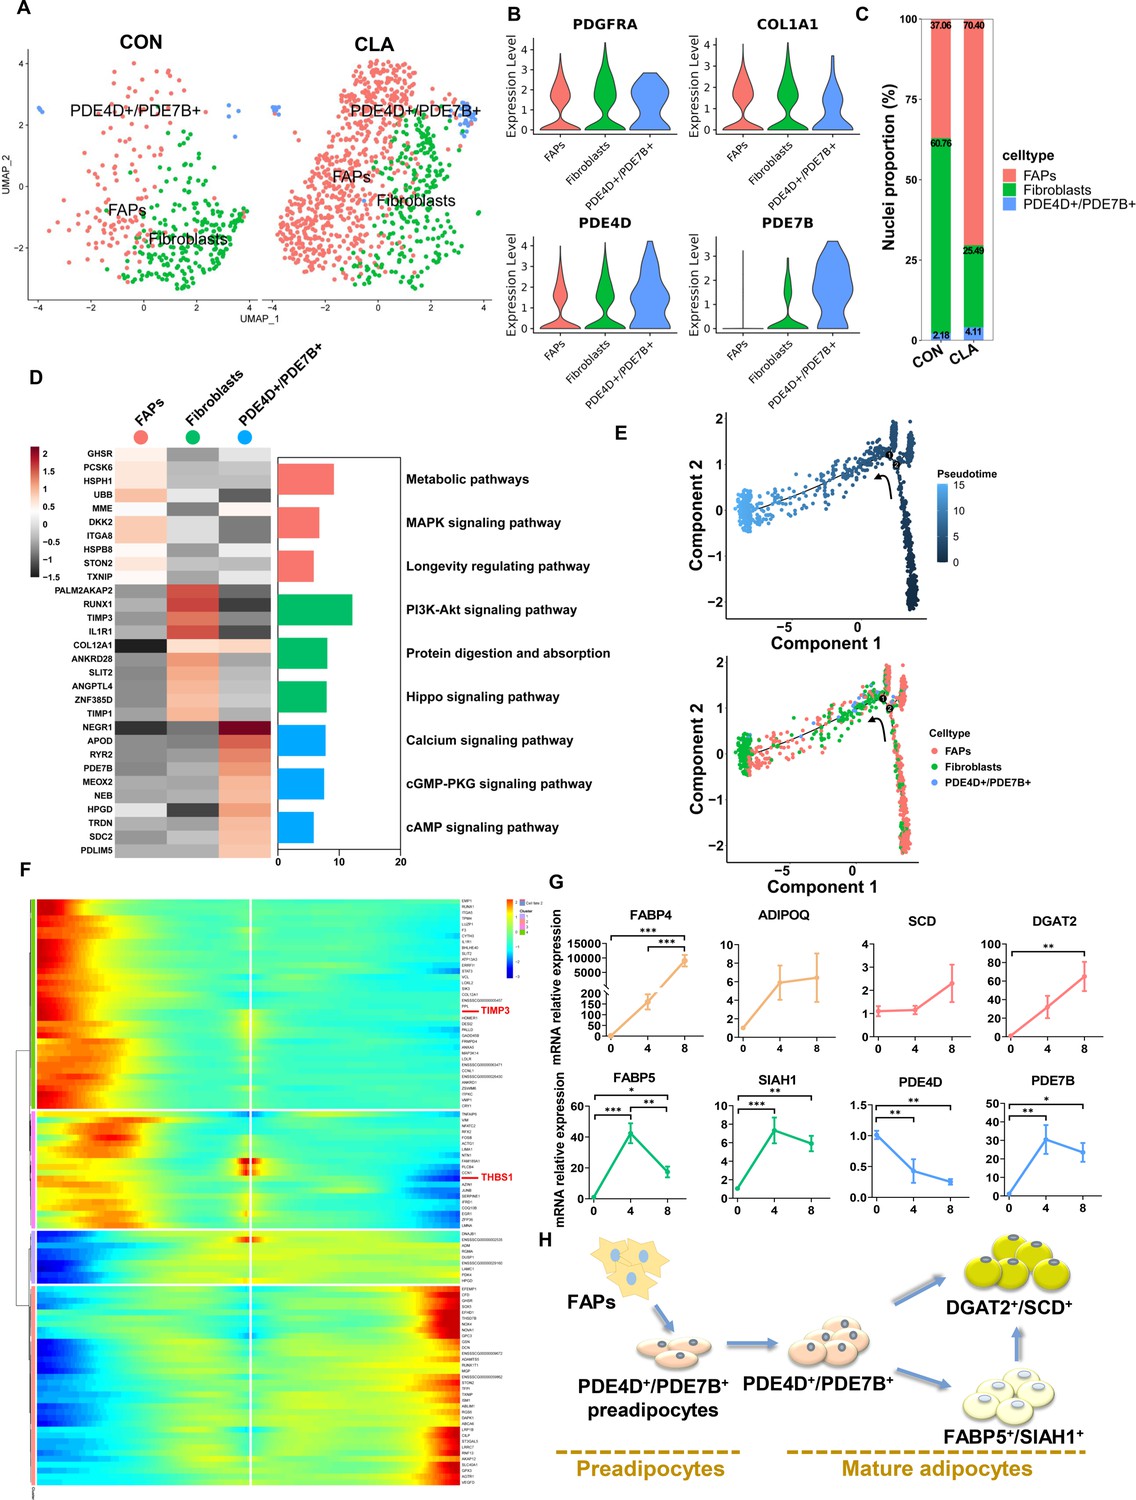
Clustering and pseudotemporal trajectories of fibro/adipogenic progenitors (FAPs).
(A) Uniform Manifold Approximation and Projection (UMAP) plot showing three subclusters of the isolated single nuclei from control and conjugated linoleic acids (CLAs) muscle. (B) Violin plot displaying the expression of selected marker genes for each subcluster. (C) Cell proportion in each subcluster in different groups. Each cluster is color-coded. (D) Left, heatmap showing the top 10 most differentially expressed genes between cell types identified. Right, KEGG enrichment for marker genes of each cell type in muscles. (E) Pseudotime ordering of all of the FAP/fibroblast of subcluster FAPs, fibroblasts, and PDE4D+/PDE7B+. Each dot represents one nucleus (color-coded by its identity), and each branch represents one cell state. Pseudotime is shown colored in a gradient from dark to light blue, and the start of pseudotime is indicated. Activation of the FAP cluster can lead to fibroblast fate or PDE4D+/PDE7B+ fate. (F) Pseudotemporal heatmap showing gene expression dynamics for significant marker genes. Genes (rows) were clustered into three modules, and cells (columns) were ordered according to pseudotime in different groups. (G) The expression of adipogenesis and three subcluster marker genes in differentiated FAPs in different differentiation stage (n=6). (H) Scheme of the differentiation trajectories of preadipocytes into mature adipocytes. Error bars represent SEM. *p<0.05, **p<0.01, ***p<0.001, two-tailed Student’s t-test.
Figure 6—figure supplement 1
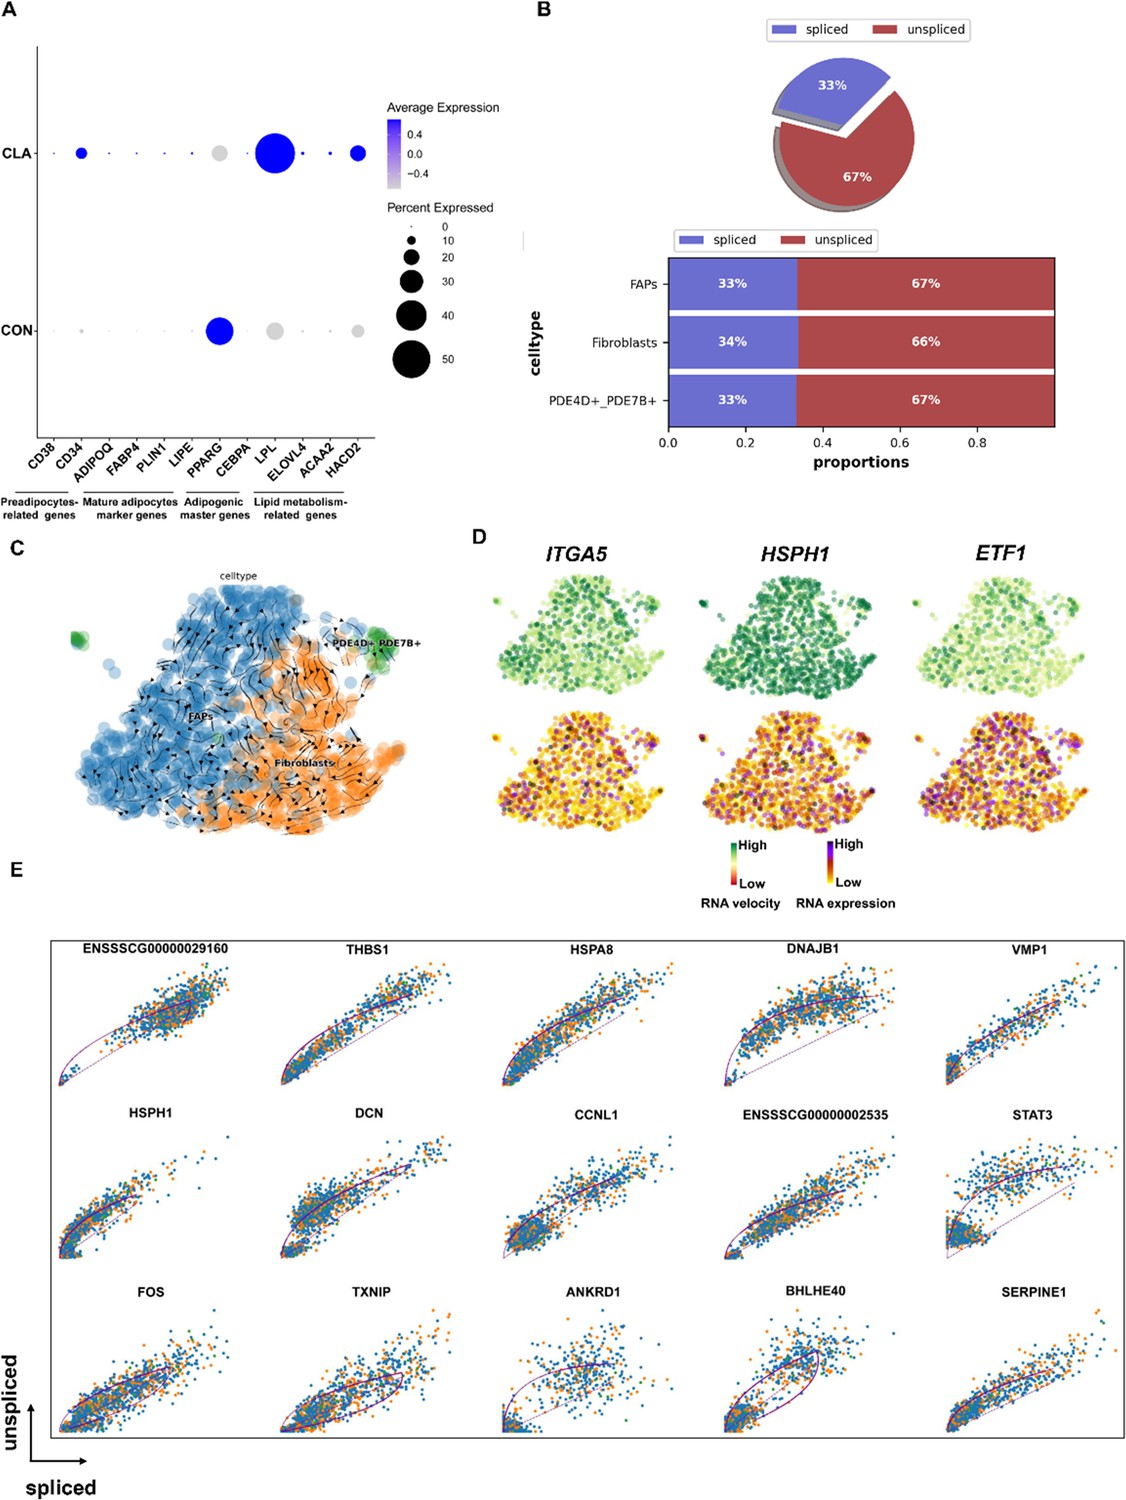
Pseudotime trajectory analysis of fibro/adipogenic progenitors (FAPs) nuclei by RNA velocity.
(A) Dot plot showing the expression of preadipocytes-related genes (CD38 and CD34), mature adipocytes marker genes (ADIPOQ, FABP4, PLIN1, and LIPE), adipogenic master (PPARG and CEBPA), and lipid metabolism-related genes (LPL, ELOVL4, ACAA2, and HACD2) after conjugated linoleic acid (CLA) treatment in FAPs. (B) Pie chart showing the proportion of adipocytes that are spliced vs un-spliced. Bar plot showing the proportion of FAPs subtypes that are spliced vs un-spliced in different species. (C) Unsupervised pseudotime trajectory of the three subtypes of FAPs by RNA velocity analysis. Trajectory is colored by cell subtypes. The arrow indicates the direction of cell pseudotemporal differentiation. (D) Distribution of marker genes of the three subtypes on the UMAPs based on RNA velocity analysis. (E) Transcriptional dynamics of top 15 marker genes on the UMAPs based on RNA velocity analysis.
Figure 7 with 1 supplement
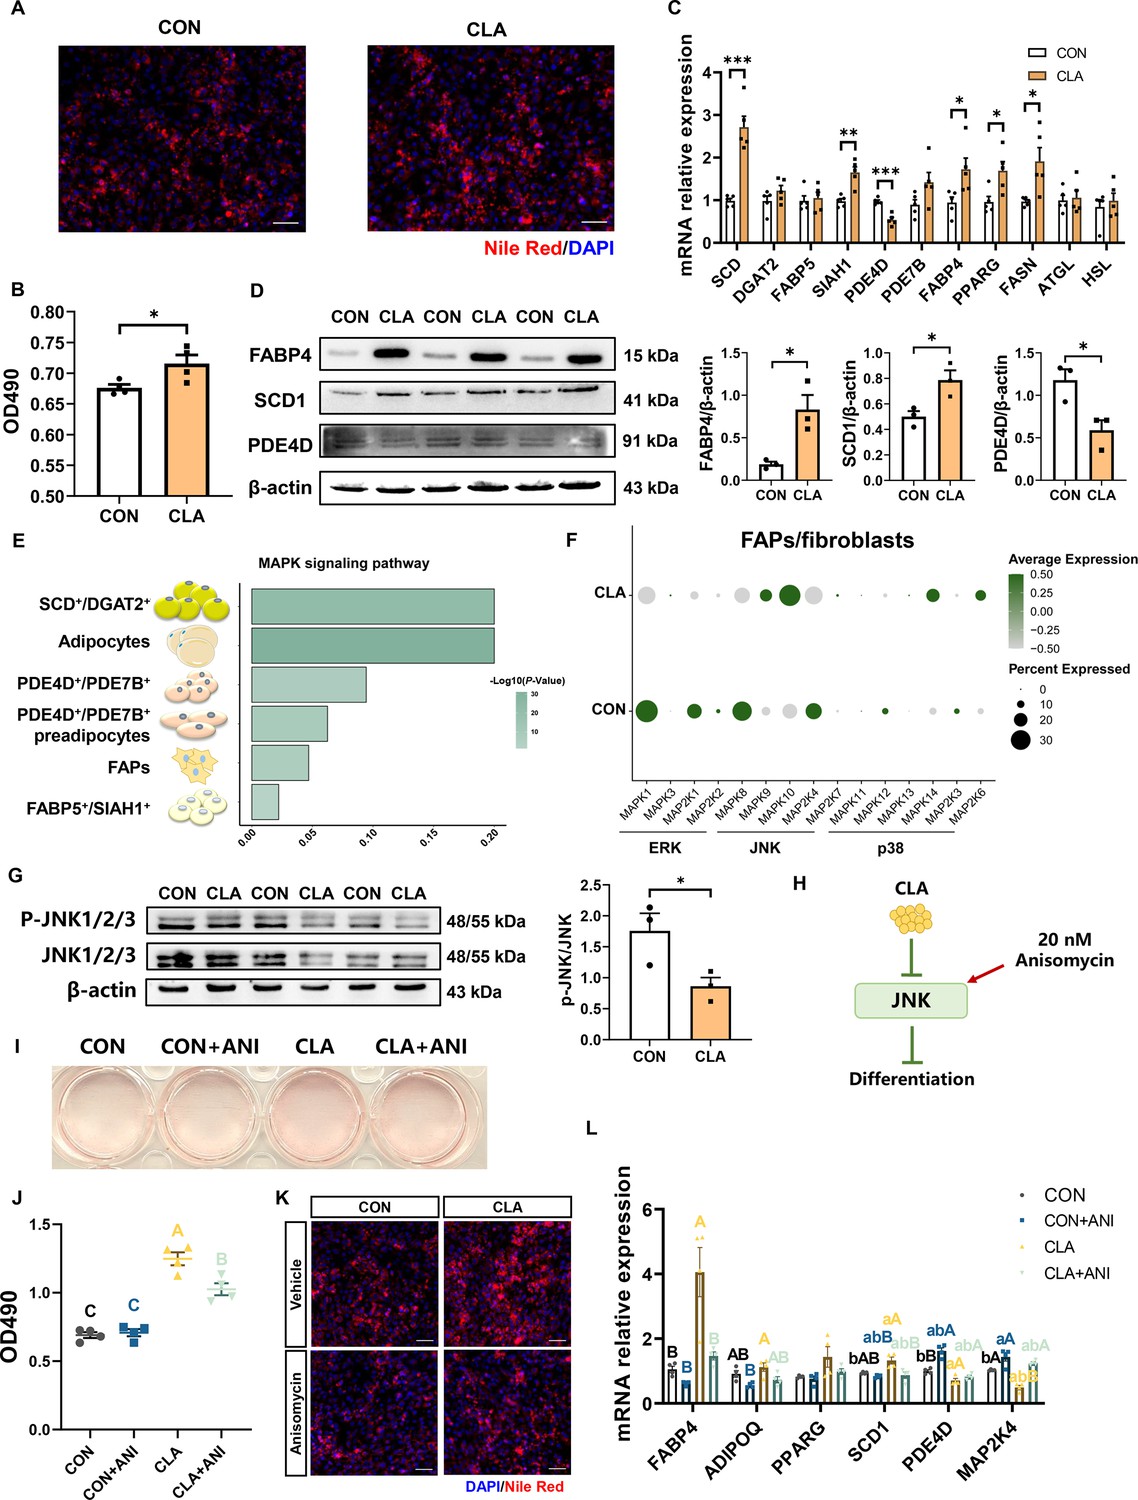
The cytological mechanism of conjugated linoleic acids (CLAs) regulates fibro/adipogenic progenitors (FAPs) differentiation.
(A) Differentiated FAPs stained with Nile Red (red) and DAPI (blue) in different groups. Scale bars, 200 and 100 μm, respectively. (B) OD490 levels of total lipids in differentiated FAPs after different treatment (n=4). (C) The mRNA expression of three subcluster marker genes and adipogenic marker genes in differentiated FAPs after different treatment (n=5). (D) Protein levels of FABP4, SCD1, and PDE4D were detected by western blot. (E) MAPK signaling pathway enrichment in different cells. (F) Dot plot showing the expression of MAPK signaling pathway-related genes after CLA treatment in FAPs/fibroblasts. (G) Protein levels of P-JNK and JNK were detected by western blot. (H) Scheme of CLAs regulating the differentiation trajectories of FAPs into mature adipocytes. (I) Differentiated FAPs stained with Oil Red O in different groups after treating with 20 nM anisomycin. (J) OD490 levels of total lipids in differentiated FAPs after different treatment (n=4). (K) Differentiated FAPs stained with Nile Red (red) and DAPI (blue) after 20 nM anisomycin treatment. Scale bars, 200 μm. (L) The mRNA expression of adipogenic-related genes in differentiated FAPs after different treatment (n=4). Error bars represent SEM. *p<0.05, **p<0.01, ***p<0.001, two-tailed Student’s t-test and one-way ANOVA. Letters represent statistical significance. Lowercase letters represent p<0.05 and uppercase letters represent p<0.01.
-
Figure 7—source data 1
PDF file containing original western blots for Figure 7D and G.
The lower membranes correspond to CON group and higher membranes correspond to CLA group.
- https://cdn.elifesciences.org/articles/99790/elife-99790-fig7-data1-v1.pdf
-
Figure 7—source data 2
Original files for western blot analysis displayed in Figure 7D and G.
The lower membranes correspond to CON group and higher membranes correspond to CLA group.
- https://cdn.elifesciences.org/articles/99790/elife-99790-fig7-data2-v1.zip
Figure 7—figure supplement 1
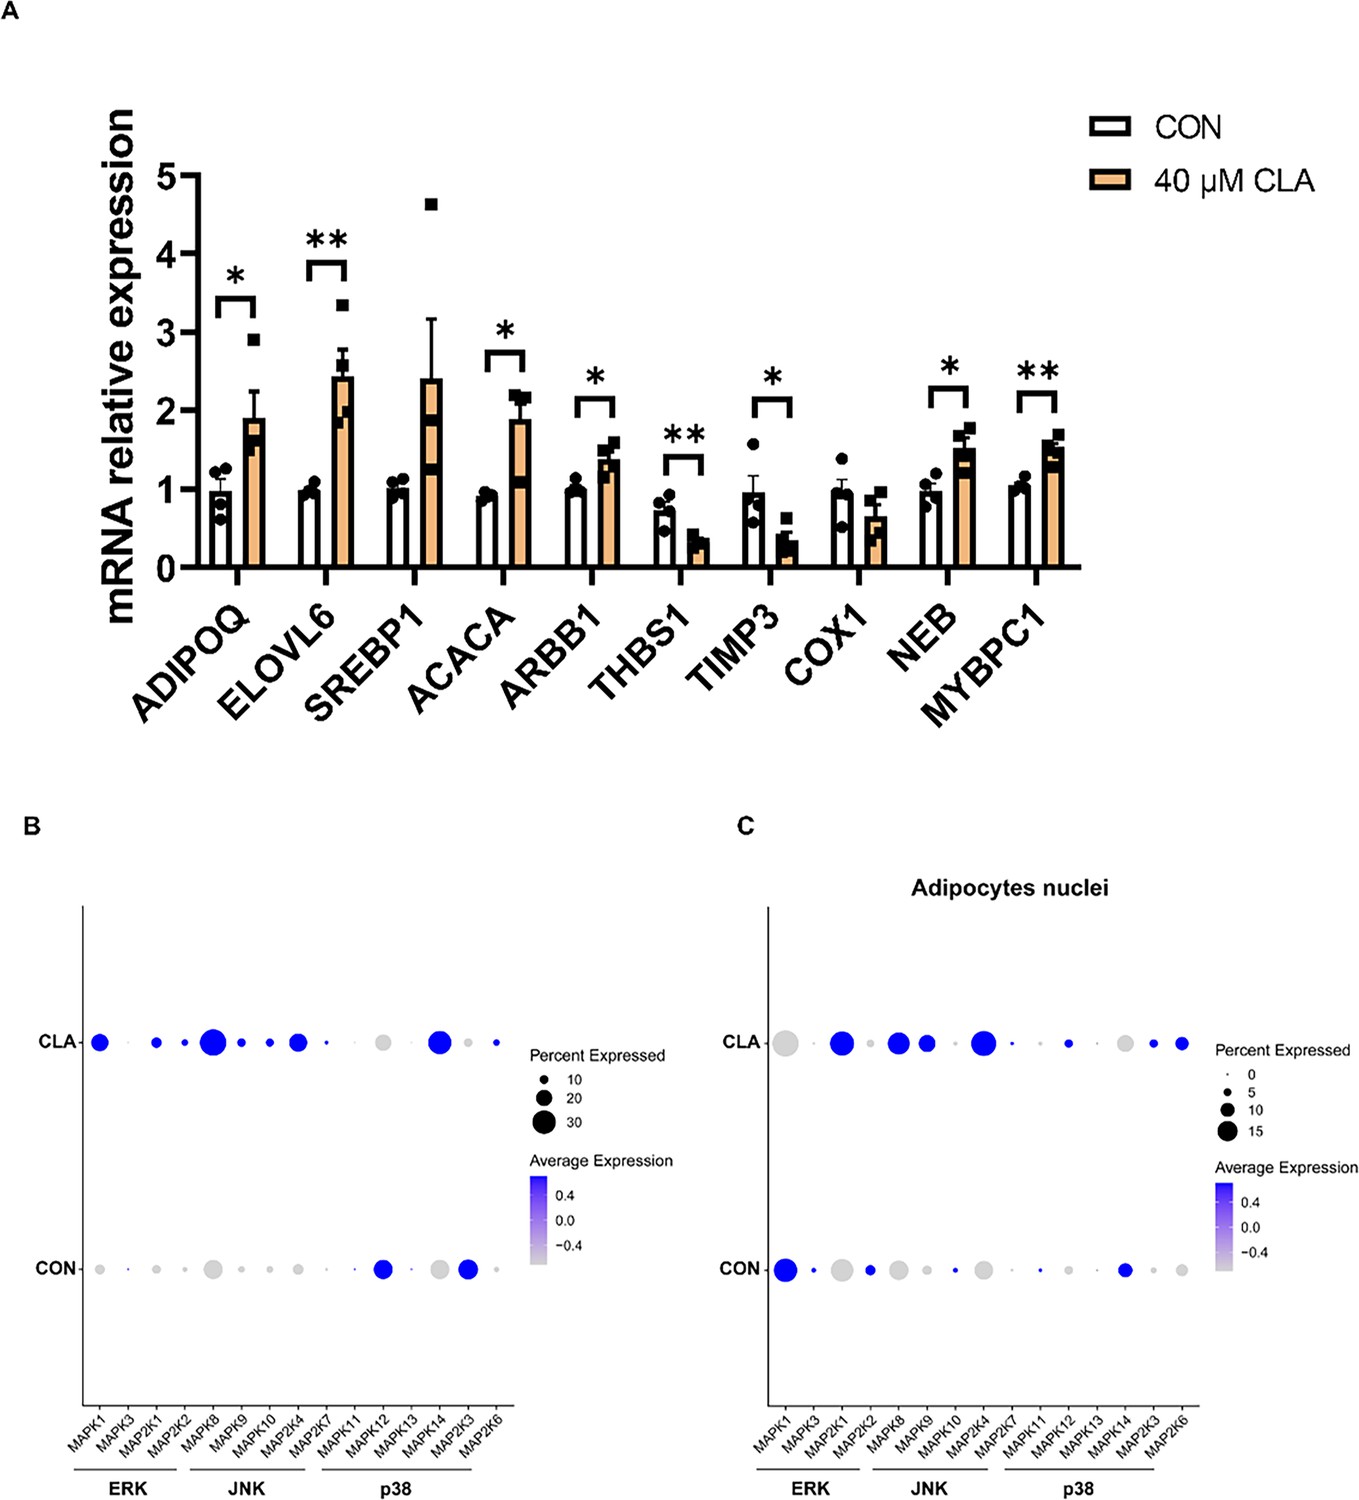
Changes in MAPK signaling pathway in muscle nuclei.
(A) The mRNA expression of marker genes at key points of fibro/adipogenic progenitors (FAPs) differentiation (n=4). (B–C) Dot plot showing the expression of MAPK signaling pathway-related genes after conjugated linoleic acids (CLA) treatment in muscle (B) and adipocytes (C). Error bars represent SEM. *p<0.05, **p<0.01, two-tailed Student’s t-test.
Additional files
-
Supplementary file 1
The primer sequence of quantitative real-time PCR (qPCR).
- https://cdn.elifesciences.org/articles/99790/elife-99790-supp1-v1.docx
-
MDAR checklist
- https://cdn.elifesciences.org/articles/99790/elife-99790-mdarchecklist1-v1.docx
Download links
A two-part list of links to download the article, or parts of the article, in various formats.
Downloads (link to download the article as PDF)
Open citations (links to open the citations from this article in various online reference manager services)
Cite this article (links to download the citations from this article in formats compatible with various reference manager tools)
Single-nucleus transcriptomics reveal the cytological mechanism of conjugated linoleic acids in regulating intramuscular fat deposition
eLife 13:RP99790.
https://doi.org/10.7554/eLife.99790.4


