Emergence of power law distributions in protein-protein interaction networks through study bias
- Biomedical Network Science Lab, Department Artificial Intelligence in Biomedical Engineering, Friedrich-Alexander-Universität Erlangen-Nürnberg, Germany
- Department of Experimental Oncology, IEO European Institute of Oncology IRCCS, Italy
- Department of Computer Science, TU Braunschweig, Germany
- Braunschweig Integrated Centre of Systems Biology (BRICS), Germany
- Data Science in Systems Biology, TUM School of Life Sciences, Technical University of Munich, Germany
- Munich Data Science Institute (MDSI), Technical University of Munich, Germany
Figures
Figure 1
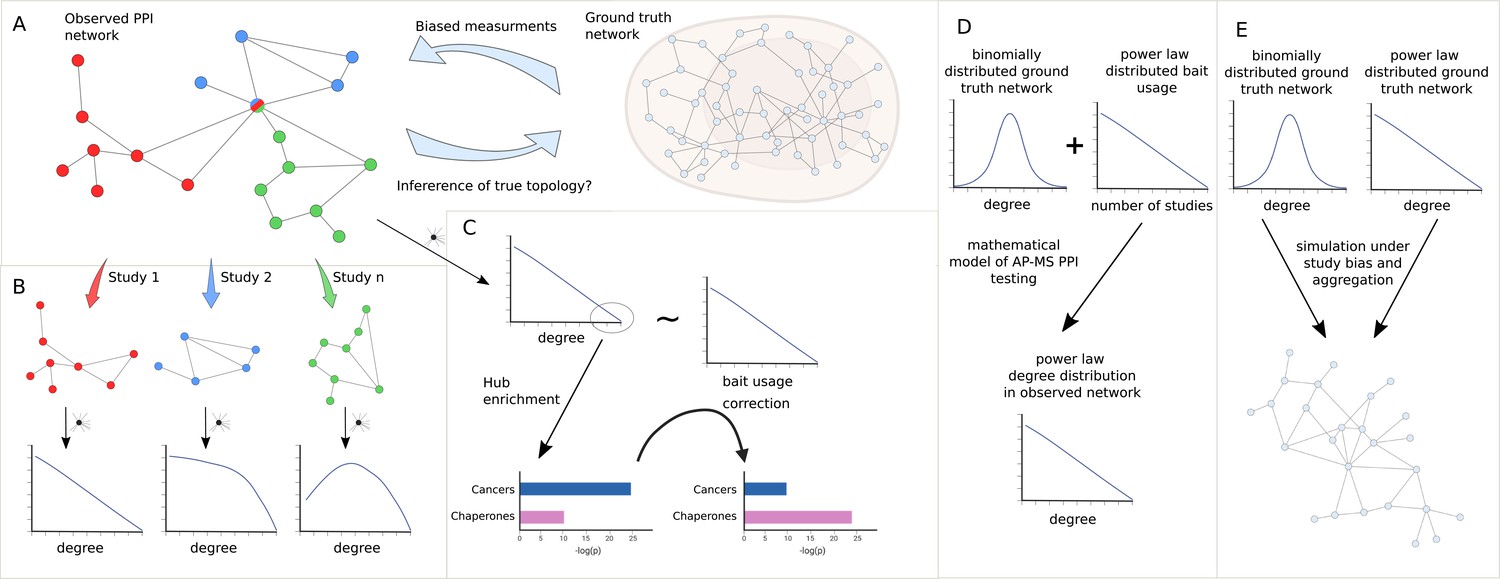
Study overview.
(A) We seek to answer the question of how much we can learn about the topology of ground truth networks from the topology of observed and aggregated protein-protein interaction (PPI) networks and how much-biased measurements might impact the observed power law (PL) degree distribution. (B) To answer this question we decompose aggregated, observed networks into single study-networks and investigate their individual degree distributions. We then ask how much the aggregation process of those single studies into larger networks could explain the PL property of the observed network. (C) We aim to identify true hub proteins by applying different types of normalization strategies, which reveals that disease-associated functions disappear that are likely associated with hub proteins because of their inflated testing frequency due to the study bias. (D) Starting from the empirical observation that bait usage is PL-distributed, we mathematically show that, in such a scenario, a PL-distributed observed PPI network can emerge even if the ground truth is binomially distributed. (E) Finally, we simulated the measurement of observed aggregated PPI networks under study bias from ground truth networks with either PL or binomial degree distribution.
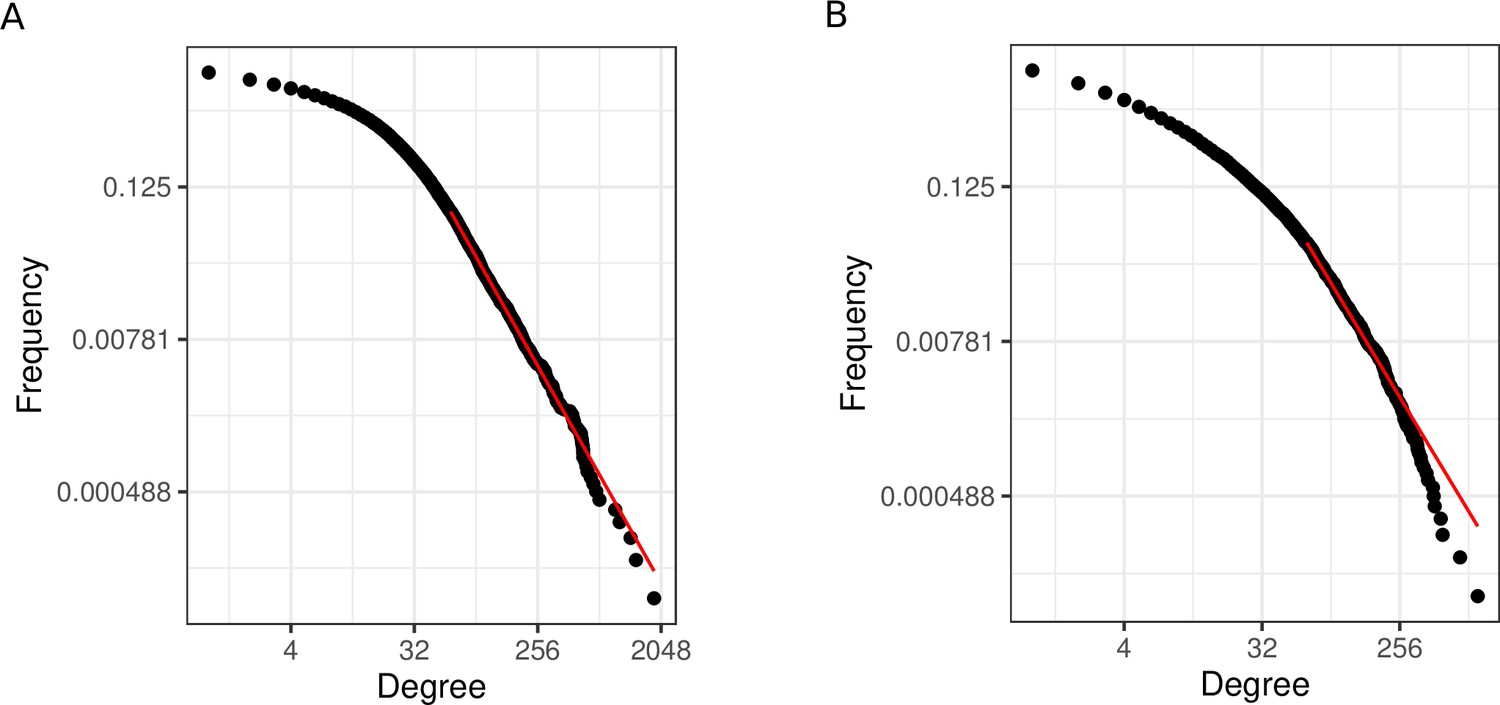
Figure 2 with 1 supplement
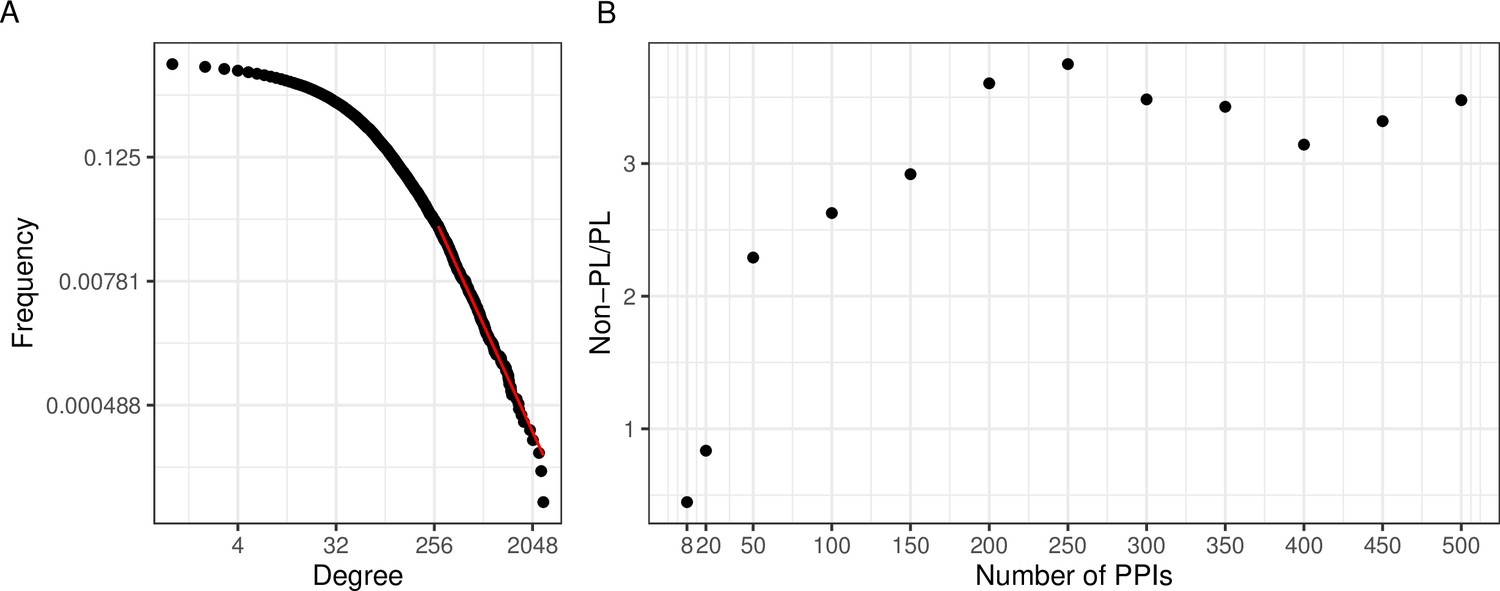
A large aggregated PPI network shows PL behavior while individual studies often do not.
(A) The black dots represent the degree distribution of our aggregated network and the red line corresponds to the fitted power law (PL) distribution with parameters and in a log-log scale. (B) Plot of the ratio between the number of non-PL and PL studies with more than a certain number of protein-protein interactions (PPIs specified in the -axis).
Figure 2—figure supplement 1

Histogram of protein-protein interaction (PPI) number per study in the aggregated network.
Figure 3
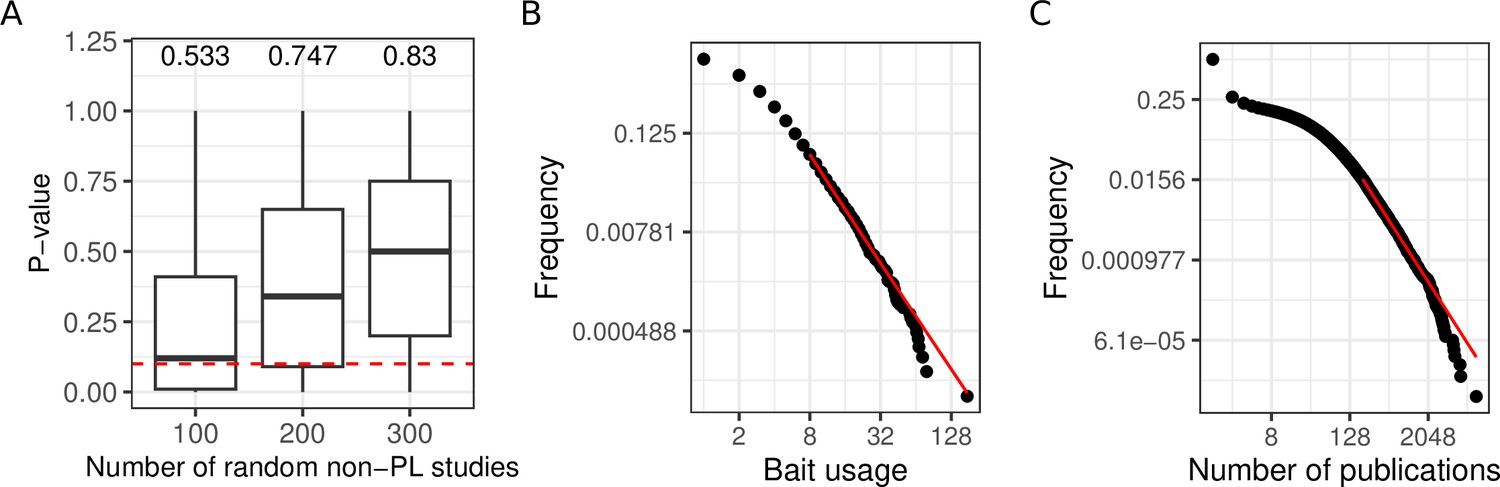
Aggregating more PPI networks increases the mean probability of obtaining a PL fit, potentially due to bait usage and study biases.
(A) Distribution of p-values obtained through the aggregation of 100, 200, and 300 random non-power law (PL) studies. The numbers on the top of each boxplot represent the fraction of PL networks obtained among the 1000 tests. The dotted red line represents the limit of significance (i.e. 0.1); above the line, the PL hypothesis is plausible. (B) The black points correspond to the bait usage distribution and the red line corresponds to the fitted PL distribution (in a log-log scale) with parameters and . (C) The number of publications indexed in PubMed associated with different human genes follows a PL distribution ( and ).
Figure 4

Exemplification of Proposition 1 for an empty ground truth interactome, a small positive error rate, and the real-world bait distribution obtained from IntAct.
The simulated observed degree distribution is power law (PL)-distributed with parameters and .
Figure 5
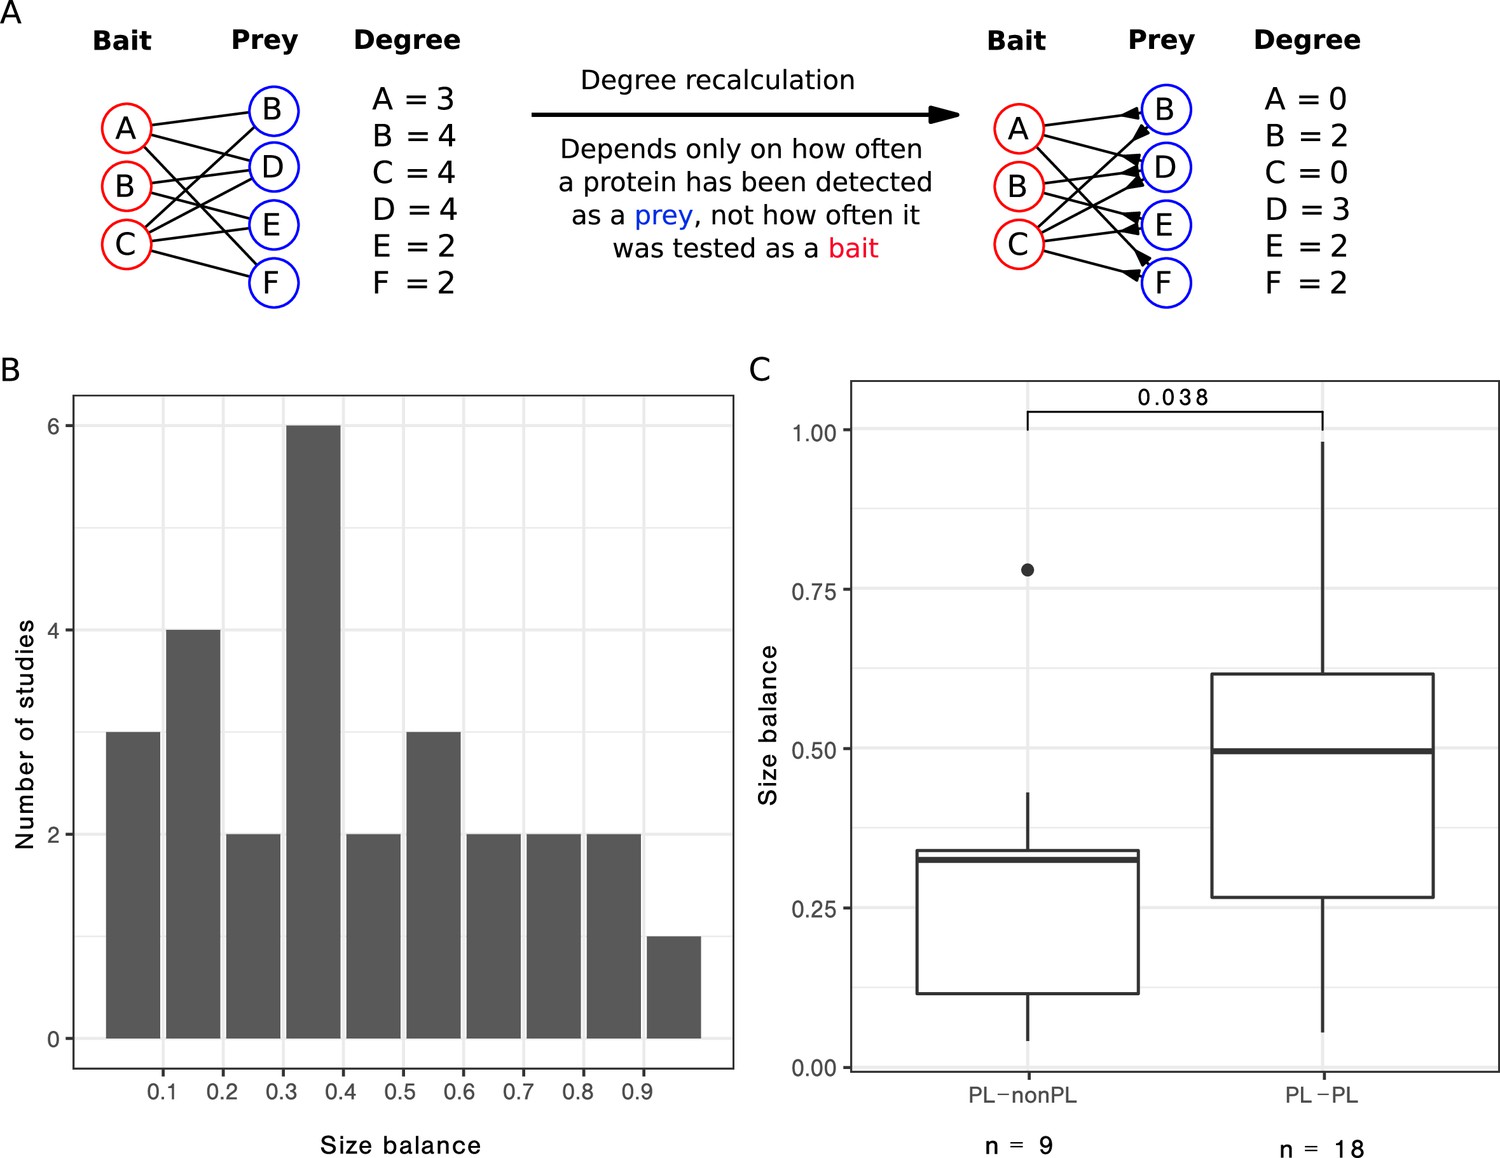
After correcting for bait or prey usage, a third of the PL networks lose the PL property.
(A) Scheme to illustrate how the degree is recalculated when the number of baits is smaller than the number of preys. (B) Distribution of the size balance (ratio between the number of baits and preys, see Equation 2 for details) among the 27 power law (PL) studies. (C) Distribution of the size balance in the nine studies that switch from PL to non-PL and the 18 studies whose degree distributions remain PL-distributed after the correction.
Figure 6 with 3 supplements
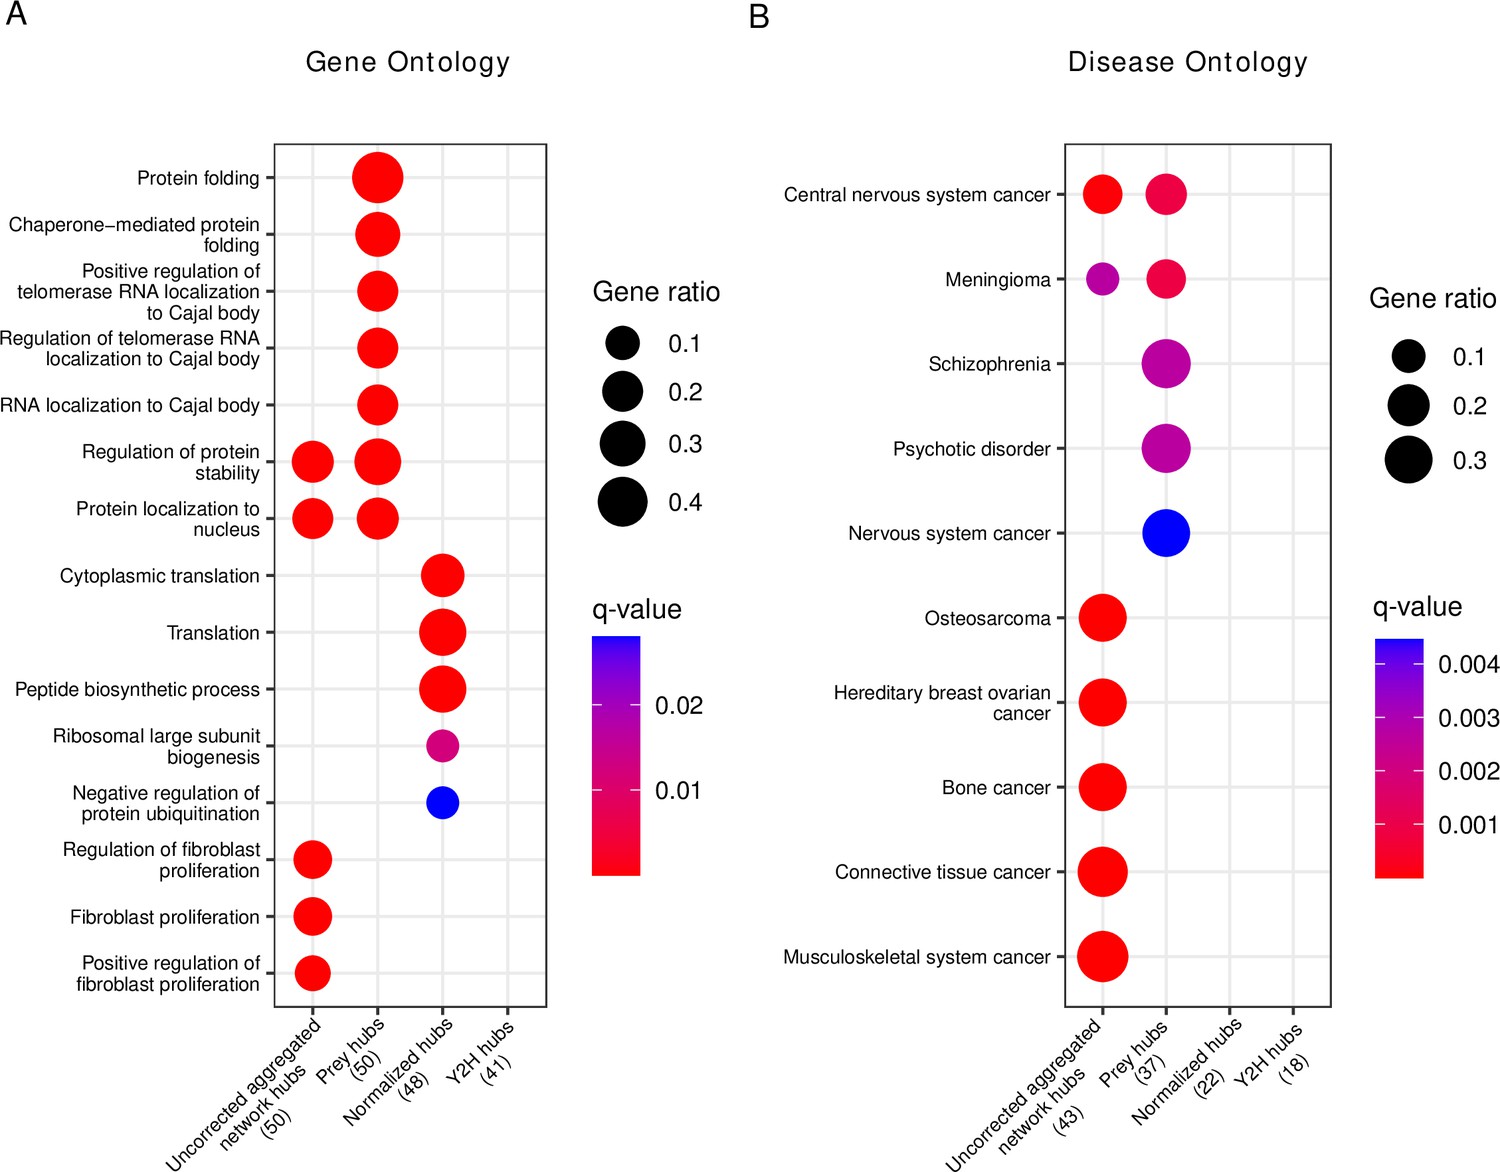
Gene set enrichment analysis of hub proteins after bias correction yields biologically plausible terms that differ from uncorrected analysis.
(A) Gene ontology enrichment analysis of the top 50 corrected (prey hubs, normalized hubs, and Y2H hubs) and non-corrected hubs (uncorrected aggregated network hubs). (B) Disease ontology enrichment analysis of the top 50 corrected and non-corrected hubs. The numbers in parentheses represent the number of hubs included in the reference databases, and the ‘Gene ratio’ represents the fraction of hubs included in the corresponding (gene or disease ontology) term. If a column is empty, it means there are no significant terms.
-
Figure 6—source data 1
Detailed results of gene set enrichment analysis.
- https://cdn.elifesciences.org/articles/99951/elife-99951-fig6-data1-v2.xlsx
Figure 6—figure supplement 1
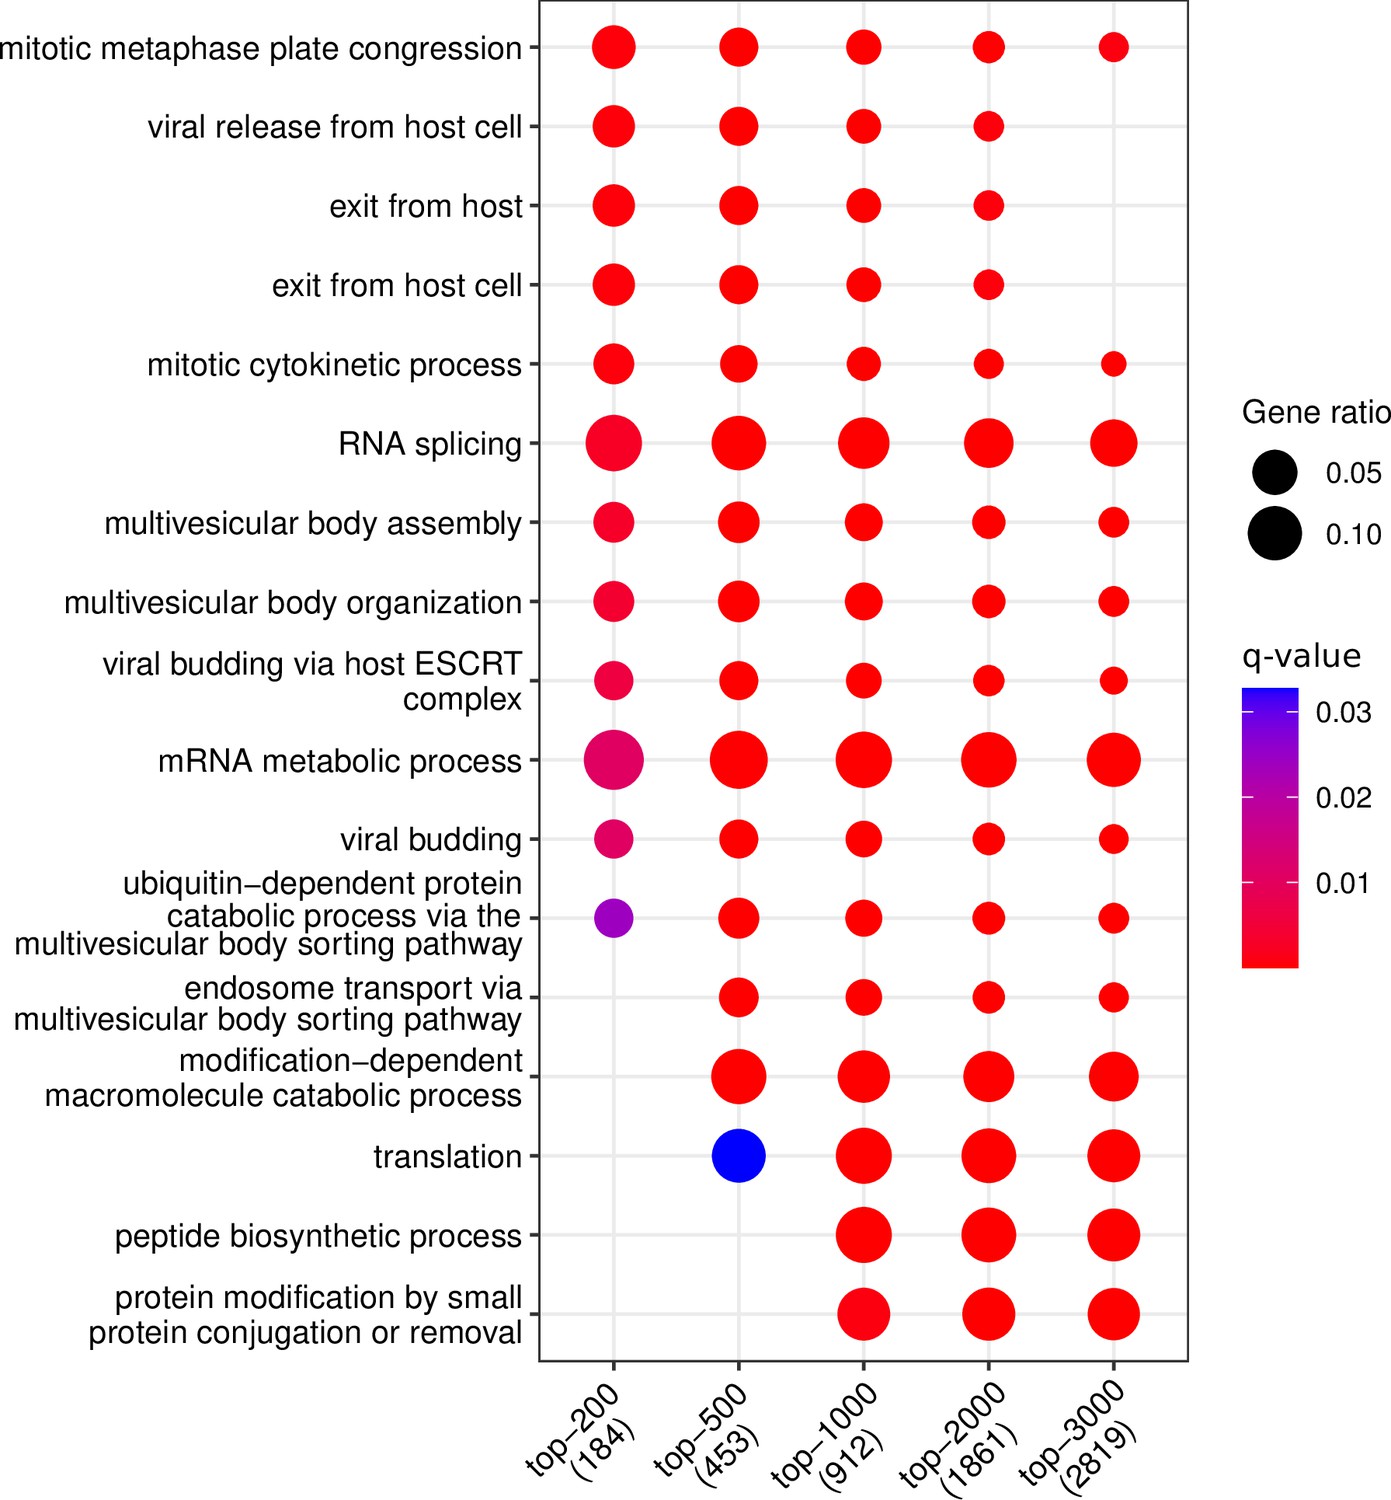
Gene Ontology enrichment analysis results of the top-200, top-500, top-1000, top-2000, and top-3000 most abundant proteins.
Figure 6—figure supplement 2
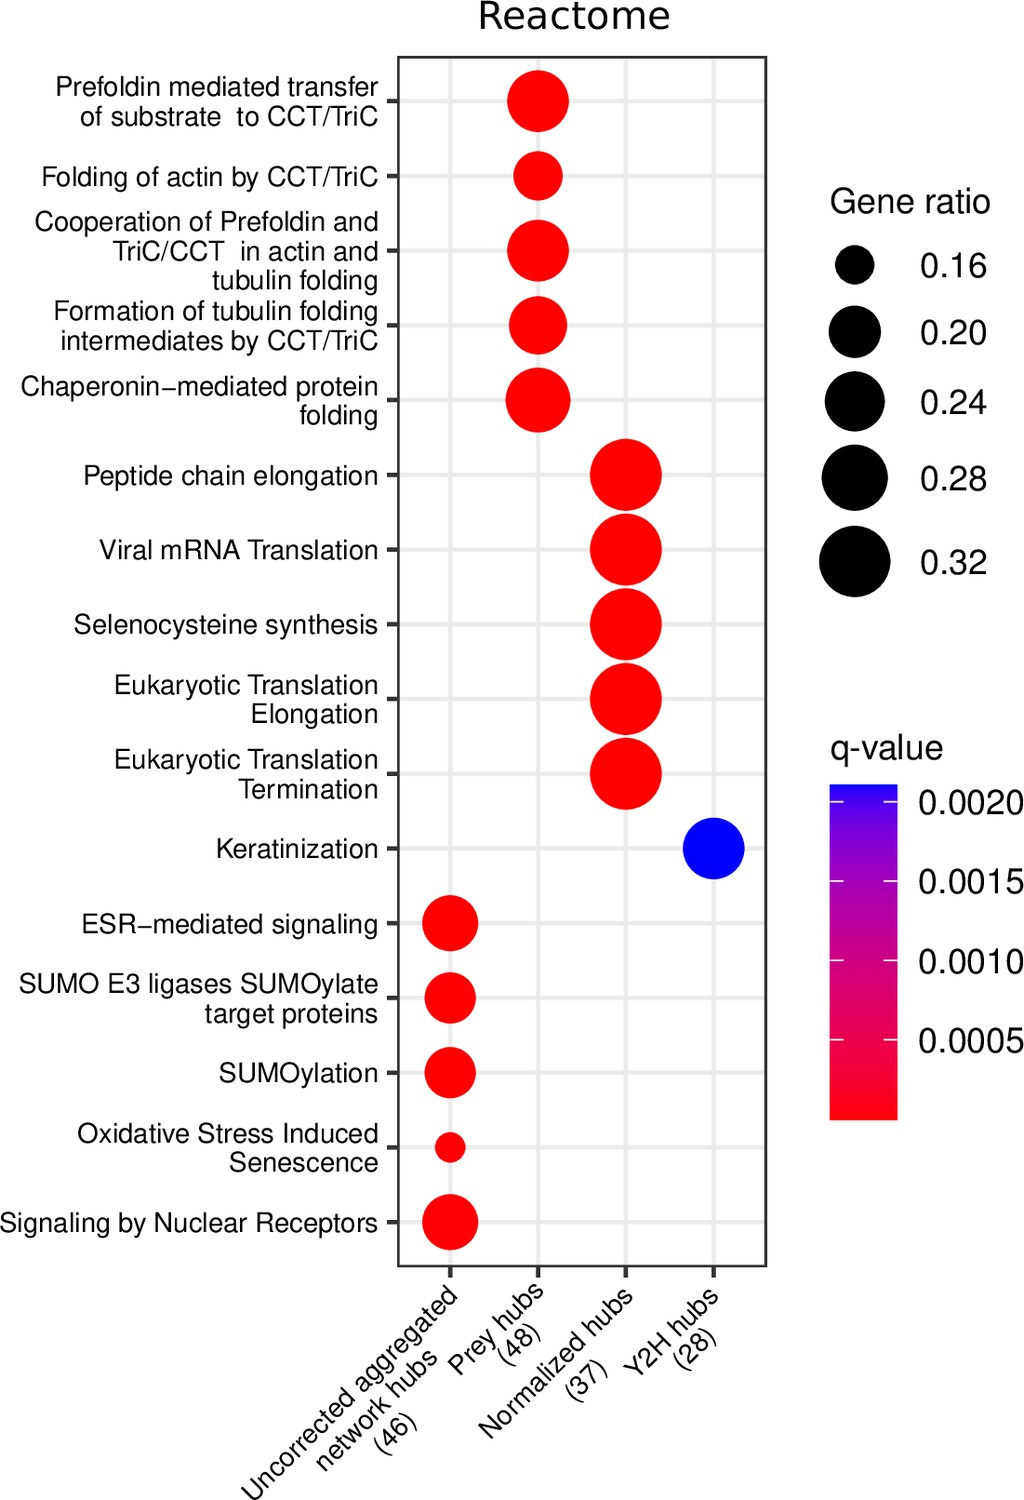
Reactome enrichment analysis of the top 50 corrected and uncorrected hubs.
The numbers in brackets represent the number of hubs included in the reference databases, and the ‘Gene ratio’ represents the fraction of hubs included in the corresponding pathway.
Figure 6—figure supplement 3
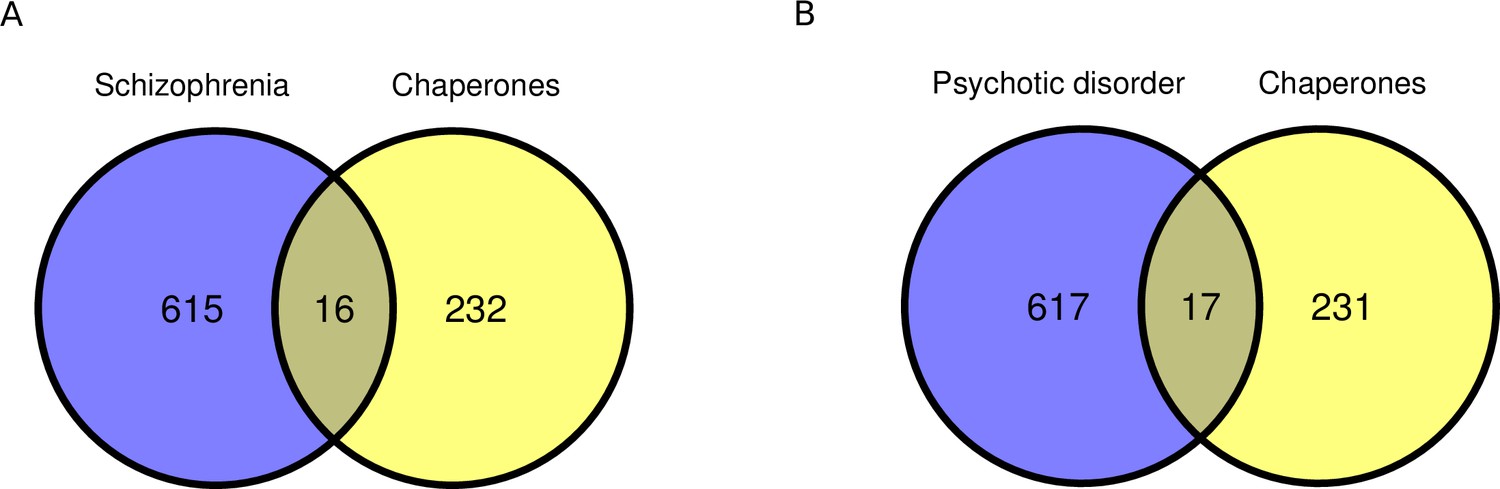
Overlaps between chaperones and genes related with, respectively, schizophrenia and psychotic disorders.
(A) Overlap between schizophrenia-related genes and chaperones (; one-sided Fisher test). (B) Overlap between psychotic disorder-related genes and chaperones (; one-sided Fisher test).
Figure 7
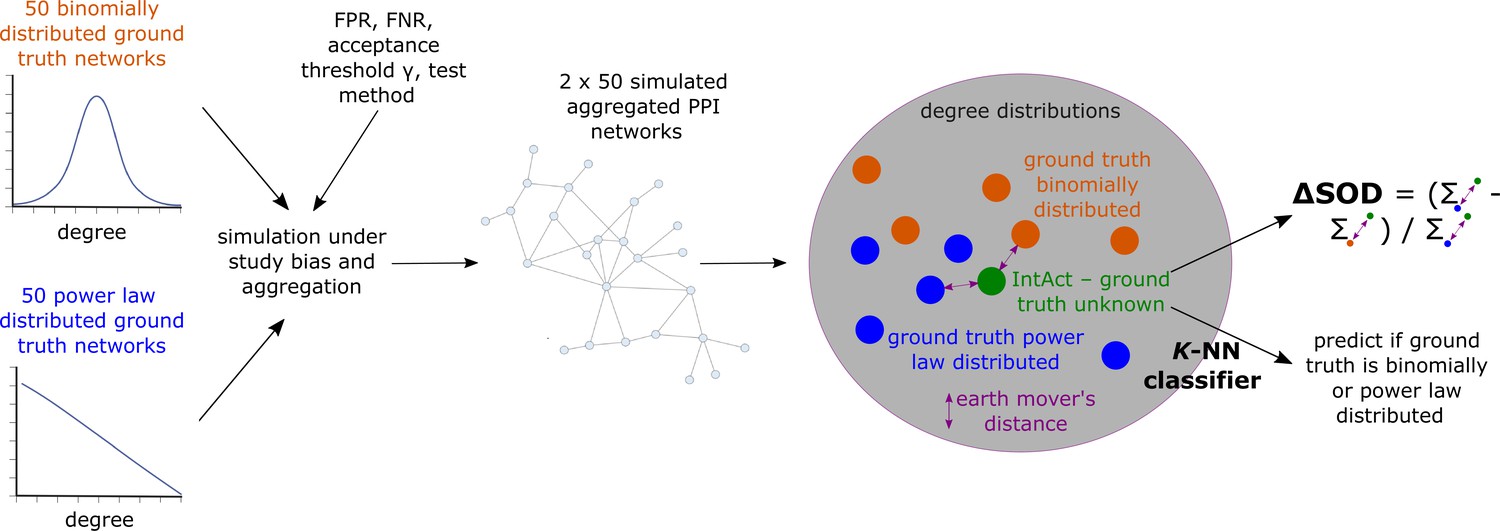
Conceptual overview of simulated aggregated protein-protein interaction (PPI) testing under study bias and downstream analyses to assess if the empirical aggregated PPI network obtained from IntAct is more likely to have emerged from a power law (PL)-distributed than from a binomially distributed true biological interactome.
The colored dots in the gray area represent degree distributions; dissimilarity between degree distributions is quantified using the earth mover’s distance.
Figure 8 with 2 supplements
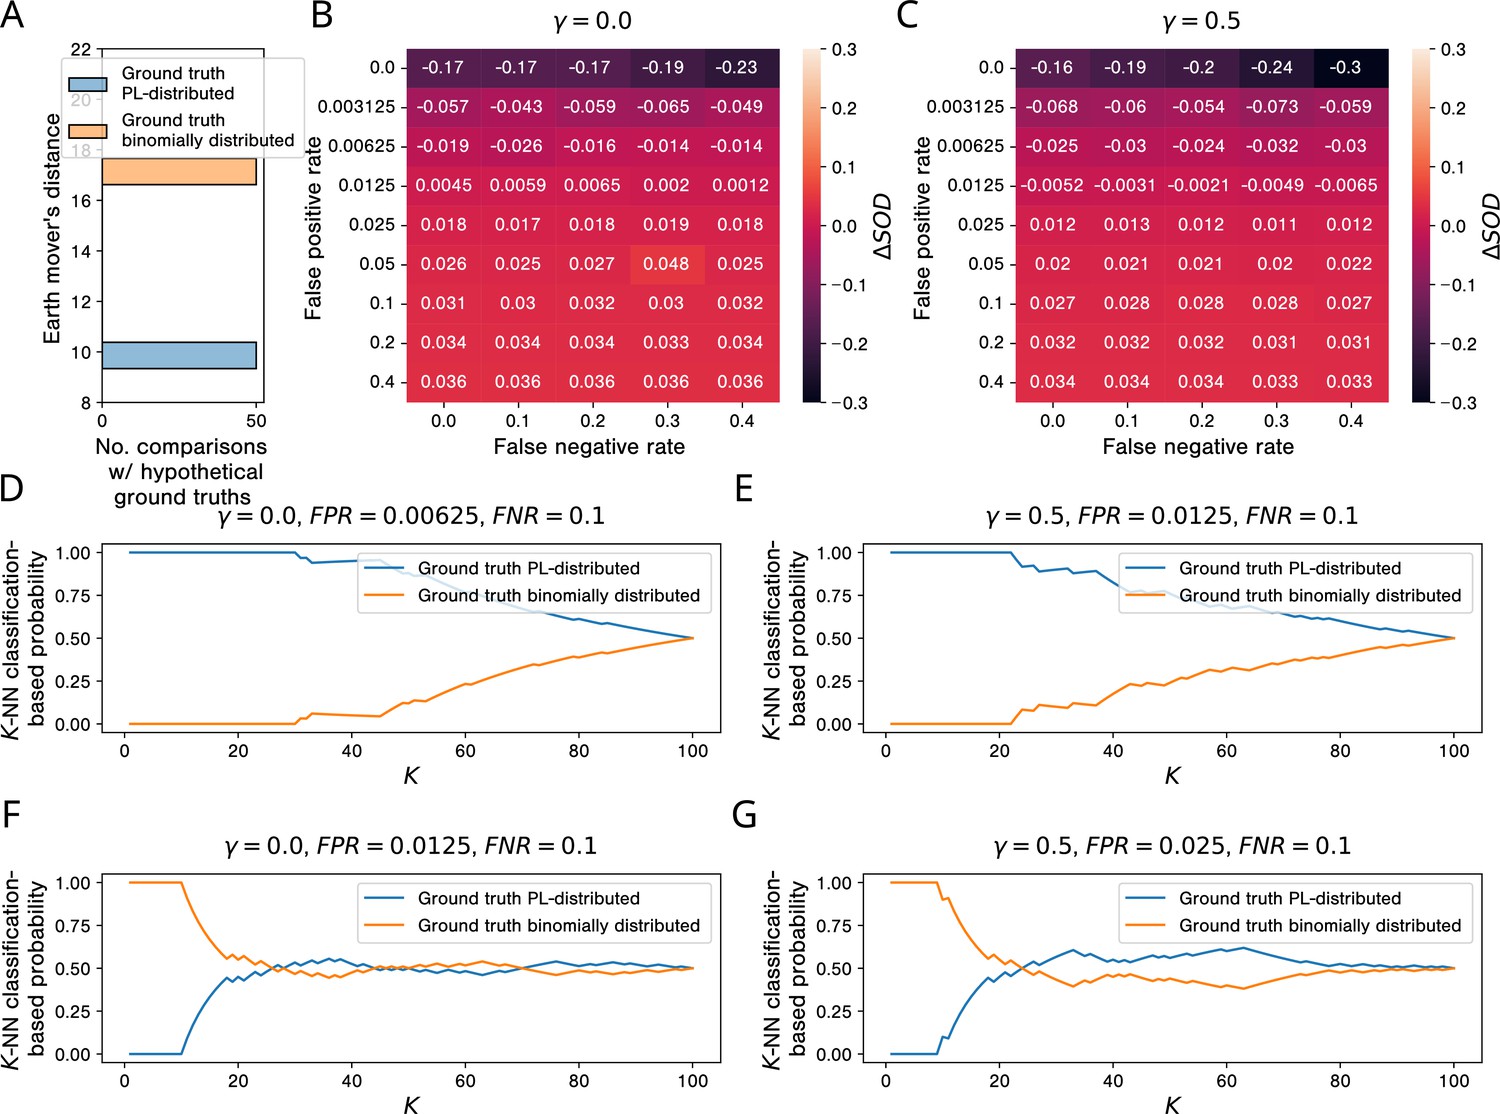
Simulations show that, in the presence of study bias and small non-zero false positive rates in affinity purification-mass spectrometry (AP-MS) studies, binomially and PL-distributed ground truth interactomes are equally likely origins of observed aggregated PPI networks.
(A) Histogram of earth mover’s distances between the degree distribution of the observed protein-protein interaction (PPI) network obtained via aggregation of all AP-MS studies annotated in IntAct and the degree distributions of 50 PL-distributed and 50 binomially distributed hypothetical ground truth networks. (B, C) Signed relative differences between the sum of distances between the degree distribution of and degree distributions of networks simulated from, respectively, power law (PL)-distributed and binomially distributed hypothetical ground truth networks, given different choices of the hyper-parameters FPR, FNR, and . Negative values of indicate that is more similar to simulated networks emerging from PL-distributed hypothetical ground truths; positive values are indicative of the opposite scenario. (D-G) -NN classification-based probabilities that emerged from a PL-distributed or from a binomially distributed ground truth interactome. (D, E) Probabilities just before the tipping points in the false positive rate. (F, G) Probabilities just after the tipping points.
Figure 8—figure supplement 1
Degree distributions of all affinity purification-mass spectrometry (AP-MS) and yeast-2-hybrid (Y2H) studies annotated in IntAct.
(A) Degree distribution for observed protein-protein interaction (PPI) network obtained via aggregation of all AP-MS studies annotated in IntAct. Node degrees are power law (PL)-distributed (). (B) Degree distribution for observed PPI network obtained via aggregation of all Y2H studies annotated in IntAct. Node degrees are not PL-distributed ().
Figure 8—figure supplement 2
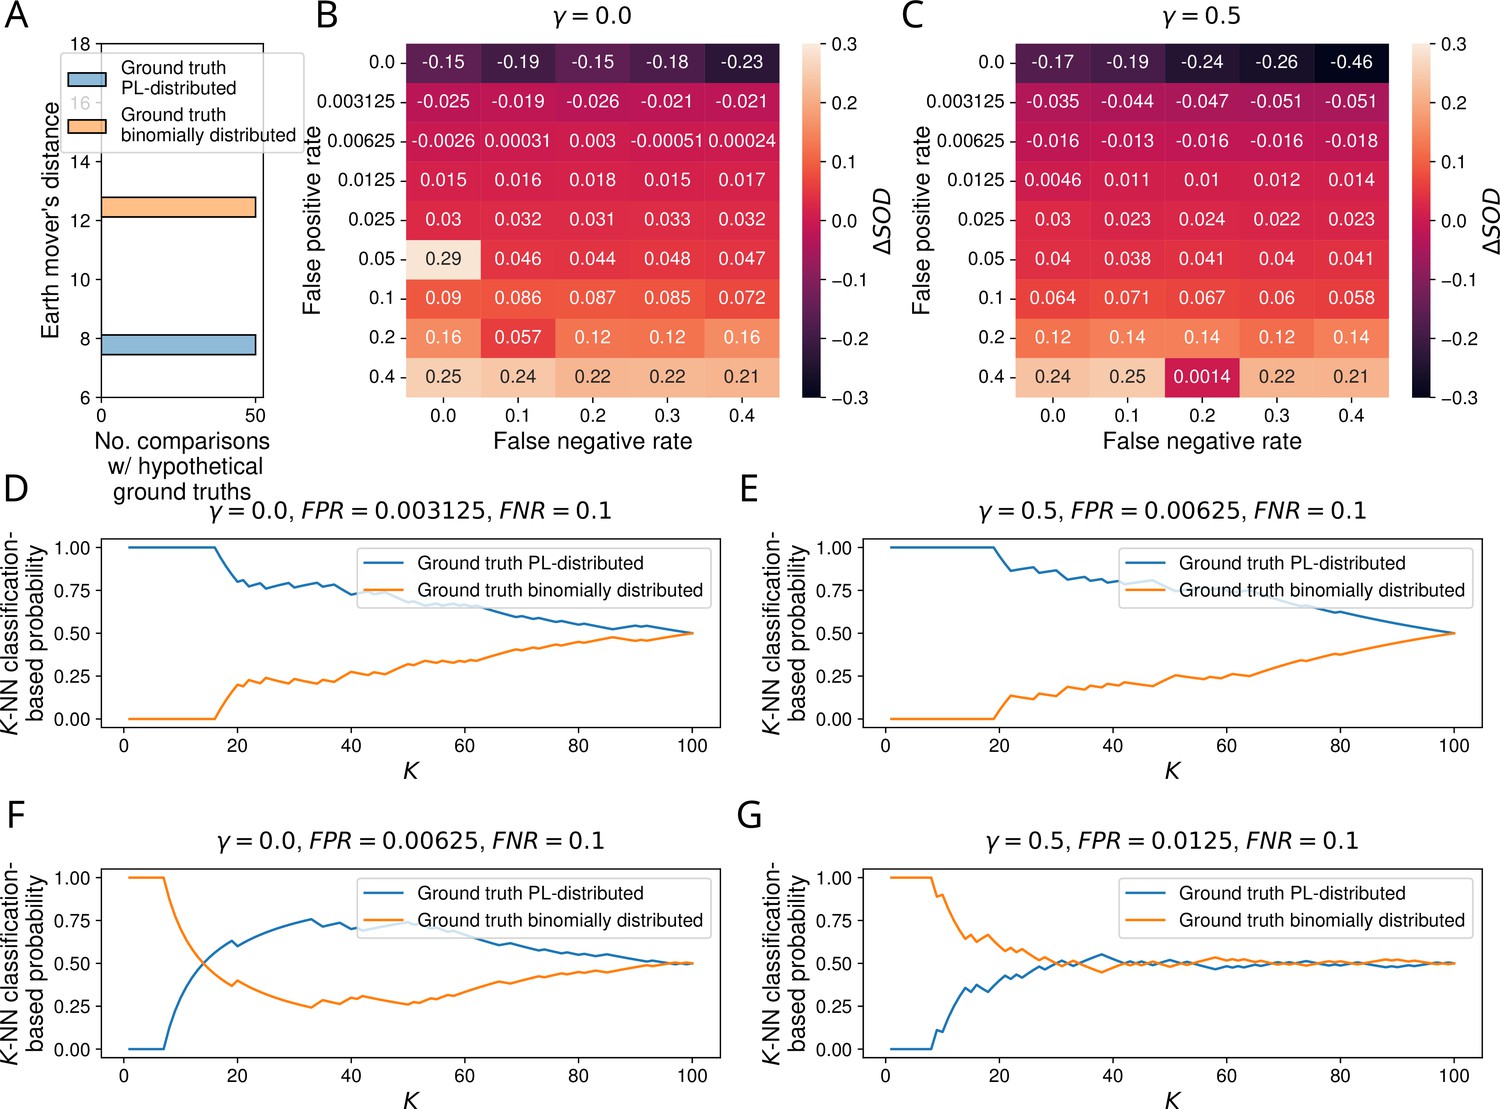
Results of simulation study for yeast-2-hybrid (Y2H) testing.
(A) Histogram of earth mover’s distances between the degree distribution of the observed protein-protein interaction (PPI) network obtained via aggregation of all Y2H studies annotated in IntAct and the degree distributions of 50 PL-distributed and 50 binomially distributed hypothetical ground truth networks. (B, C) Signed relative differences between the sum of distances between the degree distribution of and degree distributions of networks simulated from, respectively, PL-distributed and binomially distributed hypothetical ground truth networks, given different choices of the hyper-parameters FPR, FNR, and. Negative values of indicate that is more similar to simulated networks emerging from PL-distributed hypothetical ground truths; positive values are indicative of the opposite scenario. (D-G) -NN classification-based probabilities that emerged from a PL-distributed or from a binomially distributed ground truth interactome. (D, E) Probabilities just before the tipping points in the false positive rate. (F, G) Probabilities just after the tipping points.
Appendix 1—figure 1
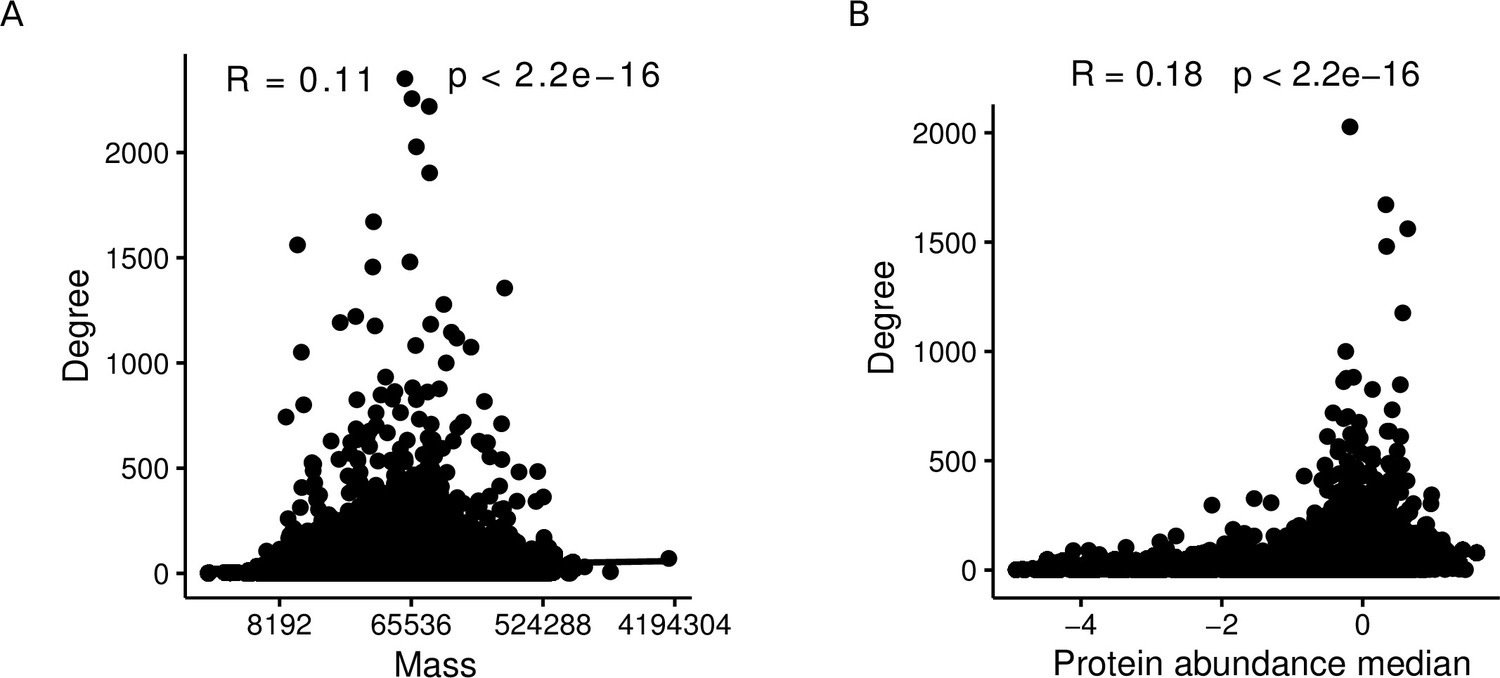
Protein mass and abundance are significantly positively correlated with the node degree in aggregated PPI networks.
(A) Spearman correlation between degree and protein mass within affinity purification-mass spectrometry (AP-MS) studies of the aggregated network. (B) Spearman correlation between degree and protein abundance within AP-MS studies of the aggregated network.
Additional files
Download links
A two-part list of links to download the article, or parts of the article, in various formats.
Downloads (link to download the article as PDF)
Open citations (links to open the citations from this article in various online reference manager services)
Cite this article (links to download the citations from this article in formats compatible with various reference manager tools)
Emergence of power law distributions in protein-protein interaction networks through study bias
eLife 13:e99951.
https://doi.org/10.7554/eLife.99951


