T-box3 is a ciliary protein and regulates stability of the Gli3 transcription factor to control digit number
- University of Utah, United States
- Geisinger Clinic, United States
Abstract
Crucial roles for T-box3 in development are evident by severe limb malformations and other birth defects caused by T-box3 mutations in humans. Mechanisms whereby T-box3 regulates limb development are poorly understood. We discovered requirements for T-box at multiple stages of mouse limb development and distinct molecular functions in different tissue compartments. Early loss of T-box3 disrupts limb initiation, causing limb defects that phenocopy Sonic Hedgehog (Shh) mutants. Later ablation of T-box3 in posterior limb mesenchyme causes digit loss. In contrast, loss of anterior T-box3 results in preaxial polydactyly, as seen with dysfunction of primary cilia or Gli3-repressor. Remarkably, T-box3 is present in primary cilia where it colocalizes with Gli3. T-box3 interacts with Kif7 and is required for normal stoichiometry and function of a Kif7/Sufu complex that regulates Gli3 stability and processing. Thus, T-box3 controls digit number upstream of Shh-dependent (posterior mesenchyme) and Shh-independent, cilium-based (anterior mesenchyme) Hedgehog pathway function.
https://doi.org/10.7554/eLife.07897.001eLife digest
Mutations in the gene that encodes a protein called T-box3 cause serious birth defects, including deformities of the hands and feet, via poorly understood mechanisms. Several other proteins are also important for ensuring that limbs develop correctly. These include the Sonic Hedgehog protein, which controls a signaling pathway that determines whether a protein called Gli3 is converted into its “repressor” form. The hair-like structures called primary cilia that sit on the surface of animal cells also contain Gli3, and processes within these structures control the production of the Gli3-repressor.
Emechebe, Kumar et al. have now studied genetically engineered mice in which the production of the T-box3 protein was stopped at different stages of mouse development. This revealed that turning off T-box3 production early in development causes many parts of the limb not to form. This type of defect appears to be the same as that seen in mice that lack the Sonic Hedgehog protein.
If the production of T-box3 is turned off later in mouse development in the rear portion of the developing limb, the limb starts to develop but doesn’t develop enough rear toes. When T-box3 production is turned off in the front portion of the developing limbs, mice are born with too many front toes. This latter problem mimics the effects seen in mice that are unable to produce Gli3-repressor or that have defective primary cilia.
Further investigation unexpectedly revealed that T-box3 is found in primary cilia and localizes to the same regions of the cilia as the Gli3-repressor. Furthermore, T-box3 also interacts with a protein complex that controls the stability of Gli3 and processes it into the Gli3-repressor form.
In the future, it will be important to determine how T-box3 controls the stability of Gli3 and whether that process occurs in the primary cilia or in other parts of the cell where T-box3 and Gli3 coexist, such as the nucleus. This could help us understand how T-box3 and Sonic Hedgehog signaling contribute to other aspects of development and to certain types of cancer.
https://doi.org/10.7554/eLife.07897.002Introduction
The T-box gene family encodes transcription factors that play critical roles during embryonic development, organogenesis, and tissue homeostasis. Mutations in TBX genes in humans cause multiple developmental dysmorphic syndromes and disease predispositions (Naiche et al., 2005; Showell et al., 2004). Heterozygous mutation of TBX3 causes Ulnar-mammary syndrome (UMS), initially described as a constellation of congenital limb defects, apocrine and mammary gland hypoplasia, and genital abnormalities (Pallister et al., 1976). Recently, heart and conduction system defects have also been described in mice and humans with abnormal Tbx3 (mice) and TBX3 (humans) function (Bakker et al., 2008; Frank et al., 2012; Linden et al., 2009; Meneghini et al., 2006; Mesbah et al., 2008). Germline deletion of Tbx3 in mice results in embryonic lethality with heart, limb, and mammary defects (Davenport et al., 2003; Frank et al., 2012; 2013). Tbx3 also regulates pluripotency and cell fate in early development (Cheng et al., 2012; Han et al., 2010; Kartikasari et al., 2013; Niwa et al., 2009; Weidgang et al., 2013).
TBX3 transcriptional repression controls expression of cell proliferation and senescence factors (Brummelkamp et al., 2002; Kumar et al., 2014a); abnormal TBX3 expression occurs in multiple cancers (Liu et al., 2011; Lu et al., 2010; Peres and Prince, 2013). TBX3 also regulates splicing and RNA metabolism (Kumar et al., 2014b). Although these studies highlight the important pleiotropic molecular functions of TBX3, little is known about the core pathways it regulates in developing structures that require its function, such as the developing limb.
UMS limb phenotypes are variable ranging in severity from hypoplasia of digit 5 to complete absence of forearm and hand (OMIM #181450). Mouse Tbx3tm1Pa/tm1Pa (Davenport et al., 2003) and Tbx3Δfl/Δfl (Frank et al., 2013) mutant forelimbs lack posterior digits and the ulna. Hindlimbs of Tbx3tm1Pa/tm1Pa and Tbx3Δfl/Δfl null mutants have only a single digit, but Tbx3Δfl/Δfl mutants also have pelvic defects (Frank et al., 2013). Embryonic lethality of both types of mutants has prevented elucidation of Tbx3’s limb-specific roles.
The Hedgehog pathway is a key regulator of limb development. Shh signaling in posterior mesenchyme promotes digit development and prevents processing of full length Gli3 (Gli3FL) to its repressor form, Gli3R, which constrains digit number (Litingtung et al., 2002). The balance of Gli transcriptional activation and repression is critical for proper digit number and patterning (Cao et al., 2013; Hill et al., 2007; Litingtung et al., 2002; te Welscher et al., 2002; Wang et al., 2000; 2007a; Zhulyn et al., 2014). In mammals, the limited, partial proteolytic processing of Gli3FL to Gli3R requires functional primary cilia, the ciliary protein Kif7 (Goetz and Anderson, 2010; Liu et al., 2005), as well as balanced activity of Sufu and the ubiquitin ligase adaptors βTrCP and Spop (Chen et al., 2009; Wang and Li, 2006; Wang et al., 2010; Wen et al., 2010)
In this study, conditional ablation of Tbx3 reveals discrete roles for Tbx3 during limb initiation and compartment-specific functions during later limb development to regulate digit number. We discovered a novel molecular function of Tbx3 in the primary cilia where it interacts directly with Kif7 and is in a complex with Gli3. Loss of Tbx3 decreases Kif7-Sufu interactions, resulting in excess Gli3 proteolysis and decreased levels of both Gli3FL and Gli3R. The resulting preaxial polydactyly phenocopies limb defects seen in Gli3 null heterozygotes and in mutants with abnormal structure or function of the primary cilia (Cheung et al., 2009; Endoh-Yamagami et al., 2009; Goetz and Anderson, 2010; Haycraft et al., 2005; Liem et al., 2009; Liu et al., 2005; Ocbina et al., 2011; Putoux et al., 2011). Our findings reveal a novel mechanism where Tbx3 in the anterior mesenchyme is required for proper function of the Kif7/Sufu complex that regulates Gli3 stability and processing.
Results
Loss of Tbx3 in the limb bud mesenchyme results in preaxial polydactyly and postaxial oligodactyly
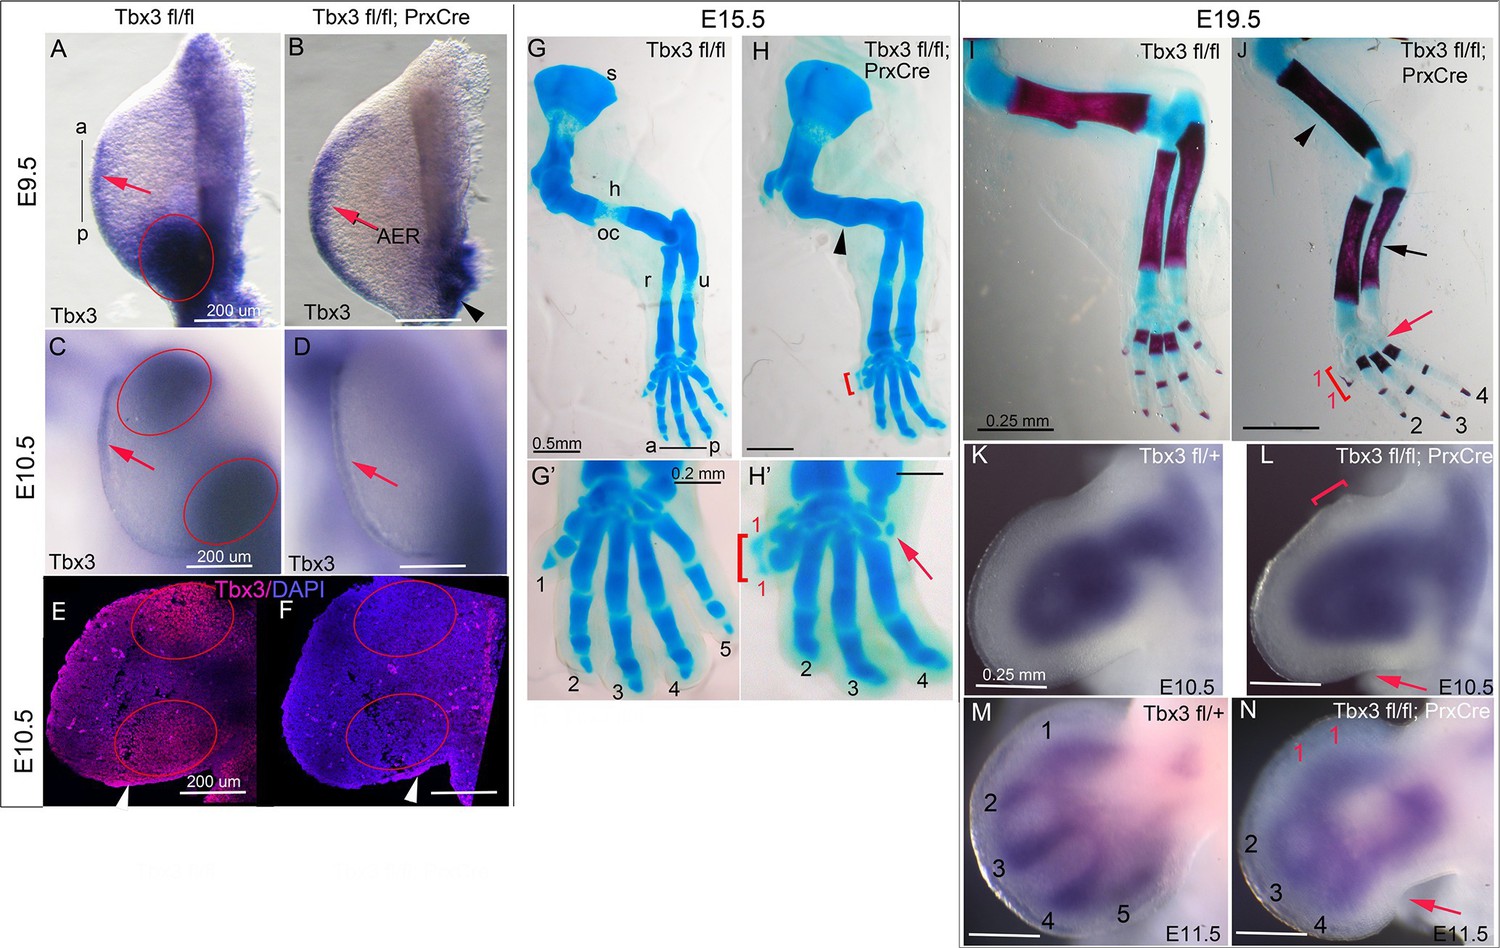
Tbx3 is expressed in discrete anterior and posterior mesenchymal domains in the limb buds from embryonic day (E) 9.5 (Figure 1A,C,E, Figure 1—figure supplement 1). To assess the role of these domains during limb development, we generated conditional mutants using our Tbx3flox allele (Frank et al., 2012; 2013) and the Prx1Cre transgene (Logan et al., 2002) (genotype Tbx3flox/flox;Prx1Cre, henceforth referred to in the text as Tbx3;PrxCre mutants). This driver initiates Cre activity at ~14-somite stage (ss) in the forelimb-forming region of the lateral plate mesoderm (LPM) (Hasson et al., 2007). Its activity in the hindlimb is irregular, so our analysis focuses on the forelimb. In situ hybridization and immunohistochemistry confirm complete ablation of Tbx3 mRNA and protein in Tbx3;PrxCre mutant forelimb mesenchyme by E9.5 (Figure 1B–F, Figure 1—figure supplement 1). Expression in the apical ectodermal ridge (AER) is preserved (Figure 1B,D,F). We previously reported the specificity of the custom anti-Tbx3 antibody used here and loss of limb mesenchymal protein production in Tbx3;PrxCre mutant forelimbs (Frank et al., 2012; 2013).
Figure 1 with 2 supplements see all
Tbx3 regulates anterior and posterior digit development.
(A) Tbx3 expression assayed by mRNA in situ hybridization in E9.5 forelimb bud (black line from a-p shows anterior-posterior axis). Red arrow points to Tbx3 expression in apical ectodermal ridge (AER). Red ellipse encloses posterior mesenchymal expression domain. (B) Tbx3 transcripts are absent in the limb bud mesenchyme of E9.5 Tbx3fl/fl;PrxCre mutants. Tbx3 expression persists in the AER (red arrow) and adjacent posterior-lateral body wall (black arrowhead). (C, D) As in A and B except limb buds are E10.5. Red ellipses enclose anterior and posterior mesenchymal expression domains which are Tbx3 negative in the mutants. Red arrows highlight expression in AER. (E, F) Tbx3 immunohistochemistry on sectioned E10.5 limb. Tbx3 protein is lost in mesenchyme of Tbx3fl/fl;PrxCre mutants (F, red ellipses) but AER staining persists as expected (white arrowhead). Please see also Figure 1—figure supplement 1. (G–J) Skeleton preparations reveal preaxial polysyndactyly (duplicated/fused digit 1,red bracket, H, H’, J) and postaxial oligodactyly (absent digit 5, red arrows in H’ and J) in Tbx3fl/fl;PrxCre mutants at E15.5 (H, H’) and E19.5 (J). Note delayed ossification of the humerus (H, black arrowhead), loss of deltoid tuberosity (J, black arrowhead) and short, bowed ulna (J, black arrow) in mutant. s, scapula; h, humerus; oc, ossification center; dt, deltoid tuberosity r, radius; u, ulna; digits numbered 1–5 (K–N) Sox9 mRNA expression shows evolving skeletal defects are already evident in Tbx3fl/fl;PrxCre mutants at E10.5- E11.5. Digit condensations are numbered. Bracket in L shows broadening of digit 1 forming region; red arrows highlight indentation in digit 5 forming region (L, N) and absence of Sox9 digit 5 condensation (N).
Unlike mid-gestational lethality seen in constitutive Tbx3 mutants (Davenport et al., 2003; Frank et al., 2013), Tbx3;PrxCre mutants survive to adulthood with forelimb defects (Video 1): 100% have bilateral preaxial polysyndactyly of digit 1 (called PPD1 in humans [Materna-Kiryluk et al., 2013]), and 70% lack digit 5 (Figure 1G–J). Loss of digit 5 was bilateral in 6/18 and in the remaining, only affected the left forelimb (Table 1). This is not due to asymmetric activity of PrxCre because it is also observed in Tbx3Δfl/Δfl mutants (Δfl = recombined floxed conditional allele) where no Cre activity is involved (Frank et al., 2013). Delayed ossification of the humerus (Figure 1H) and loss of the deltoid tuberosity (Figure 1J) were also observed. Abnormal limb bud morphology is evident by E10.5 (Figure 1L) and evolving skeletal defects at E11.5 by the altered pattern of Sox9 expression (Figure 1N).
Table 1
Increased severity of left limb defects in Tbx3;PrxCre mutants.
| Skeletal phenotypes: E13.5-adult | |||
|---|---|---|---|
| Loss of digit 5 | Bilateral | Left only | Right only |
| Tbx3 fl/+ or fl/fl | 0 | 0 | 0 |
| Tbx3fl/fl;PrxCre | 6 | 12 | 0 |
| Molecular phenotypes: gene expression | |||
|---|---|---|---|
| Expression pattern or level | Left = Right | Left >Right | Right > Left |
| Tbx3 fl/+ or f/fl | control | control | control |
| Tbx3fl/fl;PrxCre | 19 | 30 | 1 |
Video 1
Adult Tbx3;PrxCre mutant mouse is healthy and mobile despite forelimb deformities.
https://doi.org/10.7554/eLife.07897.007Tbx3;PrxCre mutant limb defects are less severe than constitutive nulls
Germline Tbx3 null mutants (genotype Tbx3Δfl/Δfl) have more severe forelimb defects than Tbx3;PrxCre conditional mutants: of the few Tbx3Δfl/Δfl mutants that survive to E13.5, 100% have agenesis of the ulna and digits 3–5 (Figure 1—figure supplement 2B). Their hindlimbs have a single digit and no fibula (Frank et al., 2013), phenocopying Shh and Hand2 null mutants (Galli et al., 2010). Variable timing of Tbx3 loss of function by PrxCre may account for the disparate forelimb phenotypes of Tbx3Δfl/Δfl and Tbx3;PrxCre mutants, however, our skeletal data and phenotypes of Tbx3Δfl/fl;PrxCre mutants indicate that such variability manifests as incomplete penetrance of the ulnar and digit 5 defects (Figure 1 H, H',J, and Colesanto et al., in preparation).
The AER is a critical signaling center, and Tbx3 expression is preserved in the AER of Tbx3;PrxCre mutants (Figure 1B,D,F; Figure 1—figure supplement 1, Frank et al., 2013). We tested whether AER Tbx3 has a required function using two Cre drivers: RarbCre (active in AER and mesenchyme from E9.0 [Moon and Capecchi, 2000]), and a novel Fgf8mcm allele, which produces tamoxifen-inducible Cre in Fgf8 expression domains (Moon et al., in preparation). Tamoxifen induction at E8.5 induces robust Cre activity in the AER in RosaLacZ/+;Fgf8mcm/+ embryos (Figure 1—figure supplement 2E,F) and ablates Tbx3 from forelimb AER by at least E9.5 (Figure 1—figure supplement 2G–J). Tbx3fl/fl;Fgf8mcm/mcm mutants have normal limbs (Figure 1—figure supplement 2L) and phenotypes of Tbx3fl/fl;PrxCre and Tbx3fl/fl;RarbCre are indistinguishable (Figure 1—figure supplement 2D versus N). The results with both Cre drivers indicate that the severe phenotypes of Tbx3Δfl/Δfl mutants are not due to a required function of Tbx3 in the AER.
Tbx3 is required for normal limb bud initiation and Tbx5 expression in the LPM
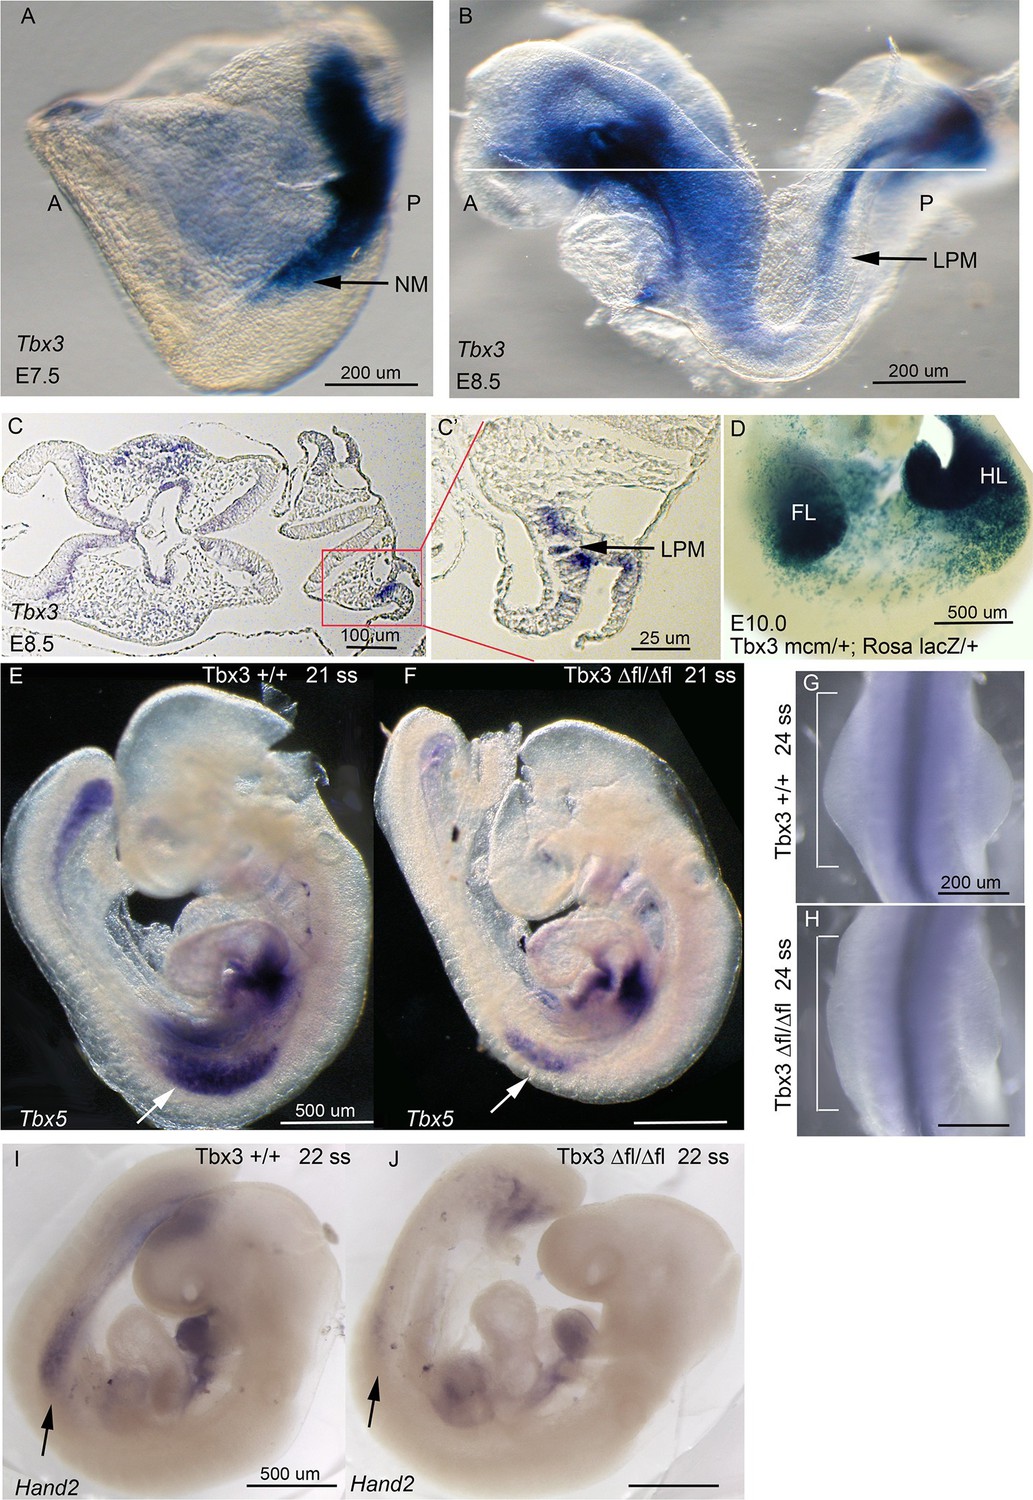
We next tested whether discrepant forelimb phenotypes in Tbx3Δfl/Δfl and Tbx3;PrxCre mutants reflect a role for Tbx3 in an earlier expression domain than affected by RarbCre or PrxCre. Limb initiation in the LPM requires Tbx5 expression in the prospective forelimb territory as early as the 8ss (Minguillon et al., 2005), upstream of Hand2 (Agarwal et al., 2003). Tbx3 is expressed in the LPM from E7.5 (Figure 2A–C’). Lineage tracing with a novel Tbx3mcm allele (Thomas et al., in preparation) revealed that Tbx3-expressing progenitors in the LPM at E8-8.5 give rise to most E10 forelimb mesenchyme in Tbx3mcm/+;RosaLacZ/+ embryos (Figure 2D). Consistent with a role for Tbx3 in limb initiation, Tbx3Δfl/Δfl mutants have decreased LPM expression of Tbx5 (Figure 2E,F), visible defects in forelimb initiation and early limb bud morphology (Figure 2G,H), and disrupted expression of Hand2 (Figure 2I,J). In contrast, early stage Tbx5 expression and limb bud initiation are unaffected in Tbx3;PrxCre mutants (Figure 2—figure supplement 1B,B')
Figure 2 with 1 supplement see all
Tbx3 is required for normal limb bud initiation.
(A, B) Tbx3 expression at E7.5 (A) and E8.5 (B). Anterior on left (A), posterior on right (P). NM (black arrow) indicates nascent mesoderm exiting primitive streak in panel A. (C, C’) Tbx3 expression in the LPM (black arrow) of sectioned E8.5 embryo. Plane of section indicated by line in B. Panel D is magnification of red-boxed area in C. (D) X-gal stained E10.0 Tbx3MCM/+; Rosa LacZ/+ embryo after Cre induction at E8.5. FL, forelimb; HL, hindlimb. (E, F) 21 somite stage (ss) embryos assayed for Tbx5 mRNA. White arrows denote forelimb bud. Left sided view. (G, H) Dorsal view of budding forelimbs of 24 ss embryo forelimbs (neural tube stained for Shh expression). Note abnormal shape and size of Tbx3Δfl/Δfl mutant forelimb buds indicative of disrupted initiation; white brackets are of equal size in both panels. (I, J) 22 ss embryos assayed for Hand2 expression. Black arrows denote emerging forelimb bud.
TBX3 positively regulates posterior digit development via the Hand2/Shh pathway in posterior mesenchyme
Our data reveal required functions for Tbx3 in limb initiation (demonstrated by Tbx3Δfl/Δfl mutants) and in later limb bud morphogenesis (demonstrated by Tbx3;PrxCre mutants). Most Tbx3;PrxCre mutants lack digit 5, whose specification and formation depend on 'early phase' Shh signaling beginning at E9.5 (Harfe et al., 2004; Scherz et al., 2007; Zhu and Mackem, 2011; Zhu et al., 2008). Hand2 protein is required to activate Shh expression in the limb bud (Benazet and Zeller, 2009; Galli et al., 2010). We found that Hand2 transcripts are reduced in E9.5 and E10.5 Tbx3;PrxCre mutant forelimb buds (Figure 2—figure supplement 1D,D'; Figure 3A, A',F) as is Shh expression (Figure 3B,B',F; Figure 3—figure supplement 1). Expression of two targets and effectors of Shh signaling, Ptch1 and Grem1, is also markedly reduced (Figure 3C',E'; Figure 3—figure supplement 2). Tbx3 expression in posterior limb mesoderm begins earlier than in the anterior compartment (Figure 1A,C) and is required for normal Hand2 in posterior mesoderm (Figure 3A, Figure 2J and Figure 2—figure supplement 1D’) (Rallis et al., 2005). Thus, intact Tbx5 expression in Tbx3;PrxCre E9.5 forelimbs (Figure 2—figure supplement 1B’) indicates that post-initiation, Tbx3 functions downstream of Tbx5 and upstream of Hand2.
Figure 3 with 5 supplements see all
Loss of mesenchymal Tbx3 disrupts Shh signaling in the posterior limb bud and decreases Gli3 protein stability.
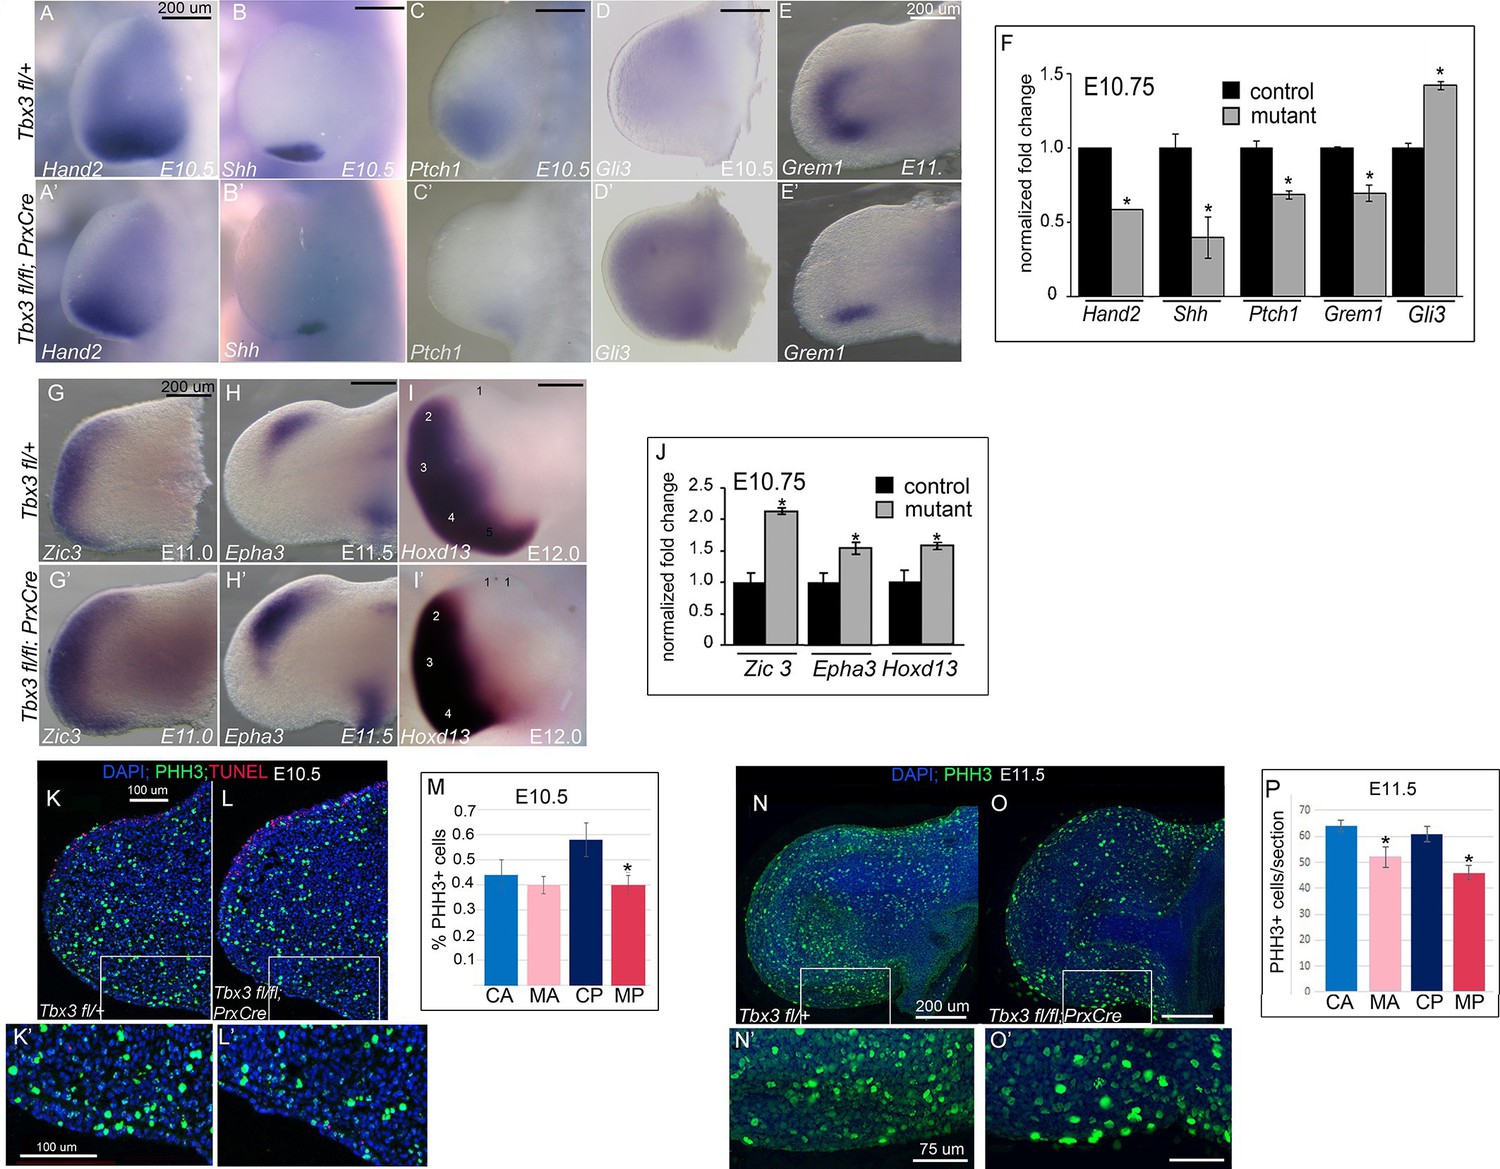
(A–E’) In situ hybridization of control and mutant forelimb buds with probes and at embryonic stages as labeled. (F) qPCR of E10.75 (36-39ss) limb buds for transcripts listed confirms findings by detected by in situ. (G–I’) In situ hybridization for Zic3, Epha3 and Hoxd13 transcripts in forelimb buds of Tbx3 fl/+controls (K–M) and Tbx3;PrxCre mutants (G’–I’) at ages noted on panels. J) qPCR assay of Zic3, Epha3, Hoxd13 transcript levels confirms findings detected by in situ. (K–L’) Representative images of E10.5 forelimb buds stained for DAPI (blue), pHH3 (green), TUNEL (red). K is Tbx3 fl/+ control and K’ is digital zoom of posterior mesenchymal boxed area in K. Panel L is Tbx3;PrxCre mutant and L’ is digital zoom of boxed area in L. This experiment is representative of data obtained from five biologic replicates. (M) Quantification of proliferating cells in anterior and posterior mesenchymal regions encompassing digit 1 and digit 5 progenitors from 20 control and 15 mutant sections. *p=0.02. Control anterior limb (CA), Tbx3;PrxCre mutant anterior limb (MA), control posterior (CP), and mutant posterior (MP). (N–O’) Representative images of E11.5 whole mount forelimb buds stained for DAPI (blue) and pHH3 (green). N is Tbx3 fl/+ control and N’ is digital zoom of boxed area. Panel O is Tbx3;PrxCre mutant and O’ is digital zoom of boxed area in O. Note decreased pHH3+ cells in mutants, particularly cells in prophase and anaphase, which have the faint and speckled patterns compared to the bright staining of highly condensed S-phase chromatin. (P) Quantification of proliferating cells in anterior and posterior mesenchymal regions encompassing digit 1 and digit 5 progenitors from 50 control and 44 mutant sections at E11.5. *p<0.1. Control anterior limb (CA), Tbx3;PrxCre mutant anterior limb (MA), control posterior (CP), and mutant posterior (MP).
To obtain a more comprehensive view of the transcriptional consequences of loss of Tbx3 in limb bud mesenchyme, we assayed gene expression of E10.25 limb buds (32–34 somite stage) by microarray. Shh and other hedgehog pathway members and target genes (Lettice et al., 2003; Probst et al., 2011; Vokes et al., 2008; McGlinn et al., 2005)(Lewandowski et al., 2015) were present among the significantly dysregulated transcripts (Supplementary file 1) consistent with the previous report of decreased Shh expression in Tbx3tm1Pa/tm1Pa mutant limb buds (Davenport et al., 2003). In addition to decreased levels of Shh- activated transcripts (Gli1, Hand2, Osr1, Dkk1, Tbx2, Cntfr, Pkdcc), we noted increased Rprm, Zic3, Hand1, and Gli3 transcripts and confirmed these with qPCR and in situ hybridization at E10.5–11 (Figure 3, Figure 3—figure supplement 4). The increase in expression of these putative targets of the Gli3 repressor (Lettice et al., 2003; Probst et al., 2011; Vokes et al., 2008; McGlinn et al., 2005) was intriguing as it suggested the possibility of alterations in both Gli3 activator and repressor function in Tbx3;PrxCre mutant forelimbs.
The transcriptional profiles of anterior and posterior limb mesenchyme are quite different: alterations in gene expression in either compartment in response to Tbx3 could mask some changes in the other if assayed simultaneously. Thus, we proceeded to microdissect anterior and posterior limb segments and assayed them independently using RNA-sequencing on 38–42 somite stage (~E11; this later stage was needed in order to obtain sufficient RNA from accurately microdissected limb segments) wild type and Tbx3;PrxCre mutant forelimb buds (Figure 3—figure supplement 3). The resulting RNA-Seq data confirmed accurate dissection with the expected distribution of known compartment-specific transcripts (Figure 3—figure supplement 3 and Supplementary file 2). Shh, Fgf4 and anterior Hoxd family transcripts were over-represented in the posterior compartment, and Alx and Pax family members in the anterior.
Largely consistent with the previous microarray findings, we found evidence of aberrant cell differentiation/fate of posterior mesenchyme with downregulation of Shh-activated targets (Osr1, Dkk1, Tbx2, Cntfr, Ptch2, Supplementary file 3) that validated by qPCR (Figure 3—figure supplement 4). It is known that Gli3 expression increases with decreased Shh activity (Wang et al., 2000), as we see here (Figure 3D’, F). Although decreased levels of Hand2, Shh, Ptch1 and Grem1 are clearly evident by in situ and qPCR at this stage (Figure 3 and figure upplements), they were not detected on the RNA-Seq analysis for unclear reasons.
Shh signaling is required for proliferation to ensure sufficient cell numbers to form the normal complement of digits, and loss of Shh results in an increase in the number of cells in G1 arrest (Zhu et al., 2008). Assay of cell proliferation in E10.5 and E11.5 limb buds using anti-phosphohistone H3 immunohistochemistry revealed that at E10.5 there was a statistically significant decrease in the fraction of proliferating cells in the posterior mesenchyme (Figure 3K–M). At E11.5, proliferation was significantly decreased in both the anterior and posterior mesenchyme, indicating a global reduction in the number of mitotic cells in mutants (Figure 3N–P). This suggests that 5th digit agenesis is attributable, at least in part, to decreased cell number, as opposed to decreased proliferation specifically in digit 5 progenitors. Assay for apoptosis using TUNEL showed normal levels of anterior AER cell death at E10.5, as we have previously reported in this region (Moon and Capecchi, 2000) (Figure 3K,L).
Proliferation of limb mesenchyme depends on activity of FGF8 and FGF4 from the AER (Boulet et al., 2004; Moon and Capecchi, 2000; Sun et al., 2002) and integrity of this structure requires Shh activity in posterior mesenchyme (Chiang et al., 2001). Despite decreased Shh expression in Tbx3;PrxCre mutants, Fgf4 transcripts were increased in posterior mesenchyme while decreased in anterior (detected by RNA-Seq, Supplementary files 3,4 and qPCR, Figure 3—figure supplement 4), the latter consistent with an expanded digit 1 region. qPCR detected increased Fgf8 expression in the posterior AER (Figure 3—figure supplement 4). Despite these changes in transcript levels, there was no evidence of altered downstream FGF signaling as expression of Etv4, Etv5, Dusp6 and Sprys was unchanged (Figure 3—figure supplement 5, note these transcripts are not listed in Supplementary files 3 or 4 because they did not meet criteria for differential expression). We conclude that despite the decrement in Shh pathway activity in posterior mesenchyme of Tbx3;PrxCre mutants, the level is sufficient to maintain ectodermal FGF signaling, consistent with preserved limb outgrowth.
Tbx3 stabilizes Gli3 protein in anterior limb mesenchyme
To understand the cause of the anterior PPD phenotype in Tbx3;PrxCre mutants, we pursued molecular mechanisms known to cause this defect in humans and mice: ectopic Hedgehog pathway activity (Hill et al., 2007; 2003; Lettice et al., 2003); decreased Gli3R activity (Hill et al., 2009; Naruse et al., 2010; Wang et al., 2007a); and abnormal composition or function of the primary cilia (Goetz and Anderson, 2010).
RNA-Seq analysis of control versus mutant anterior compartments (Supplementary file 4) showed no evidence of ectopic hedgehog activity in Tbx3;PrxCre mutants, and this was confirmed by in situ hybridization and qPCR for Shh and Ptch1 (Figure 3B–C', Figure 3—figure supplements 1 and 2). Although Gli3 transcripts were increased in mutant limb buds (Figure 3D',F; Supplementary file 1), targets of Gli3R transcriptional repression such as Zic3, Epha3, Hoxd13 (McGlinn et al., 2005; Vokes et al., 2008) were overexpressed when assayed by microarray, RNA-Seq, qPCR and in situ hybridization (Figure 3 G-J, Supplementary files 1,3,4).
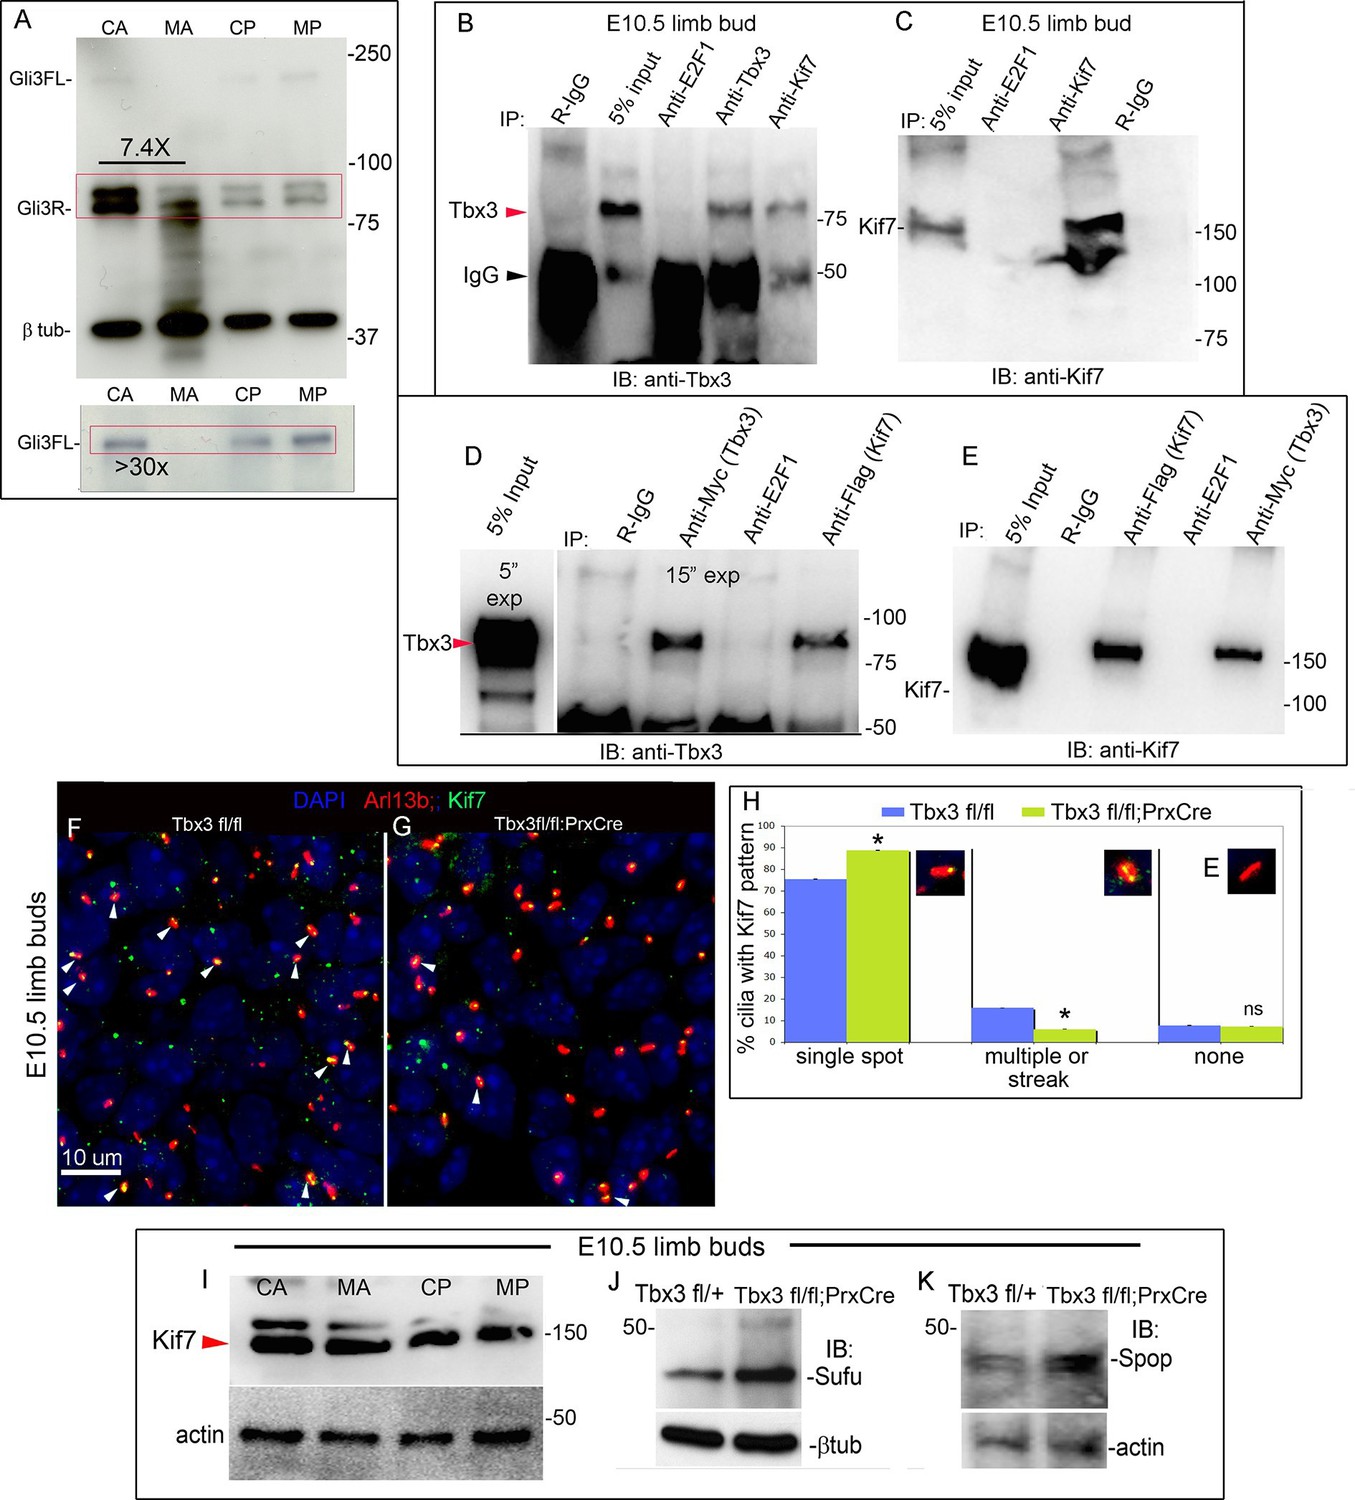
The discrepancy between Gli3 RNA levels and increased expression of some repressor targets prompted examination of Gli3 protein levels. Gli3R constitutes the vast majority of Gli3 protein species in the anterior limb bud (Wang et al., 2000) and Figure 4A). Gli3R protein was markedly decreased (7.4 fold on this representative immunoblot) with multiple bands of lower molecular weight than Gli3R present specifically in Tbx3;PrxCre mutant anterior mesenchyme (mutant anterior compartment: MA, Figure 4A, red box). Gli3FL was virtually undetectable in mutant anterior mesenchyme (Figure 4A’). This finding is not due to poor sample quality because it was reproducible (N=3), no degradation was present in simultaneously prepared posterior compartment lysates (mutant posterior, MP), and the β−tubulin control was intact. These findings indicate that Tbx3 is required for stability of Gli3FL and Gli3R proteins in the anterior limb mesenchyme, and are consistent with the PPD phenotype observed here and in other models of Gli3R deficiency (Hill et al., 2009; Naruse et al., 2010; Wang et al., 2007a).
Figure 4 with 2 supplements see all
Loss of Tbx3 results in Gli3 protein instability and aberrant localization of Kif7 in limb bud cilia.
(A) Representative immunoblot (N=3) blot of E10.75 forelimb bud lysates prepared from microdissected Tbx3fl/+ control anterior limb (CA), Tbx3;PrxCre mutant anterior limb (MA), control posterior (CP), and mutant posterior (MP) probed for Gli3 and βtubulin loading control. Note decreased level of Gli3FL and Gli3R, and multiple bands of lower molecular weight than Gli3R in MA sample. Densitometry of Gli3R bands in red box in N revealed that in this representative experiment, the level of Gli3R was 7.4 fold decreased in mutant anterior relative to control anterior. (A’) Longer exposure of top of blot shown in panel A to examine Gli3FL band. The control (CA) Gli3FL band is 31 fold more intense than mutant (MA, virtually undetectable). (B) Immunoblot of lysates from E10.5 forelimb buds immunoprecipitated (IB) with antibodies listed at top and immunoblotted (IB) for Tbx3. Lane 5 shows that immunoprecipitation with anti-Kif7 antibody co-IPs Tbx3. (C) As in panel B, but assayed for Kif7. (D) Co-IP assay of Myc-tagged Tbx3 and Flag-tagged GFP overexpressed in HEK293 cells. IP was performed with antibodies listed at top and immunoblotted for Tbx3. Myc-tagged Tbx3 co-IPs with Flag-tagged Kif7. Input lane was 5 s exposure (5” exp) while other lanes were 15 s (15” exp). (E) As in D, but in this case, blot probed for Kif7; confirms interaction of tagged, overexpressed proteins. (F, G) Representative images of anterior mesenchyme in sectioned forelimbs of control (F, Tbx3fl/fl) and mutant (G, Tbx3fl/fl;PrxCre) E10.5 embryos stained for the ciliary marker Arl13b (red), Kif7 (green) and DAPI (DNA, blue). White arrowheads highlight cilia with multiple punctae or streak of ciliary Kif7 immunoreactivity (yellow) indicating translocation of Kif7 within the cilia. Please also see Figure 5—source data 2 for z-stacks of additional Kif7 stained limb section. (H) Quantification of Kif7 staining pattern from multiple limb sections and three embryos of each genotype scored blinded to genotype. 10% fewer cilia have evidence of Kif7 translocation (multiple punctae or streak of Kif7 immunoreactivity) in Tbx3fl/fl;PrxCre mutants. N=1785 and 1792 cilia scored in controls and mutants, respectively. * p<0.001 There was no difference in the number of Kif7- cilia. Insets show digital zoom of cilia with representative pattern used for scoring. (I) Immunoblot assaying for Kif7 and b tubulin loading control in control anterior (CA), mutant anterior (MA), control posterior (CP) and mutant posterior (MP) e10.5 forelimb bud lysates. This is representative of four such experiments. (J) Western blot assaying for Sufu protein and b tubulin loading control in eE10.5 forelimb buds. Like Kif7 mutants,Tbx3;PrxCre mutants have increased Sufu protein. Sufu is increased 1.8 fold when normalized to loading control in this representative immunoblot; N=4. K) Western blot assaying for Spop protein and actin loading control in E10.5 forelimb buds. Spop is increased 1.5 fold when normalized to loading control in this representative immunoblot; N=3. Both Sufu and Spop protein levels are increased in mutant forelimbs although their transcript levels are unchanged (Figure 3—figure supplement 4).
-
Figure 4—source data 1
CZI file containing z-stack of E10.5 sectioned limb shown in Figure 4—figure supplement 1.
Kif7 is green, Arl13b red, DNA blue. Gli3 signal can be viewed if desired in the violet channel (channel 2). The entire z stack can be viewed using the free download of Zen software: http://www.zeiss.com/microscopy/en_de/downloads/zen.html.
- https://doi.org/10.7554/eLife.07897.017
TBX3 interacts with Kif7 and is required for normal Kif7 trafficking
In an independent experiment to identify Tbx3 interacting partners, we performed Tbx3 co-immunoprecipitation (co-IP) on E10.5 mouse embryo lysates, followed by mass spectrometry (Kumar et al., 2014b). Surprisingly, Kif7 was among the Tbx3 interacting proteins identified. Kif7 is a ciliary protein that modulates activity of the Hedgehog pathway (Hui and Angers, 2011). It is required for proper formation of a 'cilium tip' compartment that regulates Gli function (He et al., 2014), and for the regulated, partial proteolytic processing of GliFL to Gli3R (Chen et al., 2009; Cheung et al., 2009; Endoh-Yamagami et al., 2009; Law et al., 2012; Ryan and Chiang, 2012). As in Tbx3;PrxCre and Gli3+/- mutants (Hill et al., 2009), human and mouse Kif7 mutants have PPD (Cheung et al. 2009; Endoh-Yamagami et al. 2009; Putoux et al. 2011).
Immunoprecipitation of protein lysates from E10.5 forelimb buds showed that Tbx3 co-immunoprecipitates (co-IPs) with Kif7, confirming interaction of Kif7 and Tbx3 in the developing limb (Figure 4B; specificity and efficiency of Kif7 IP in this experiment is shown in Figure 4C). We next tested whether these proteins directly interact by overexpressing Flag-tagged Kif7 and Myc-tagged Tbx3 in HEK293 cells and immunoprecipitating for either Flag or Myc, followed by immunoblotting for Tbx3 (Figure 4D) or Kif7 (Figure 4E). Both experiments confirmed direct interaction of the tagged proteins.
The interaction of Tbx3 with Kif7, and the shared PPD phenotypes of Kif7 and Tbx3;PrxCre mutants, suggest that Tbx3 may be required for normal Kif7 function in the anterior limb bud, and that loss of Tbx3 may disrupt Gli3 stability and processing in part via a Kif7-dependent mechanism.
We examined Kif7 localization in E11 control and mutant forelimb buds, co-staining for the cilia marker Arl13b. Confocal fields spanning the anterior mesenchyme of controls and mutants were imaged and Figure 4F and G are representative 40X fields (a higher magnification image and confocal z-stack, which also show Kif7 in the cytoplasm and nucleus are shown in Figure 4—figure supplement 1 and Figure 4—source data 1). Blinded to genotype, fields were scored for ciliary Kif7 immunoreactivity as a single puncta, multiple punctae/streak, or none (N=1785 and 1792 cilia scored in controls and mutants, respectively). In 16% of control cilia, Kif7 was detected in two punctae (presumed base and tip) or as a streak along the cilia, but this was only the case in 6% of mutant cilia (Figure 4H, p<0.001). There was no significant difference in the number of Kif7+ cilia rather, there were more single puncta cilia in mutants than controls (Figure 4H, 84% vs 71%, p<0.001). We did not detect any difference in the amount of Kif7 protein in control versus mutant limb bud compartments by western blot (Figure 4I, representative of four4 separate experiments). Levels of Kif7 mRNA in the anterior limb mesenchyme were unaffected by loss of Tbx3 (Figure 3—figure supplement 4). There was a decrease in the transcripts posterior compartment but as shown, the protein level was unchanged.
One feature of Kif7-/-mutants is excess Sufu due to increased protein stability (Hsu et al., 2011). Transcript levels of Sufu were unchanged in mutant forelimbs (Figure 3—figure supplement 4, no difference was detected by microarray or RNA-Seq). However, increased amounts of Sufu (and Spop) protein were present in mutant limb buds (Figure 4J,K; increased 1.5 fold in both cases).
Humans and mice with Kif7 mutations have abnormally long cilia because Kif7 reduces the rate of microtubule growth in the ciliary axoneme (He et al., 2014; Putoux et al., 2011). With 3D images obtained from 100X confocal z-stacks of Arl13b stained limb sections, we used the 3D object counter from ImageJ to calculate the volume and surface area to volume ratio to derive the length of cilia. Consistent with aberrant, but not absent, Kif7 function, we found that while the range of cilia volumes detected were the same between mutants and controls, the distribution was not: mutants have an increased fraction of larger cilia and an average volume 18% greater (Figure 4—figure supplement 2A, B; 475 and 575 cilia assayed in controls and mutants, respectively). Mutants and controls had superimposable surface area/volume ratios (Figure 4—figure supplement 2C), indicating that the shape of cilia was not different thus, the derived length was 6% greater in mutants.
Together, these findings indicate that loss of Tbx3 results in aberrant ciliary localization of Kif7 and are consistent with abnormal Kif7 function.
Tbx3 is present in primary cilia and translocates in response to Hedgehog pathway activity
Kif7 and other proteins required for Gli3 processing and function are present in, or translocate to, primary cilia in response to Hedgehog pathway activity (Goetz and Anderson, 2010; Ryan and Chiang, 2012). Dual immunostaining for Tbx3 and Arl13b on whole mount optically sectioned E10.5 forelimbs shows that Tbx3 is present in control limb anterior mesenchymal cilia (Figure 5 A-E, Figure 5—source data 1). Specificity of Tbx3 staining was confirmed by loss of signal in mesenchymal cilia of Tbx3;PrxCre mutant limbs (Figure 5F-J, Figure 5—source data 2). The digital image overlap calculator in Zen software showed that 18/50 anterior mesenchymal cilia were Tbx3+ (36%, Figure 5—figure supplement 1A,B). Of note, no epithelial cilia were Tbx3+ in control limb epithelium, providing an internal negative control for the signal in mesenchymal cilia. This same calculation in Tbx3;PrxCre mutant anterior mesenchyme showed only 2/54 (<4%) of mesenchymal cilia had background Tbx3 signal (Figure 5—figure supplement 1, C, D). These findings were reproduced with a commercially available anti-Tbx3 antibody (Abcam ab99302) which also showed Tbx3 ciliary staining on control limb mesenchymal cilia (24/87, 28%) that was virtually absent in Tbx3 mutant limbs (2/52, <4%; Figure 5—figure supplement 2).
Figure 5 with 2 supplements see all
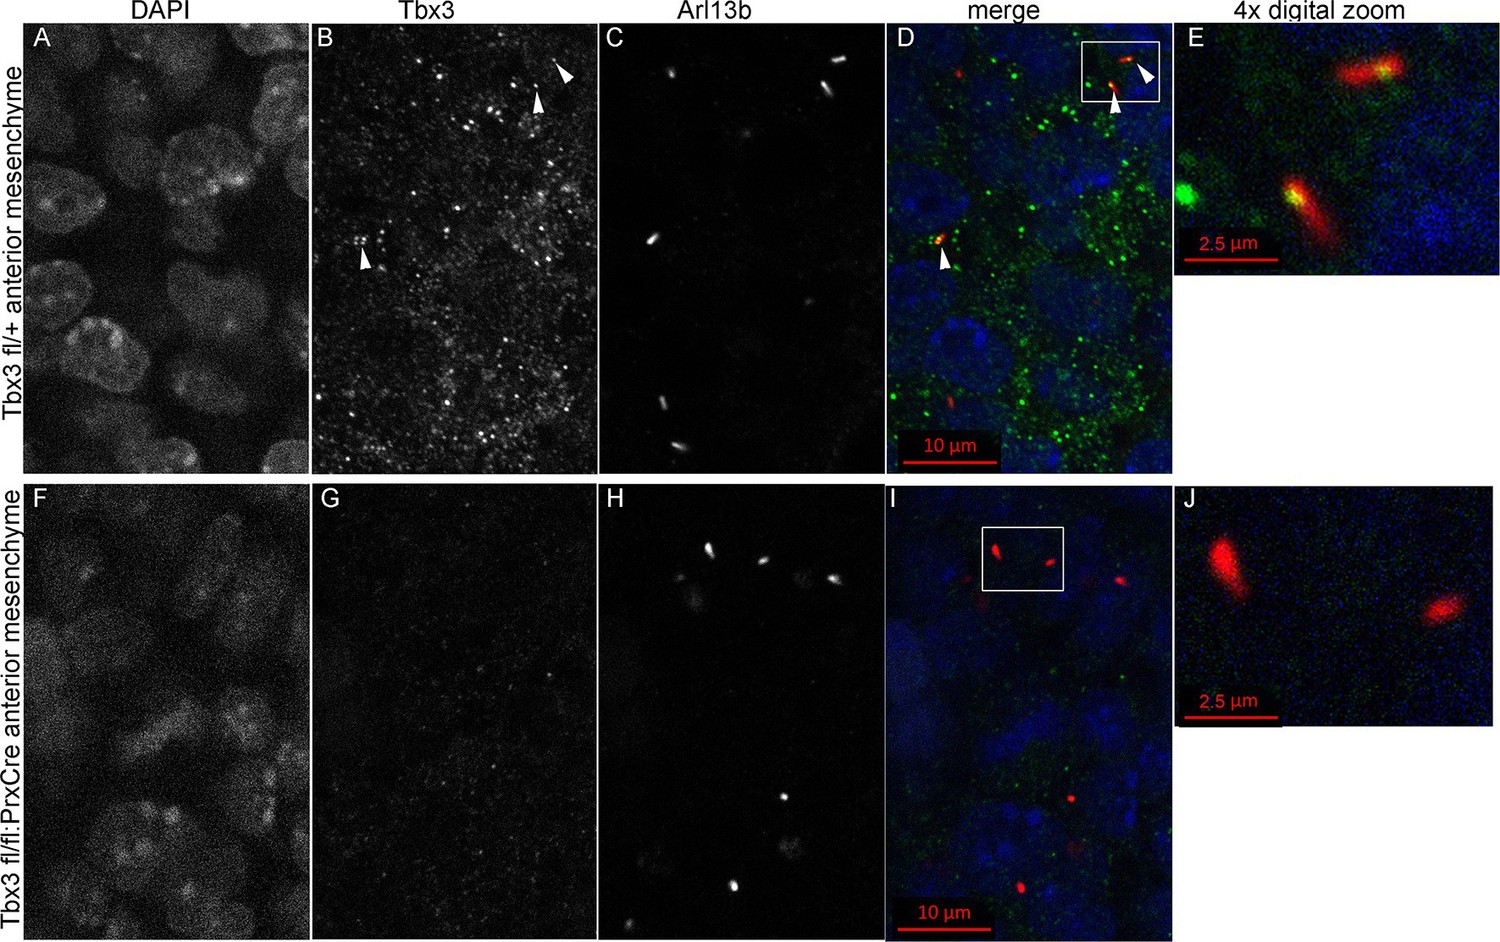
Tbx3 localizes to the primary cilia in limb mesenchyme.
(A–D, F–I) Confocal 100X single Z-plane immunofluorescence images from optically sectioned E10.5 control (top panels A–D) and Tbx3;PrxCre (F–I) anterior limb buds after immunostaining with: Hoechst (DNA, blue), C-terminal anti-Tbx3 antibody (green, Frank et al., 2013), anti-Arl13b (red, cilia). Arrowheads demarcate Tbx3 colocalization with cilia marker. Panels E and J are further digital zooms of white boxed cells in D and I. The entire z-stacks containing these planes are in Figure 5—source data 1,2.
-
Figure 5—source data 1
Czi file of z-stack through the region of control anterior limb shown in Figure 5A–E.
The entire z stack can be viewed using the free download of Zen software http://www.zeiss.com/microscopy/en_de/downloads/zen.html.
- https://doi.org/10.7554/eLife.07897.021
-
Figure 5—source data 2
Czi file of z-stack through region of mutant anterior limb shown in Figure 5F–J.
Please view as described above.
- https://doi.org/10.7554/eLife.07897.022
Murine embryonic fibroblasts (MEFs) are a robust system for studying ciliary proteins (Chen et al., 2009; Dorn et al., 2012; Liem et al., 2012; Ocbina and Anderson, 2008; Rohatgi et al., 2007), so we used them to further explore Tbx3 localization and trafficking. In untreated wild type MEFs, our custom C-terminal antibody detected Tbx3 in a subset of cilia (30%, N=56; Figure 6A and B, a1-a5, b1-b5; Figure 6—source data 1,2). No Tbx3+ cilia were detected in Tbx3 null MEFS (Figure 6C–F; Figure 6—source data 3). Treatment of wild type MEFs with the smoothened agonist SAG increased the number of Tbx3+ cilia from 30% to 75% (Figure 6G-J p<0.005, Figure 6—source data 4, Figure 6—figure supplement 1A). Lysates from control and SAG-treated MEFs showed no detectable difference in Tbx3 protein levels indicating the increased Tbx3 signal in cilia was due to trafficking rather than increased protein levels (Figure 6—figure supplement 1B). The presence of Tbx3 in cilia and response to Hedgehog pathway activity were also detected with a commercially available anti-Tbx3 antibody with both SAG and Shh stimulation (Figure 6—figure supplement 1C,D and Figure 6—source data 5,6). In total, these data show that Tbx3 is present at baseline in cilia, and is trafficked to cilia in response to hedgehog signaling.
Figure 6 with 1 supplement see all
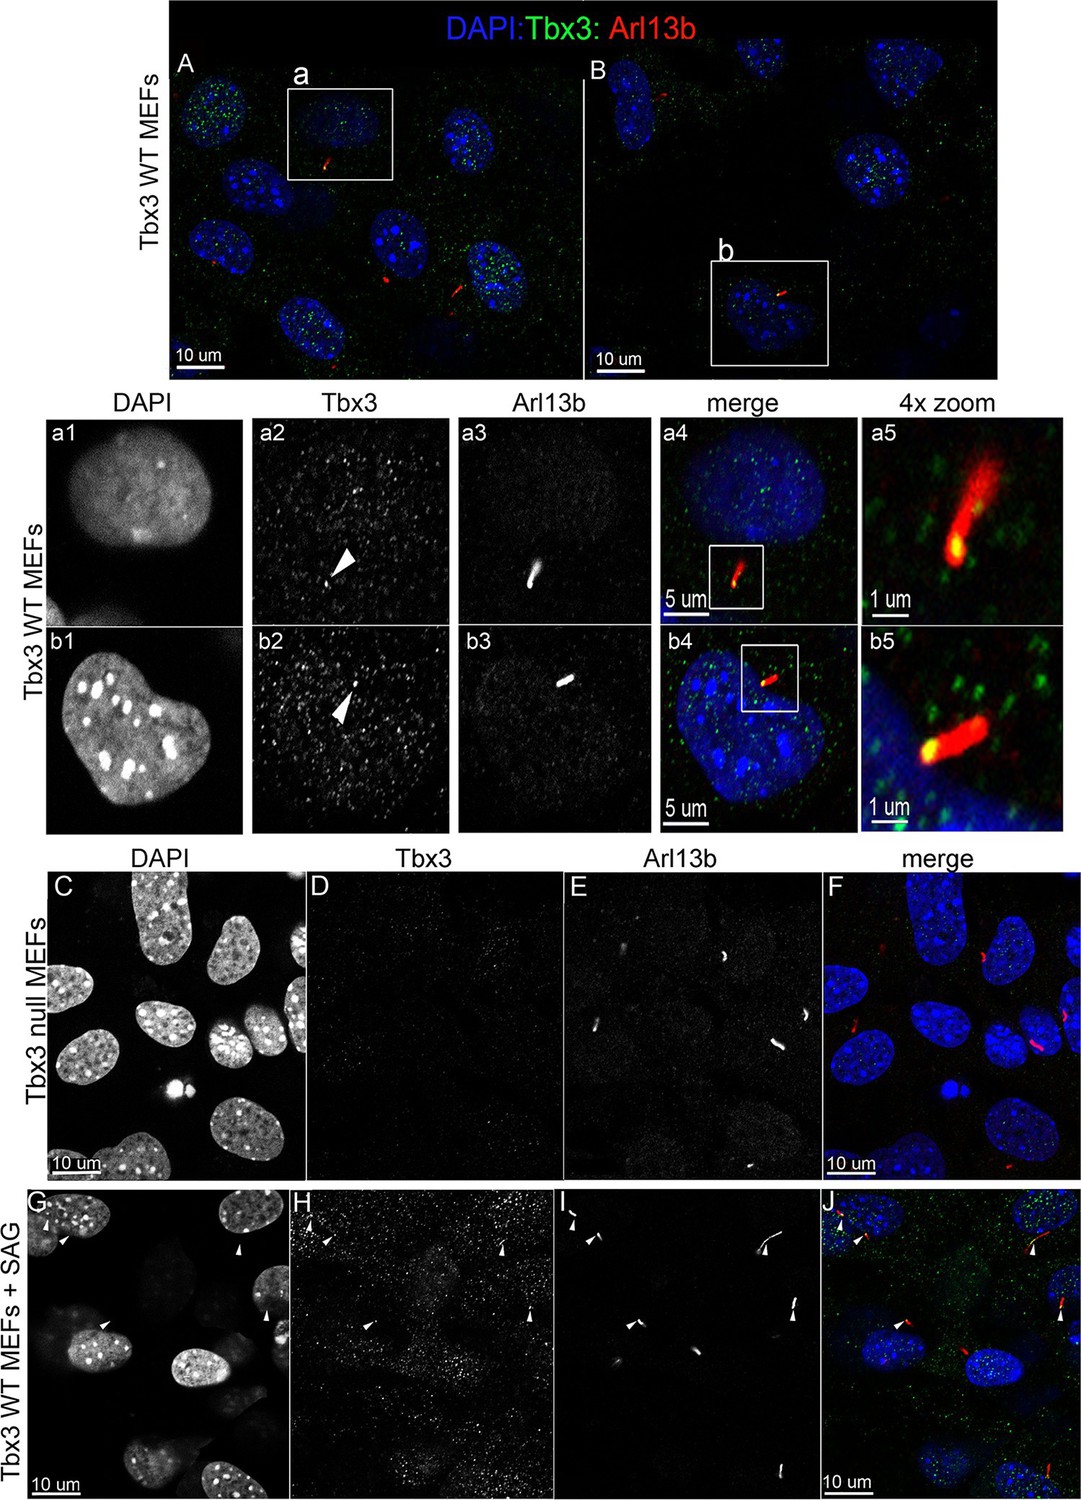
Tbx3 is present in some cilia at baseline in Murine Embryonic Fibroblasts and trafficks to cilia in response to hedgehog pathway activation.
(A, B) Confocal, 100X single z-plane immunofluorescence images from two different fields of wild type MEFS after immunostaining for: DAPI (DNA, blue), Tbx3 (green, c-terminal anti-Tbx3 antibody; Frank et al., 2013), Arl13b (red, cilia). White boxed regions outline single cells that are shown at higher magnification in panels a1–a5 and b1–b5. Please see Figure 6—source data 1,2 for z-stacks. a1–a4, b1–b4) Single cells from white boxed areas in panels A and B. Individual cilia are shown in a5 and b5. White arrowheads highlight Tbx3+ cilia. (C–F) Tbx3 null MEFs show loss of Tbx3 immunoreactivity in cilia and other cellular locations. Please see Figure 6—source data 3 for z-stack. (G–J) As in A and B, but MEFs were treated with smoothened agonist (SAG). White arrowheads highlight Tbx3+ cilia. Please see Figure 6—source data 4 for z-stack.
-
Figure 6—source data 1
Czi file showing z-stack of wild type MEFs imaged in Figure 6 panel A.
- https://doi.org/10.7554/eLife.07897.026
-
Figure 6—source data 2
Czi file showing z-stack of wild type MEFs imaged in Figure 6 panel B.
- https://doi.org/10.7554/eLife.07897.027
-
Figure 6—source data 3
Czi file showing z-stack of Tbx3 null MEFs imaged in Figure 6 panel C–F.
- https://doi.org/10.7554/eLife.07897.028
-
Figure 6—source data 4
Czi file showing z-stack of SAG treated MEFs imaged in Figure 6 panel G–J.
- https://doi.org/10.7554/eLife.07897.029
-
Figure 6—source data 5
Czi file showing z-stack of SAG treated MEFs imaged in Figure 6—figure supplement 1 panel C.
- https://doi.org/10.7554/eLife.07897.030
-
Figure 6—source data 6
Czi file showing z-stack of SHH treated MEFs imaged in Figure 6—figure supplement 1 panel D.
- https://doi.org/10.7554/eLife.07897.031
Tbx3 co-localizes with Gli3 in the primary cilia
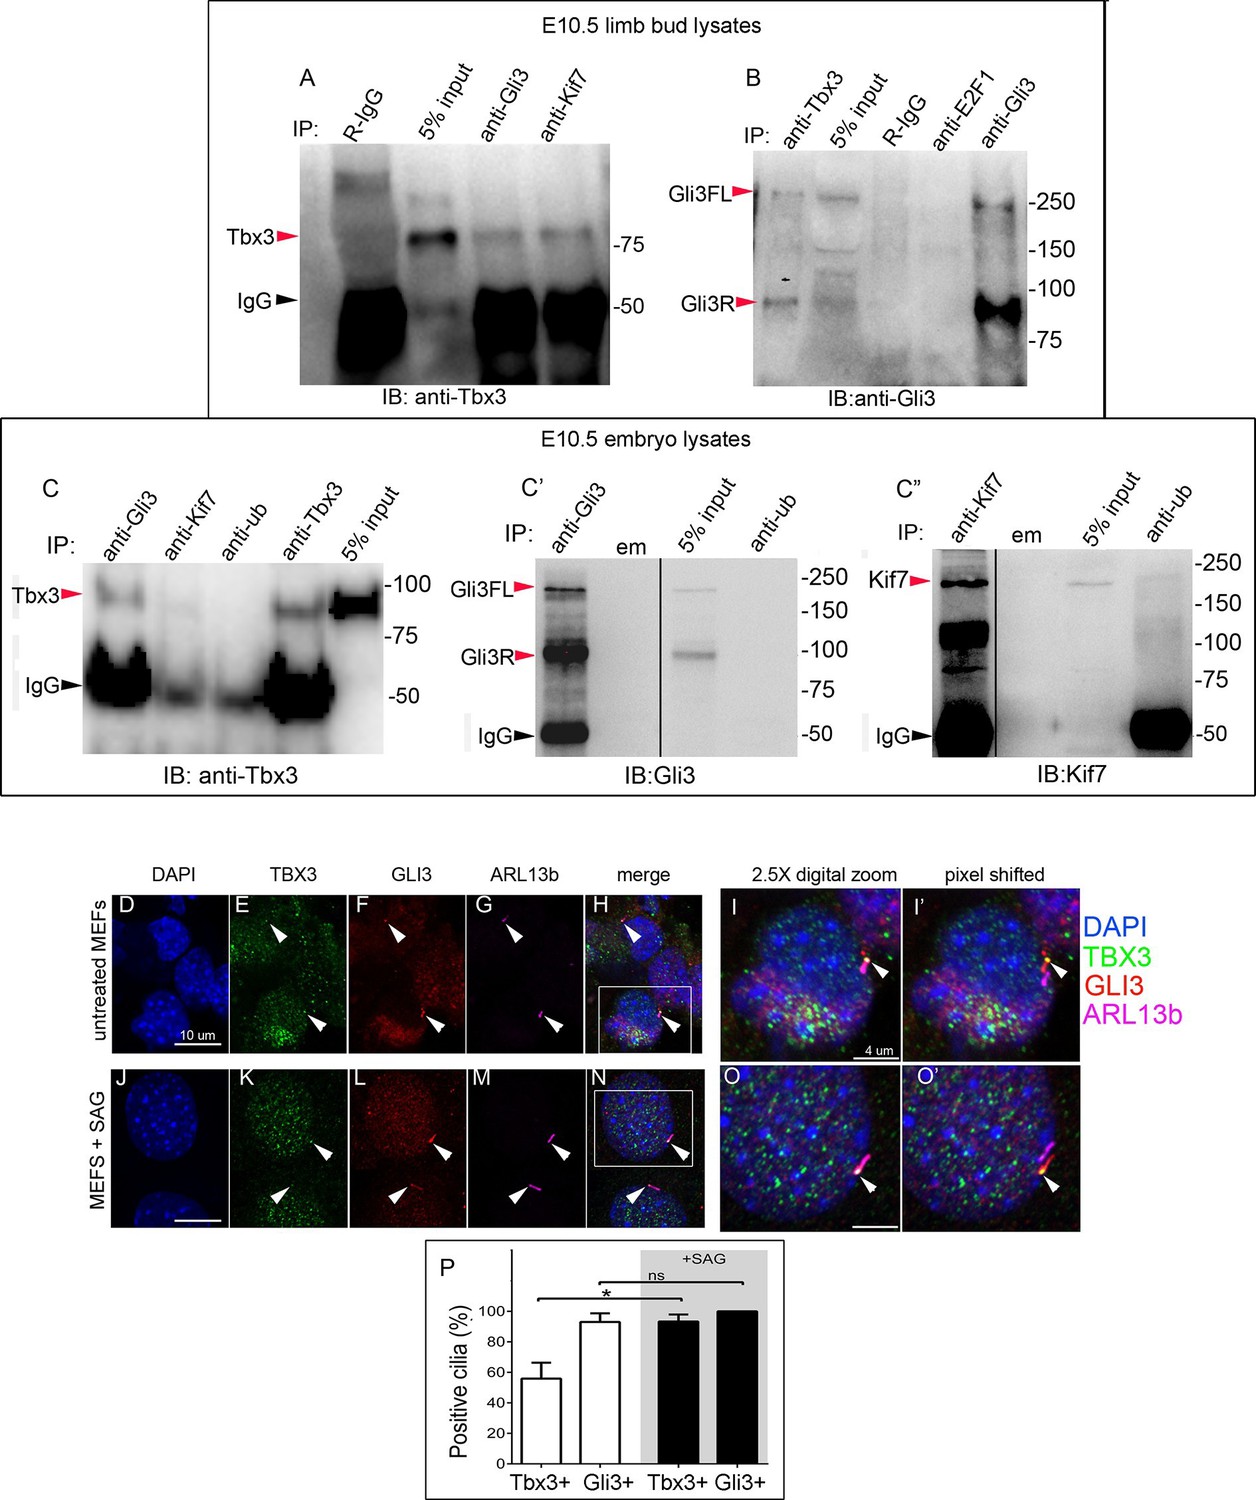
The presence of Tbx3 in cilia and the known association of Gli3 and Kif7 in primary cilia (Endoh-Yamagami et al., 2009) led us to test for interaction between endogenous Tbx3 and Gli3. Co-immunoprecipitation of E10.5 forelimb lysates showed that Tbx3 co-IPs with endogenous Gli3 (Figure 7A, and with Kif7 as shown previously), and that both Gli3FL and Gli3R are complexed with Tbx3 in the limb bud (Figure 7B, lane 1). These interactions are also detected in whole embryos (Figure 7C; specificity/efficiency of Gli3 and Kif7 IPs are shown in Figure 7C’ and C”, respectively. Additional experiments showing this interaction are in Figure 7—figure supplement 1). Overexpression of Flag-tagged Gli3 and Myc-tagged Tbx3 in HEK293 cells followed by co-immunoprecipitation did not indicate direct interaction in this cellular context (Figure 7—figure supplement 2), suggesting that their association occurs within a larger complex that includes Kif7 (Figure 4).
Figure 7 with 3 supplements see all
Tbx3 interacts with Gli3 in the limb bud and trafficks with Gli3 in primary cilia.
(A, B) Immunoprecipitation (IP) of E10.5 forelimb bud protein lysates with antibodies listed at the top of panel and immunoblotted (IB) to detect Tbx3 (A) or Gli3 (B). Black arrowhead indicates IgG. Gli3FL and Gli3R (red arrowheads in B) both co-immunoprecipitate with Tbx3. (C) Immunoprecipitation (IP) of E10.5 whole embryo protein lysates with antibodies listed at the top of panel and immunoblotted to detect Tbx3. Tbx3 co-IPs with Gli3. Specificity and efficiency of anti-Gi3 and anti-Kif7 antibodies in whole embryo lysates tested are shown in panels C’ and C”. Additional experiments demonstrating Tbx3/Gli3 interactions are in Figure 7—figure supplement 1. Em, empty lane (D–I’) Confocal 100X single Z-plane immunofluorescence images of vehicle (DMSO) treated MEFS after immunostaining for: DAPI (DNA, blue), Tbx3 (green, Frank et al., 2013), Gli3 (red), Arl13b (pink, cilia). Panel H is merged image of (D–G). Panel I is 2.5X digital zoom of the boxed cell in panel H, and I’ shows the pink (cilia) channel pixel shifted to permit visualization of colocalized Tbx3 and Gli3 (yellow) within the cilia. White arrowheads highlight Gli3/Tbx3 colocalization. Please see Figure 7—source data 1 for z-stacks. (J–O’) As above, but MEFS were treated with SAG in DMSO. Please see Figure 7—source data 2 for z-stack. (P) Quantitation of Tbx3+ and Gli3+ cilia in MEFS -/+ SAG. SAG treatment causes the majority of cilia to become Tbx3+ and these ciliary Tbx3 signals all colocalize with Gli3.
-
Figure 7—source data 1
Czi file showing z-stack of wild type MEFs imaged in Figure 7 panel D-I’.
- https://doi.org/10.7554/eLife.07897.034
-
Figure 7—source data 2
Czi file showing z-stack of SAG treated MEFs imaged in Figure 7 panel J-O’.
- https://doi.org/10.7554/eLife.07897.035
Immunofluorescence assay of untreated MEFs for Tbx3, Gli3, and Arl13b by triple immunocytochemistry showed that 90% of cilia were Gli3+; Tbx3 colocalized with 66% of the Gli3 signals (N=38 total cilia scored, Figure 7D–I’ Figure 7—source data 1). Treatment with SAG increased the fraction of Gli3+ cilia to >95% and all but two of those Gli3 signals colocalized with Tbx3 (N=34, Figure 7J–O’, Figure 7—source data 2). These results are quantified in Figure 7P.
Loss of Tbx3 compromises the Sufu/Kif7 complex required for Gli3FL stability and normal processing of Gli3R
To obtain further mechanistic understanding into how loss of Tbx3 results in decreased Gli3 proteins, we assayed levels and interactions of members of the Gli3 processing machinery. Gli3FL stability and partial processing versus complete degradation are regulated by opposing actions of Suppressor of fused (Sufu) and speckle-type POZ protein (Spop), respectively (Wang et al., 2010; Wen et al., 2010). In the absence of Smoothened activation, mammalian Sufu recruits GSK3β to phosphorylate Gli3FL downstream of PKA, allowing for its partial processing to Gli3R (which requires Kif7 and intact cilia) (Kise et al., 2009; Tempe et al., 2006; Wang et al., 2000). Spop is an adaptor for Cullin3-based E3 ubiquitin ligase that drives complete degradation of Gli3FL in the absence of Sufu, but facilitates its processing to Gli3R when Sufu is present (Humke et al., 2010; Wang et al., 2010; Zhang et al., 2006). In contrast to Kif7 and Gli3, we did not detect interactions between Tbx3 and either Sufu or Spop (Figure 7—figure supplement 3). The observation that Gli3FL is virtually undetectable in Tbx3;PrxCre anterior mesenchyme (Figure 4A') indicates that despite the increased amount of Sufu (Figure 4H, Figure 8—figure supplement 1), it fails to prevent degradation of Gli3FL in the absence of Tbx3.
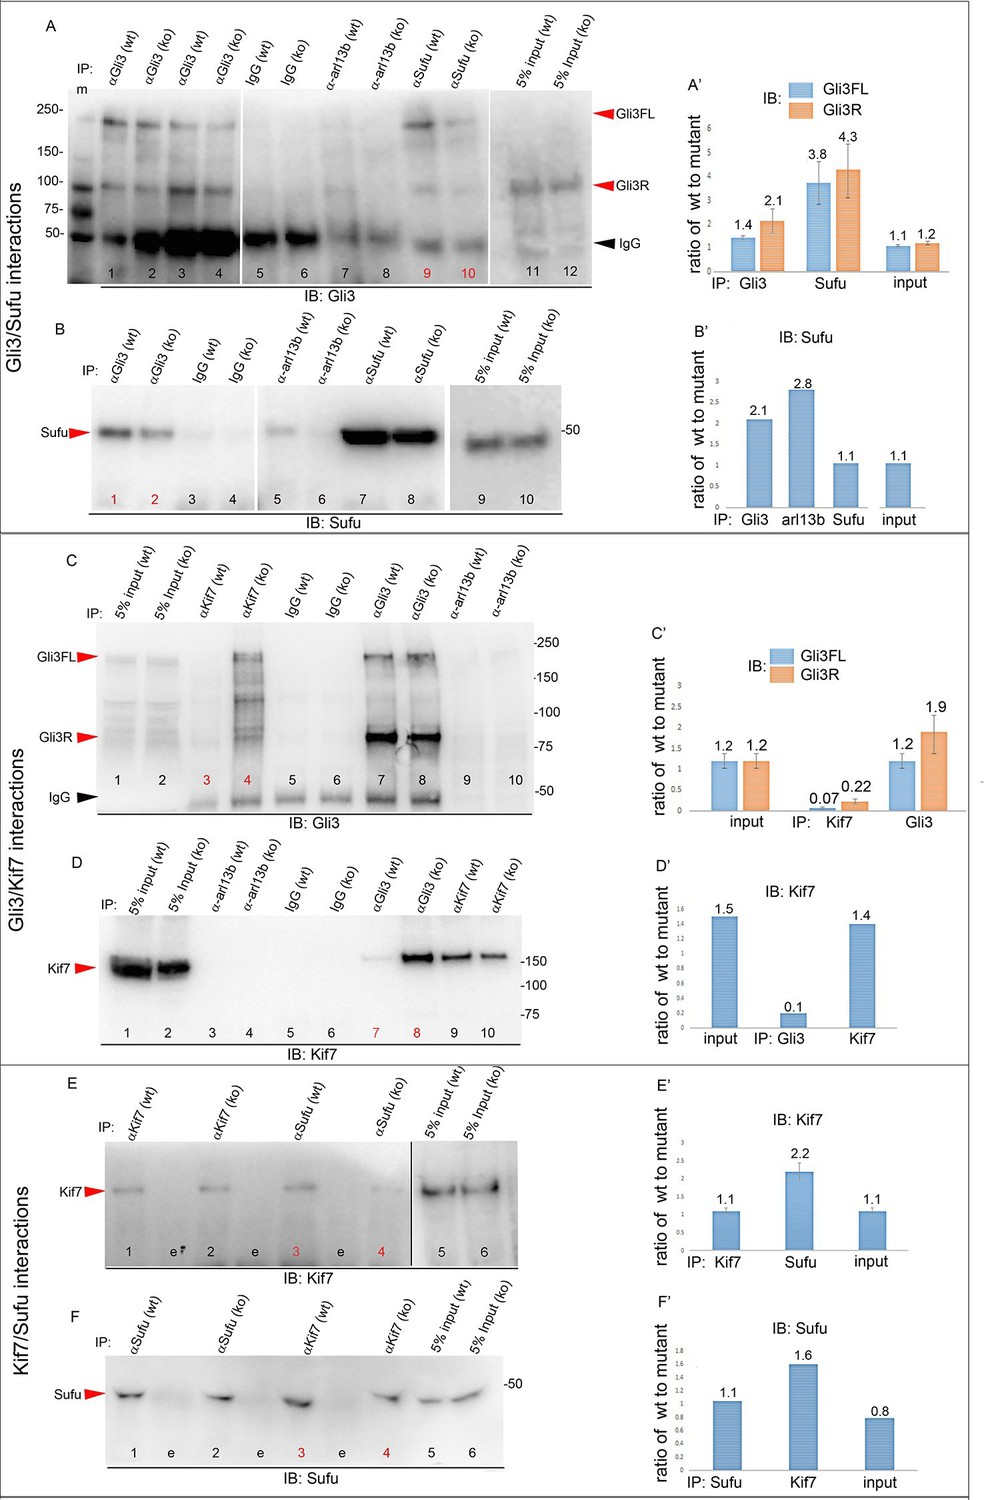
We next tested whether decreased levels of Gli3 proteins in the anterior mesenchyme reflected perturbed interactions between Sufu, Gli3 and Kif7. Limitations in sample quantity made it unfeasible to perform multiple co-IPs on isolated anterior forelimb buds, so we assayed lysates from control and Tbx3Δfl/Δfl E10.5 embryos. The altered levels of protein expression seen in mutant limb buds were recapitulated in whole embryos (Figure 8—figure supplement 1). As seen in mutant limb buds, the amount of both Gli3FL and Gli3R protein is reduced in Tbx3Δfl/Δfl embryos (Figure 8A, lanes 1–4; Figure 8—figure supplement 1; Figure 8—figure supplement 2A and B). Notably, the interaction between Gli3 and Sufu is reproducibly decreased in excess of the decrement in Gli3 proteins; this is evident by quantitating and comparing the ratio of Gli3 proteins detected in control versus mutant to that complexed with Sufu. For example, in the representative experiment shown in Figure 8A, the Gli3 FL band intensity ratio is ~1.6 fold greater in controls (Figure 8A, lanes 1 and 3) than in mutants (Figure 8A, lanes 2, 4), while the amount of Gli3FL protein that was immunoprecipitated with Sufu is 4.6 fold greater in controls than mutants (Figure 8A, lane 9 versus 10). Mean band intensity ratios of 3 replicate experiments are shown in Figure 8A’. The decreased Gli3/Sufu interaction in the absence of Tbx3 was also evident when assayed in the opposite direction, that is, by IP of Gli3 and immunoblotting for Sufu (Figure 8B, panel B’ shows relative band intensities for the experiment shown). Sufu/Gli3R interactions were also affected (Figure 8A’; Figure 8—figure supplement 2A–B). These findings indicate that normal stoichiometry of the interaction of Gli3 proteins with Sufu requires Tbx3.
Figure 8 with 2 supplements see all
Altered stoichiometry of interactions between Gli3 and members of its processing/degradation complex.
(A) Anti-Gli3 immunoblot (IB) on immunoprecipitates (IP) from antibodies listed at top on lysates from E10.5 control (wt) and Tbx3Δfl/Δfl (ko) embryos. Gli3FL and Gli3R are denoted by red arrowheads, IgG heavy chain with black arrowhead. Note decreased levels of IP’d Gli3FL and Gli3R in mutants compared with controls; the IPs in lanes 1–2 and 3–4 are two independent biologic replicates and the band intensity ratio of control to mutant for both GliFL and Gli3R was ~1.6. The interaction between Gli3 and Sufu is decreased more than can be explained by the overall decrement in Gli3 protein levels: in this representative experiment Sufu co-IPs 4.6X more Gli3FL in controls than in mutants (lane 9 versus 10). (A’) Bar graphs show the results of quantitation of band intensities from three3 replicate experiments measured with densitometry and presented as the ratio of signal detected in controls relative to mutants. (B) As in A but immunoblot probed for Sufu. Comparison of lanes 1 and 2 confirms decreased interaction between Gli3 and Sufu, despite preserved levels of Sufu in the mutants (lane 10). (C) Anti-Gli3 immunoblot with IPs as listed at top. Note increased interaction between Kif7 and Gli3 in mutants (lane 4), despite overall decreased level of Gli3 (lane 8). (C’) Quantitation of band intensities from three replicate experiments measured with densitometry and presented as a ratio of signal detected in control relative to mutant. Even though there is less total Gli3 protein, since there is increased interaction between Gli3 and Kif7 in mutants, the Kif7 co-IP control to mutant ratios are <1. (D) Anti-Kif7 immunoblot with IPs as listed at top. Confirms increased interaction between Gli3 and Kif7 in mutants. (D’) Quantitation of experiment in D. (E) Anti-Kif7 immunoblot with IPs as listed at top. The interaction of Kif7 and Sufu is decreased in the absence of Tbx3 (lane 4) despite preserved levels of both proteins (lane 6; Figure 8, panels B, D and F; Figure 8—figure supplements 1 and 2). (E’) Quantitation of band intensities from two replicate experiments measured with densitometry and presented as ratio of signal detected in control relative to mutant. There is 2 fold less interaction between Kif7 and Sufu in mutants. (F) Anti-Sufu immunoblot with IPs as listed at top. The interaction of Kif7 and Sufu is decreased in the absence of Tbx3 (lane 3 versus 4). (F’) Quantitation of findings in F.
In wild type embryos, we detected only trace interaction between Kif7 and Gli3R assaying by co-IP in either direction (Figure 8C, lane 3; Figure 8D, lane 7; Figure 8—figure supplement 2C, lane1). However, there was a robust and reproducible interaction in mutants despite the decrease in the total amount of Gli3 proteins. In the representative experiment shown in Figure 8C, in which we IP’d for Kif7 and assayed for Gli3, the band intensity ratios of control (lane 3) to mutant (lane 4) were 0.1 for Gli3FL and 0.25 for Gli3R. Quantification of the band intensity ratios from three replicate experiments in which we IP’d for Kif7 and assayed for Gli3 is shown in Figure 8C’. Furthermore, the increased interaction of Kif7 with Gli3 was confirmed by IP of Gli3 and assay for Kif7, as shown in Figure 8D: the band intensity ratio of control (lane 7) to mutant (lane 8) was 0.1, indicating a marked increase in interaction in mutants (Figure 8D’ graphs relative band intensities in experiment 8D).
Lastly, the interaction between Sufu and Kif7 was reproducibly decreased when assayed by co-IP in either direction (Figure 8E, lane 3 versus 4; Figure 8F, lane 3 versus 4; Figure 8—figure supplement 2D, lane 7 versus 8). Quantification of the band intensity ratios from replicate experiments in which we IP’d for Sufu and assayed for Kif7 is shown in Figure 8C’. Figure 8F’ graphs relative band intensities in experiment 8F in which we IP’d for Kif7 and assayed for Sufu. Note that this decrease in Sufu/Kif7 interaction occurs despite increased and normal levels of these proteins, respectively. In total, these data indicate that Tbx3 is required for normal stoichiometry and function of the Sufu/Kif7 complex that stabilizes and processes Gli3 as modeled in Figure 9.
Figure 9
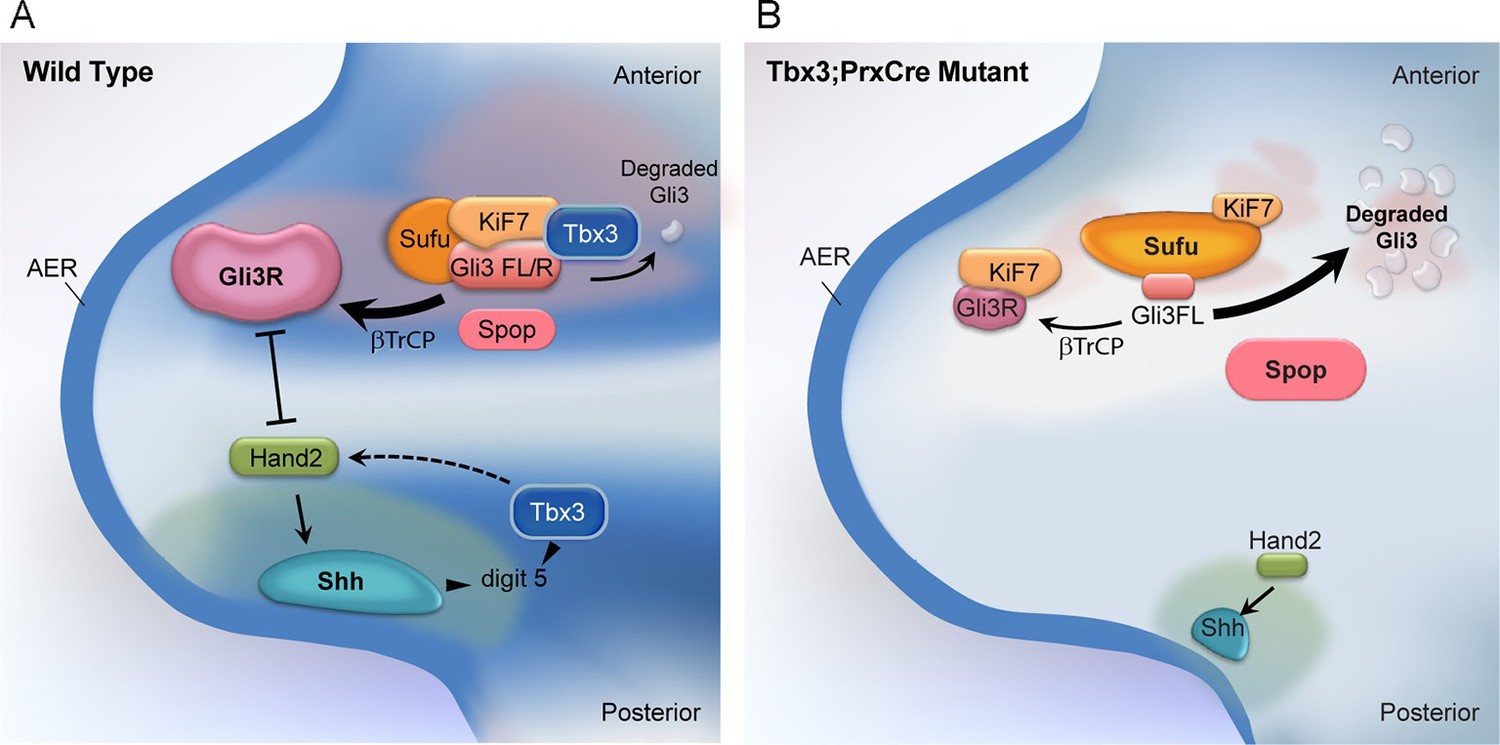
Model of compartment specific functions of Tbx3 in forelimb bud mesenchyme and altered interactions and stoichiometry of the Kif7/Sufu Gli3 processing complex in Tbx3;PrxCre mutants.
In posterior forelimb mesenchyme, Tbx3 is required for normal levels of Hand2 upstream of Shh. Shh pathway activity and other Tbx3-reponsive factors promote digit 5 formation. In the absence of Tbx3, there is decreased expression of Hand2 and Shh and other digit 5 promoting pathways. In anterior mesenchyme, Tbx3 is in a complex with Gli3 proteins, Kif7 and Sufu and required for the stability of Gli3 FL and Gli3R. In the absence of Tbx3, Sufu and Spop protein levels are increased yet there is decreased interaction between Sufu and Kif7, and Sufu and Gli3. In mutant anterior mesenchyme, Gli3FL is barely detected: it is either degraded or converted to Gli3R. Levels of Gli3R are abnormally low due to a combination of decreased amount of Gli3FL precursor and its processing to Gli3R, and excess degradation. These findings are consistent with decreased function of cilia and Kif7 (required for processing of Gli3FL to Gli3R), and of Sufu (required for stability of both Gli3FL and Gli3R).
Discussion
Role of Tbx3 in limb bud initiation
Tbx3 expression in the LPM is required for normal Tbx5 expression (Figure 2A–C) implicating Tbx3 as one of the earliest limb initiation factors. This is consistent with our finding that Tbx3+ progenitors in the LPM give rise to the majority of limb bud mesenchyme. Determining the fate of these progenitors in the future will help reveal the mechanism for loss of ulna/fibula and digits 2–5 in Tbx3 null embryos.
Differential sensitivity of the left and right limbs to Tbx3
Intrinsic differences in anatomically bilaterally symmetric structures have long been suspected: acetazolamide teratogenizes only the right limb in rats (Layton and Hallesy, 1965; Wilson et al., 1968) and nitroheterocyclics such as valproate also induce unilateral defects (Coakley and Brown, 1986; Fantel et al., 1986). Directional asymmetry in limb size in human fetuses was recently reported (Van Dongen et al., 2014). Left/right identity differences in bilaterally symmetric structures such as the limbs may be upstream of secondary patterning events such as dorsal/ventral axis appropriate to body side. Shiratori and colleagues reported asymmetric expression of Pitx2c in the developing mouse limb and postulated functional left/right differences (Shiratori et al., 2014). Our finding that the left limb is more sensitive to Tbx3 than the right is consistent with this hypothesis and warrants further investigation in humans with UMS and other mouse models.
Discrete functions for Tbx3 in the anterior and posterior limb bud mesenchyme
A model of molecular mechanisms contributing to the different anterior and posterior limb phenotypes of Tbx3;PrxCre mutants is shown in Figure 9.
Digit 5 formation is exquisitely sensitive to Shh activity and Grem1 (Harfe et al., 2004; Scherz et al., 2007; Zhu and Mackem, 2011; Zhu et al., 2008), so the altered expression of these genes in posterior mutant mesenchyme helps to explain loss of this digit. Shh null heterozygotes (Shh+/-) have normal digit number, suggesting that the loss of digit 5 in Tbx3;PrxCre mutants is not solely due to decreased Shh expression and pathway activity in posterior mesenchyme. Importantly, it is not known if compensatory mechanisms preserve normal Shh protein levels or activity in Shh+/- mutants to support normal limb development. Indeed, a 'buffering system' to modulate polarizing activity by Shh was proposed in the chick limb (Sanz-Ezquerro and Tickle, 2000).
We found evidence of dysfunction of other digit 5 promoting pathways in posterior mesenchyme of Tbx3;PrxCre mutants. Compound Hand2/Gli3 null mutants have more severe polydactyly than Gli3 mutants (Galli et al., 2010), indicating that the role of Hand2 in digit formation is not limited to regulation of Shh expression. Aberrant expression of other BHLH factors (Supplementary files 1,3: Hand1, Bhlhe40, Bhlhe41, Bhlha15) may also contribute to the phenotype because the stoichiometry and interactions of BHLH factors have complex roles in limb development (Firulli et al., 2005). Altered levels of BMP responsive targets (Dkk1, Noggin, Grem1, Grem2) in Tbx3;PrxCre mutants suggest disrupted BMP signaling. Overexpression of Gata6 decreases Shh and Grem1 expression and causes loss of posterior digits (Kozhemyakina et al., 2014); we detected increased Gata6 expression in the posterior mesenchyme of Tbx3;PrxCre mutants (Supplementary file 3). Additional studies are needed to determine if Tbx3 transcriptional or post-transcriptional functions directly regulate these pathways.
Although Tbx3 is also present in posterior mesenchymal cilia, we did not detect any evidence of altered stability or processing of Gli3 in the posterior mesenchyme (Figure 4A, representative of three replicates). Nonetheless, it is possible that decreased Shh signaling in the posterior of Tbx3;PrxCre mutant limb buds creates changes in Gli3 levels/ratios below our ability to detect. If so, decreased Shh activity would be predicted to increase Gli3R, decreasing digit number.
It is notable that decreased expression of Tbx2 observed in Tbx3;PrxCre mutants would be predicted to result in increased Grem1 expression (Farin et al., 2013) however, Grem1 expression is decreased (Figure 3). Decreased Shh signaling and Grem1 expression in the posterior mesenchyme would both be predicted to result in decreased Fgf4 and Fgf8 expression in the posterior AER (Khokha et al., 2003; Michos et al., 2004). Rather, the finding that these transcripts are increased in the posterior (Figure 3—figure supplement 4) indicates that loss of Tbx3 in posterior mesenchyme disrupts the Shh-Grem1-FGF signaling loop.
In wild type anterior mesenchyme, our data support the model that Tbx3 is part of a Kif7/Sufu complex that drives processing of the majority of Gli3FL to Gli3R and also prevents complete degradation of Gli3FL by Spop (Wang et al., 2010). Note that our model and data show a marked decrease in Gli3FL (virtually undetectable by western blot in anterior mesenchyme), but residual Gli3R in mutants. This is consistent with the phenotype of Gli3 deficiency, and digit 1 polysyndactyly is also seen with decreased function of Kif7 or Sufu. Residual Gli3R in the mutants is sufficient to prevent the extreme polydactyly seen in complete absence of Gli3, Kif7 or Sufu. In Tbx3;PrxCre mutant limb buds, Kif7 and Sufu proteins are present at normal and increased levels, respectively, but their interaction with each other, and that of Sufu with Gli3, are decreased. Because Spop facilitates processing of Gli3FL to Gli3R in the presence of Sufu, increased levels of Spop in mutants drives complete degradation of any Gli3FL not converted to Gli3R, resulting in undetectable levels of Gli3FL in anterior mesenchyme. The decreased levels of Gli3R in the anterior likely result from a combination of decreased levels of Gli3FL precursor, inefficient processing due to altered Kif7/Sufu function, and excess Gli3R degradation, as evident by the lower molecular weight species present in Figure 3A.
This synthesis is consistent with the large body of published data indicating that anterior digit number is tightly regulated by the balance of Gli3A and Gli3R, in turn controlled by Kif7 and Sufu (Cao et al., 2013; Wang et al., 2000; 2007a; 2007b; Zhulyn et al., 2014). Kif7-/- and other ciliary mutants maintain robust levels of Gli3FL but have a marked decrease in processing it to Gli3R and their PPD phenotypes are consistent with decreased Gli3R (Cheung et al., 2009; Endoh-Yamagami et al., 2009). Furthermore, recent studies from Chi Chung Hui’s group demonstrate that Kif7;PrxCre mutants have anterior PPD and that increasing Gli3R or decreasing Gli activators rescues all but digit 1 duplication (Zhulyn and Hui, 2015).
Tbx3 mutant limbs also display evidence of Sufu dysfunction with markedly decreased levels of Gli3R and absent Gli3FL. Levels of Gli2, Gli3FL and Gli3R are all drastically reduced in Sufu mutants, even in the absence of cilia, consistent with the fact that Spop is not a ciliary protein and drives degradation of the full length proteins in the absence of Sufu (Chen et al., 2009; Jia et al., 2009; Svard et al., 2006; Wang et al., 2010). However, βTrCP and Spop can only mediate processing of Gli3FL to Gli3R in the presence of both Sufu and Kif7/intact cilia/intraflagellar transport (Endoh-Yamagami et al., 2009; Law et al., 2012; Liu et al., 2005; Wang et al., 2010; Wen et al., 2010). This processing is believed to occur at the basal body/centrosome (Ryan and Chiang, 2012; Wang et al., 2013; Wen et al., 2010; Wigley et al., 1999). Thus, our data strongly support that Tbx3 functions at the cilia or basal body, as a part of the complex that regulates Gli3 processing and stability (Ryan and Chiang, 2012; Wen et al., 2010).
Loss of Tbx3 could also influence stability and processing of Gli2. The anterior PPD phenotype of Gli3 heterozygotes is slightly more severe in a Gli2 null background (Bowers et al., 2012; Mo et al., 1997). Gli2 is also expressed in the posterior mesenchyme where it regulates digit patterning but not digit number (Bowers et al., 2012). Bowers’ study also demonstrated that the role of Gli activators is in AP patterning of the posterior limb, whereas Gli repressors regulate digit number and anterior limb AP patterning. This is consistent with our findings that Tbx3 affects anterior digit number by regulating Gli3 repressor stability in the anterior mesenchyme.
The functional significance of increased interaction between Kif7 and Gli3R that we detect in mutants requires additional study nonetheless, since the anterior phenotype of Tbx3;PrxCre mutants is one of Gli3R deficiency rather than absence, we conclude that either there is a pool of Gli3R unbound by Kif7 and/or Gli3R complexed with Kif7 still has repressor function.
In addition to its function as a Gli3R co-repressor, Zic3 also regulates cilia morphogenesis and function (Sutherland et al., 2013). Since decreasing Zic3 levels in Gli3+/- mutants rescues their preaxial polydactyly (Quinn et al., 2012), Zic3 overexpression in Tbx3;PrxCre mutants may contribute to the PPD phenotype.
Our data exclude ectopic Shh pathway activity as a cause of the PPD in Tbx3;PrxCre mutants: using multiple methods at multiple stages, we did not detect anterior Shh, Gli1, or Ptch1 expression in the anterior mesenchyme. Notably, expression of the BMP antagonist Grem1 is normally increased in PPD associated with ectopic anterior Shh pathway activity (Lopez-Rios et al., 2012; Zhang et al., 2009), but in Tbx3 mutants, Grem1 expression is markedly decreased. This is additional evidence in support of unique Tbx3-dependent pathways regulating digit number.
Materials and methods
Mice
Experiments were conducted in strict compliance with IACUC/AALAC standards. The Tbx3flallele was detailed in Frank et al. (2013). Prx1Cre, RARCre and Rosa26LacZ were previously reported (Soriano, 1999; Moon and Capecchi, 2000; Logan et al., 2002). Generation of the Fgf8mcm and Tbx3mcm alleles will be described elsewhere.
β-Galactosidase detection
Request a detailed protocolMales bearing Fgf8MCM or Tbx3MCMalleles were crossed with Rosa26LacZ/+ females. Females were gavaged with tamoxifen (10mg/gm body weight) at stages stated in text. β−galactosidase activity was assayed using established protocols (Park et al., 2006).
Skeletal preparations
Request a detailed protocolE15.5 fetuses were fixed in 4% PFA overnight, rinsed in water for 2 days and alcian blue stained for 30 hr, then cleared in BABB. Older specimens were processed as in Moon et al. (2000).
Whole mount RNA in situ hybridization
Request a detailed protocolDigoxigenin-labeled riboprobes were generated according to manufacturer’s instructions (Roche). Embryos were processed using a standard protocol (Park et al., 2006).
RNA isolation and reverse transcription–qPCR analysis
Request a detailed protocolTotal RNA preparation, cDNA generation and qPCR were carried out as described in Yu et al. (2010). Primer sequences are provided in Supplementary file 5. All qPCRs were performed on a minimum of three biologic replicates of pooled forelimb buds (Figure 3) or anterior and posterior forelimb bud segments (Figure 3—figure supplement 4).
Gene expression analyses by microarray
Request a detailed protocolTotal RNA was prepared from three pools of dissected E10.25 control (Tbx3 fl/+) and Tbx3;PrxCre mutant forelimbs using the RNAeasy Micro Kit (Qiagen 74004). The microarray and genomic analysis and bioinformatics core facilities at the University of Utah performed Agilent mouse whole-genome expression arrays and array image data analysis using Agilent Feature Extraction software. Subtle intensity-dependent bias was corrected with LOWESS normalization, with no background subtraction. Statistical analysis of normalized log-transformed data was performed in GeneSifter (www.genesifter.net). Differentially expressed transcripts were defined (adjusted for multiple testing using the Benjamini and Hochberg method) as p<0.05. The results presented in Supplementary file 1 show transcripts that were statistically differentially expressed +/-1.3 fold in the mutant limb buds; yellow highlighting indicates changes that were replicated by RNA-Seq.
RNA-sequencing to detect differential gene expression
Request a detailed protocolTotal RNA was isolated from pools of dissected anterior and posterior regions of E11 control (Tbx3fl/+) and Tbx3;PrxCre forelimbs using the RNAeasy Micro Kit (Qiagen). Each pool contained 12 forelimbs and two biologic duplicate pools were assayed. cDNA was generated, sequenced, and raw sequence reads were processed as described in Kumar et al. (2014b). Supplementary file 2 contains transcripts that are differentially expressed +/-1.3 fold (+/-0.38 in log base 2, column L) in control anterior (CA) compared to control posterior (CP) limb segments. The transcripts listed in Supplementary file 3 were the result of mining the data to detect differential expression +/-1.3 fold (+/- 0.38 in log base 2, column L) in control posterior (CP) relative to mutant posterior (MP) segments. Supplementary file 4 shows the result of mining the data to detect differential expression +/-1.3 fold (+/-0.38 in log base 2, column L) in control anterior (CA) relative to mutant anterior (MA) limb segments.
Note that transcripts that were not differentially expressed +/-1.3 fold are not listed on the tables. The complete unmined dataset is available on GEO.
Immunoblotting
Request a detailed protocolProtein lysates were prepared from E10.5 dissected limb buds or embryos or cultured MEFs using Dignam buffer. 50 ug of total protein were then subjected to SDS-PAGE analysis followed by immunoblotting according to standard protocols. Primary antibodies: Sufu (#2522, Cell signaling), Spop (#PA5-28522), Myc (#SC-789, Santa Cruz), Flag (#F7425, Sigma), E2F1 (#137415, Abcam), Ubiquitin (#7780, Abcam), Gli3 (AF3690, R and D systems), Tbx3 C-terminal antibody (Frank et al., 2013); Kif7 (ab 95884, Abcam); β tubulin (Santa Cruz).
Immunoprecipitations
Request a detailed protocolImmunoprecipitations were performed as described in Kumar et al., 2014a and 2014b. Briefly, protein lysates were prepared from limb buds or embryos at E10.5 or transfected HEK293 cells using Dignam buffer C. Cleared protein lysates were obtained by centrifugation at 12,000g for 10 min. Equal amounts of protein lysates were incubated with 5–10μg of respective antibodies over night at 4°C with gentle shaking. Immune complexes were isolated with Protein-G Dynal beads and washed three times with Dignam buffer C. Precipitates were eluted from the beads by boiling in SDS-loading dye for 10 min, and analysed by western blotting by standard procedures using indicated antibodies at a dilution of 1:1000.
Densitometry analysis
Request a detailed protocolImmunoblot signals were quantified by densitometry using ImageJ64 software as per the procedure described by Luke Miller (http://www.lukemiller.org/ImageJ_gel_analysis.pdf).
Immunofluorescence of sectioned and intact limb buds
Request a detailed protocolSections: Samples were fixed in 4% PFA at 4°C for 2 hr then washed with 0.3% Triton-X100 (in PBST). Heat retrieval in citrate buffer (Vector Laboratories) was performed for 2 min in a pressure cooker. Slides were washed with PBST and incubated in PBST with 5% serum corresponding to the secondary antibody origin for 1 hr. Slides were incubated with primary antibody in PBST 5% serum overnight at 4°C. Primary antibodies and dilutions: Tbx3 C-terminal antibody 1/200 (Frank et al., 2013), Tbx3 N- terminal antibody 1/100 (Abcam ab99302), Tbx3 internal epitope antibody (Santa Cruz A-20), Arl13b 1/100 (USDavis/NIH NeuroMab Clone N259B/66), Gli3 1/100 (R&D systems AF3690), pHH3 (Ser10), Millipore 06–570(1:2000); (1:50); Kif7 (1:200, kind gift from Dr. C-c Hui). After washing in PBST for 15 min, slides were incubated with secondary antibody from either Invitrogen or Jackson Immunoresearch diluted 1/1000 in PBST 2% BSA with Hoechst 33,342 at 1ug/ml for 1h at room temperature. Final wash was with PBST for 15 min and mounted using Fluoromount-G from Southern Biotech. Secondary antibodies: Donkey anti-rabbit Alexa 488; Donkey anti-goat Alexa 488; Donkey anti-mouse Alexa 647; Donkey anti-goat Alexa 594.
Whole forelimb buds: samples were fixed in 4% PFA for 1 hr at room temperature with PBST. Heat retrieval in citrate buffer (Vector Laboratories) was performed for 5 min at 100°C followed by washing with PBST. Limb buds were incubated in PBST with 5% serum that correspond to the secondary antibody origin (Goat or Donkey) for 2 hr. Limb buds were incubated with primary antibody in PBST with 5% serum overnight at 4°C, then washed with PBST once and incubated in PBST with 2% BSA for 4 hr. Incubated with secondary antibody and Hoechst as above with overnight at 4°C. Prior to imaging, samples were washed with PBST for 4 hrs and incubated in PBS/50% glycerol overnight.
TUNEL: was performed as described in (Park et al., 2006)
Confocal microscopy and image processing of immunofluorescence on intact limb buds
Request a detailed protocolImaging was performed using a Zeiss confocal microscope LSM710 with Zen black imaging software http://www.zeiss.com/microscopy/en_us/downloads/zen.html. 100x objective was used.
To generate the Arl13b/Tbx3 colocalization maps, we used Zen to define pixels in each plane of z that exceeded an arbitrary threshold of 0.1 relative intensity in both Arl13b and Tbx3 channels using the imaging calculation subtab in the image processing menu. This was followed by calculation of the maximum intensity projection. To quantitate Tbx3 positive cilia, the 3D object counter in ImageJ (Bolte and Cordelieres, 2006) was used employing the “redirection” option to superimpose Arl13b+ objects into the Tbx3 channel.
Assaying cilia volume and length
Request a detailed protocolCilia volume was assayed by quantitating Arl13b signal on 100x images of sectioned forelimbs from four pairs of mutant and control embryos stained for Arl13b and analyzing resulting in ImageJ. Imaged were Gaussian blurred using radius equal to '1' and further 3D object counter was used to measure volumes and surface area with threshold of 900 out of 4000 range. Distributions and parameters of the volume distributions shown in Figure 4—figure supplement 2A and B were calculated in Excel.
We calculated that the surface area and volume of both WT and mutant cilia tightly fit the equation: Surface=8.01 X Volume0.69 (Figure 4—figure supplement 2D), which indicates that the cilia shapes are the same in the mutants and controls, and change size proportionally. In this case, the relative change in volume between mutant and control (Volume mutant)/(Volume control)=1.1747, which correspond to a change in length of 6%.
MEF Immunocytochemistry
Request a detailed protocolMEFs from E10.5 embryos were plated on fibronectin coated Matteks. MEFs were cultured and processed as in Kumar et al. (2014a); cilia outgrowth was stimulated by culture in 0.5% FBS for 24 hr followed by incubation with 100 nM SAG or 100 nM SHH (Phoenix Pharmaceuticals) for 24 hr. Cells were washed 2x with PBS and fixed in 4% PFA for 20 min on ice, then washed 2X with PBS and permeabilized with 0.2% Triton X-100 in PBS for 10 min. After blocking in 5% donkey serum + 3% BSA for 1 hr, cells were incubated with anti-TBX3 (custom C-terminal or Santa Cruz sc-17871) and anti-Arl13b (1:50 NeuroMAb) at room temperature for 2 hr. Cells were washed 5 X 5 min in PBS and then incubated in secondary donkey anti-goat-488 or anti-rabbit 488 and donkey antimouse -594 (Jackson Immunoresearch). After washing 3 x 5min in PBS, cells were incubated in DAPI for 20 min. Cells were then washed 3X with PBS and mounted in Dabco for imaging. Images were captured on a Zeiss LSM-710 confocal microscope and processed using Zen software as described above.
Assaying protein interactions with transfected, tagged proteins
Request a detailed protocolHEK-293 cells were grown in DMEM supplemented with 10% fetal bovine serum (FBS) and penicillin/streptomycin. Cells were maintained in 5% C02 incubator at 37°C. Myc- tagged full length TBX3 was generated as previously described (Kumar et al., 2014b). The Flag-tagged Gli3 construct was obtained from Addgene (51246) and the Flag-tagged Kif7 construct was a kind gift of Kathryn Anderson. Transfections of plasmids were performed with Lipofectamine 2000 reagent (Invitrogen) as per the manufacturer’s protocol.
References
-
A guided tour into subcellular colocalization analysis in light microscopyJournal of Microscopy 224:213–232.https://doi.org/10.1111/j.1365-2818.2006.01706.x
-
The roles of Fgf4 and Fgf8 in limb bud initiation and outgrowthDevelopmental Biology 273:361–372.https://doi.org/10.1016/j.ydbio.2004.06.012
-
TBX-3, the gene mutated in Ulnar-Mammary Syndrome, is a negative regulator of p19ARF and inhibits senescenceThe Journal of Biological Chemistry 277:6567–6572.https://doi.org/10.1074/jbc.M110492200
-
Vertebrate limb development: moving from classical morphogen gradients to an integrated 4-dimensional patterning systemCold Spring Harbor Perspectives in Biology 1:a001339.https://doi.org/10.1101/cshperspect.a001339
-
Mouse limbs expressing only the Gli3 repressor resemble those of Sonic hedgehog mutantsDevelopmental Biology 379:221–228.https://doi.org/10.1016/j.ydbio.2013.04.025
-
Manifestation of the limb prepattern: limb development in the absence of sonic hedgehog functionDevelopmental Biology 236:421–435.https://doi.org/10.1006/dbio.2001.0346
-
Valproic acid teratogenicity in whole embryo culture is not prevented by zinc supplementationBiochemical Pharmacology 35:1052–1055.https://doi.org/10.1016/0006-2952(86)90099-7
-
A Smoothened-Evc2 complex transduces the Hedgehog signal at primary ciliaDevelopmental Cell 23:823–835.
-
Lethal arrhythmias in Tbx3-deficient mice reveal extreme dosage sensitivity of cardiac conduction system function and homeostasisProceedings of the National Academy of Sciences of the United States of America 109:E154.https://doi.org/10.1073/pnas.1115165109
-
The primary cilium: a signalling centre during vertebrate developmentNature Reviews. Genetics 11:331–344.https://doi.org/10.1038/nrg2774
-
The molecular basis of Pallister Hall associated polydactylyHuman Molecular Genetics 16:2089–2096.https://doi.org/10.1093/hmg/ddm156
-
Sonic hedgehog: restricted expression and limb dysmorphologiesJournal of Anatomy 202:13–20.https://doi.org/10.1046/j.1469-7580.2003.00148.x
-
Gli proteins in development and diseaseAnnual Review of Cell and Developmental Biology 27:513–537.https://doi.org/10.1146/annurev-cellbio-092910-154048
-
Suppressor of Fused inhibits mammalian Hedgehog signaling in the absence of ciliaDevelopmental Biology 330:452–460.https://doi.org/10.1016/j.ydbio.2009.04.009
-
Sufu recruits GSK3beta for efficient processing of Gli3Biochemical and Biophysical Research Communications 387:569–574.https://doi.org/10.1016/j.bbrc.2009.07.087
-
GATA6 is a crucial regulator of Shh in the limb budPLoS Genetics 10:e1004072.https://doi.org/10.1371/journal.pgen.1004072
-
Spatiotemporal regulation of GLI target genes in the mammalian limb budDevelopmental Biology 406:92–103.https://doi.org/10.1016/j.ydbio.2015.07.022
-
The IFT-a complex regulates Shh signaling through cilia structure and membrane protein traffickingThe Journal of Cell Biology 197:789–800.https://doi.org/10.1083/jcb.201110049
-
Mouse Kif7/Costal2 is a cilia-associated protein that regulates Sonic hedgehog signalingProceedings of the National Academy of Sciences of the United States of America 106:13377–13382.https://doi.org/10.1073/pnas.0906944106
-
Ulnar mammary syndrome and TBX3 : Expanding the phenotypeAmerican Journal of Medical Genetics Part A 149A:2809–2812.https://doi.org/10.1002/ajmg.a.33096
-
TBX2 and TBX3: the special value for anticancer drug targetsBiochimica Et Biophysica Acta 1806:268–274.https://doi.org/10.1016/j.bbcan.2010.07.001
-
Pax9 and Jagged1 act downstream of Gli3 in vertebrate limb developmentMechanisms of Development 122:1218–1233.https://doi.org/10.1016/j.mod.2005.06.012
-
Tbx3 is required for outflow tract developmentCirculation Research 103:743–750.https://doi.org/10.1161/CIRCRESAHA.108.172858
-
Specific and redundant functions of Gli2 and Gli3 zinc finger genes in skeletal patterning and developmentDevelopment 124:113–123.
-
Fgf8 is required for outgrowth and patterning of the limbsNature Genetics 26:455–459.https://doi.org/10.1038/82601
-
T-box genes in vertebrate developmentAnnual Review of Genetics 39:219–239.https://doi.org/10.1146/annurev.genet.39.073003.105925
-
Intraflagellar transport, cilia, and mammalian Hedgehog signaling: analysis in mouse embryonic fibroblastsDevelopmental Dynamics 237:2030–2038.https://doi.org/10.1002/dvdy.21551
-
Complex interactions between genes controlling trafficking in primary ciliaNature Genetics 43:547–553.https://doi.org/10.1038/ng.832
-
Studies of malformation syndromes in man XXXXII: a pleiotropic dominant mutation affecting skeletal, sexual and apocrine-mammary developmentBirth Defects Original Article Series 12:247–254.
-
KIF7 mutations cause fetal hydrolethalus and acrocallosal syndromesNature Genetics 43:601–606.https://doi.org/10.1038/ng.826
-
Preaxial polydactyly caused by Gli3 haploinsufficiency is rescued by Zic3 loss of function in miceHuman Molecular Genetics 21:1888–1896.https://doi.org/10.1093/hmg/dds002
-
Hedgehog secretion and signal transduction in vertebratesThe Journal of Biological Chemistry 287:17905–17913.https://doi.org/10.1074/jbc.R112.356006
-
Autoregulation of Shh expression and Shh induction of cell death suggest a mechanism for modulating polarising activity during chick limb developmentDevelopment 127:4811–4823.
-
Self-regulated left-right asymmetric expression of Pitx2c in the developing mouse limbDevelopmental Biology 395:331–341.https://doi.org/10.1016/j.ydbio.2014.09.002
-
T-box genes in early embryogenesisDevelopmental Dynamics 229:201–218.https://doi.org/10.1002/dvdy.10480
-
Generalized lacZ expression with the ROSA26 Cre reporter strainNature Genetics 21:70–71.https://doi.org/10.1038/5007
-
Zic3 is required in the migrating primitive streak for node morphogenesis and left-right patterningHuman Molecular Genetics 22:1913–1923.https://doi.org/10.1093/hmg/ddt001
-
Multisite protein kinase a and glycogen synthase kinase 3beta phosphorylation leads to Gli3 ubiquitination by SCFbetaTrCPMolecular and Cellular Biology 26:4316–4326.https://doi.org/10.1128/MCB.02183-05
-
Evidence for the direct involvement of {beta}TrCP in Gli3 protein processingProceedings of the National Academy of Sciences of the United States of America 103:33–38.https://doi.org/10.1073/pnas.0509927103
-
Centrosomal protein DZIP1 regulates Hedgehog signaling by promoting cytoplasmic retention of transcription factor GLI3 and affecting ciliogenesisThe Journal of Biological Chemistry 288:29518–29529.https://doi.org/10.1074/jbc.M113.492066
-
A hypermorphic mouse Gli3 allele results in a polydactylous limb phenotypeDevelopmental Dynamics 236:769–776.https://doi.org/10.1002/dvdy.21082
-
TBX3 directs cell-fate decision toward mesendodermStem Cell Reports 1:248–265.https://doi.org/10.1016/j.stemcr.2013.08.002
-
Kinetics of hedgehog-dependent full-length Gli3 accumulation in primary cilia and subsequent degradationMolecular and Cellular Biology 30:1910–1922.https://doi.org/10.1128/MCB.01089-09
-
Dynamic association of proteasomal machinery with the centrosomeThe Journal of Cell Biology 145:481–490.https://doi.org/10.1083/jcb.145.3.481
-
Sufu and Kif7 in limb patterning and developmentDevelopmental Dynamics 244:.https://doi.org/10.1002/dvdy.24249
Article and author information
Author details
Acknowledgements
We thank Drs. Chi-Chung Hui, Cliff Tabin and Kathyrn Anderson for generously providing the Kif7 polyclonal antibody, the Prx1Cre mouse line, and the Flag-tagged Kif7 construct, respectively. We thank Susan Mackem, Steven Vokes and Brian Harfe for helpful discussions and Diana Lim for creating the graphic art. We thank Peter Gallagher for technical assistance.
Ethics
Animal experimentation: This study was performed in strict accordance with the recommendations in the Guide for the Care and Use of Laboratory Animals of the National Institutes of Health. All of the animals were handled according to approved institutional animal care and use committee (IACUC) protocols with WCR IACUC protocol number 203-14.
Version history
- Received: April 2, 2015
- Accepted: March 5, 2016
- Version of Record published: April 5, 2016 (version 1)
Copyright
© 2016, Emechebe et al.
This article is distributed under the terms of the Creative Commons Attribution License, which permits unrestricted use and redistribution provided that the original author and source are credited.
Metrics
-
- 2,398
- views
-
- 509
- downloads
-
- 33
- citations
Views, downloads and citations are aggregated across all versions of this paper published by eLife.
Download links
A two-part list of links to download the article, or parts of the article, in various formats.
Downloads (link to download the article as PDF)
Open citations (links to open the citations from this article in various online reference manager services)
Cite this article (links to download the citations from this article in formats compatible with various reference manager tools)
T-box3 is a ciliary protein and regulates stability of the Gli3 transcription factor to control digit number
eLife 5:e07897.
https://doi.org/10.7554/eLife.07897
Further reading
-
- Computational and Systems Biology
- Developmental Biology
Organisms utilize gene regulatory networks (GRN) to make fate decisions, but the regulatory mechanisms of transcription factors (TF) in GRNs are exceedingly intricate. A longstanding question in this field is how these tangled interactions synergistically contribute to decision-making procedures. To comprehensively understand the role of regulatory logic in cell fate decisions, we constructed a logic-incorporated GRN model and examined its behavior under two distinct driving forces (noise-driven and signal-driven). Under the noise-driven mode, we distilled the relationship among fate bias, regulatory logic, and noise profile. Under the signal-driven mode, we bridged regulatory logic and progression-accuracy trade-off, and uncovered distinctive trajectories of reprogramming influenced by logic motifs. In differentiation, we characterized a special logic-dependent priming stage by the solution landscape. Finally, we applied our findings to decipher three biological instances: hematopoiesis, embryogenesis, and trans-differentiation. Orthogonal to the classical analysis of expression profile, we harnessed noise patterns to construct the GRN corresponding to fate transition. Our work presents a generalizable framework for top-down fate-decision studies and a practical approach to the taxonomy of cell fate decisions.
-
- Developmental Biology
- Evolutionary Biology
Despite rapid evolution across eutherian mammals, the X-linked MIR-506 family miRNAs are located in a region flanked by two highly conserved protein-coding genes (SLITRK2 and FMR1) on the X chromosome. Intriguingly, these miRNAs are predominantly expressed in the testis, suggesting a potential role in spermatogenesis and male fertility. Here, we report that the X-linked MIR-506 family miRNAs were derived from the MER91C DNA transposons. Selective inactivation of individual miRNAs or clusters caused no discernible defects, but simultaneous ablation of five clusters containing 19 members of the MIR-506 family led to reduced male fertility in mice. Despite normal sperm counts, motility, and morphology, the KO sperm were less competitive than wild-type sperm when subjected to a polyandrous mating scheme. Transcriptomic and bioinformatic analyses revealed that these X-linked MIR-506 family miRNAs, in addition to targeting a set of conserved genes, have more targets that are critical for spermatogenesis and embryonic development during evolution. Our data suggest that the MIR-506 family miRNAs function to enhance sperm competitiveness and reproductive fitness of the male by finetuning gene expression during spermatogenesis.


