The autophagy gene Atg16l1 differentially regulates Treg and TH2 cells to control intestinal inflammation
- University of Oxford, United Kingdom
- National Institutes of Health, United States
- King's College London, United Kingdom
- The University of Manchester, United Kingdom
Abstract
A polymorphism in the autophagy gene Atg16l1 is associated with susceptibility to inflammatory bowel disease (IBD); however, it remains unclear how autophagy contributes to intestinal immune homeostasis. Here, we demonstrate that autophagy is essential for maintenance of balanced CD4+ T cell responses in the intestine. Selective deletion of Atg16l1 in T cells in mice resulted in spontaneous intestinal inflammation that was characterized by aberrant type 2 responses to dietary and microbiota antigens, and by a loss of Foxp3+ Treg cells. Specific ablation of Atg16l1 in Foxp3+ Treg cells in mice demonstrated that autophagy directly promotes their survival and metabolic adaptation in the intestine. Moreover, we also identify an unexpected role for autophagy in directly limiting mucosal TH2 cell expansion. These findings provide new insights into the reciprocal control of distinct intestinal TH cell responses by autophagy, with important implications for understanding and treatment of chronic inflammatory disorders.
https://doi.org/10.7554/eLife.12444.001eLife digest
The gut presents a puzzle to our immune system. Immune cells must rapidly respond to antigens produced by harmful bacteria, but food and the beneficial bacteria that inhabit the gut also produce antigens that our immune system must tolerate. Inappropriate immune responses in the gut can lead to inflammatory bowel disease, a debilitating disease with no current cure. We do not fully understand why these harmful inflammatory responses arise, but we know that genetic factors are important. Mutations in genes that affect a process known as autophagy – a pathway that breaks down and recycles unwanted material inside cells – make inflammatory bowel disease more likely to develop, but exactly how they do so remains unclear.
T helper cells are crucial controllers of intestinal immune responses and changes in their numbers and behaviour occur during inflammatory bowel disease. Kabat et al. explored how the autophagy pathway affects these key immune cells in mice. Blocking autophagy in T cells altered the balance of different types of T helper cells in the gut. A crucial population of regulatory T cells, which keep inflammatory responses in check, was lost. At the same time, another population of T cells expanded: the T helper 2 (TH2) cells that are responsible for driving allergies. As a result, the mice developed intestinal inflammation and produced antibodies against gut bacteria and food.
Overall, Kabat et al.’s results show that autophagy defects can alter the balance of different types of T cells in the gut, leading to inflammation in the intestine. These observations contribute to our understanding of how genetic changes may influence susceptibility to inflammatory bowel disease. They also suggest that drugs that activate autophagy could help to treat diseases associated with changes in regulatory T cells or TH2 cells, including inflammatory bowel disease and allergies. It will now be important to test this and to confirm whether similar changes in T cells are present in humans that have mutations in autophagy genes.
https://doi.org/10.7554/eLife.12444.002Introduction
Crohn’s disease (CD) and ulcerative colitis (UC) are the two most common forms of inflammatory bowel disease (IBD), characterized by chronic inflammation of the gastrointestinal tract. IBD is a complex multifactorial disease that emerges on a background of many genetic and environmental factors (Maloy and Powrie, 2011). In recent years, tremendous efforts have been undertaken to identify the genetic factors that influence susceptibility to IBD. In particular, genome-wide association studies (GWAS) and subsequent meta-analyses have identified over 150 distinct loci that influence IBD susceptibility, many of which have revealed novel pathways in disease pathogenesis (Van Limbergen et al., 2014). Among these, a single-nucleotide polymorphism (SNP) in the essential macroautophagy (hereafter called 'autophagy') gene ATG16L1 was associated with an increased risk of CD (Hampe et al., 2007; Rioux et al., 2007). A recent study showed that the IBD predisposing T300A mutation in the coding region of ATG16L1 led to increased degradation of ATG16L1 protein and reduced autophagy (Murthy et al., 2014), indicating that decreased autophagy may contribute to IBD development. Polymorphisms in several other autophagy-related genes, including IRGM, LRRK2 and SMURF1, are also linked to IBD susceptibility (Van Limbergen et al., 2014), suggesting that changes in the autophagy pathway alter intestinal homeostasis and predispose to chronic intestinal inflammation.
Autophagy is a highly conserved cellular process that targets cytoplasmic components for lysosomal degradation and maintains homeostasis by recycling damaged organelles and large cytoplasmic protein aggregates. Autophagy becomes particularly important during metabolic or infectious stress (Mizushima, 2007). Atg16l1 forms an essential autophagy complex with Atg5 and Atg12 that facilitates elongation of the initial isolation membrane that results in engulfment of the cargo and formation of the autophagosome. Subsequent fusion with the lysosome facilitates degradation and allows nutrient recycling (Mizushima et al., 2003). To identify the mechanisms through which autophagy may regulate intestinal tissue homeostasis, it is essential to understand the functional consequences of alterations in autophagy on both immune and tissue cells present in the gut. To date, several studies have examined the role of autophagy and Atg16l1 in intestinal epithelial cells and myeloid cells for intestinal homeostasis. In these studies, Atg16l1 was shown to play a role in Paneth cell physiology, as well as in bacterial handling and regulation of inflammatory IL-1β secretion by myeloid cells (Cadwell et al., 2008; Kuballa et al., 2008; Saitoh et al., 2008; Plantinga et al., 2011). However, the role of Atg16l1 in intestinal adaptive immune responses has not yet been addressed.
CD4+ T cells constitute the largest population of intestinal lymphocytes and are central mediators of host protective and tolerogenic responses in the gut (Shale et al., 2013). In particular, thymus-derived and peripherally induced Foxp3+ CD4+ regulatory T cells (tTreg and pTreg cells, respectively) are indispensable in promoting tolerance toward commensal and dietary antigens and for the prevention of aberrant effector T cell responses, including TH1, TH2 and TH17 cell responses (Izcue et al., 2009). An imbalance between effector and regulatory CD4+ T cells can promote chronic intestinal inflammation and accumulation of effector CD4+ T cells in the inflamed mucosa is a cardinal feature of IBD (Abraham and Cho, 2009; Maloy and Powrie, 2011; Shale et al., 2013). Therefore, it is important to define factors that regulate aberrant CD4+ T cell responses in the gastrointestinal tract.
Previous studies utilizing mice with T-cell-specific deletion of essential autophagy genes (Atg3, Atg5, Atg7, Beclin1) pointed to a key role of autophagy in T cell homeostasis, as these mice exhibited decreased frequencies and numbers of CD4+ and CD8+ T cells and defects in T cell proliferation in vitro (Pua et al., 2009; Stephenson et al., 2009; Jia and He, 2011; Kovacs et al., 2012). In addition, recent studies highlighted the importance of autophagy in the development of memory CD8+ T cells (Puleston et al., 2014; Xu et al., 2014; Schlie et al., 2015). However, the exact requirements for autophagy during different stages of T cell activation and differentiation remain poorly understood (Xu et al., 2014). Given that the gastrointestinal tract is a site of continuous immune activation by external antigens and is therefore a challenging environment for the adaptive immune system, we hypothesized that a selective defect in autophagy may affect intestinal T cell homeostasis.
We investigated the role of Atg16l1 in intestinal CD4+ T cells by generating mice that selectively lack Atg16l1 in T cells. Here, we show that T-cell-specific deletion of Atg16l1 results in chronic intestinal inflammation accompanied by increased humoral responses toward commensal and dietary antigens. We further demonstrate that Atg16l1-deficiency has opposing effects on intestinal CD4+ T cells subsets; markedly enhancing TH2 responses whilst decreasing Treg cell numbers. Through selective ablation of Atg16l1 in Treg cells, we established the importance of cell-intrinsic autophagy for intestinal Treg cell homeostasis. Furthermore, through complementary in vivo approaches we show that autophagy controls TH2 responses through two distinct mechanisms; through a cell-intrinsic pathway and by promoting extrinsic regulation by Treg cells.
Results
Selective deletion of Atg16l1 in T cells results in spontaneous intestinal pathology
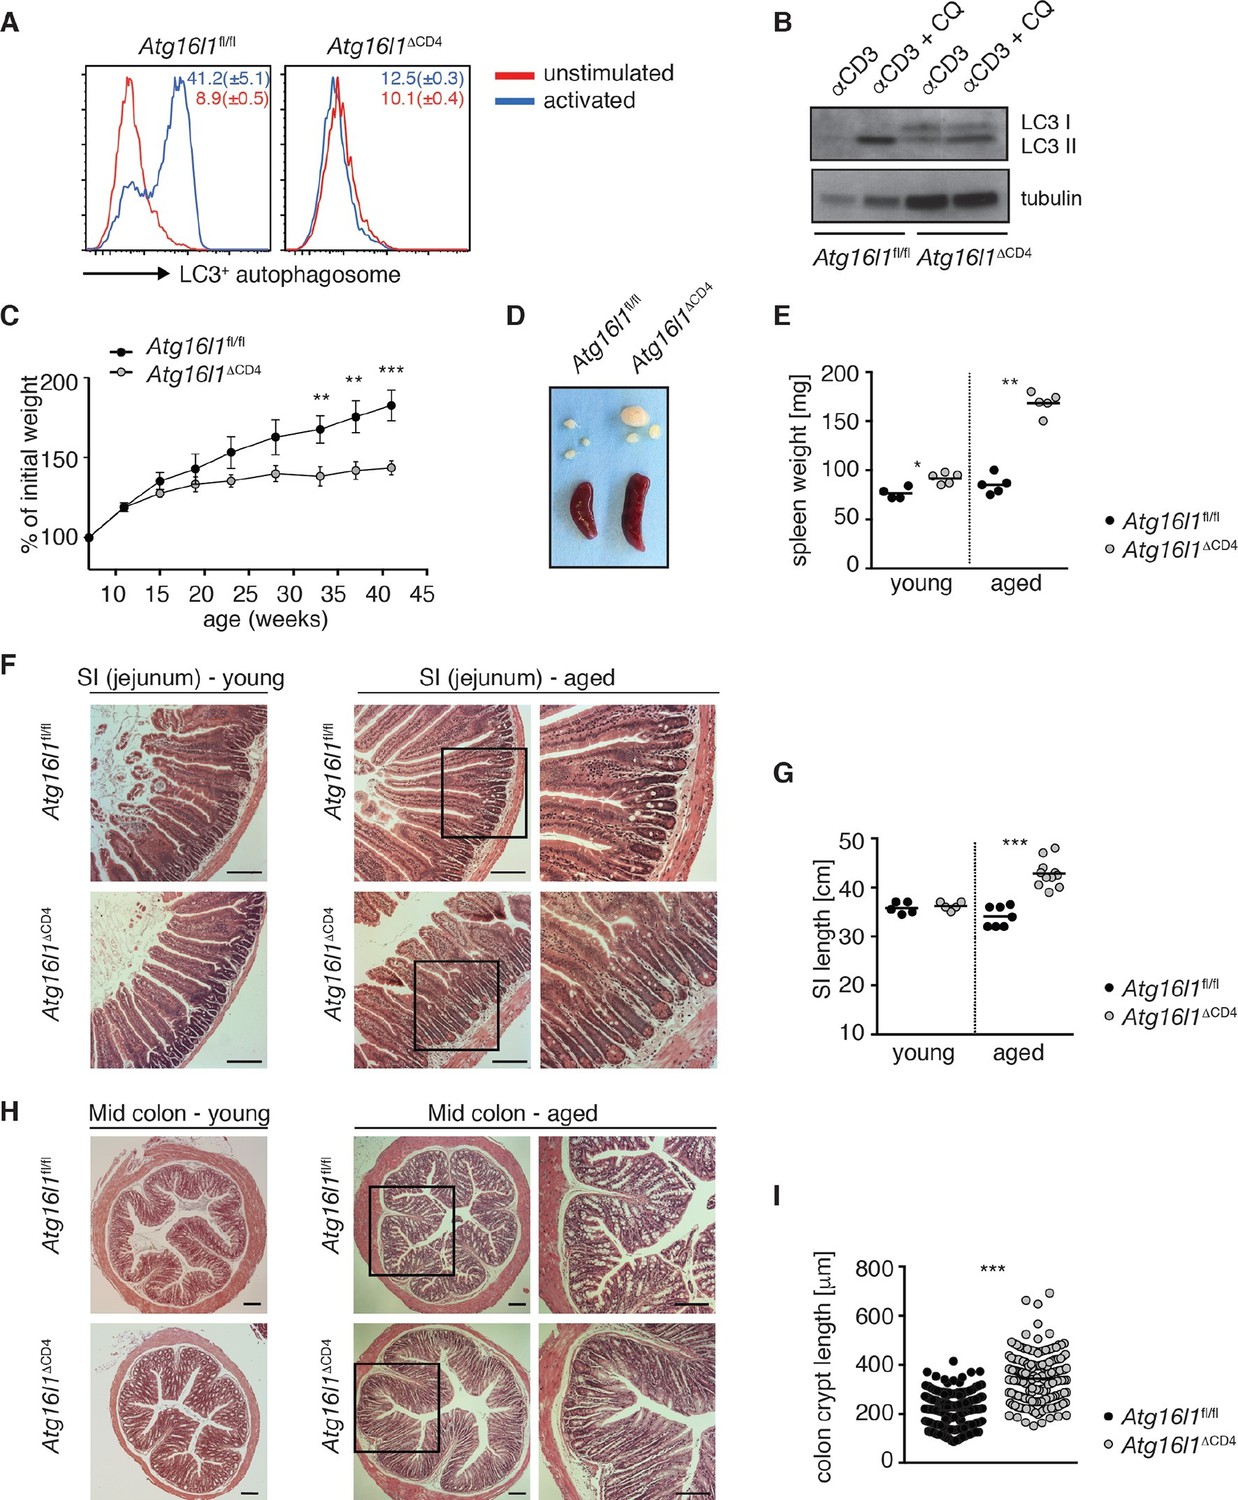
To investigate the role of autophagy in intestinal T cell homoeostasis, mice carrying loxP-flanked alleles of the essential autophagy gene Atg16l1 (Atg16l1fl/fl) (Hwang et al., 2012) were crossed with CD4-Cre mice, generating Atg16l1fl/fl::CD4-Cre mice (hereafter denoted as Atg16l1ΔCD4) in which Atg16l1 is selectively ablated in T cells from the double-positive stage of thymic development. To verify functional deletion of Atg16l1 autophagy levels were analyzed by autophagosome formation and LC3 lipidation. CD4+ T cells isolated from control Atg16l1fl/fl mice exhibited increased LC3+ autophagosome formation after activation, as measured by intracellular LC3 accumulation in the presence of a lysosomal inhibitor (Figure 1A). In contrast, there was no increase in intracellular LC3 accumulation in CD4+ T cells from Atg16l1ΔCD4 mice (Figure 1A). To verify this finding using another method, we assessed LC3 lipidation by Western blot analysis (Klionsky et al., 2012). Activated control Atg16l1fl/fl CD4+ T cells exhibited increased lipidated LC3 II levels in the presence of chloroquine, indicative of autophagy-mediated turnover of LC3 II after T cell activation (Figure 1B). However, LC3 II levels in CD4+ T cells from Atg16l1ΔCD4 mice were barely affected by activation (Figure 1B), confirming a block in autophagy.
Figure 1
Aged Atg16l1ΔCD4 mice develop intestinal inflammation.
(A) FACS analysis of LC3+ autophagosome formation in CD4+ T cells from cLP of Atg16l1ΔCD4 and Atg16l1fl/fl mice after overnight activation with or without α-CD3 (5 μg/ml) and α-CD28 (1 μg/ml). (B) Western blot analysis of LC3 lipidation in naïve splenic CD4+ T cells isolated from Atg16l1ΔCD4 mice and Atg16l1fl/fl mice after 3hr activation with α-CD3 (5 μg/ml) and α-CD28 (1 μg/ml) with or without chloroquine (CQ, inhibitor of lysosomal degradation, 50 μM). (C) Weight curves of Atg16l1ΔCD4 and Atg16l1fl/fl littermates. (D) Representative images of spleens and mesenteric lymph nodes (mLN) from aged Atg16l1ΔCD4 and Atg16l1fl/fl littermates and (E) spleen weights of young and aged Atg16l1ΔCD4 and Atg16l1fl/fl littermates. (F,H) Representative photomicrographs of haemotoxilin and eosin (H&E) stained sections of (F) jejunum and (H) mid-colon from young and aged Atg16l1ΔCD4 and Atg16l1fl/fl littermates, scale bar 150 μm. (G,I) Quantification of (G) SI lengths and (I) mid-colon crypt lengths in aged Atg16l1ΔCD4 and Atg16l1fl/fl littermates. Data are representative of at least three independent experiments (A-E, F, H) or combined from two (G) or three (I) independent experiments, with at least 3 mice per group. Data shown as mean ± s.e.m (A,C). Each dot represents an individual mouse and horizontal bars denote means (E,G). In (I) each dot represents an individual crypt measurement and horizontal bars denote means. Statistical significance was determined using two-way analysis of variance (ANOVA) with Bonferroni’s correction for multiple comparisons (C) or the Mann–Whitney test (E,G,I), **p<0.01; ***p<0.001. SI LP– small intestine lamina propria, cLP – colonic lamina propria. Young mice: 8–12 weeks old, aged mice >5 months old.
Young Atg16l1ΔCD4 mice appeared normal, initially gained weight in a manner comparable to Atg16l1fl/fl littermates and exhibited normal intestinal morphology (Figure 1C,F-H). However, from around 5 months of age, Atg16l1ΔCD4 mice stopped gaining weight (Figure 1C), developed splenomegaly and lymphadenopathy (Figure 1D,E) and chronic intestinal pathology that progressed with age (Figure 1F–I). Atg16l1ΔCD4 mice exhibited significant inflammation of both the small intestine (SI) and colon, characterized by increased SI length, marked lengthening of crypts, shortening of villi and epithelial hyperplasia (Figure 1F–I). Thus, T-cell-specific Atg16l1 deletion resulted in spontaneous intestinal inflammation and systemic immune activation.
Atg16l1 deficiency has opposing effects on intestinal Treg and TH2 cells
To characterize the effects of Atg16l1 on intestinal and systemic T cell homeostasis independently from any confounding effects of ongoing tissue inflammation, we analyzed young (8–12 weeks old) Atg16l1ΔCD4 mice before the onset of inflammatory pathology or systemic symptoms. Whilst thymic T cell production was unperturbed in Atg16l1ΔCD4 mice (Figure 2—figure supplement 1A,B), frequencies of CD4+ and CD8+ T cells in peripheral lymphoid organs were significantly decreased compared to Atg16l1fl/fl littermates (Figure 2A and Figure 2—figure supplement 1C). Furthermore, we observed significant decreases in intestinal T cell frequencies and numbers in the cLP and SI LP of Atg16l1ΔCD4 mice (Figure 2A and Figure 2—figure supplement 1D). As CD4+ T cells are the main drivers and regulators of chronic intestinal inflammation (Shale et al., 2013), we focused subsequent analyses on CD4+ T cells.
Figure 2 with 4 supplements see all
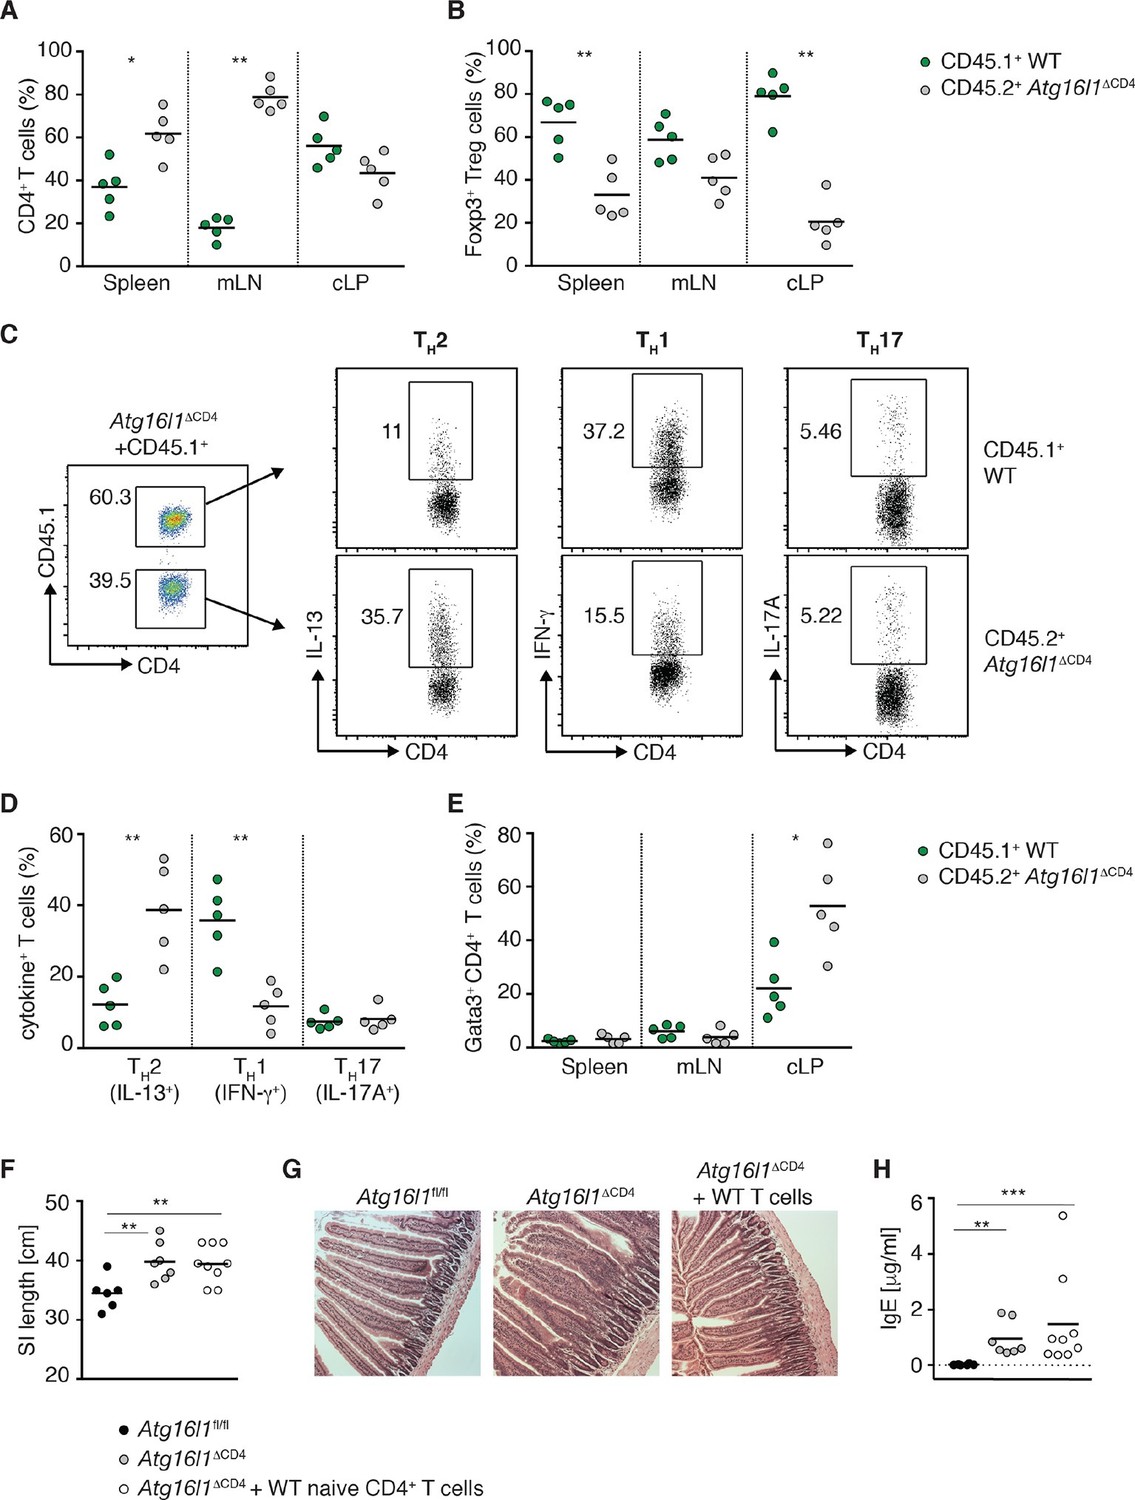
Atg16l1ΔCD4 mice exhibit reciprocal dysregulation of intestinal TH2 and Treg cells before the onset of intestinal inflammation.
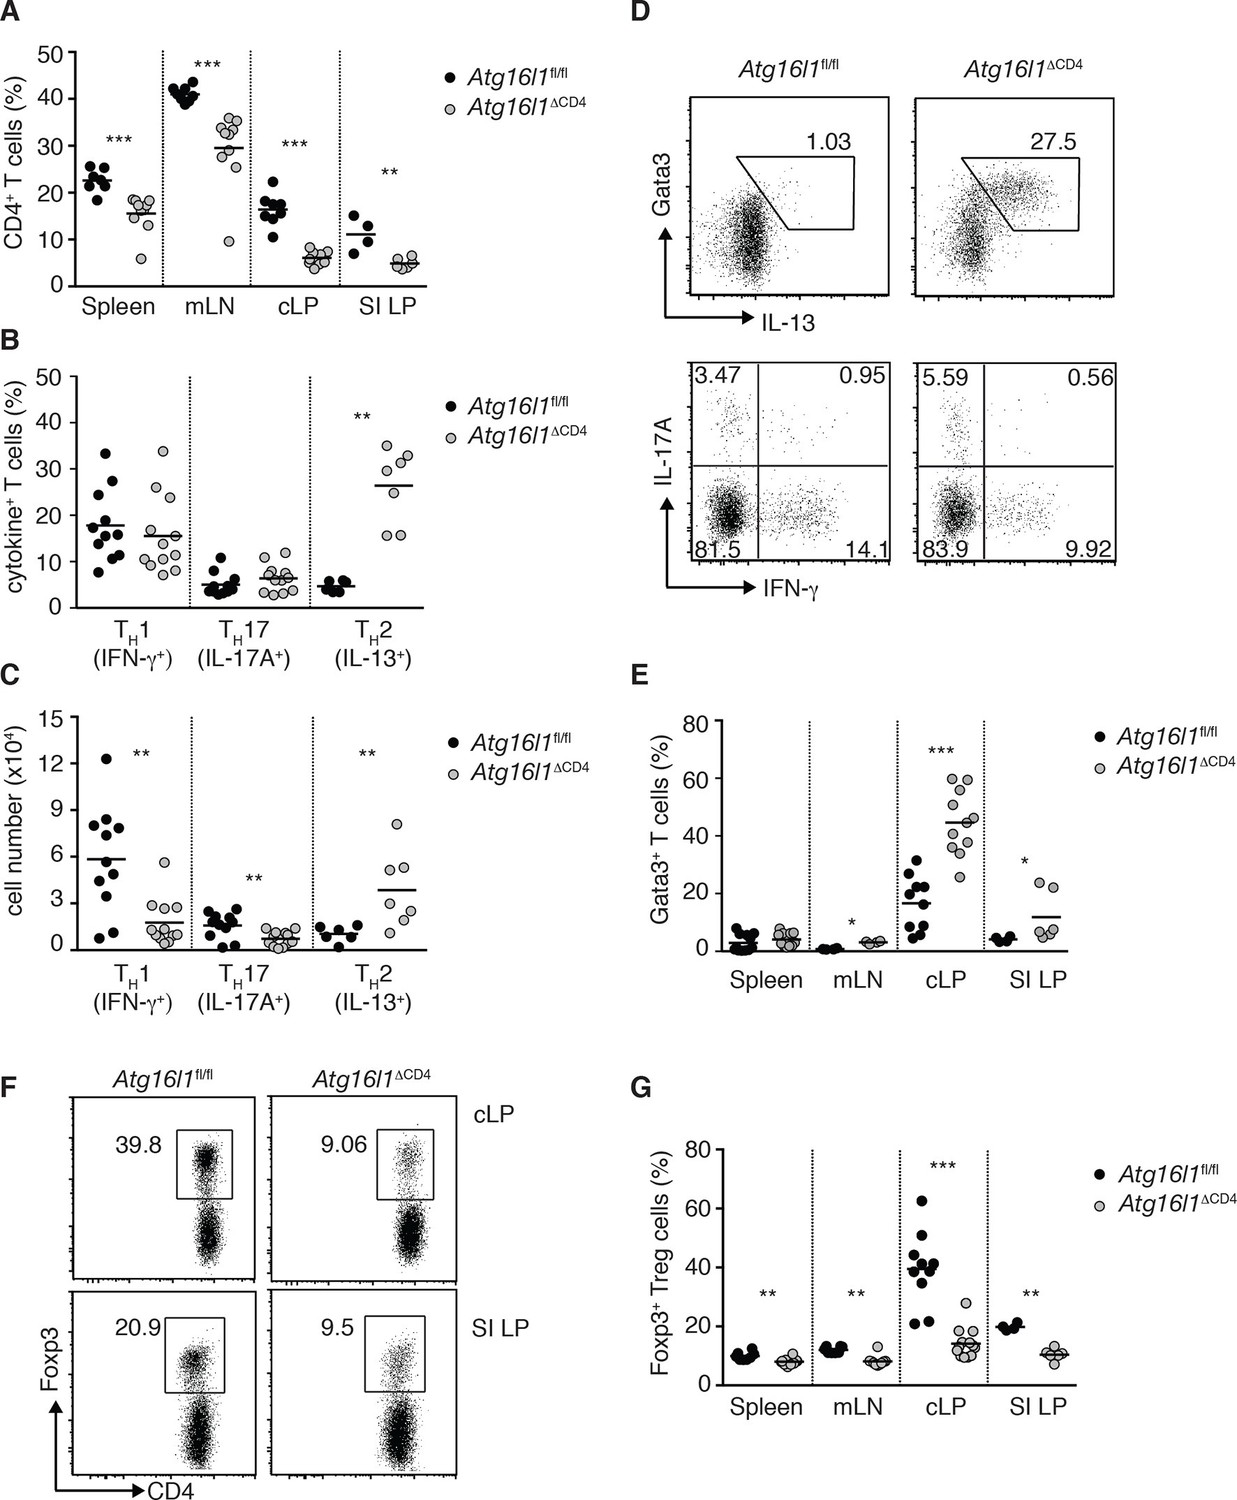
(A) Frequencies of CD4+ T cells as a proportion of live cells in young Atg16l1ΔCD4 and Atg16l1fl/fl littermates. (B) Frequencies and (C) total numbers of IFN-γ+ TH1, IL-17A+ TH17 and IL-13+ TH2 cells isolated from cLP of young Atg16l1ΔCD4 and Atg16l1fl/fl littermates (gated on CD4+ T cells). (D) Representative FACS plots of Gata3 and IL-13 (top) or IFN-γ and IL-17A (bottom) expression by cLP CD4+ T cells isolated from young Atg16l1ΔCD4 and Atg16l1fl/fl littermates (gated on CD4+ TCRβ+ Foxp3- live cells). (E) Frequencies of Gata3+ CD4+ T cells in young Atg16l1ΔCD4 and Atg16l1fl/fl littermates (gated on CD4+ TCRβ+ Foxp3- cells). (F) Representative FACS plots and (G) frequencies of Foxp3+ Treg cells in young Atg16l1ΔCD4 and Atg16l1fl/fl littermates (gated on CD4+ TCRβ+ cells). Data are combined from three or more independent experiments with at least two mice per group (A,B, D, E, G) or are representative of four independent experiments with at least four mice per group (D, F). Each dot represents an individual mouse and horizontal bars denote means. Numbers indicate percentage of cells in gates or quadrants. Statistical significance was determined using the Mann–Whitney test, *p<0.05; **p<0.01; ***p<0.001. SI LP– small intestine lamina propria, cLP – colonic lamina propria. Young mice: 8–12 weeks old.
Despite reduced numbers of T cells, Atg16l1ΔCD4 mice developed exacerbated disease in a CD4+ T cell-mediated model of IBD, indicating that Atg16l1-deficient CD4+ T cells are capable of driving intestinal inflammation (Figure 2—figure supplement 2). Analysis of the effector CD4+ T cell compartment in Atg16l1ΔCD4 mice revealed that frequencies of colonic TH1 (IFN-γ+) and TH17 (IL-17A+) populations were comparable in young Atg16l1ΔCD4 mice and Atg16l1fl/fl littermates (Figure 2B,D), although, due to decreased colonic CD4+ T cell numbers, total TH1 and TH17 numbers were significantly decreased (Figure 2C). Conversely, both frequencies and total numbers of TH2 (IL-13+) cells were significantly increased in cLP of young Atg16l1ΔCD4 mice (Figure 2B–D). These IL-13-producing cells were bona fide TH2 cells, as they co-expressed the lineage-specifying transcription factor Gata3 (Figure 2D,E). Interestingly, TH2 cell accumulation was primarily observed in the intestinal mucosa of Atg16l1ΔCD4 mice, as TH2 cell frequencies were only marginally increased in the mLN and remained unchanged in the spleen (Figure 2E). However, the functional consequences of TH2 expansion extended beyond the intestine, as Atg16l1ΔCD4 mice had increased frequencies of eosinophils in both the spleen and mLN and elevated serum levels of mast cell protease 1 (MCPT-1), a marker of intestinal mast cell activation (Figure 2—figure supplement 3A,B).
As Foxp3+ Treg cells play a non-redundant role in control of effector T cells and the development of intestinal inflammation (Izcue et al., 2009), we hypothesized that alterations in Tregs might underlie the spontaneous intestinal pathology that developed in aged Atg16l1ΔCD4 mice. Indeed, we found that the frequencies of intestinal Foxp3+ Treg cells in young Atg16l1ΔCD4 mice were severely reduced, both in the SI and cLP (Figure 2F,G). Taking into account the decreased frequencies of CD4+ T cells in Atg16l1ΔCD4 mice (Figure 2A), this equated to a reduction in Treg cell numbers by around 10-fold in the colonic LP and 4-fold in SI LP (Figure 2—figure supplement 4A). In contrast, thymic development of Foxp3+ Treg cells was not diminished in young Atg16l1ΔCD4 mice (Figure 2—figure supplement 4B), and we observed only minor, though significant, reductions in the frequencies and absolute numbers of Foxp3+ Treg cells in the spleen and mLN of Atg16l1ΔCD4 mice compared with Atg16l1fl/fl littermates (Figure 2G and Figure 2—figure supplement 4A). Thus, Atg16l1-deficiency profoundly affected the maintenance of Foxp3+ Treg cells in the periphery, particularly within the intestinal mucosa. Expression of neuropilin-1 (Nrp1) and Helios, putative markers proposed to distinguish pTreg and tTreg cells, were found at comparable levels on intestinal Foxp3+ Treg cells from Atg16l1fl/fl and Atg16l1ΔCD4 mice, suggesting that the local environment, rather than site of Treg induction, primarily dictates the requirement for autophagy in Treg cells (Figure 2—figure supplement 4C,D). Assessment of how Atg16l1-deficiency affected intestinal Foxp3+ Treg cell phenotype showed that impaired autophagy significantly increased expression of effector TH cytokines in Treg cells from cLP and SI LP (Figure 2—figure supplement 4E). We also found that cLP Treg cells from young Atg16l1ΔCD4 mice showed higher expression of CD103 and CTLA-4, but showed decreased expression of the activation markers CD25, CD69, and the terminal differentiation marker KLRG-1 (Cheng et al., 2012) (Figure 2—figure supplement 4F). In addition, intestinal Treg cells from young Atg16l1ΔCD4 mice had significantly increased expression of Ki67 and higher levels of phosphorylated S6, suggesting that the majority were in cell cycle (Figure 2—figure supplement 4G–I). Taken together, these results identify a crucial role for autophagy in the maintenance and functional regulation of intestinal Treg cells.
Overall, these results demonstrate that selective ablation of Atg16l1 in T cells led to a decrease in Foxp3+ Treg cells and selective expansion of TH2 cells that preceded the onset of overt pathology. In addition, these perturbations in TH cell subsets were largely limited to the mucosal environment.
Atg16l1ΔCD4 mice exhibit elevated type 2 humoral responses to environmental antigens
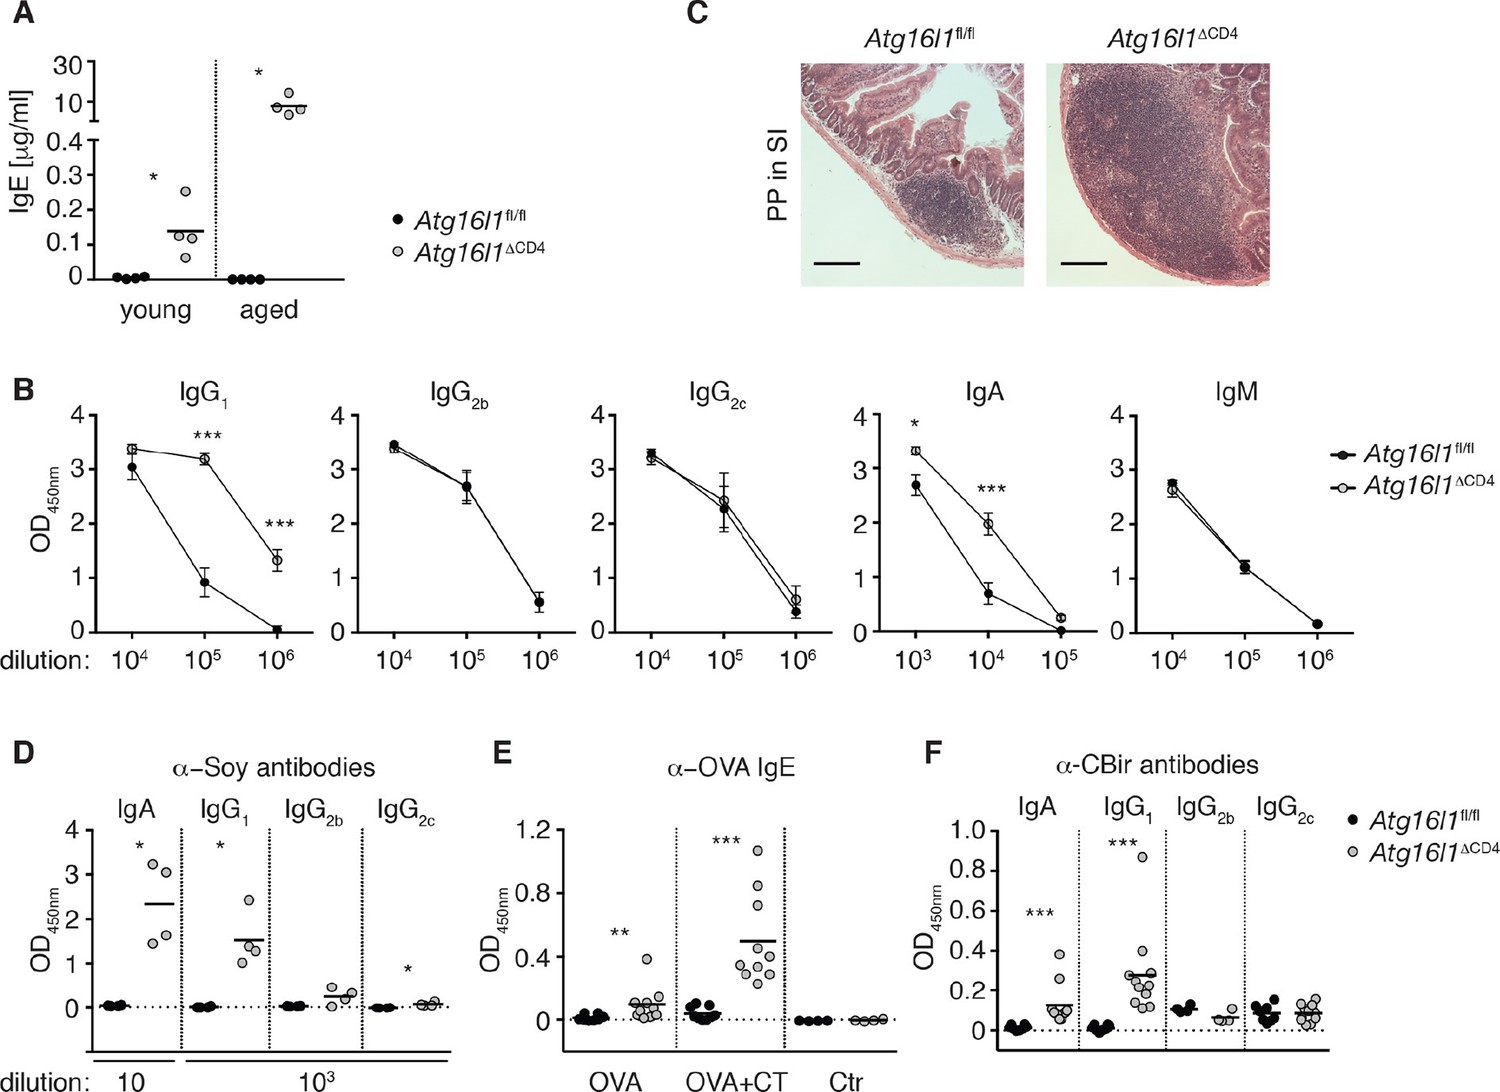
We next assessed whether dysregulation in the intestinal Treg and TH2 compartment in Atg16l1ΔCD4 mice affected humoral responses. While at the limit of detection in Atg16l1fl/fl controls, serum IgE concentrations were significantly elevated in young Atg16l1ΔCD4 mice and increased further as the mice aged (Figure 3A). Furthermore, levels of serum IgA and IgG1 in young Atg16l1ΔCD4 mice were also significantly elevated relative to Atg16l1fl/fl littermates (Figure 3—figure supplement 1A) and again increased as the Atg16l1ΔCD4 mice aged (Figure 3B). In contrast, levels of isotypes not associated with TH2 help were identical in aged Atg16l1ΔCD4 mice and Atg16l1fl/fl littermates (Figure 3B). Thus, there was a progressive dysregulation of TH2-associated antibody responses in Atg16l1ΔCD4 mice. Consistent with these elevated humoral responses, young Atg16l1ΔCD4 mice had higher frequencies of germinal center (GC), memory B cells and plasma cells in the spleen and mLN compared to Atg16l1fl/fl littermates (Figure 3—figure supplement 1B) and markedly enlarged Peyer’s patches were observed in aged Atg16l1ΔCD4 mice (Figure 3C).
Figure 3 with 1 supplement see all
Atg16l1ΔCD4 mice develop elevated TH2-associated antibodies against intestinal luminal antigens.
(A) Serum IgE concentrations in cohorts of young and aged Atg16l1ΔCD4 and Atg16l1fl/fl littermates were measured by ELISA. (B) Serum antibody IgG1, IgG2b, IgG2c, IgA and IgM isotype levels in aged Atg16l1ΔCD4 and Atg16l1fl/fl littermates were measured by ELISA. (C) Representative photomicrographs of H&E stained sections of Peyer’s patch (PP) in the SI (jejunum) of aged Atg16l1ΔCD4 and Atg16l1fl/fl littermates, scale bar 150 μm. (D) Serum levels of Soy-specific IgA, IgG1, IgG2b, IgG2c antibodies in aged Atg16l1ΔCD4 and Atg16l1fl/fl littermates were measured by ELISA. (E) Young Atg16l1ΔCD4 and Atg16l1fl/fl littermates were fed with ovalbumin (OVA) alone or with cholera toxin (CT) as described in methods and levels of OVA-specific serum IgE were measured 8 weeks after first challenge by ELISA. (F) Levels of CBir1-specific IgA, IgG1, IgG2b and IgG2c antibodies in serum of aged Atg16l1ΔCD4 and Atg16l1fl/fl littermates were measured by ELISA, serum was diluted 50x. Data are representative from at least two independent experiments with at least three mice per group (A-D) or combined from two (E) or three (F) independent experiments with at least three mice per group. Each dot represents an individual mouse and horizontal bars denote means (A,D,E,F). Serum isotype levels are shown as mean ± s.e.m (B). Statistical significance was determined using the Mann–Whitney test (A,D-F) or two-way analysis of variance (ANOVA) with Bonferroni’s correction for multiple comparisons (B), *p<0.05; **p<0.01; ***p<0.001. SI – small intestine. Young mice: 8–12 weeks old, aged mice > 5 months old.
Multiple studies have demonstrated the critical role played by Foxp3+ Treg cells in immune tolerance to dietary and microbial antigens within the intestine. Furthermore, changes in intestinal Treg and TH2 responses are associated with food hypersensitivities (Berin and Sampson, 2013). We hypothesized that the aberrant humoral responses in Atg16l1ΔCD4 mice might be directed against luminal antigens. Soy is the main protein source in chow, and we detected high levels of anti-soy IgG1 and IgA in sera from aged Atg16l1ΔCD4 mice, whereas these responses were undetectable in control Atg16l1fl/fl littermates (Figure 3D). By contrast, we only detected marginal levels of soy-specific IgG2b or IgG2c in aged Atg16l1ΔCD4 sera (Figure 3D). Importantly, elevated anti-soy IgG1 and IgA antibodies were already present in sera from young Atg16l1ΔCD4 mice, before the onset of intestinal inflammation (Figure 3—figure supplement 1C). Despite the very high levels of total serum IgE in aged Atg16l1ΔCD4 mice, we did not detect elevated levels of anti-soy IgE (data not shown). The absence of soy-specific IgE could be due to the inhibiting effects of persistent exposure to high-dose antigens on IgE responses (Sudowe et al., 1997; Riedl et al., 2005). Therefore, to test whether an IgE response was mounted during transient exposure to low-dose dietary antigens, we fed young Atg16l1ΔCD4 and Atg16l1fl/fl mice with ovalbumin (OVA), either alone or in combination with the mucosal adjuvant cholera toxin (CT). As expected, anti-OVA IgE responses were undetectable in control Atg16l1fl/fl mice fed OVA alone and were only marginally increased by co-administration of CT (Figure 3E). In contrast, Atg16l1ΔCD4 mice exhibited significantly elevated levels of anti-OVA IgE after being fed OVA alone and developed >10-fold higher levels of OVA-specific IgE after feeding of OVA with CT (Figure 3E). Together, these results indicate that Atg16l1ΔCD4 mice displayed aberrant TH2-associated antibody responses towards otherwise innocuous dietary protein antigens.
Besides food antigens, the intestinal lumen harbors vast quantities of commensal-derived antigens. Thus, we measured antibodies directed against the flagellin antigen CBir1, produced by commensal bacteria belonging to Clostridia cluster XIVa, as antibodies against flagellin are readily detected in sera of IBD patients (Lodes et al., 2004). We detected significantly higher levels of CBir1-specific IgG1 and IgA in the serum of aged Atg16l1ΔCD4 mice compared to control Atg16l1fl/fl littermates, whereas anti-CBir1 IgG2b and IgG2c levels were comparable (Figure 3F). Furthermore, CBir1-specific IgG1 and IgA were already detectable in young Atg16l1ΔCD4 mice (data not shown). In contrast, increased TH2 cell-associated antibody responses were not mounted in young Atg16l1ΔCD4 mice following oral infection either with the Gram-negative bacterium Helicobacter hepaticus or with the nematode parasite Trichuris muris (Figure 3—figure supplement 1D,E). Taken together, these results indicate that the abnormal TH2-associated antibody responses observed in Atg16l1ΔCD4 mice preceded the development of overt inflammation and were selectively induced towards commensal microbiota and dietary antigens.
Atg16l1 differentially regulates survival of TH2 and Treg cells
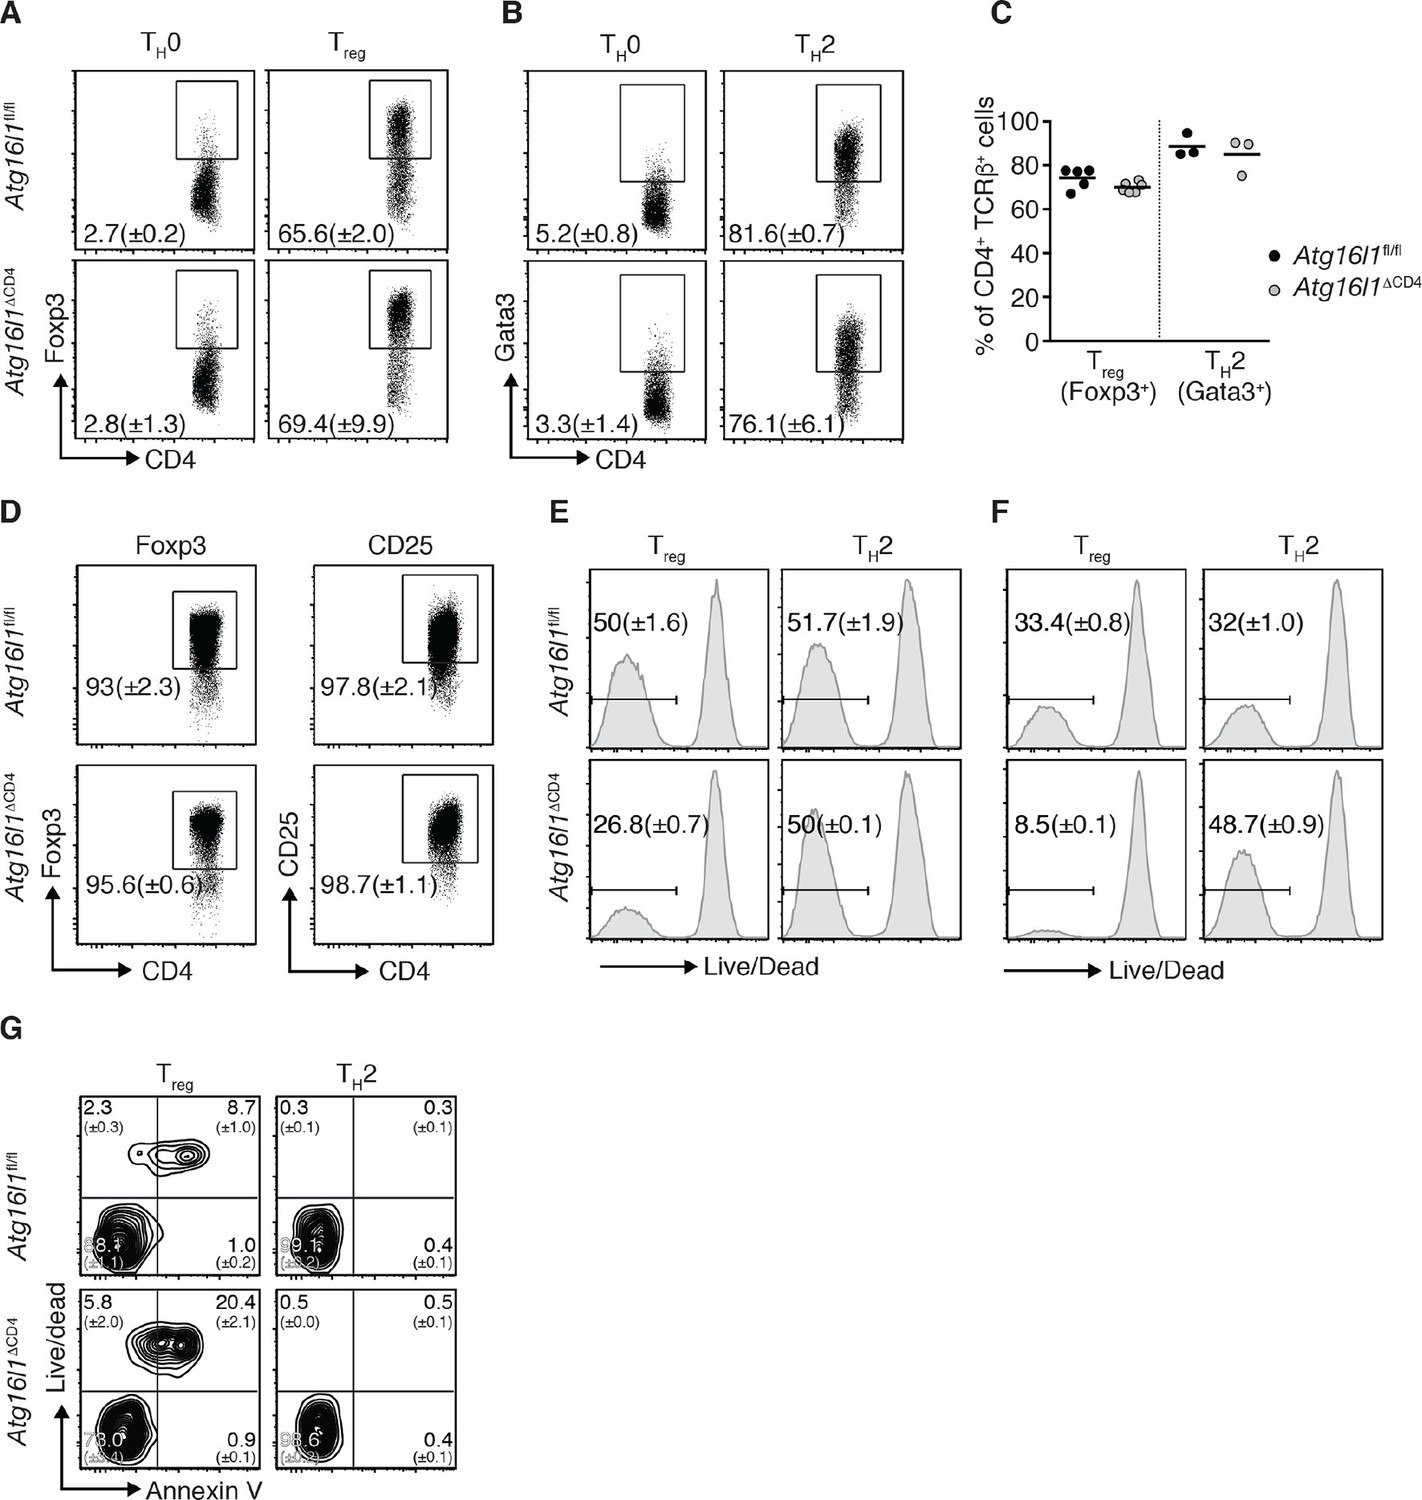
Given apparent opposing effects of Atg16l1 deficiency on TH2 and Treg cells, we questioned whether the disruption of autophagy pathway affects the differentiation of these T cell subsets. We found that, under TH2 or Treg polarizing conditions, differentiation of naïve CD4+ T cells isolated from Atg16l1ΔCD4 or Atg16l1fl/fl littermates toward the Gata3+ TH2 or Foxp3+ Treg cell phenotype was comparable (Figure 4A–C). As TH2 cytokines can negatively affect Treg differentiation and stability (Dardalhon et al., 2008; Feng et al., 2014), it was possible that outgrowth of TH2 cells may also have contributed to the loss of intestinal Treg in Atg16l1ΔCD4 mice. We therefore isolated Foxp3+ Treg cells from Atg16l1ΔCD4 and Atg16l1fl/fl littermates and activated them in vitro in the presence of IL-4 and IL-13. However, we did not find any evidence of Treg instability, as expression of Foxp3 and CD25 remained equally high in Atg16l1-deficient and WT Treg cells (Figure 4D).
Figure 4
Atg16l1 promotes survival of Treg cells and limits TH2 cell survival.
(A,B) Atg16l1ΔCD4 or Atg16l1fl/fl naïve CD4+ T cells were cultured in TH0, Treg, or TH2 polarizing conditions for 48 hr and analyzed by FACS. Representative FACS plots show (A) Foxp3 and (B) Gata3 expression (gated on CD4+ TCRβ+ T cells). (C) Frequencies of Treg cells (Foxp3+) and TH2 cells (Gata3+) arising from Atg16l1ΔCD4 or Atg16l1fl/fl naïve CD4+ T cells cultured in Treg or TH2 polarizing conditions for 5 days. (D) Atg16l1ΔCD4 or Atg16l1fl/fl Treg cells were cultured with anti-CD3 (3 μg/ml) and anti-CD28 (1 μg/ml) for 48 hr, then maintained in the presence of IL-4 and IL-13 for a further 5 days before FACS analysis of Foxp3 and CD25 expression of live CD4+ T cells. (E,F) Naïve Atg16l1ΔCD4 or Atg16l1fl/fl CD4+ T cells were cultured with (E) 1 μg/ml or (F) 5 μg/ml anti-CD3 plus anti-CD28 (1 μg/ml) for 48 hr in Treg or TH2 polarizing conditions, then maintained in polarizing conditions for a further 5 days before FACS analysis of cell survival. Histograms show gates and frequencies of live CD4+ T cells. (G) Representative FACS plots of viability dye and Annexin V staining of Treg cells and TH2 cells from the cLP of young Atg16l1ΔCD4 and Atg16l1fl/fl littermates, gated on CD4+ TCRβ+ Foxp3+ (left panel), or CD4+ TCRβ+ Gata3+ (right panel). Data are representative from two (D,G) or three independent experiments (A,B,E,F), or are combined from three independent experiments (C). Each dot represents an individual cell culture (C) or data are shown as mean ± s.e.m (A,B,D-F). Numbers indicate percentage of cells in quadrants (G). cLP – colonic lamina propria. Young mice: 8–12 weeks old.
We therefore examined whether autophagy deficiency influenced the survival of TH2 or Foxp3+ Treg cells. Thus, naïve CD4+ T cells isolated from Atg16l1ΔCD4 or Atg16l1fl/fl littermates were activated for 48 hr with anti-CD3 and anti-CD28 antibodies and then rested for 5 days. Cells were kept in TH2 or Treg polarizing conditions throughout the experiment. Following activation with different concentrations of anti-CD3 antibody, Atg16l1-deficient TH2 cells exhibited comparable or improved survival relative to WT TH2 cells (Figure 4E,F). In contrast, there was a 50–75% decrease in survival of Atg16l1-deficient Treg cells when compared to Atg16l1-sufficient Treg cells activated under the same conditions (Figure 4E,F). To establish whether autophagy-deficient Treg and TH2 cells exhibited similarly distinct survival profiles in vivo CD4+ T cells isolated from cLP of Atg16l1ΔCD4 or Atg16l1fl/fl littermates were stained with a viability dye and Annexin V. We observed that an increased proportion of Atg16l1-deficient intestinal Treg cells were dead or dying compared to WT Treg cells (Figure 4G). In contrast, Atg16l1-deficiency had no negative effect on the viability of intestinal TH2 cells, which was comparable to WT controls (Figure 4G). Together, these results indicate that Atg16l1-deficiency does not impair the differentiation or stability of Treg cells and does not promote differentiation towards the TH2 lineage. However, autophagy differentially impacts on the survival of mucosal Treg and TH2 cells.
Autophagy regulates intestinal TH2 responses in a cell-intrinsic manner
As pTreg cells are required to control TH2 responses at mucosal sites (Mucida et al., 2005; Curotto de Lafaille et al., 2008; Josefowicz et al., 2012), we examined whether the enhanced TH2 phenotype in Atg16l1ΔCD4 mice could be corrected by reconstitution of the intestinal Foxp3+ Treg compartment. We restored the pTreg population in young Atg16l1ΔCD4 mice at the age of 10–12 weeks, before the onset of intestinal pathology, through adoptive transfer of congenic WT naïve CD45.1+ CD4+ T cells. Recipients were sacrificed 3 months later, when control Atg16l1ΔCD4 littermates had developed intestinal inflammation. We detected CD45.1+ donor CD4+ T cells in all adoptively transferred Atg16l1ΔCD4 mice, but the level of reconstitution varied by the organ examined. In reconstituted Atg16l1ΔCD4 mice, donor WT CD4+ T cells accounted for 37 ± 5% of total CD4+ T cells in spleen and 18 ± 2% in mLN, whereas in the cLP they represented 56 ± 4% (Figure 5A). Thus, autophagy-deficient CD4+ T cells had a survival disadvantage when compared to WT CD4+ T cells within the intestinal mucosa. Overall, adoptive transfer of WT naïve CD4+ T cells restored the total frequencies of CD4+ T cells in the cLP to levels comparable to control Atg16l1fl/fl mice (Figure 5—figure supplement 1A).
Figure 5 with 1 supplement see all
Autophagy contributes to the elevated TH2 responses in Atg16l1ΔCD4 mice in a cell-intrinsic manner.
Young Atg16l1ΔCD4 mice (CD45.2+) were adoptively transferred with 4-5x10⁶ naïve WT CD4+ T cells (CD45.1+) and analyzed 3 months later. (A) Frequencies of WT (CD45.1+) and Atg16l1-deficient (CD45.2+) CD4+ T cells in the spleen, mLN and cLP. (B) Frequencies of WT (CD45.1+) and Atg16l1-deficient (CD45.2+) Foxp3+ Treg cells in the spleen, mLN and cLP (gated on CD4+ TCRβ+ T cells). (C) Representative FACS plots showing gating of WT (CD45.1+) and Atg16l1-deficient (CD45.1-) CD4+ T cells and expression of IL-13 (TH2), IFN-γ (TH1) and IL-17A (TH17) in the cLP (gated on CD4+ TCRβ+ Foxp3- T cells). (D) Frequencies of WT (CD45.1+) and Atg16l1-deficient (CD45.2+) TH2 (IL-13+), TH1 (IFN- γ+) and TH17 (IL-17A+) cells among CD4+ TCRβ+ Foxp3- T cells in the cLP. (E) Frequencies of WT (CD45.1+) and Atg16l1-deficient (CD45.2+) Gata3+ CD4+ T cells in the spleen, mLN and cLP (gated on CD4+ TCRβ+ Foxp3- T cells). (F) SI lengths and (G) representative photomicrographs of jejunum of control untreated Atg16l1fl/fl or Atg16l1ΔCD4 littermates and reconstituted Atg16l1ΔCD4 mice, scale bar 150 μm. (H) Serum IgE concentrations in control untreated Atg16l1fl/fl or Atg16l1ΔCD4 littermates and adoptively transferred Atg16l1ΔCD4 mice were measured by ELISA. Data are representative of two independent experiments with at least four mice per group (A-E,G) or combined from two independent experiments (F,H). Each dot represents cells coming from the donor or the hosts within the individual transferred mouse (A,B,D,E) or each dot represents an individual mouse (F,H), horizontal bars denote mean. Numbers indicate percentage of cells in gates. Statistical significance was determined using the Mann–Whitney test, *p<0.05; **p<0.01. mLN - mesenteric lymph nodes, cLP – colonic lamina propria. Young mice: 10–12 weeks old.
When we examined Foxp3+ Treg cells, the survival advantage conferred by autophagy was even more apparent, with around 50% of the donor WT naïve CD45.1+ T cells developing into Foxp3+ pTreg cells in spleen, mLN and cLP of Atg16l1ΔCD4 recipients. As a result, the majority of Foxp3+ Treg cells were of WT donor origin (67 ± 5% in spleen, 59 ± 4% in mLN and 80 ± 5% in cLP) (Figure 5B). Thus, adoptive transfer of WT-naïve CD4+ T cells resulted in efficient reconstitution of Foxp3+ pTreg cells in Atg16l1ΔCD4 mice; the total frequencies and numbers of Treg cells within the cLP of transferred mice were comparable with control Atg16l1fl/fl mice (Figure 5—figure supplement 1B). As such, we could utilize this system to determine whether excessive TH2 cell accumulation in Atg16l1ΔCD4 mice was due to impaired mucosal pTreg cells or to a cell-intrinsic effect of Atg16l1-deficiency in TH2 cells.
When we analyzed the frequencies of TH2 cells in the cLP of reconstituted Atg16l1ΔCD4 mice, we observed significantly higher frequencies of Gata3+ IL-13+ TH2 cells among Atg16l1-deficient CD45.2+ CD4+ T cells compared with the WT donor CD45.1+ CD4+ T cells (Figure 5C–E). Indeed, frequencies of IL-13+ Atg16l1-deficient CD4+ T cells in the cLP of pTreg-reconstituted mice were comparable to those found in untreated Atg16l1ΔCD4 littermates (Figure 5C,D). In contrast, there was no difference in TH17 cell frequencies between Atg16l1-deficient CD45.2+ and WT CD4+ T cells, and there was a significant decrease in TH1 frequencies among Atg16l1-deficient CD4+ T cells (Figure 5C,D). In line with these observations, adoptively transferred Atg16l1ΔCD4 mice had comparable total frequencies and numbers of TH2 cells as observed in untreated Atg16l1ΔCD4 mice (Figure 5—figure supplement 1C). Thus, provision of WT pTreg cells did not rescue the increased TH2 phenotype of Atg16l1-deficient CD4+ T cells, indicating that autophagy directly regulates TH2 cells through a cell-intrinsic mechanism. Consistent with this finding, Atg16l1ΔCD4 mice reconstituted with WT pTreg cells still developed intestinal pathology and elevated serum IgE levels comparable to those present in untreated Atg16l1ΔCD4 littermates (Figure 5F–H).
Autophagy is essential for Treg cell homeostasis and control of effector T cell responses in the gut
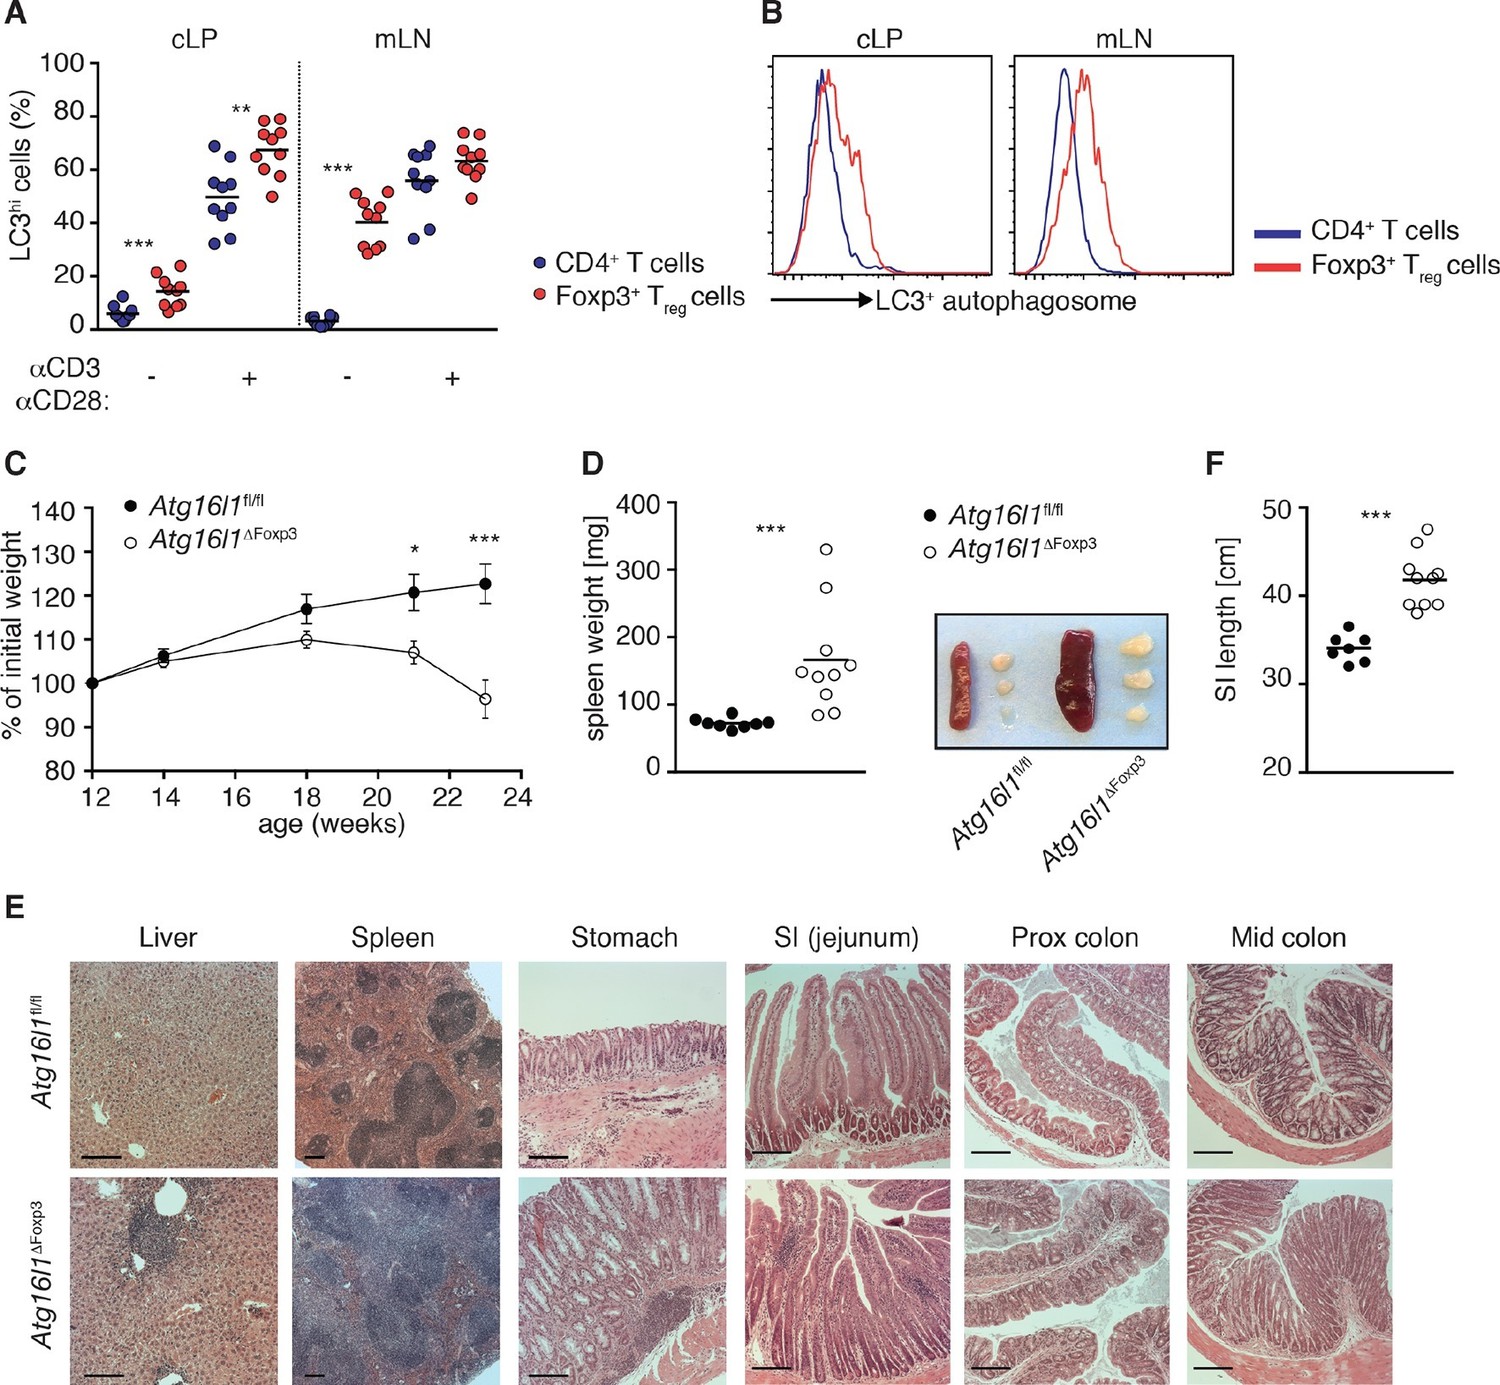
Given that Atg16l1-deficiency significantly reduced the number of intestinal Treg cells in Atg16l1ΔCD4 mice, we hypothesized that Treg cells may be particularly reliant on autophagy compared to other subsets of CD4+ T cells. Indeed, in WT mice we found that levels of autophagy were significantly higher in Foxp3+ Treg cells compared to Foxp3- CD4+ T cells, both constitutively and after TCR activation (Figure 6A,B). Together with our observations of impaired survival of Atg16l1-deficient Foxp3+ Treg cells (Figure 4E–G), this suggested an important cell-intrinsic role for autophagy in the maintenance of Treg cells. This hypothesis was further strengthened by analyses of mixed bone marrow (BM) chimeras where irradiated Rag1-/- mice were reconstituted with a 1:1 mixture of BM cells from Atg16l1ΔCD4 mice and congenic WT C57BL/6mice (Figure 6—figure supplement 1A). In this setting, the reconstitution of CD4+ T cells was severely hampered in the absence of functional autophagy and this deficiency was most pronounced in the Treg compartment of the spleen and cLP (Figure 6—figure supplement 1B–E), confirming that Atg16l1-deficiency decreases the ability of Foxp3+ Treg cells to compete with WT Treg cells in a cell-intrinsic manner.
Figure 6 with 2 supplements see all
Aged Atg16l1ΔFoxp3 mice develop spontaneous multi-organ inflammation.
(A) LC3+ autophagosome formation by Foxp3- CD4+ T cells and Foxp3+ Treg cells from cLP and mLN of WT mice in unstimulated cells or after overnight activation with α-CD3 (5 μg/ml) and α-CD28 (1 μg/ml). (B) Representative LC3 staining of unstimulated cells (gated on Foxp3+ CD4+ TCRβ+ Treg cells or Foxp3- CD4+ TCRβ+ T cells). (C) Weight curves and (D) spleen weights and representative images of spleen and mLN of aged Atg16l1ΔFoxp3 and Atg16l1fl/fl littermates. (E) Representative photomicrographs of H&E stained sections of liver, spleen, stomach, SI (jejunum), proximal colon and mid-colon of aged Atg16l1ΔFoxp3 and Atg16l1fl/fl littermates, scale bar 150 μm. (F) Quantification of SI length. Data are combined from two to four independent experiments with two to five mice per group (A,D,F) or are representative of two to three independent experiments with two to five mice per group (B,C,E). Each dot represents an individual mouse and horizontal bars denote means (A,D,F). Data shown as mean ± s.e.m (C). Statistical significance was determined using two-way analysis of variance (ANOVA) with Bonferroni’s correction for multiple comparisons (C) or using the Mann–Whitney test (A,D,F), *p<0.05; **p<0.01; ***p<0.001. mLN - mesenteric lymph nodes, SI – small intestine lamina propria, cLP – colonic lamina propria. Aged mice >5 months old.
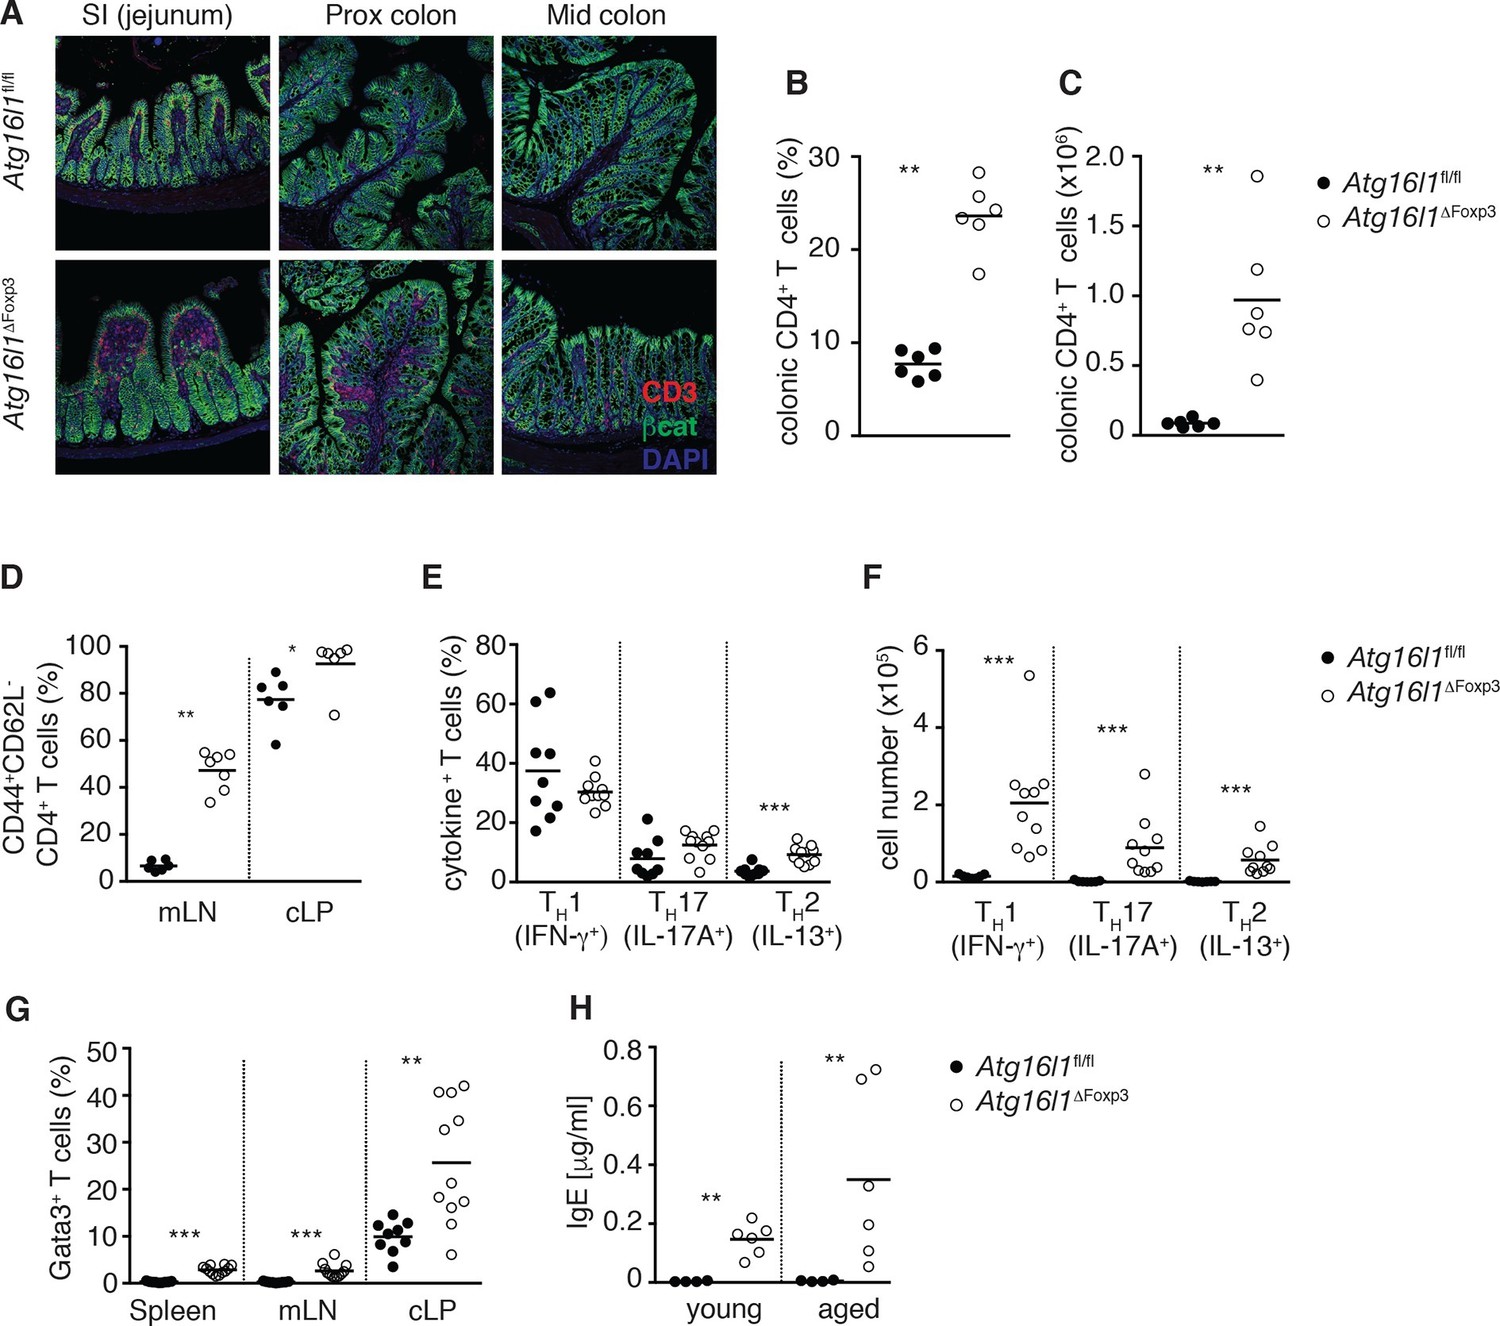
To definitively assess the cell-intrinsic requirement for autophagy in Foxp3+ Treg cells we crossed Atg16l1fl/fl mice with mice expressing a YFP-Cre from the Foxp3 locus (Foxp3Cre mice) (Rubtsov et al., 2008), generating Atg16l1fl/fl::Foxp3Cre mice (hereafter denoted as Atg16l1ΔFoxp3) in which Atg16l1 is selectively ablated in Foxp3+ Treg cells. These mice allowed us to analyze the consequences of a lack of autophagy in Treg cells in the context of autophagy-competent CD4+ T effector cells. As expected, Atg16l1ΔFoxp3 mice showed a significant reduction of Atg16l1 expression in Foxp3+ Treg cells, but not in CD4+ Foxp3- T cells (Figure 6—figure supplement 2A). Although Atg16l1ΔFoxp3 mice appeared normal in early life, at around 5 months of age they developed a severe spontaneous inflammatory disease characterized by progressive weight loss, splenomegaly, lymphadenopathy and leukocyte infiltration in multiple tissues (Figure 6C–E). The gastrointestinal tract was particularly affected in aged Atg16l1ΔFoxp3 mice, with marked inflammation in the SI and colon (Figure 6E,F). Intestinal inflammation in aged Atg16l1ΔFoxp3 mice was characterized by massive accumulation of activated CD4+ T cells in the intestinal LP and mLN (Figure 7A–D and Figure 7—figure supplement 1A). The cLP infiltrate in aged Atg16l1ΔFoxp3 mice contained a mixed population of TH1, TH17 and TH2 effector cells, with a significant increase in the frequencies of IL-13+ CD4+ TH2 cells (Figure 7E,F), although this TH2 bias was not present in young Atg16l1ΔFoxp3 mice (Figure 7—figure supplement 1B). In addition, we observed increased frequencies of Gata3+ CD4+ T cells in the spleen, mLN and cLP of aged Atg16l1ΔFoxp3 mice (Figure 7G). Analyses of humoral responses in aged Atg16l1ΔFoxp3 mice revealed significantly elevated levels of circulating IgE and IgA, however IgG1 levels were not increased (Figure 7H and Figure 7—figure supplement 1C). Thus, selective ablation of Atg16l1 in Foxp3+ Treg cells led to intestinal inflammation that was characterized by accumulation of all TH effector types, with a disproportionate increase in TH2 responses in aged mice. However, the breadth and magnitude of TH2-associated responses were less pronounced in Atg16l1ΔFoxp3 mice compared to those observed in Atg16l1ΔCD4 mice.
Figure 7 with 1 supplement see all
Atg16l1ΔFoxp3 mice cannot control pro-inflammatory TH effector responses.
(A) Representative immunofluorescence images of small intestine and proximal and mid colon of aged Atg16l1ΔFoxp3 and Atg16l1fl/fl littermates stained for CD3 (red), β-catenin (green) and DAPI (blue). (B) Frequencies and (C) total numbers of cLP CD4+ TCRβ+ T cells in aged Atg16l1ΔFoxp3 and Atg16l1fl/fl littermates. (D) Frequencies of effector (CD44+CD62L-) CD4+ T cells in the mLN and cLP of aged Atg16l1ΔFoxp3 and Atg16l1fl/fl littermates (gated on CD4+ TCRβ+ Foxp3- T cells). (E) Frequencies and (F) total numbers of TH1 (IFN-γ+), TH17 (IL-17A+), TH2 (IL-13+) T cells in the cLP of aged Atg16l1ΔFoxp3 and Atg16l1fl/fl littermates (gated on CD4+ TCRβ+ Foxp3- T cells). (G) Frequencies of Gata3+ CD4+ T cells in aged Atg16l1ΔFoxp3 and Atg16l1fl/fl littermates (gated on CD4+ TCRβ+ Foxp3- T cells). (H) Serum IgE concentrations in Atg16l1ΔFoxp3 and Atg16l1fl/fl littermates were measured by ELISA. Data are combined from two to four independent experiments with two to five mice per group (B-H) or are representative of two independent experiments with two to five mice per group (A). Each dot represents an individual mouse and horizontal bars denote means. Statistical significance was determined using the Mann–Whitney test *p<0.05; **p<0.01; ***p<0.001. mLN - mesenteric lymph nodes, cLP – colonic lamina propria. Young mice: 8–12 weeks old, aged mice >5 months old.
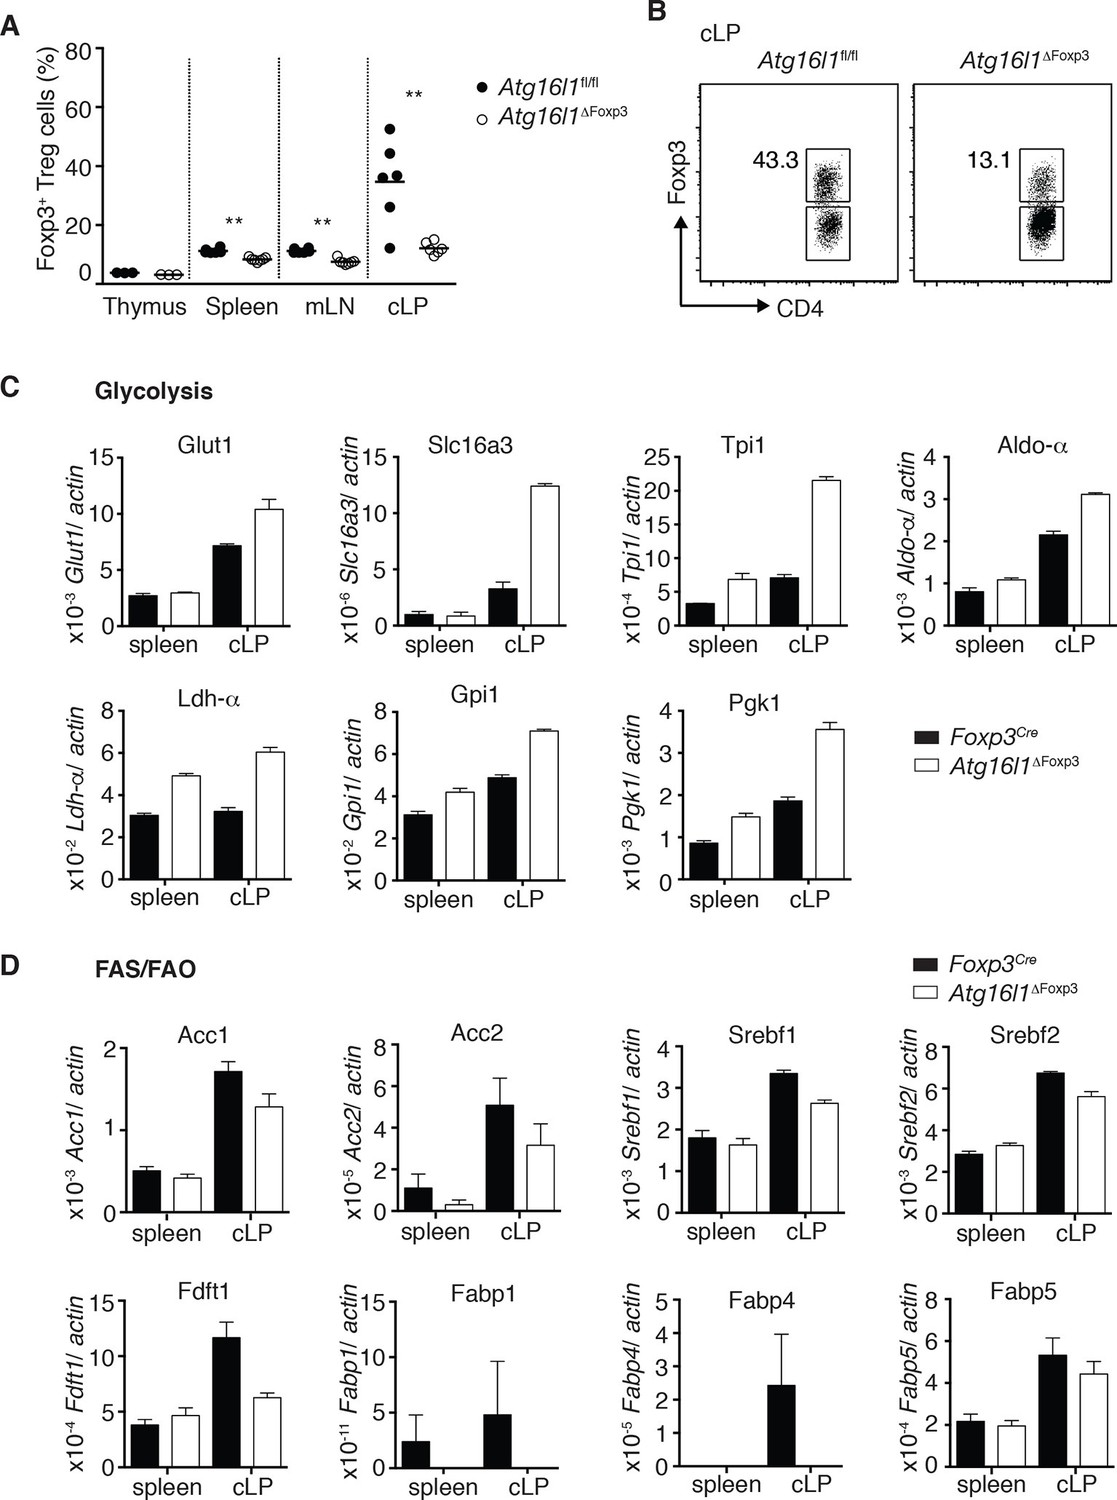
When we examined the Treg cell compartment in Atg16l1ΔFoxp3 mice, we found significantly decreased frequencies of Foxp3+ Treg cells in the spleen and mLN compared to Atg16l1fl/fl littermates, although thymic Treg cell frequencies were similar (Figure 8A). As found in Atg16l1ΔCD4 mice, intestinal LP Foxp3+ Treg cells were severely depleted in Atg16l1ΔFoxp3 mice and those remaining exhibited significantly increased expression of effector TH cytokines (Figure 8A,B and Figure 8—figure supplement 1A). Thus, Treg cell-specific deletion of Atg16l1 recapitulated the Treg cell deficits observed in Atg16l1ΔCD4 mice, showing that cell-intrinsic autophagy is essential for peripheral Treg cell homeostasis, especially in the intestine.
Figure 8 with 3 supplements see all
Cell-intrinsic autophagy is required for metabolic adaptation and survival of intestinal Foxp3+ Treg cells.
(A) Foxp3+ Treg cell frequencies among CD4+ TCRβ+ T cells in Atg16l1ΔFoxp3 and Atg16l1fl/fl littermates and (B) representative FACS plots of Foxp3 expression in cLP CD4+ T cells from young Atg16l1ΔFoxp3 and Atg16l1fl/fl littermates (gated on CD4+ TCRβ+ T cells). (C) qPCR analysis of glycolytic gene levels in sorted Foxp3+ Treg cells from spleen and cLP of young Atg16l1ΔFoxp3 and Foxp3Cre mice (sorted for CD4+ TCRβ+ YFP+). (D) qPCR analysis of FAS and FAO gene levels in Foxp3+ Treg cells from the spleen and cLP of young Atg16l1ΔFoxp3 and Foxp3Cre mice (sorted for CD4+ TCRβ+ YFP+). FAS: fatty acid synthesis, FAO: fatty acid oxidation, Glut1: glucose transporter 1, Slc16ac: solute carrier family 16 member 3 (lactic acid and pyruvate transporter), Tpi1: triosephosphate isomerase 1, Aldo–α: aldolase α, Ldh-α: lactate dehydrogenase α, Gpi1: Glucose phosphate isomerase 1, Pgk1: Phosphoglycerate kinase 1, Acc1: acetyl-CoA carboxylase 1, Acc2: acetyl-CoA carboxylase 2, Srebf1: sterol regulatory element binding transcription factor 1, Srebf2: sterol regulatory element binding transcription factor 2, Fdft1: farnesyl-diphosphate farnesyltransferase 1, Fabp: Fatty acid-binding protein. Data are representative from two (C,D) or three independent experiments (A,B). Each dot represents individual mouse (A) or data are shown as mean ± s.e.m (C,D). Gene expression levels are shown as mean ± s.e.m of three technical replicates (C,D). Numbers indicate percentage of cells in gates (B). cLP – colonic lamina propria. Young mice: 8–12 weeks old.
Differential survival of autophagy-deficient Treg cells and TH2 cells is associated with an altered metabolic profile
Finally, we investigated mechanisms that might underlie the striking survival defect of Atg16l1-deficient intestinal Treg cells. Analyses of key regulators of apoptosis revealed that Atg16l1-deficient Treg cells isolated from spleen and cLP had comparable expression of pro-apoptotic (Bim, Bax) and anti-apoptotic (Bcl2) genes as those isolated from control mice (Figure 8—figure supplement 1B). As recent evidence suggests that tissue-resident Treg cell populations may exhibit specialized metabolic adaptations (Burzyn et al., 2013), we compared the expression of metabolic genes by WT and Atg16l1-deficient Treg cells. Analyses of genes involved in glycolysis, fatty acid synthesis (FAS) and fatty acid oxidation (FAO), revealed that Atg16l1-deficient Treg cells had higher expression of glycolytic genes, including Glut1, Slc16a3, Tpi1, Ldh-a, Aldo-a, Gpi1 and Pgk1, than control Treg cells (Figure 8C). Strikingly, this augmented glycolytic signature was much more pronounced in Atg16l1-deficient Treg cells isolated from cLP versus those from the spleen (Figure 8C). Conversely, expression of many key genes involved in FAS/FAO, including Acc1, Acc2, Srebf1, Srebf2, Fdft1, Fabp1, Fabp4 and Fabp5 was markedly decreased in Atg16l1-deficient Treg cells (Figure 8D). Again, these differences were most pronounced in the intestine; WT cLP Treg cells showed increased FAS/FAO gene expression compared to their spleen counterparts, whereas Atg16l1-deficient cLP Treg cells were not able to up-regulate the expression of FAS/FAO genes (Figure 8D). Thus, Atg16l1-deficiency profoundly influenced the expression of metabolic genes in intestinal Treg cells, with an altered balance of glycolytic and FAS/FAO gene expression. Further evidence of increased reliance on lipid metabolism by colonic Treg cells was provided by our observation that Treg cells isolated from the cLP showed markedly increased lipid uptake in comparison to mLN or spleen Treg cells (Figure 8—figure supplement 2A,B). A similar pattern was observed when we assayed expression of CD36, a fatty acid translocase that enhances FA uptake: colonic Treg cells showed increased expression of CD36 compared to splenic and mLN Treg cells (Figure 8—figure supplement 2C,D). Interestingly, we found that Atg16l1-deficient Treg cells showed comparable levels of lipid uptake and CD36 expression as their autophagy-sufficient counterparts (Figure 8—figure supplement 2A–D), suggesting that autophagy does not affect lipid uptake per se but rather affects lipid metabolism.
Together, these results demonstrate that cell-intrinsic autophagy is indispensable for Foxp3+ Treg cell maintenance and function in peripheral tissues, particularly to suppress inflammatory responses within the gastrointestinal tract. Decreased survival of Atg16l1-deficient Treg cells was associated with an altered metabolic profile, suggesting that autophagy plays an integral role in facilitating the metabolic adaptions required for long-term Treg cell survival in the intestine.
We next explored whether autophagy had a general effect on T cell metabolic profile and whether this might explain the differential effects on TH2 cells and Treg cells. Evidence that this might be the case came from our observation that Atg16l1-deficient naïve CD4+ T cells exhibited increased cell size compared with naïve CD4+ T cells isolated from Atg16l1fl/fl littermates (Figure 8—figure supplement 3A). We therefore measured oxygen consumption rate (OCR), which is an indicator of oxidative phosphorylation (OXPHOS), and extracellular acidification rate (ECAR), an indirect indicator of aerobic glycolysis. We found that Atg16l1-deficient naïve CD4+ T cells exhibited significantly increased OCR and ECAR, metabolic changes that are typically observed in activated CD4+ T cells and are associated with increased aerobic glycolysis (Figure 8—figure supplement 3B).
As TH2 cells have previously been reported to display an increased glycolytic rate compared to other TH subsets (Michalek et al., 2011; Yang et al., 2013), we hypothesized that they may be more resistant to the increased glycolysis that is induced in the absence of autophagy. As it was not possible to sort TH2 cells from the cLP, we performed this analysis on in vitro cultures of TH2 and Treg cells. We found that TH2 cells were larger than Treg cells, expressed higher levels of c-Myc, a critical regulator of metabolic reprograming in activated T cells, and had markedly higher ECAR, all indicative of enhanced aerobic glycolysis (Figure 8—figure supplement 3C–E). Furthermore, while Atg16l1-deficient Treg cells showed higher expression of c-Myc, significantly increased levels of ECAR and OCR, and were larger than their control Atg16l1-sufficient counterparts, we observed constitutively high and comparable levels of glycolysis in Atg16l1-deficient and Atg16l1-sufficient TH2 cells (Figure 8—figure supplement 3C–E). These patterns were recapitulated when expression of key metabolic genes were analyzed; TH2 cells showed high expression of a panel of glycolytic genes irrespective of their autophagy Atg16l1 genotype, whereas Treg cell expression of glycolytic genes was generally lower, unless the Treg cells were autophagy-deficient (Figure 8—figure supplement 3F). Taken together, these results suggest that the enhanced glycolytic metabolism constitutively employed by TH2 cells makes them more resistant to the metabolic changes that occur in the absence of autophagy.
Discussion
The unique challenges of the intestine necessitate complex mechanisms of tolerance and immune regulation to maintain homeostasis (Izcue et al., 2009). As altered mucosal CD4+ T cell responses are implicated in intestinal diseases of increasing prevalence, including food allergies and IBD (Maloy and Powrie, 2011; Berin and Sampson, 2013), it is important to understand the factors that control effector and regulatory T cell homeostasis in the gut. Here, we identify Atg16l1 and autophagy as a new critical pathway regulating intestinal Treg and TH2 responses.
Recent studies addressing the role of autophagy in distinct leukocyte populations have highlighted T cells as being very sensitive to perturbations in the autophagy pathway (Ma et al., 2013). Our data extend these findings by showing that autophagy is particularly important for the survival of CD4+ T cells within the gut environment, as Atg16l1 deletion in T cells led to a severe reduction of CD4+ T cell numbers in the intestinal LP. This deficit was confirmed in mixed bone marrow chimeras, where Atg16l1-deficient CD4+ T cells failed to reconstitute the intestinal LP compartment, and by the rapid outgrowth of adoptively transferred WT CD4+ T cells in the colonic LP of Atg16l1ΔCD4 recipients. However, despite the reduction in intestinal CD4+ T cells, Atg16l1ΔCD4 mice spontaneously developed progressive, chronic intestinal inflammation. To confirm their increased predisposition to develop intestinal pathology, we used an experimental model of IBD triggered by infection with Helicobacter hepaticus and concomitant treatment with anti-IL-10R mAbs (Song-Zhao and Maloy, 2014). This model induces severe typholocolitis that is T cell dependent and displays several features of human IBD pathology and does not require any specific genetic manipulation or chemical barrier disruption. We found increased intestinal pathology in Atg16l1ΔCD4 mice, confirming that Atg16l1-deficient T cells could mediate potent inflammatory responses in the gut. Thus, selective autophagy deficiency within T cells decreases the competitiveness of these cells and simultaneously predisposes to intestinal inflammation.
We found that Atg16l1ΔCD4 mice exhibited a drastic reduction in Foxp3+ Treg populations in the cLP and SI LP, together with marked changes in intestinal Treg phenotype, including increased cell cycling and aberrant production of TH effector cytokines. The role of autophagy in Foxp3+ Treg cells is not well defined. T cell-specific ablation of Vps34, which encodes a class III phosphatidylinositol 3-kinase that promotes autophagy, resulted in decreased frequencies of Treg cells in the thymus, spleen and lymph nodes (Parekh et al., 2013). However, as Vps34 also has autophagy-independent functions (Backer, 2008), it was unclear as to what extent these changes were due to impaired autophagy. Furthermore, we did not find any deficit in thymic Treg cell development in Atg16l1-deficient T cells. However, we observed that Treg cells isolated from the mLN and colonic LP had increased levels of autophagy compared to effector T cells, suggesting that autophagy is particularly important for the maintenance of Treg cells in the periphery. Indeed, we demonstrated that cell-intrinsic autophagy is indispensible for the maintenance and function of Foxp3+ Tregcells in the gastrointestinal tract, as selective deletion of Atg16l1 in the Foxp3+ Treg compartment in Atg16l1ΔFoxp3 mice led to a loss of intestinal Foxp3+ Treg cells and to severe inflammation of the small intestine and colon. In this context, it is pertinent that rapamycin, which induces autophagy through its inhibitory activity on mTOR, has been shown to promote expansion of Treg cells in vitro and in vivo (Pollizzi and Powell, 2015). Similarly, several small-molecule inducers of autophagy were shown to selectively promote the development of Treg cells in vitro (Shaw et al., 2013). Taken together with our findings, these observations suggest that boosting autophagy may represent a rational therapeutic approach to enhance Treg responses in the intestine.
How does autophagy intrinsically regulate Treg cell homeostasis? Our data indicate that autophagy is not required for the differentiation of Foxp3+ Treg cells in vitro or in vivo for thymic generation of Treg cells in vivo. However, we found that Atg16l1-deficient Treg cells showed significantly decreased survival compared to WT Treg cells both in vitro and in vivo. As recent evidence indicates that Treg cells utilize a distinct metabolic program that favors lipid oxidation for energy provision (MacIver et al., 2013), one potential explanation is that autophagy regulates Treg cell metabolism and thereby their survival. Indeed, we found that Atg16l1-deficient Treg cells expressed a distinct metabolic profile to their WT counterparts, exhibiting increased expression of genes involved in glycolysis and reduced expression of genes involved in FAS/FAO. Fatty acid metabolism is emerging as a potent regulator of T cell responses and preferential utilization of FAO has been linked to Treg cell induction (Lochner et al., 2015). Although a recent report indicated that de novo FAS was not required for Foxp3+ Treg cell differentiation (Berod et al., 2014), optimal in vivo Treg cell function was associated with intrinsic lipid synthesis (Zeng et al., 2013). Furthermore, autophagy has been implicated in the regulation of fatty acid metabolism (Singh et al., 2009; Lizaso et al., 2013; Kaur and Debnath, 2015) and recent studies found that autophagy plays a key role in the generation of CD8+ memory T cells (Puleston et al., 2014; Xu et al., 2014), which are heavily dependent on FAO for survival (Pearce et al., 2009; O'Sullivan et al., 2014). Thus, autophagy could play a similar survival role in Treg cells, by facilitating the degradation of intracellular lipid stores to release FAs that fuel FAO. Additionally, as degradation of intracellular lipids by autophagy is important to avoid lipotoxicity (Galluzzi et al., 2014), defective autophagy could lead to a toxic build up of intracellular lipids in intestinal Treg cells.
The imbalance between glycolysis and FAS/FAO observed in autophagy-deficient Treg cells could indicate that these cells have stalled in the activated/effector state and are unable to make the metabolic adaptations necessary for long-term survival. This is supported by our data showing that a higher proportion of autophagy-deficient Treg cells appear to be in cell cycle, but they have reduced expression of terminal differentiation markers. Consistent with our findings, a recent study reported that autophagy deficiency in Treg cells resulted in increased mTORC1 activation and glycolysis, leading to phenotypic instability, including expression of pro-inflammatory cytokines (Wei et al., 2016). However, the molecular mechanism behind decreased survival of autophagy-deficient Treg cells was not elucidated (Wei et al., 2016). It is striking that autophagy deficiency had a more detrimental effect on intestinal Treg cells than on those found in secondary lymphoid organs. Recent evidence suggests that tissue-resident Treg cells undergo tissue-specific adaptations, and metabolic changes are emerging as an important facet of such reprogramming (Burzyn et al., 2013; Liston and Gray, 2014). Taken together, our results suggest that autophagy endows intestinal Treg cells with the metabolic flexibility required to survive in the gut tissue, where essential growth factors may be in short supply (Pearce et al., 2013).
Paralleling decreased Treg responses in Atg16l1ΔCD4 mice, we observed a selective expansion of TH2 cells in the intestinal LP that was already present in young mice and preceded the onset of overt pathology. Our subsequent analyses indicated that autophagy limits mucosal TH2 cells through both cell-intrinsic and cell-extrinsic (Treg-mediated) regulation. One possibility is that Atg16l1-deficient TH2 cells may be somewhat resistant to Treg suppression. However, when we reconstituted pTreg cells in Atg16l1ΔCD4 mice we observed a negative correlation between the numbers of intestinal Treg cells and TH2 cells (data not shown), suggesting that autophagy-deficient TH2 cells are partially controlled by Treg cells. Our data strongly suggest that the intrinsic survival advantage of Atg16l-deficient TH2 cells is primarily responsible for their outgrowth in the intestine. Indeed, we observed increased survival of Atg16l1-deficient TH2 cells in vitro, suggesting that autophagy might directly inhibit TH2 cell expansion. This concept is consistent with a previous study that reported enhanced survival of TH2 cells in vitro when autophagy was inhibited and that autophagy mediated death of TH2 cells during growth-factor withdrawal (Li et al., 2006). However, we provide evidence for an additional mechanism that could explain the preferential expansion of Atg16l1-deficient TH2 cells in the intestine, related to the unique ability of TH2 cells to cope with prolonged high levels of glycolysis. Our data contribute to accumulating evidence that a shift toward glycolysis is a general phenomenon observed when the autophagy pathway is perturbed in T cells. We observed characteristic signs of increased glycolysis in Atg16l1-deficient naïve CD4+ T cells and Treg cells, such as increases in cell size, c-Myc levels and expression of glycolytic genes, as well as elevated ECAR. Others have reported a similar glycolytic shift in autophagy-deficient CD8+ memory T cells (Puleston et al., 2014) and Treg cells (Wei et al., 2016). Interestingly, TH2 cells have previously been shown to display an increased glycolytic rate compared to other TH subsets (Michalek et al., 2011; Yang et al., 2013). We confirmed the high levels of constitutive glycolysis in TH2 cells and showed that these were comparable in Atg16l1-deficient and control TH2 cells. Moreover, Gata3 activation was previously linked to induction of glycolysis after TCR activation in T cells, through induction of c-Myc, a critical regulator of metabolic reprograming (Wang et al., 2011; Wang et al., 2013; Wan, 2014). We therefore propose that in TH2 cells Gata3 orchestrates metabolic adaptations that enable these cells to cope with prolonged high levels of glycolysis, thus making them resistant to metabolic changes enforced by autophagy deficiency. Overall, our results indicate that autophagy is a key pathway through which TH2 responses are restrained in vivo. A lack of this restraint leads to a gradual loss of tolerance to intestinal antigens, as the excessive TH2 responses in Atg16l1ΔCD4 mice led to production of IgG1 and IgA antibodies toward commensal microbiota and dietary antigens that increased with age. Furthermore, Atg16l1ΔCD4 mice developed very high levels of circulating IgE, and mounted de novo IgE antibody responses toward introduced dietary antigen.
As polymorphisms in autophagy genes are linked to IBD susceptibility, our results point towards a novel mechanism that links impaired autophagy to intestinal inflammation through dysregulation of mucosal T cell responses. Previous studies focused on the role of ATG16L1 and autophagy in myeloid cells and the intestinal epithelium. They suggested that impaired autophagy could result in reduced intestinal barrier integrity due to impaired Paneth cell function within the intestinal epithelial layer and elevated cytokine responses by macrophages and dendritic cells (Cadwell et al., 2008; Saitoh et al., 2008; Lassen et al., 2014). Our data add a further layer to the control of intestinal homeostasis by autophagy, by showing that autophagy impairment alters the local T cell compartment and promotes T cell driven intestinal pathology. We present compelling evidence that autophagy deficiency in Treg cells leads to a deficit in intestinal Treg cells and the development of severe intestinal pathology. Although the contribution of the TH2 axis to IBD remains unclear (Strober et al., 2002; Shale et al., 2013), polymorphisms in IL-4, IL-5 and IL-13 have been implicated by GWAS in both CD and UC (Van Limbergen et al., 2014) and elevated levels of antibodies recognizing food and commensal antigens have been detected in IBD patients (Lodes et al., 2004; Cai et al., 2014). Moreover, as defective Treg and increased TH2 responses at the mucosa are observed in food allergies and asthma, our findings might also have implications for these conditions. Indeed, epidemiological studies show an overlap between IBD and TH2 driven diseases, such as atopic dermatitis and asthma (Lees et al., 2011). Furthermore, polymorphisms in the essential autophagy gene Atg5 have recently been implicated in asthma susceptibility (Martin et al., 2012; Poon et al., 2012). Autophagy is an attractive therapeutic target and several autophagy modulating compounds are already in clinical trials for the treatment of various disorders (Jiang and Mizushima, 2014). Furthermore, natural dietary-derived compounds, including retinoid acid (Isakson et al., 2010) and vitamin D (Yuk et al., 2009), have been shown to enhance autophagy. Taken together with our results, these findings raise the possibility that activation of autophagy through dietary or pharmacological modulation might have beneficial effects in disorders with a signature of decreased Treg and elevated TH2 responses, including intestinal inflammation and various hypersensitivities.
Materials and methods
Mice
Atg16l1fl/fl mice were generated and provided by the H. Virgin laboratory (Washington University, Saint Louis, MO), as described (Hwang et al., 2012). Atg16l1fl/fl mice were crossed to B6.Cg-Tg(Cd4-cre)1Cwi/BfluJ (CD4-Cre mice) and B6.129(Cg)-Foxp3tm4(YFP/cre)Ayr/J (Foxp3Cre mice, Jackson Laboratory, Bar Harbor, ME) to generate Atg16l1ΔCD4 and Atg16l1ΔFoxp3 mice, respectively. All above strains, together with B6.SJL-CD45.1 (CD45.1+), B6 Rag1-/- (Jackson Laboratory), and B6 Foxp3hCD2 mice (Komatsu et al., 2009) were bred and maintained under specific pathogen-free conditions. Unless stated otherwise, mice were analyzed at 8–12 weeks (young mice) or > 5 months of age (aged mice). In the gene expression analysis Atg16l1ΔFoxp3 mice and Foxp3Cre mice were co-housed and age- and sex- matched. In all other experiments mice used were age- and sex-matched littermates that were kept co-housed throughout the experiments.
T cell-mediated colitis
Request a detailed protocolExperimental T cell-mediated colitis was induced by infection with Helicobacter hepaticus and concomitant IL-10R blockade as described (Song-Zhao and Maloy, 2014). Briefly, mice were infected with H.hepaticus (108 CFU per mouse) by oral gavage on three consecutive days and anti-IL-10R mAb (1B1.2) was administrated via i.p. injection (1 mg per mouse) on the first and seventh day of the infection. Mice were sacrificed 2 weeks after colitis induction.
Histological assessment of intestinal inflammation
Request a detailed protocolMice were euthanized at indicated time points whereupon tissue sections were fixed in buffered 10% formalin and paraffin-embedded. Sections were then cut and stained with hematoxylin and eosin. Histological analysis of intestinal inflammation was performed as described (Song-Zhao and Maloy, 2014). Briefly, inflammation was graded semi-quantitatively on a scale from 0 to 3, for four criteria; (a) epithelial hyperplasia and goblet cell depletion, (b) lamina propria leukocyte infiltration, (c) area of tissue affected, and (d) markers of severe inflammation, including crypt abscesses, sub- mucosal inflammation, and ulceration. Scores for individual criteria were totaled for an overall inflammation score between 0 and 12.
Isolation of cells and flow cytometry analysis
Request a detailed protocolCell suspensions were prepared from the thymus, spleen, mLN, bone marrow and intestinal lamina propria as previously described (Uhlig et al., 2006). The following antibodies from eBioscience (Hatfield, UK) were used: anti-CD16/32 (93), anti-CD4 (GK1.5), anti-CD8α (53.6.7), anti-TCRβ (H57-597), anti-CD45 (30-F11), anti-CD44 (1M7), anti-CD62L (MEL-14), anti-CD45.1 (A20), anti-CD45.2 (104), anti-CD103 (2E7)), anti-CD69 (H1.2F3), anti-KLRG1 (2F1), anti-CD25 (7D4), anti-CD36 (No.72–1), anti-hCD2 (RPA-2.10), anti-CTLA4 (UC10-4B9), anti-GR.1 (RB6-8C5), anti-CD11b (M1/70), anti-Siglec F (E50-2440), anti-Gata3 (TWAJ), anti-Foxp3 (FJK-16s), anti-Ki67 (SolA15), anti-Helios (22F6), anti- Bcl2 (10C4), anti-PS6 (cupk43k), anti-IFN-γ (XMG1.2), anti-IL-17A (eBio17B7), anti-IL-13 (eBio13A). The following antibodies were from BioLegend (San Diego, CA): anti-CD138 (281–2), anti-CD161 (PK136), anti-F4/80 (BMB), anti-CD11b (M1/70). The following antibodies were from BD Biosciences (San Jose, CA): anti-B220 (RA3 6B2), anti-GL7 (GL7), anti-CD95 (Jo2), anti-CD3 (145-2C11), anti-CD19 (1D3), anti-Ly6C (AL-21), anti-Ly6G (1A8), anti-IgM (R6-60.2), anti-IgG1 (A85-1). Anti-c-Myc antibody was from Cell Signaling Technology (D84C12, Danvers, MA). Anti-Neuropilin1 polyclonal antibody was from R&D Systems (FAB566A, Minneapolis, MN). Fixable Viability Dye from eBioscience was used to stain dead cells. Annexin V staining was performed using eBioscience kit (88–08006) according to manufacture instructions. For intracellular cytokine staining cells were stimulated for 3h with PMA (100ng/ml) and Ionomycin (1 µg/ml) in the presence of Brefeldin A (10 µg/ml).
Autophagosome formation detection by flow cytometry was performed using FlowCellect Autophagy LC3 Antibody-based Assay Kit (FCCH100171, Merk-Millipore, Billerica, MA) according to the manufacturer's instructions and following cell surface markers staining. The Autophagy LC3 Antibody-based Assay Kit involves a permeabilization step to wash out cytosolic LC3-I, allowing for antibody-based detection of membrane bound LC3-II. For autophagy detection in WT Treg cells B6 Foxp3hCD2 were used, as this allowed the detection of Foxp3+ Treg cells on the basis of surface expression of hCD2 marker. All data were acquired using a Cyan ADP (Beckman Coulter, High Wycombe, UK) and analyzed using FlowJo software (Tree Star, Ashland, OR).
CD4+ T cell purification
Request a detailed protocolBulk CD4+ T cells were purified from the spleen and mLN by negative selection as previously described (Coccia et al., 2012). Naïve CD4+ T cells were then sorted as CD4+ CD25- CD44- CD62L+. Treg cells were sorted as CD4+ CD25+ when sorted from Atg16l1ΔCD4 and Atg16l1fl/fl mice and as CD4+ YFP+ when sorted from Atg16l1ΔFoxp3 and Foxp3Cre mice. Cells were sorted using an Astrios, Beckman Coulter MoFlo XDP or AriaIII BD Bioscience. Post-sort flow cytometry analyses confirmed that the purity of sorted populations was >97%.
Adoptive transfer of naïve CD4+ T cells
Request a detailed protocolNaïve CD4+ T cells from WT (CD45.1+) mice were sorted as described above and transferred to Atg16l1ΔCD4 recipient (CD45.2+) mice via intravenous injection (4-5x10⁶ cells per mouse). Analysis of spleen, mLN and cLP CD4+ T and Treg cells was performed 3 months after transfer.
Generation of mixed bone marrow chimeras
Request a detailed protocolBM cells were isolated from the tibia and femur of WT (CD45.1+) mice and Atg16l1fl/fl or Atg16l1ΔCD4 (CD45.2+) mice and injected i.v. at 1:1 ratio (a total of 1x10⁷ cells per mouse) into lethally irradiated (1100 Rad, split dose) Rag1-/- recipients. Mice were allowed to reconstitute for at least 8 weeks before analysis.
Immunization with ovalbumin (OVA)
Request a detailed protocolFor induction of OVA-specific IgE antibodies two treatment regimes were utilized. For OVA only immunization mice were fed three times by oral gavage with ovalbumin grade VII (5 mg per mouse, Sigma-Aldrich, St Louis, MO) with 21-day intervals between feeds. For adjuvanted immunization, mice were initially fed with OVA (5 mg per mouse) plus cholera toxin (10 μg per mouse, Biologial Compbell), after which they were fed twice with OVA only (5mg per mouse), with 21-day intervals between feeds.
Infection with Trichuris muris and detection of T. muris-specific IgG1
Request a detailed protocolMice were orally infected with ~200 Trichuris muris eggs. Serum was collected on day 34-post infection and assayed by ELISA for parasite-specific IgG1. Ninety-six-well plates were coated with 5 μg/ml T. muris excretory/secretory antigen and incubated with serial two-fold diluted serum. Bound IgG1 was detected using biotinylated anti-murine IgG1 (AbD Serotec, Kidlington, UK).
Lipid uptake measurement
Request a detailed protocolAtg16l1fl/fl and Atg16l1ΔCD4 mice were injected i.p. with 50 μg of fluorescent 16-carbon fatty acid analog BODIPY C-16 (Molecular Probes) reconstituted in DMSO. Mice were culled 1 hr later and tissue collected for analysis by flow cytometry.
Metabolic analysis using XF 96 extracellular flux analyzer
Request a detailed protocolThe real-time extracellular acidification rate (ECAR) and oxygen consumption rate (OCR) were measured using a XF 96 extracellular flux analyzer (Seahorse Bioscience, Billerica, MA). Briefly, naïve (CD62L+CD44-) CD4+ T cells, or in vitro polarized TH2 and Treg cells, were washed twice in assay medium (RPMI 1640 without sodium bicarbonate, 20 mM glucose, 1% FCS, 2mM pyruvate) and seeded at 3–4 x 10⁵ cells per well in assay medium in a 96-well XF plate coated with poly-L-lysine (Sigma). T cells were rested for 1 hr at 37°C without CO2 before analysis.
Polarization and stimulation of CD4+ T cell subsets
Request a detailed protocolNaïve CD4+ T cells were cultured (3x10⁵ cells/well) in 96-well plates coated with anti-CD3 mAb (5 μg/ml) and soluble anti-CD28 mAb (1 μg/ml) and kept in presence of IL-2 (100 U/ml). For TH0 conditions anti-IL-4 (10 μg/ml) and anti-IFN-γ (10 μg/ml) mAb were added. Cultures were supplemented with IL-12 (10 ng/ml) and anti-IL-4 mAb (10 μg/ml) for TH1 polarization; with IL-4 (20 ng/ml), anti-IFN-γ (20 μg/ml) and anti-IL-12 (10 μg/ml) for TH2 polarization; and with TGF-β1 (5 ng/ml), anti-IFN-γ, anti-IL-4 mAb and anti-IL-12 (all 10 μg/ml) for induced Treg polarization. Sorted Treg cells were activated for 48h with anti-CD3 mAb (5 μg/ml) and soluble anti-CD28 mAb (1 μg/ml) plus IL-2 (100 U/ml) and then cultured with IL-4 (10 ng/ml), IL-13 (10 ng/ml) and IL-2 (100 U/ml) for 5 days. All cytokines were from R&D Systems. Anti-CD3 (145-2C11), anti-CD28 (37.51), anti-IFN-γ (XMG1.2), anti-IL-12 (C17.8) and anti-IL-4 (11B11) mAb were from eBioscience. Cells were cultured in RPMI-1640 Medium, 10% fetal calf serum, 2 mM L-glutamine, 100 U/ml of Penicillin/Streptomycin, and 0.05 mM 2-mercaptoethanol.
Measurement of serum antibodies and cytokines
Request a detailed protocolAll immunoglobulin isotypes except for IgE were measured by enzyme-linked immunosorbent assay (ELISA) using the SBA Clonotyping System (Southern Biotech, Birmingham, AL). IgE concentration was determined using an anti-mouse IgE ELISA (BioLegend), according to manufacturer's instructions. For the detection of soy-specific, CBir-specific and Helicobacter-specific antibodies ELISA was performed with plates coated with purified soy antigen (5 μg/ml), CBir peptide (10 μg/ml) and soluble Helicobacter antigen (sHel antigen, 10 μg/ml) respectively. sHel antigen was prepared as previously described (Kullberg et al., 1998). For the detection of OVA-specific IgE, a sandwich ELISA was performed with biotinylated-OVA used for detection. MCPT-1 concentrations were measured by ELISA (eBioscience).
Immunofluorescence microscopy
Request a detailed protocolColonic and small intestine tissue samples were formalin-fixed, paraffin-embedded and sectioned as per histological analysis. Sections were deparaffinized, rehydrated, and subjected to sodium citrate-based antigen retrieval, then stained with mouse pAb anti-β-catenin (610153, BD Bioscience), rabbit pAb anti-CD3 (ab5690, Abcam, Cambridge, UK) and secondary goat antibodies conjugated to AlexaFluor488 or 555 (Life Technologies, Carlsbad, CA). Slides were mounted with DAPI-containing Vectashield (Vector Laboratories, Burlingame, CA). Images were acquired with an Olympus Fluoview FV1000 confocal microscope and Olympus Fluoview Software (Olympus, Tokyo, Japan).
Western blotting analysis
Request a detailed protocolCD4+ T cells purified by negative selection were lysed in RIPA buffer containing protease inhibitor cocktail (Roche, Basel, Switzerland). Protein levels were normalized by Biorad DC protein assay (Bio-Rad Laboratories, Hercules, CA), resolved by SDS-PAGE and, following transfer onto nitrocellulose membranes, were blotted with anti-LC3 antibody (L7543; Sigma-Aldrich) and anti-tubulin antibody (sc5286, Santa Cruz Biotechnology, Dallas, TX), and secondary HRP conjugated anti–rabbit antibody (7074S, Cell Signaling Technology).
Fluidigm gene expression analysis
Request a detailed protocolCD4+ T cells and Treg cells were sorted for each population based on surface marker and YFP expression from spleen and cLP of Atg16l1ΔFoxp3 and Foxp3Cre mice. Two hundred cells/population were sorted in triplicates from a total of four (spleen) or six (cLP) mice per group. Alternatively, 250 cells from in vitro polarized populations of TH2 and Treg cells were sorted from triplicate culture wells. RNA was reverse transcribed and cDNA was pre-amplified using the CellsDirect OneStep q-RT kit (Invitrogen). The selected autophagy, apoptotic and metabolic genes were amplified and analyzed for expression using a dynamic 48x48 array (Biomark Fluidigm) as previously described (Tehranchi et al., 2010). Data were analyzed using the 2-∆Ct method, and the results were normalized to actin or HPRTprt expression.
Statistical analysis
Request a detailed protocolFor weight curves and antibody titers, p-values were determined by two-way ANOVA with Bonferroni post-tests. For the metabolic analysis using XF 96 extracellular flux analyzer, p-values were determined using unpaired Student’s t-test. For all other experiments, p-values were determined by nonparametric Mann–Whitney test. Differences were considered statistically significant when p<0.05 (*<p0.05, **p<0.01, ***p<0.001). Data are shown as mean ± s.e.m. Statistics were calculated using GraphPad Prism 6 software. For in vivo experiments, sample size was determined by power analysis using power of trial software, which calculates a power value based on X2 test statistics. Calculated required sample sizes were applied whenever possible. No mouse was excluded from the analysis. With the exception of histological assessment of intestinal inflammation, experimenters were not 'blinded' to allocation of animals to experimental groups.
References
-
Inflammatory Bowel DiseaseNew England Journal of Medicine 361:2066–2078.https://doi.org/10.1056/NEJMra0804647
-
The regulation and function of Class III PI3Ks: novel roles for Vps34Biochemical Journal 410:1–17.https://doi.org/10.1042/BJ20071427
-
Food allergy: an enigmatic epidemicTrends in Immunology 34:390–397.https://doi.org/10.1016/j.it.2013.04.003
-
Regulatory T cells in nonlymphoid tissuesNature Immunology 14:1007–1013.https://doi.org/10.1038/ni.2683
-
IL-2 Receptor Signaling Is Essential for the Development of Klrg1+ Terminally Differentiated T Regulatory CellsThe Journal of Immunology 189:1780–1791.https://doi.org/10.4049/jimmunol.1103768
-
IL-1β mediates chronic intestinal inflammation by promoting the accumulation of IL-17A secreting innate lymphoid cells and CD4(+) Th17 cellsThe Journal of Experimental Medicine 209:1595–1609.https://doi.org/10.1084/jem.20111453
-
Regulatory Lymphocytes and Intestinal InflammationAnnual Review of Immunology 27:313–338.https://doi.org/10.1146/annurev.immunol.021908.132657
-
Temporal Regulation of Intracellular Organelle Homeostasis in T Lymphocytes by AutophagyThe Journal of Immunology 186:5313–5322.https://doi.org/10.4049/jimmunol.1002404
-
Autophagy at the crossroads of catabolism and anabolismNature Reviews Molecular Cell Biology 16:461–472.https://doi.org/10.1038/nrm4024
-
Heterogeneity of natural Foxp3+ T cells: a committed regulatory T-cell lineage and an uncommitted minor population retaining plasticityProceedings of the National Academy of Sciences of the United States of America 106:1903–1908.https://doi.org/10.1073/pnas.0811556106
-
Autophagy promotes T-cell survival through degradation of proteins of the cell death machineryCell Death and Differentiation 19:144–152.https://doi.org/10.1038/cdd.2011.78
-
Helicobacter hepaticus triggers colitis in specific-pathogen-free interleukin-10 (IL-10)-deficient mice through an IL-12- and gamma interferon-dependent mechanismInfection and Immunity 66:5157–5166.
-
Atg16L1 T300A variant decreases selective autophagy resulting in altered cytokine signaling and decreased antibacterial defenseProceedings of the National Academy of Sciences of the United States of America 111:7741–7746.https://doi.org/10.1073/pnas.1407001111
-
Autophagy Is Induced in CD4+ T Cells and Important for the Growth Factor-Withdrawal Cell DeathThe Journal of Immunology 177:5163–5168.https://doi.org/10.4049/jimmunol.177.8.5163
-
Homeostatic control of regulatory T cell diversityNature Reviews Immunology 14:154–165.https://doi.org/10.1038/nri3605
-
Fatty acid metabolism in the regulation of T cell functionTrends in Immunology 36:81–91.https://doi.org/10.1016/j.it.2014.12.005
-
Bacterial flagellin is a dominant antigen in Crohn diseaseJournal of Clinical Investigation 113:1296–1306.https://doi.org/10.1172/JCI200420295
-
Metabolic Regulation of T LymphocytesAnnual Review of Immunology 31:259–283.https://doi.org/10.1146/annurev-immunol-032712-095956
-
Mouse Apg16L, a novel WD-repeat protein, targets to the autophagic isolation membrane with the Apg12-Apg5 conjugateJournal of Cell Science 116:1679–1688.https://doi.org/10.1242/jcs.00381
-
Autophagy: process and functionGenes & Development 21:2861–2873.https://doi.org/10.1101/gad.1599207
-
Oral tolerance in the absence of naturally occurring TregsJournal of Clinical Investigation 115:1923–1933.https://doi.org/10.1172/JCI24487
-
Regulation of T cells by mTOR: the known knowns and the known unknownsTrends in Immunology 36:13–20.https://doi.org/10.1016/j.it.2014.11.005
-
Autophagy Is Essential for Mitochondrial Clearance in Mature T LymphocytesThe Journal of Immunology 182:4046–4055.https://doi.org/10.4049/jimmunol.0801143
-
Initial High-Dose Nasal Allergen Exposure Prevents Allergic Sensitization to a NeoantigenThe Journal of Immunology 174:7440–7445.https://doi.org/10.4049/jimmunol.174.11.7440
-
Survival of Effector CD8+ T Cells during Influenza Infection Is Dependent on AutophagyThe Journal of Immunology 194:4277–4286.https://doi.org/10.4049/jimmunol.1402571
-
CD4(+) T-cell subsets in intestinal inflammationImmunological Reviews 252:164–182.https://doi.org/10.1111/imr.12039
-
Selective Modulation of Autophagy, Innate Immunity, and Adaptive Immunity by Small MoleculesACS Chemical Biology 8:2724–2733.https://doi.org/10.1021/cb400352d
-
Experimental mouse models of T cell-dependent inflammatory bowel diseaseMethods Mol. Biol 1193:199–211.https://doi.org/10.1007/978-1-4939-1212-4_18
-
The immunology of mucosal models of inflammationAnnual Review of Immunology 20:495–549.https://doi.org/10.1146/annurev.immunol.20.100301.064816
-
Persistent Malignant Stem Cells in del(5q) Myelodysplasia in RemissionNew England Journal of Medicine 363:1025–1037.https://doi.org/10.1056/NEJMoa0912228
-
Characterization of Foxp3+CD4+CD25+ and IL-10-Secreting CD4+CD25+ T Cells during Cure of ColitisThe Journal of Immunology 177:5852–5860.https://doi.org/10.4049/jimmunol.177.9.5852
-
Advances in IBD geneticsNature Reviews Gastroenterology & Hepatology 11:372–385.https://doi.org/10.1038/nrgastro.2014.27
-
GATA3: a master of many trades in immune regulationTrends in Immunology 35:233–242.https://doi.org/10.1016/j.it.2014.04.002
-
Autophagy is essential for effector CD8+ T cell survival and memory formationNature Immunology 15:1152–1161.https://doi.org/10.1038/ni.3025
-
Vitamin D3 Induces Autophagy in Human Monocytes/Macrophages via CathelicidinCell Host & Microbe 6:231–243.https://doi.org/10.1016/j.chom.2009.08.004
Article and author information
Author details
Funding
Wellcome Trust (Graduate Student Scholarship 097112)
- Agnieszka Martyna Kabat
Wellcome Trust (100290)
- Simon P Forman
- Richard K Grencis
Wellcome Trust (100156)
- Simon P Forman
- Richard K Grencis
Medical Research Council (MR/K011898/1)
- Johanna Pott
- Kevin J Maloy
Wellcome Trust (102972)
- Kevin J Maloy
The funders had no role in study design, data collection and interpretation, or the decision to submit the work for publication.
Acknowledgements
We thank Herbert W Virgin and Thaddeus S Stappenbeck for mice with loxP-flanked Atg16l1 alleles, Naren Srinivasan for insight and comments on the manuscript and Duncan Howie, Holm Uhlig and members of the Kevin Maloy and Fiona Powrie groups for helpful discussions and technical help. The analysis of the B cell compartment was carried out using methods developed by the 3i consortium (www.immunophenotyping.org).
Ethics
Animal experimentation: All procedures on mice in this study were conducted in accordance with the UK Scientific Procedures Act (1986) under a project license (PPL 30/2872) authorized by the UK Home Office Animal Procedures Committee and approved by the Sir William Dunn School of Pathology Local Ethical Review Committee.
Version history
- Received: October 23, 2015
- Accepted: February 23, 2016
- Accepted Manuscript published: February 24, 2016 (version 1)
- Version of Record published: March 11, 2016 (version 2)
Copyright
This is an open-access article, free of all copyright, and may be freely reproduced, distributed, transmitted, modified, built upon, or otherwise used by anyone for any lawful purpose. The work is made available under the Creative Commons CC0 public domain dedication.
Metrics
-
- 5,381
- views
-
- 1,521
- downloads
-
- 147
- citations
Views, downloads and citations are aggregated across all versions of this paper published by eLife.
Download links
A two-part list of links to download the article, or parts of the article, in various formats.
Downloads (link to download the article as PDF)
Open citations (links to open the citations from this article in various online reference manager services)
Cite this article (links to download the citations from this article in formats compatible with various reference manager tools)
The autophagy gene Atg16l1 differentially regulates Treg and TH2 cells to control intestinal inflammation
eLife 5:e12444.
https://doi.org/10.7554/eLife.12444
Further reading
-
- Genetics and Genomics
- Immunology and Inflammation
Transposable elements (TEs) are repetitive sequences representing ~45% of the human and mouse genomes and are highly expressed by medullary thymic epithelial cells (mTECs). In this study, we investigated the role of TEs on T-cell development in the thymus. We performed multiomic analyses of TEs in human and mouse thymic cells to elucidate their role in T-cell development. We report that TE expression in the human thymus is high and shows extensive age- and cell lineage-related variations. TE expression correlates with multiple transcription factors in all cell types of the human thymus. Two cell types express particularly broad TE repertoires: mTECs and plasmacytoid dendritic cells (pDCs). In mTECs, transcriptomic data suggest that TEs interact with transcription factors essential for mTEC development and function (e.g., PAX1 and REL), and immunopeptidomic data showed that TEs generate MHC-I-associated peptides implicated in thymocyte education. Notably, AIRE, FEZF2, and CHD4 regulate small yet non-redundant sets of TEs in murine mTECs. Human thymic pDCs homogenously express large numbers of TEs that likely form dsRNA, which can activate innate immune receptors, potentially explaining why thymic pDCs constitutively secrete IFN ɑ/β. This study highlights the diversity of interactions between TEs and the adaptive immune system. TEs are genetic parasites, and the two thymic cell types most affected by TEs (mTEcs and pDCs) are essential to establishing central T-cell tolerance. Therefore, we propose that orchestrating TE expression in thymic cells is critical to prevent autoimmunity in vertebrates.
-
- Immunology and Inflammation
Anticancer treatments can result in various adverse effects, including infections due to immune suppression/dysregulation and drug-induced toxicity in the lung. One of the major opportunistic infections is Pneumocystis jirovecii pneumonia (PCP), which can cause severe respiratory complications and high mortality rates. Cytotoxic drugs and immune-checkpoint inhibitors (ICIs) can induce interstitial lung diseases (ILDs). Nonetheless, the differentiation of these diseases can be difficult, and the pathogenic mechanisms of such diseases are not yet fully understood. To better comprehend the immunophenotypes, we conducted an exploratory mass cytometry analysis of immune cell subsets in bronchoalveolar lavage fluid from patients with PCP, cytotoxic drug-induced ILD (DI-ILD), and ICI-associated ILD (ICI-ILD) using two panels containing 64 markers. In PCP, we observed an expansion of the CD16+ T cell population, with the highest CD16+ T proportion in a fatal case. In ICI-ILD, we found an increase in CD57+ CD8+ T cells expressing immune checkpoints (TIGIT+ LAG3+ TIM-3+ PD-1+), FCRL5+ B cells, and CCR2+ CCR5+ CD14+ monocytes. These findings uncover the diverse immunophenotypes and possible pathomechanisms of cancer treatment-related pneumonitis.


