Hand2 inhibits kidney specification while promoting vein formation within the posterior mesoderm
- University of California, San Diego, United States
- School of Medicine, University of California, San Diego, United States
- Universidad de los Andes, Colombia
Abstract
Proper organogenesis depends upon defining the precise dimensions of organ progenitor territories. Kidney progenitors originate within the intermediate mesoderm (IM), but the pathways that set the boundaries of the IM are poorly understood. Here, we show that the bHLH transcription factor Hand2 limits the size of the embryonic kidney by restricting IM dimensions. The IM is expanded in zebrafish hand2 mutants and is diminished when hand2 is overexpressed. Within the posterior mesoderm, hand2 is expressed laterally adjacent to the IM. Venous progenitors arise between these two territories, and hand2 promotes venous development while inhibiting IM formation at this interface. Furthermore, hand2 and the co-expressed zinc-finger transcription factor osr1 have functionally antagonistic influences on kidney development. Together, our data suggest that hand2 functions in opposition to osr1 to balance the formation of kidney and vein progenitors by regulating cell fate decisions at the lateral boundary of the IM.
https://doi.org/10.7554/eLife.19941.001eLife digest
The human body is made up of many different types of cells, yet they are all descended from one single fertilized egg cell. The process by which cells specialize into different types is complex and has many stages. At each step of the process, the selection of cell types that a cell can eventually become is increasingly restricted. The entire system is controlled by switching different genes on and off in different groups of cells. Balancing the activity of these genes ensures that enough cells of each type are made in order to build a complete and healthy body. Upsetting this balance can result in organs that are too large, too small or even missing altogether.
The cells that form the kidneys and bladder originate within a tissue called the intermediate mesoderm. Controlling the size of this tissue is an important part of building working kidneys. Perens et al. studied how genes control the size of the intermediate mesoderm of zebrafish embryos, which is very similar to the intermediate mesoderm of humans. The experiments revealed that a gene called hand2, which is switched on in cells next to the intermediate mesoderm, restricts the size of this tissue in order to determine the proper size of the kidney. Switching off the hand2 gene resulted in zebrafish with abnormally large kidneys. Loss of hand2 also led to the loss of a different type of cell that forms veins. These findings suggest that cells with an active hand2 gene are unable to become intermediate mesoderm cells and instead go on to become part of the veins.
These experiments also demonstrated that a gene called osr1 works in opposition to hand2 to determine the right number of cells that are needed to build the kidneys. Further work will reveal how hand2 prevents cells from joining the intermediate mesoderm and how its role is balanced by the activity of osr1. Understanding how the kidneys form could eventually help to diagnose or treat several genetic diseases and may make it possible to grow replacement kidneys from unspecialized cells.
https://doi.org/10.7554/eLife.19941.002Introduction
Organs arise from precisely defined territories containing progenitor cells with specific developmental potential. Distinct progenitor territories often abut one another, and communication at the interfaces between neighboring territories acts to refine their boundaries (Dahmann et al., 2011). This process delineates the final dimensions of each territory and, subsequently, influences the sizes of the derived organs. Boundary refinement is generally thought to be mediated by interplay between opposing inductive and suppressive factors (Briscoe and Small, 2015). In many cases, however, the identification of and interactions among these factors remain elusive.
Kidney progenitor cells originate from the intermediate mesoderm (IM), a pair of narrow bilateral stripes within the posterior mesoderm, flanked by lateral mesoderm that gives rise to vessels and blood and by paraxial mesoderm that gives rise to bone, cartilage, and skeletal muscle. The mechanisms that determine the dimensions of the stripes of IM are not fully understood. Several conserved transcription factors are expressed in the IM and are required for its development, including Lhx1/Lim1, Pax2, and Osr1/Odd1 (Dressler and Douglass, 1992; James et al., 2006; Krauss et al., 1991; Toyama and Dawid, 1997; Tsang et al., 2000; Wang et al., 2005). Studies in chick have indicated essential roles for the lateral mesoderm, paraxial mesoderm, and surface ectoderm in regulating the expression of these transcription factors (James and Schultheiss, 2003; Mauch et al., 2000; Obara-Ishihara et al., 1999). Furthermore, TGF-beta signaling acts in a dose-dependent manner to pattern the medial-lateral axis of the posterior mesoderm: for example, low levels of BMP signaling promote IM formation while high levels of BMP signaling promote lateral mesoderm formation (Fleming et al., 2013; James and Schultheiss, 2005). Beyond these insights, the pathways that set the boundaries of the IM and distinguish this territory from its neighbors are largely unknown.
Several lines of evidence have suggested that a carefully regulated refinement process is required to sharpen the boundary between the IM and the lateral mesoderm. In chick, mouse, and Xenopus, Osr1 and Lim1 are expressed in both the lateral mesoderm and the IM before becoming restricted to the IM, implying the existence of a mechanism that acts to exclude IM gene expression from the neighboring lateral territory (Carroll and Vize, 1999; James et al., 2006; Mugford et al., 2008; Tsang et al., 2000). Additional data have hinted at an antagonistic relationship between the IM and the blood and vessel lineages (Gering et al., 2003; Gupta et al., 2006): for example, overexpression of vascular and hematopoietic transcription factors (tal1 and lmo2) induces ectopic vessel and blood specification while inhibiting IM formation (Gering et al., 2003). Along the same lines, zebrafish osr1 morphants exhibit disrupted pronephron formation together with expanded venous structures (Mudumana et al., 2008). Despite these indications of interconnections between IM and vessel development, the network of factors that link these processes has not been fully elucidated.
Here, we establish previously unappreciated roles for the bHLH transcription factor Hand2 in both IM and vessel formation. Prior studies of Hand2 have focused on its functions in other tissues, including the heart, limb, and branchial arches (e.g. Charité et al., 2000; Fernandez-Teran et al., 2000; Funato et al., 2009; Miller et al., 2003; Srivastava et al., 1997; Yanagisawa et al., 2003; Yelon et al., 2000). Although Hand2 is also expressed in the posterior mesoderm (Angelo et al., 2000; Fernandez-Teran et al., 2000; Srivastava et al., 1997; Thomas et al., 1998; Yelon et al., 2000; Yin et al., 2010), its influence on patterning this tissue has not been extensively explored. Through both loss-of-function and gain-of-function studies, we find that hand2 limits the size of the kidney by repressing IM formation while promoting venous progenitor formation. hand2 is expressed laterally adjacent to the IM, and a set of venous progenitors arise at the interface between the hand2-expressing cells and the IM. Ectopic expression of IM markers within the hand2-expressing territory in hand2 mutants suggests that hand2 establishes the lateral boundary of the IM through direct inhibition of IM fate acquisition. Finally, genetic analysis indicates that hand2 functions in opposition to osr1 to control kidney dimensions. Together, our data demonstrate a novel mechanism for defining territory boundaries within the posterior mesoderm: hand2 represses IM formation to establish its lateral boundary while promoting venous progenitor formation in this region. These important functions of Hand2 help to define the precise dimensions and components of the kidneys and vasculature. Moreover, these findings have implications for understanding the genetic basis of congenital anomalies of the kidney and urinary tract (CAKUT) and for developing new approaches in regenerative medicine.
Results
hand2 limits pronephron dimensions by repressing pronephron formation
Our interest in the role of hand2 during kidney development began with an observation arising from our previously reported microarray analysis of hand2 mutants (Garavito-Aguilar et al., 2010). We compared gene expression profiles at 20 hr post fertilization (hpf) in wild-type embryos and hans6 mutant embryos, which contain a deletion that removes the entire coding region of hand2 (Yelon et al., 2000). Surprisingly, 11 of the 26 transcripts that were increased in hans6 relative to wild-type were expressed in the pronephron, the embryonic kidney. (For a full list of differentially expressed genes, see Garavito-Aguilar et al., 2010.) We therefore sought to understand the effect of hand2 function on the pronephron.
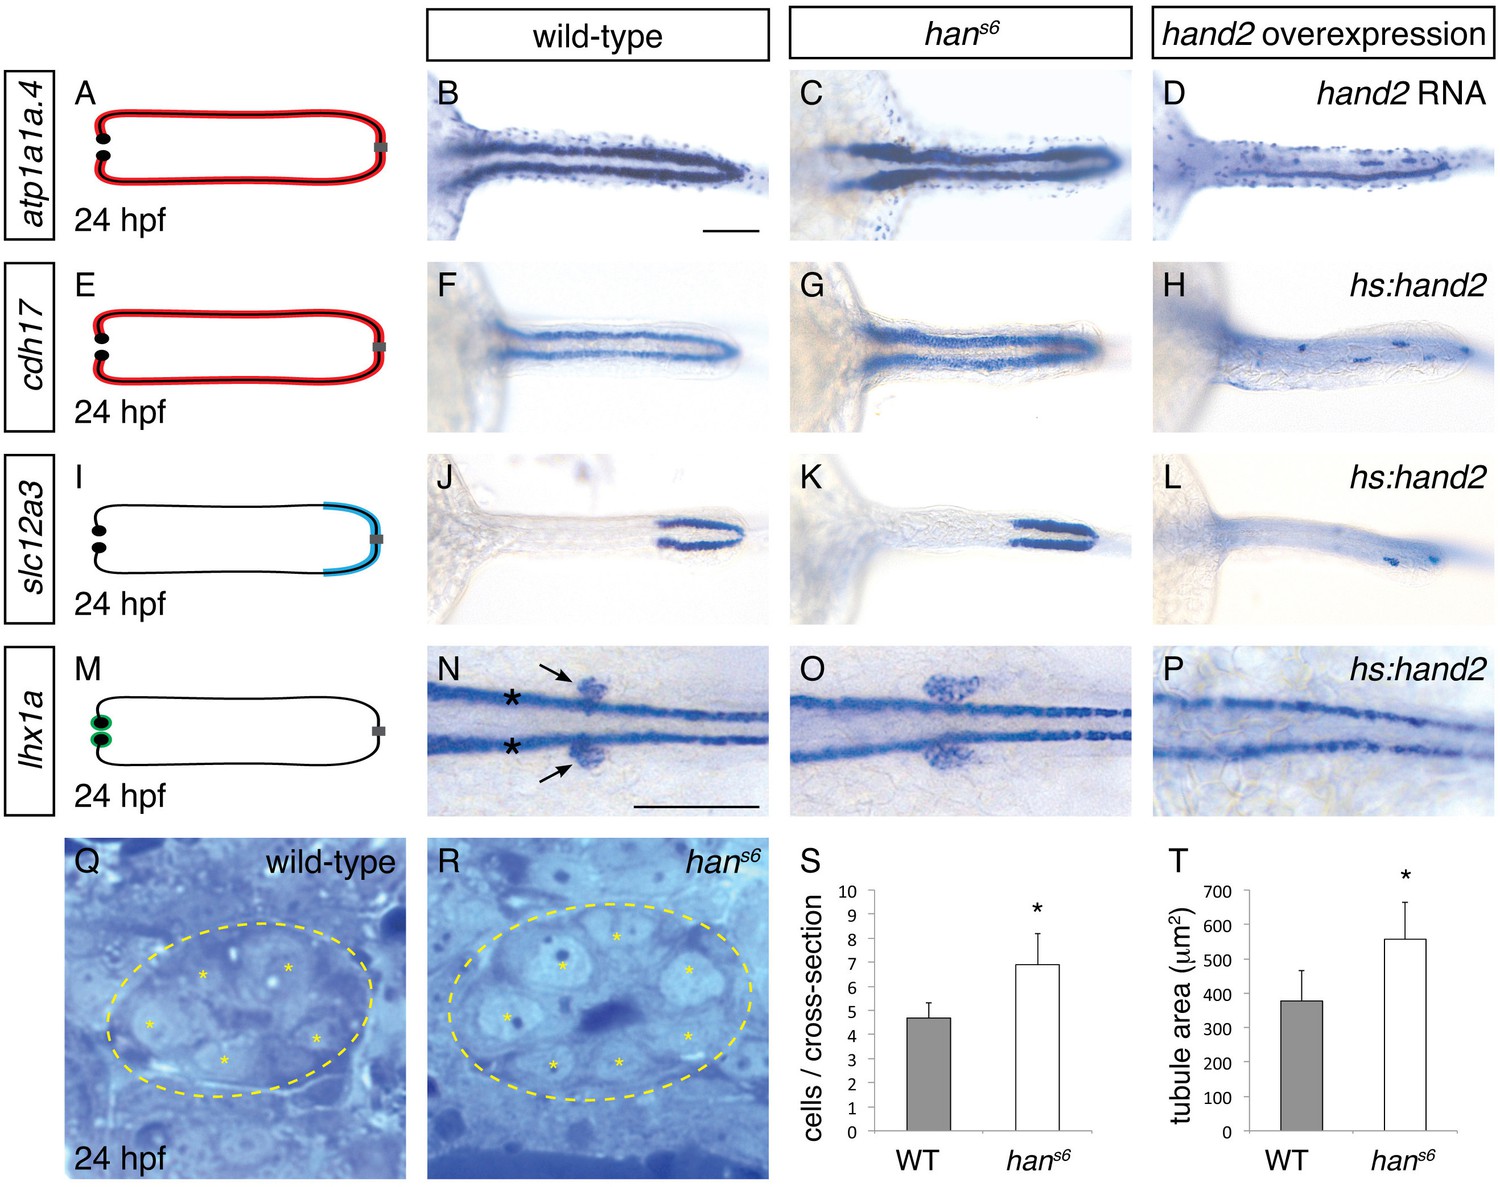
The six genes with the most elevated expression in hans6 mutants (Garavito-Aguilar et al., 2010) are all expressed in the pronephron tubules. We examined the expression of two of these genes that are expressed throughout the tubules -- atp1a1a.4, which encodes a subunit of the Na+/K+ ATPase (Thisse et al., 2004), and cadherin17 (cdh17) (Horsfield et al., 2002) -- and observed an increase in tubule width in hans6 (Figure 1A–C, E–G). A similar increase in width of expression was seen for another gene upregulated in hans6 but only expressed in a single tubule segment (Wingert et al., 2007), slc12a3 (Figure 1I–K), which encodes the thiazide-sensitive sodium-chloride cotransporter solute carrier 12a3. Notably, in contrast to its widened expression, the anterior-posterior extent of slc12a3 expression appeared unaltered. Last, by examining expression of lhx1a and pax2a, which mark glomerular precursors at 24 hpf (O'Brien et al., 2011), we found that the populations of glomerular precursors, like the tubules, were expanded in hans6 (Figure 1M–O and Figure 8B,C). Thus, the elevated gene expression detected by microarray analysis in hans6 mutants corresponded with broadened expression of genes throughout the pronephron.
Figure 1
hand2 inhibits pronephron formation.
(A–P) Dorsal views, anterior to the left, of pronephron schematics (A, E, I, M), wild-type embryos (B, F, J, N), hans6 mutant embryos (C, G, K, O), and hand2-overexpressing embryos (D, injected with hand2 mRNA; H, L, P, carrying Tg(hsp70-hand2-2A-mcherry), abbreviated hs:hand2) at 24 hpf. In schematics (A, E, I, M), colored regions correspond to area of pronephron gene expression. In situ hybridization demonstrates that atp1a1a.4 (A–D) and cdh17 (E–H) are expressed throughout the pronephron tubules, slc12a3 (I–L) is expressed in the distal late segments of the pronephron tubules, and lhx1a (M–P) is expressed in the glomerular precursors (arrows, N), as well as overlying spinal neurons (asterisks, N). Compared to wild-type (B, F, J, N), gene expression is expanded in hans6 mutants (C, G, K, O) and reduced in hand2-overexpressing embryos (D, H, L, P). Of note, injection of a hand2 translation-blocking morpholino caused effects on pronephron formation similar to those seen in hans6 mutants (data not shown). Scale bars represent 100 μm. (Q, R) Transverse sections through wild-type (Q) and hans6 mutant (R) pronephron tubules at 24 hpf. Dashed lines outline the tubule and asterisks indicate individual tubule cells. (S, T) Bar graphs indicate the average number of tubule cells per cross-section (S) and the average tubule area per cross-section (T) in wild-type and hans6 mutant embryos; error bars indicate standard deviation. Asterisks indicate statistically significant differences compared to wild-type (p<0.0001, Student’s t test; n = 18).
-
Figure 1—source data 1
Number of tubule cells per cross-section.
Number of tubule cells observed in transverse sections from embryos at 24 hpf were quantified at three different anterior-posterior levels along the pronephron, with two sections analyzed per level in each embryo. Three animals for each genotype (wild-type and hans6) were examined. Average number of cells and standard deviation are represented in Figure 1S.
- https://doi.org/10.7554/eLife.19941.004
-
Figure 1—source data 2
Area of pronephron tubule in cross-section.
Pronephron tubules in transverse sections from embryos at 24 hpf were measured at three different anterior-posterior levels along the pronephron, with two sections analyzed per level in each embryo. Three animals for each genotype (wild-type and hans6) were examined. Average tubule area and standard deviation are represented in Figure 1T.
- https://doi.org/10.7554/eLife.19941.005
To determine if this broadened expression was due to an increase in cell number, we next analyzed the structure of the pronephron in more detail. We found that the number of cells seen in cross-section of the tubule was increased in hans6 (Figure 1Q–S). This increase in cell number was observed at multiple regions along the anterior-posterior axis, suggesting that the entire pronephron is expanded. Concomitant with this increase in the number of cells, the total tubule area in cross-section was increased in hans6 mutants (Figure 1T). Together with the expanded expression of pronephron genes, these findings implicate hand2 in inhibiting the accumulation of pronephron cells.
Does hand2 simply prevent excessive expansion of the pronephron or is it potent enough to repress pronephron formation? To differentiate between these possibilities, we examined the effects of hand2 overexpression on the pronephron. Injection of hand2 mRNA inhibited pronephron formation, as assessed by atp1a1a.4 expression (Figure 1D). To bypass any potential effects of overexpression on gastrulation, we also utilized our previously characterized Tg(hsp70:FLAG-hand2-2A-mCherry) transgenic line to drive hand2 expression at the tailbud stage (Schindler et al., 2014). Heat shock-induced overexpression resulted in pronephron defects comparable to those caused by mRNA injection, as assessed by atp1a1a.4, cdh17 and slc12a3 expression (Figure 1H,L and Figure 3A,B). Furthermore, like tubule gene expression, lhx1a and pax2a expression in glomerular precursors was dramatically inhibited by hand2 overexpression (Figure 1P and data not shown), again emphasizing the broad effect of hand2 function on pronephron formation. In contrast to these effects of hand2 overexpression on the pronephron, most other regions of expression of these markers, such as expression of atp1a1a.4 in mucus-secreting cells and expression of lhx1a in spinal neurons, were unaffected (Figure 1D,P). Thus, the effect of hand2 overexpression seems to reflect its particular impact on pronephron development, as opposed to a general influence of hand2 on the expression of each of these genes. Of note, however, we did observe a dramatic reduction in otic vesicle expression of both atp1a1a.4 and pax2a (data not shown), suggesting a shared susceptibility to hand2 overexpression in the otic vesicles and the pronephron. Taken together, our loss-of-function and gain-of-function studies show that hand2 is necessary to constrain the size of the pronephron, likely through an ability to repress pronephron formation.
hand2 limits intermediate mesoderm dimensions by repressing intermediate mesoderm formation
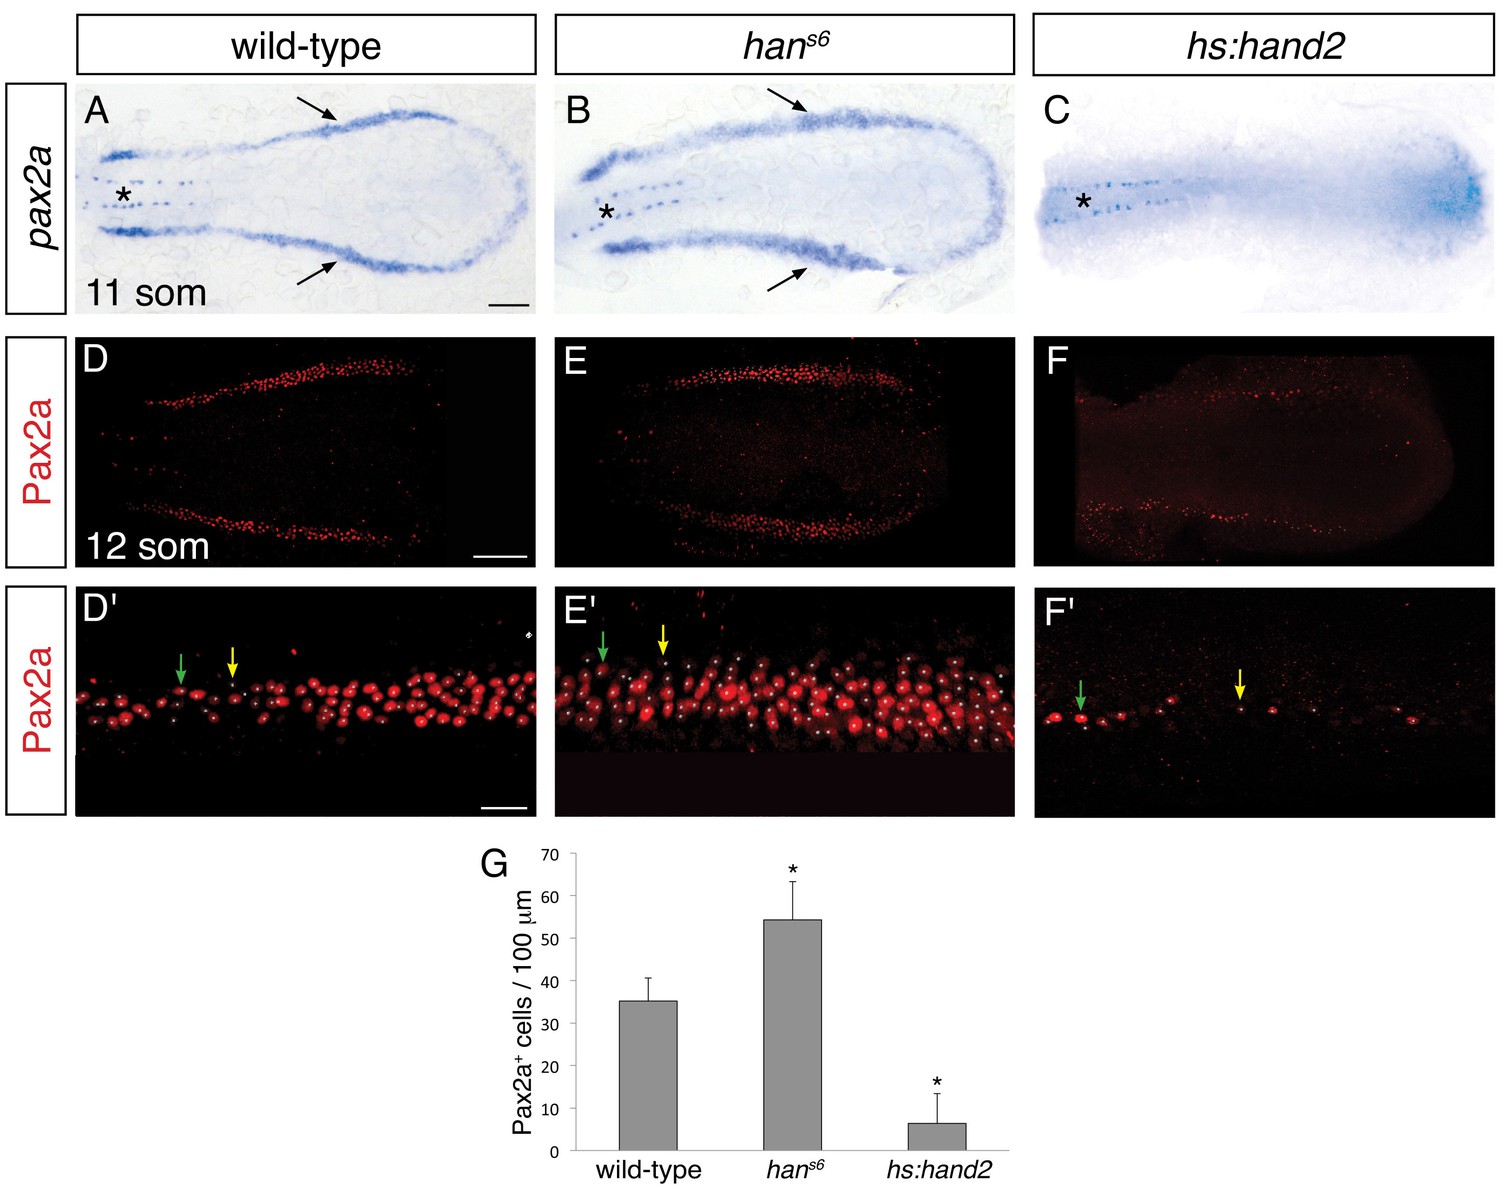
We next sought to determine the origin of the effect of hand2 on the pronephron, and we hypothesized that the pronephron defects observed in hans6 mutants might reflect a requirement for hand2 to limit IM dimensions. Indeed, using two established IM markers, pax2a and lhx1a, we observed that the width of the IM was expanded in hans6 mutants and hand2 morphants (Figure 2A,B and Figure 2—figure supplement 1A,B), at stages shortly after gastrulation (i.e. at the 6, 10 and 12 somite stages). In contrast, there was no substantial difference in the length of the IM seen in wild-type and hans6 mutant embryos (Figure 2A,B). Furthermore, compared to wild-type embryos, hans6 mutants typically had ~50% more Pax2a+ IM cells (Figure 2D,E,G). This accumulation of IM cells did not appear to be associated with heightened proliferation within the IM (Figure 2—figure supplement 2). Thus, our data suggest that hand2 restricts the initial formation of the IM.
Figure 2 with 2 supplements see all
hand2 inhibits IM production.
(A–C) Dorsal views, anterior to the left, of the posterior mesoderm at the 11 somite stage. In situ hybridization depicts normal expression of pax2a in the IM (arrows) of wild-type embryos (A), widened expression in hans6 mutants (B), and lack of expression in hand2-overexpressing embryos (hs:hand2) (C). Expression in the spinal neurons (asterisk) is unaffected by altered hand2 function. Scale bar represents 100 μm. (D–F) Pax2a immunofluorescence in the posterior mesoderm of wild-type (D), hans6 mutant (E), and hs:hand2 (F) embryos at the 12 somite stage. Dorsal views, anterior to the left, are three-dimensional reconstructions of flat-mounted embryos from which the yolk and anterior tissues have been dissected away. Scale bar represents 100 μm. (D'–F') Magnification of 250 µm long regions from (D–F) used for quantification of the number of Pax2a+ cells in wild-type (D'), hans6 mutant (E'), and hs:hand2 (F') embryos. White dots indicate Pax2a+ nuclei. Intensity of staining varied from strong (for example, green arrows) to weak (for example, yellow arrows). Scale bar represents 25 μm. (G) Bar graph indicates the average number of Pax2a+ cells per 100 µm of IM in wild-type, hans6, and hs:hand2 mutant embryos; error bars indicate standard deviation. Asterisks indicate a statistically significant difference compared to wild-type (p<0.0001, Student’s t test; n=13 for wild-type, n=10 for hans6, and n=19 for hs:hand2).
-
Figure 2—source data 1
Pax2a+ cells in wild-type, hans6, and hs:hand2 intermediate mesoderm.
The number of Pax2a+ cells was quantified on the indicated dates of analysis. For wild-type and hans6 embryos, representative 250 μm long regions of IM were analyzed, while for hs:hand2 embryos, 500 μm long regions of IM were analyzed. For hs:hand2 embryos, the IM on both the left and right sides of the embryo were analyzed independently when the dissection and preparation of the sample allowed. All values were normalized to represent the number of cells per 100 μm. Average number of Pax2a+ cells per 100 μm and standard deviation are represented in Figure 2G.
- https://doi.org/10.7554/eLife.19941.007
To determine whether hand2 is sufficient to repress IM formation, we examined the effects of hand2 overexpression. Both hand2 mRNA injection and heat shock-induced overexpression of hand2 resulted in loss of IM, as determined by pax2a and lhx1a expression (Figure 2C and Figure 2—figure supplement 1C). More specifically, hand2-overexpressing embryos exhibited phenotypes ranging from a significantly reduced number of Pax2a+ IM cells to a complete absence of Pax2a+ IM (Figure 2F,G). Taken together with our loss-of-function analyses, these results suggest that hand2 limits the dimensions of the IM by repressing its initial specification.
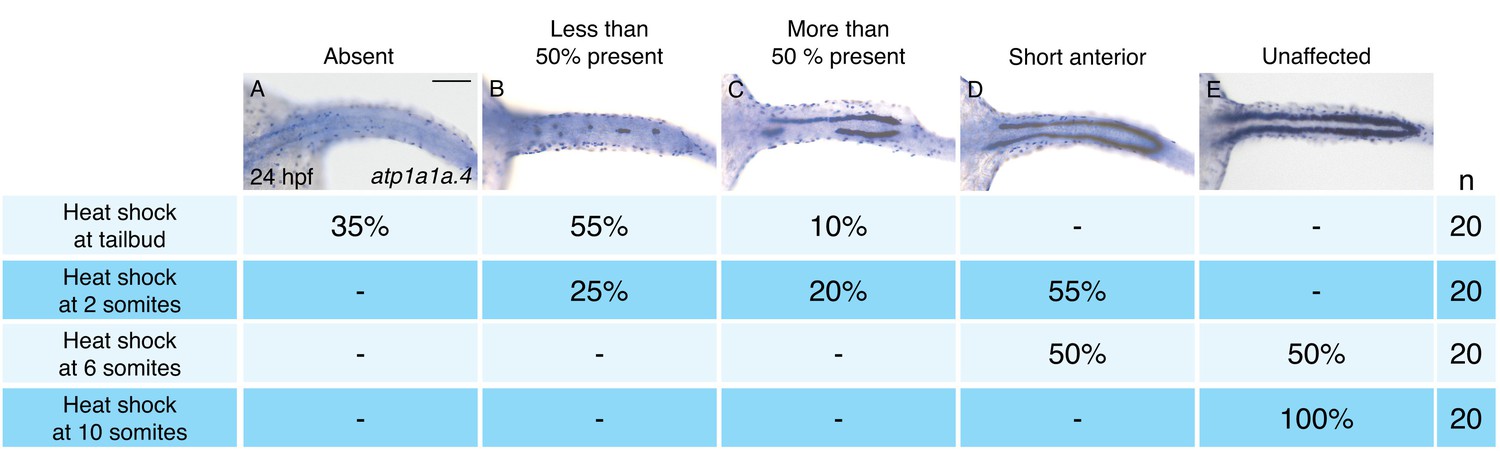
To define the time window during which hand2 overexpression can inhibit IM formation, we utilized Tg(hsp70:FLAG-hand2-2A-mCherry) embryos to induce hand2 expression at different times after gastrulation (Figure 3). Unlike overexpression at the tailbud, 2 somite, or 6 somite stages (Figure 3A–D), overexpression at the 10 somite stage failed to inhibit pronephron development (Figure 3E). Furthermore, we found progressively less severe defects as heat shock induction was performed at successively later stages between tailbud and 10 somites. For example, while inhibition at the tailbud or 2 somite stages resulted in the loss of the majority of pronephric atp1a1a.4 expression (Figure 3A,B), inhibition at the 6 somite stage resulted in only a mild reduction (Figure 3D). Overall, our analysis suggests that there is a hand2-sensitive phase of IM specification prior to the 10 somite stage.
Figure 3
Pronephron development is susceptible to hand2 overexpression prior to the 10 somite stage.
(A–E) Dorsal views, anterior to the left, of in situ hybridization for atp1a1a.4 at 24 hpf depict a range of severity of pronephron defects, ranging from absence of the pronephron (A) to unaffected (E). Tg(hsp70:FLAG-hand2-2A-mCherry) embryos were subjected to heat shock at the tailbud, 2 somite, 6 somite, or 10 somite stages, and the consequences on pronephron development were scored at 24 hpf. Percentages indicate the distribution of phenotypes produced by each treatment; the number of embryos examined is in the right-hand column. Heat shock at later stages resulted in more mild loss of atp1a1a.4 expression in the tubule, and heat shock at the 10 somite stage did not disrupt atp1a1a.4 expression in the tubule. Scale bar represents 100 μm.
hand2 is expressed beside the lateral boundary of the intermediate mesoderm
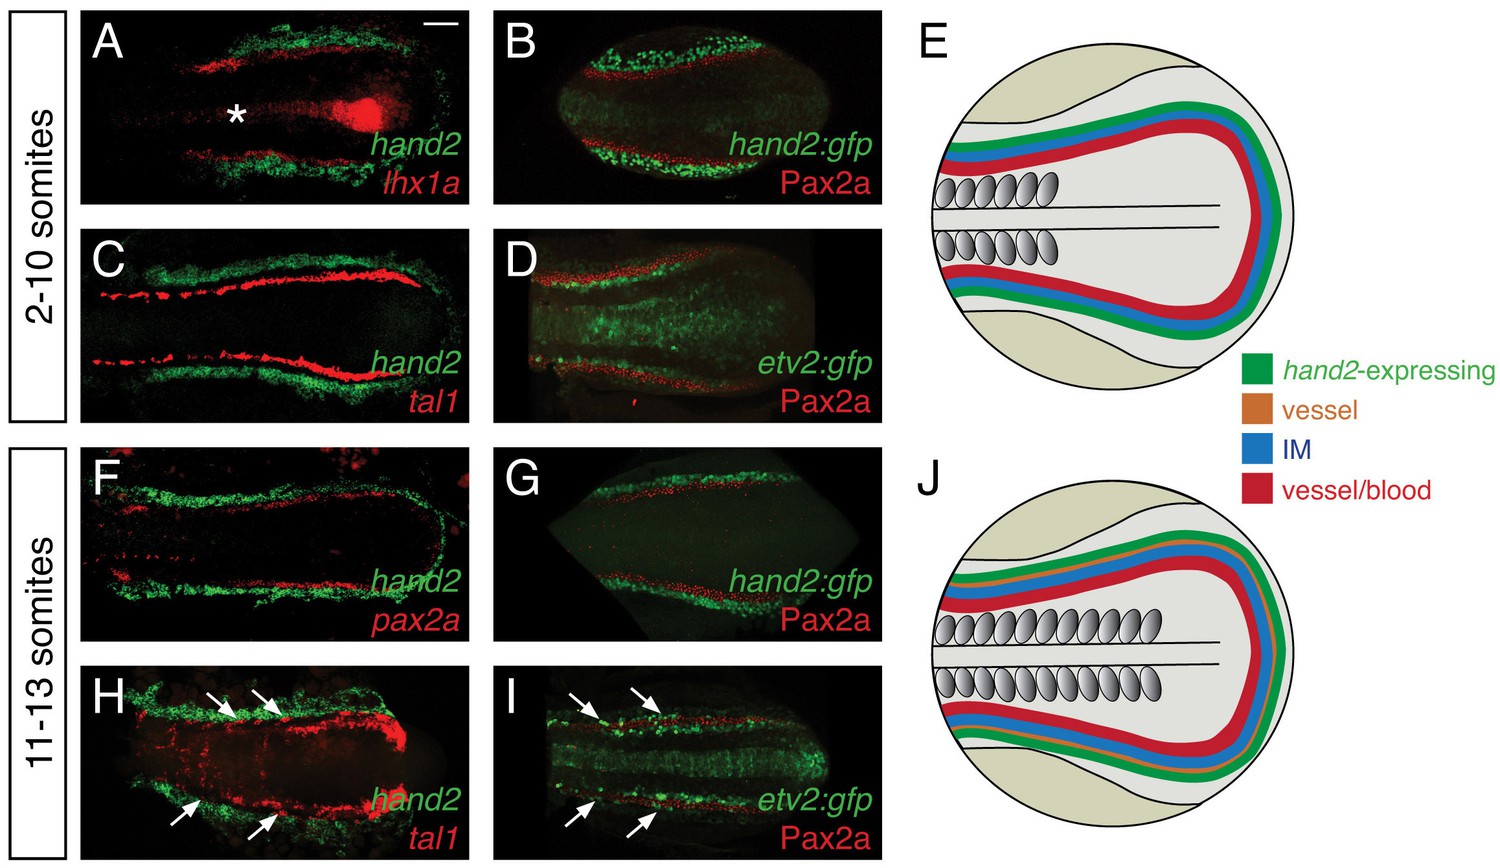
Considering the strong effect of hand2 function on repressing IM formation, we sought to define the location of hand2 expression relative to the IM. Prior studies had demonstrated bilateral hand2 expression in the posterior mesoderm of zebrafish, mouse, chick, and Xenopus embryos (Angelo et al., 2000; Fernandez-Teran et al., 2000; Srivastava et al., 1997; Thomas et al., 1998; Yelon et al., 2000; Yin et al., 2010), but the precise localization of this expression relative to the IM had not been determined. During the hand2-sensitive phase of IM formation, we found hand2 to be expressed in bilateral regions immediately lateral to the IM (Figure 4A,B). At these stages, hand2 was also expressed lateral to multiple markers of blood and vessel progenitors, including etv2, tal1, and gata1 (Figure 4C and data not shown). However, a gap lies between these markers and the hand2-expressing cells, consistent with the IM residing between the lateral hand2-expressing cells and the medial blood and vessel progenitors (Figure 4C,D).
Figure 4
hand2 expression in the posterior lateral mesoderm.
(A–D, F–I) Two-color fluorescent in situ hybridization (A, C, F, H) and immunofluorescence (B, D, G, I) label components of the posterior mesoderm in dorsal views, anterior to the left, of three-dimensional reconstructions, as in Figure 2D–E. In embryos containing transgenes in which GFP expression is driven by the regulatory elements of hand2 (B, G) or etv2 (D, I), anti-GFP immunofluorescence was used to enhance visualization. Tg(etv2:egfp) expression was also observed in the midline neural tube, as previously reported (Proulx et al., 2010). Scale bar represents 100 μm. (E, J) Schematics depict posterior mesoderm territories, dorsal views, anterior to the left; hand2-expressing cells, IM, and medial vessel/blood progenitors are shown at 2–10 somites (E) and at 11–13 somites (J), together with lateral vessel progenitors. (A–D) hand2 is expressed lateral to the IM at the 2–10 somite stages. Embryos shown are at the 10 somite stage; similar expression patterns were seen at earlier stages. (A, B) hand2 is expressed lateral to the IM markers lhx1a (A) and Pax2a (B). (C) hand2 is expressed lateral to tal1, a marker of blood and vessel progenitors; note the unlabeled gap between expression territories. (D) A marker of vessel progenitors, Tg(etv2:egfp), lies medially adjacent to Pax2a. (F–I) Vessel progenitors arise at the interface between hand2-expressing cells and the IM at the 11–13 somite stages. (F, G) hand2 is expressed lateral to the IM marker pax2a. (H) hand2 is expressed lateral to a second territory of tal1 expression; note the presence of lateral tal1-expressing cells (arrows) immediately adjacent to hand2 expression. (I) The IM lies between two territories of etv2 expression; the more lateral etv2-expressing cells (arrows) are lateral to the IM.
We also found that the relationship between hand2 expression, the IM, and blood and vessel progenitors changed after the completion of the hand2-sensitive phase of IM formation. At approximately the 11 somite stage, a second, lateral population of vessel progenitors arises at the interface between the IM and the hand2-expressing cells (Figure 4F–I). These lateral vessel progenitors are likely to be venous progenitors, based on the results of a prior study that suggested that the medial, earlier-forming vessel progenitors contribute to the dorsal aorta and that the lateral, later-forming vessel progenitors contribute to the primary cardinal vein (Kohli et al., 2013).
This set of results defines the general location of hand2 expression relative to other territories within the posterior mesoderm (Figure 4E,J). However, these observations do not exclude the possibility of transient overlapping expression at the boundaries of each territory (e.g. overlapping etv2 and pax2a expression). Furthermore, we note that gene expression patterns are not necessarily uniform within each territory (e.g. tal1 and etv2 expression patterns are neither uniform nor equivalent within their territory [Kohli et al., 2013]). Nevertheless, our data suggest that, during the hand2-sensitive phase of IM formation, hand2 may exert its repressive effect on IM formation by constraining the lateral boundary of the IM. Furthermore, our findings suggest the possibility of close interactions between hand2, the IM, and the lateral population of venous progenitors.
hand2 promotes lateral venous progenitor development in the posterior mesoderm
The appearance of lateral venous progenitor cells at the interface between the IM and the hand2-expressing cells raised the question of whether hand2 regulates the development of these venous progenitors. To address this possibility, we first assessed the early expression of etv2, tal1, and gata1 in the medial population of vessel and blood progenitors, and we observed no differences between wild-type and hans6 mutant embryos at either the 6 or 10 somite stages (Figure 5—figure supplement 1 and data not shown). In contrast, after the 11 somite stage, expression of both etv2 and tal1 in the lateral venous progenitor population was absent in hans6 mutants (Figure 5A,B,F,G). Two-color fluorescent in situ hybridization confirmed the medial location of the remaining territory of etv2 and tal1 expression in hand2 loss-of-function embryos (Figure 5D,E,I,J). Thus, the formation of the lateral venous progenitors, the appearance of which coincides with the end of the hand2-responsive phase of IM formation, requires hand2.
Figure 5 with 1 supplement see all
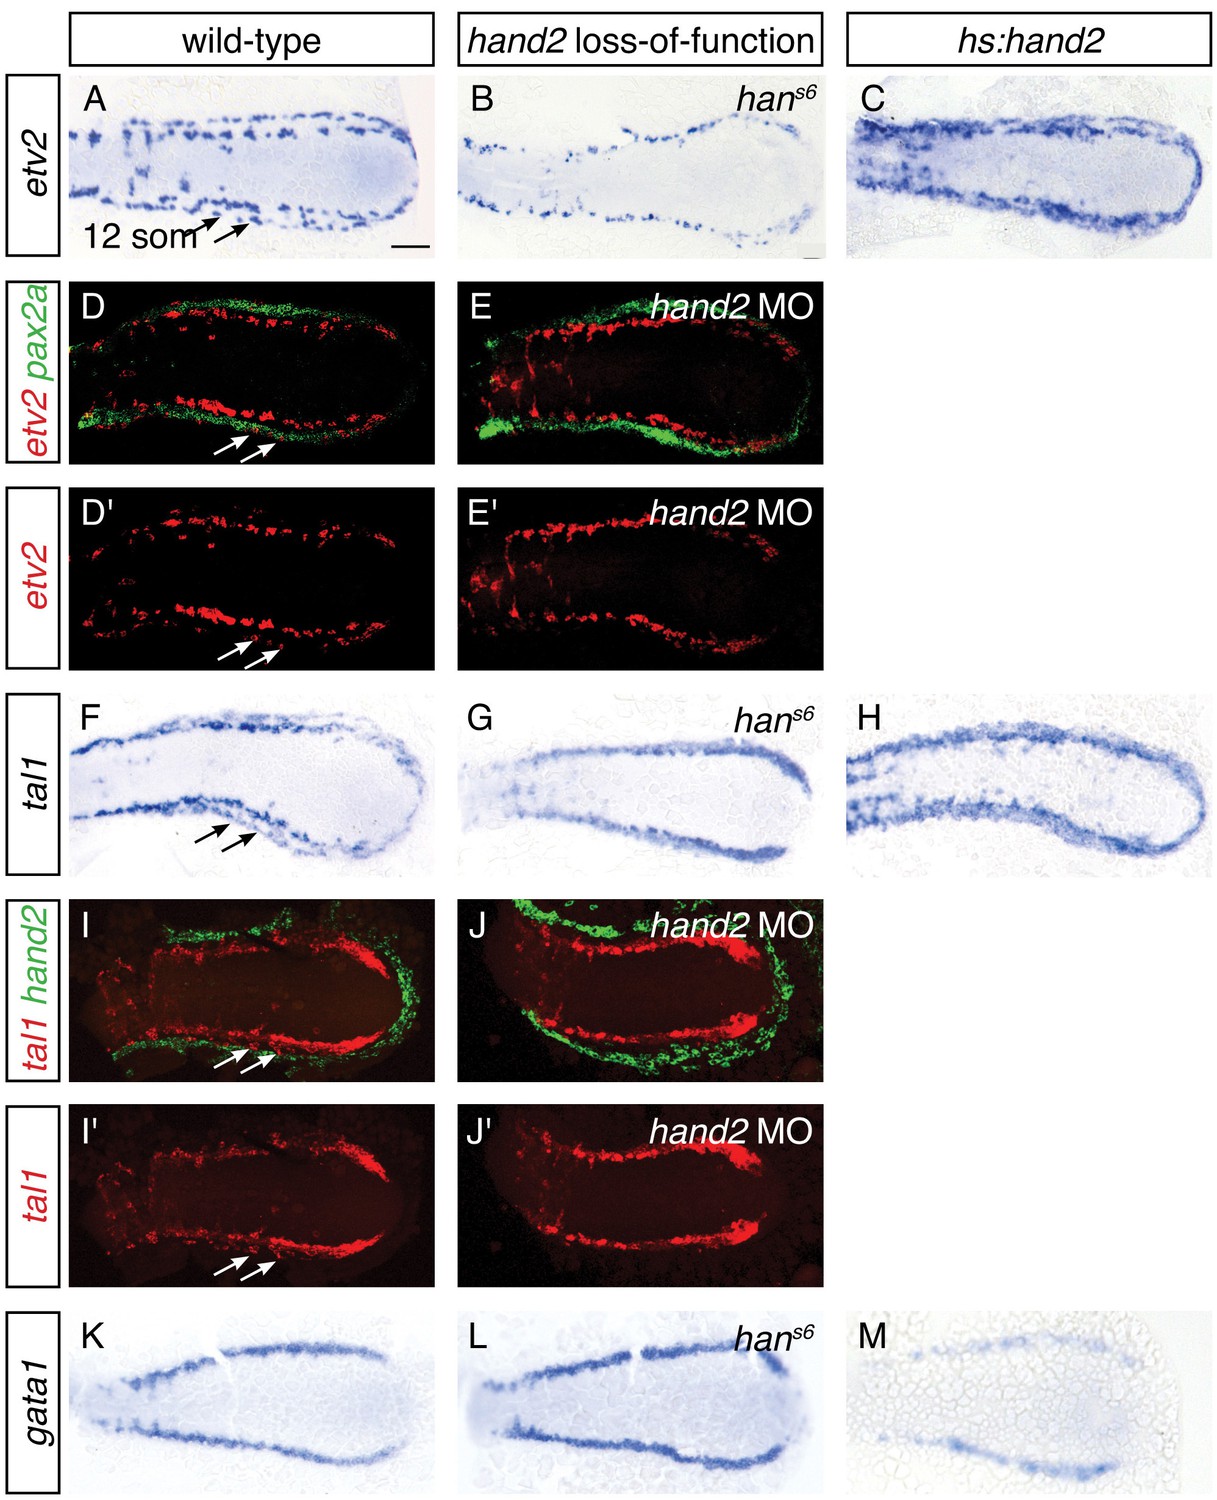
hand2 promotes vessel progenitor development.
(A–C, F–H, K–M) In situ hybridization depicts etv2 (A–C), tal1 (F–H) and gata1 (K–M) expression in wild-type (A, F, K), hans6 mutant (B, G, L) and hand2-overexpressing (C, H, M) embryos; dorsal views, anterior to the left, at the 12 somite stage. (A, F) etv2 and tal1 are expressed in relatively medial and lateral (arrows) territories on each side of the wild-type embryo. In hans6 embryos (B, G), only the medial territory is present. In hand2-overexpressing embryos (C, H), expression of both etv2 and tal1 is increased, but it is not possible to distinguish whether this represents an increase in the medial or the lateral vessel progenitor populations, since no markers exist that distinguish these two groups of progenitors. (K–M) gata1 expression is equivalent in wild-type (K) and hans6 (L) embryos, but it is decreased in hand2-overexpressing embryos (M). Scale bar represents 100 μm. (D, E, I, J) Fluorescent in situ hybridization depicts the relationship of etv2 and pax2a expression in wild-type (D, D') and hand2 morphant (hand2 MO) embryos (E, E'), and the relationship of tal1 and hand2 expression in wild-type (I, I') and hand2 MO (J, J') embryos; dorsal views, anterior to the left, at the 12 somite stage. Medial and lateral (arrows) territories of etv2 expression flank pax2a in wild-type embryos (D, D'). The lateral territory of expression is absent in hand2 morphants (E, E'). The lateral territory (arrows) of tal1 expression is located at the medial border of hand2 expression in wild-type embryos (I, I'), but is absent in hand2 morphants (J, J'). Note that we observed variable thickness of tal1 expression in its medial territory of expression.
To gain insight into whether hand2 directly promotes the formation of vessel progenitors, we assessed the consequences of hand2 overexpression. Overexpression of hand2 resulted in an expansion of both etv2 and tal1 expression in the posterior mesoderm (Figure 5C,H). In contrast, hand2 overexpression resulted in a reduction of gata1 expression (Figure 5M). Thus, in the posterior mesoderm, hand2 overexpression can inhibit the development of some tissues, such as IM and blood, while promoting vessel progenitor formation.
To understand the consequences of the influence of hand2 function on the lateral venous progenitors, we examined the vasculature in hans6 mutants. As noted above, a prior lineage tracing study suggested that the lateral venous progenitors contribute to the posterior cardinal vein (Kohli et al., 2013). Furthermore, this study found that inhibition of etv2 function at the time when these lateral cells arise results in loss of expression of mannose receptor c1a (mrc1a), a marker of the cardinal vein (Kohli et al., 2013). Similarly, hans6 mutants lack mrc1a and flt4 expression in the posterior cardinal vein, suggesting a defect in venous development (Figure 6A,B,D,E). Using Tg(flk1:ras-mcherry) to label the entire vasculature, we identified the presence of the posterior cardinal vein in hans6 mutants (Figure 6J–L), but found that their caudal venous plexus failed to be properly remodeled (Figure 6M–O). In contrast to these changes in the venous system, flt4 and ephrin-b2a (efnb2a) expression in the dorsal aorta, as well as mrc1a expression in the posterior blood island, appeared grossly unaffected by hand2 loss-of-function (Figure 6B,E,H). Meanwhile, consistent with the ability of hand2 to promote vessel progenitor formation, hand2 overexpression increased vascular expression of mrc1a, flt4, and efnb2a (Figure 6C,F,I).
Figure 6

hand2 promotes proper vein formation.
(A–I) In situ hybridization depicts expression of mrc1a (A–C), flt4 (D–F) and efnb2a (G–I) in wild-type (A, D, G), hans6 mutant (B, E, H) and hand2-overexpressing (C, F, I) embryos; lateral views, anterior to the left, at 24 hpf (A–C, G–I) and the 20 somite stage (D–F). (A–C) mrc1a expression in the posterior cardinal vein (blue arrow) was present in wild-type (A), absent in hans6 mutant (B), and increased in hand2-overexpressing (C) embryos. Expression in the posterior blood island (red arrowhead) was grossly unaffected. (D–F) flt4 expression in the posterior cardinal vein (blue arrow) was present in wild-type (D), absent in hans6 mutant (E), and increased in hand2-overexpressing (F) embryos. Expression in the dorsal aorta (red arrow) was grossly unaffected. (G–I) efnb2a expression in the dorsal aorta (red arrow) was present in wild-type (G), grossly unaffected in hans6 mutant (H), and slightly increased in hand2-overexpressing (I) embryos. (J–O) Lateral views of three-dimensional reconstructions of Tg(flk1:ras-mcherry) expression in the vasculature of wild-type (J, M) and hans6 mutant (K, N) embryos at 28 hpf (J, K) and 32 hpf (M, N). Pictured region in (J, K) is the area of the trunk boxed in the schematic (L); pictured region in (M, N) is the area of the tail boxed in the schematic (O). Both posterior cardinal vein (blue arrow) and dorsal aorta (red arrow) were present in wild-type (J) and hans6 mutant (K) embryos. In contrast to wild-type (M), the caudal venous plexus (arrowhead) fails to undergo proper remodeling in hans6 mutants (N). Scale bars represent 100 μm.
Overall, these studies demonstrate a previously unappreciated role for hand2 in regulating trunk vasculature development. More specifically, our data indicate that hand2 is required for the successful execution of certain aspects of venous differentiation, including the expression of characteristic venous markers and the remodeling of the caudal venous plexus. Combined with prior lineage tracing studies and etv2 loss-of-function analysis (Kohli et al., 2013), our findings suggest that hand2 implements these functions by promoting the development of the lateral venous progenitors. We cannot, however, rule out the possibility that the roles of hand2 in venous progenitor formation and venous differentiation are independent of one another, such that the differentiation defects represent a later influence of hand2 on vascular development.
hand2 loss-of-function results in increased expression of intermediate mesoderm markers in cells that normally express hand2
The lateral localization of hand2 expression and the absence of lateral venous progenitor markers when hand2 function is lost highlighted the possibility that hand2 impacts the IM at its lateral border. We therefore wanted to determine how the expanded IM in hans6 mutants relates to the interface between the IM and the hand2-expressing cells. Do the extra IM cells seem to emerge at this interface? Do they appear to arise from cells that express hand2, or, alternatively, at the expense of hand2-expressing cells?
To differentiate among these possibilities, we used two methods to identify the hand2-expressing territory in hand2 loss-of-function embryos. We labeled hand2-expressing cells through in situ hybridization in embryos injected with a hand2 morpholino (Figure 7A,B), and we took advantage of the non-rescuing BAC transgene Tg(hand2:EGFP) (Kikuchi et al., 2011) to interrogate hans6 mutants (Figure 7C,D). Of note, each of these approaches indicated heightened intensity of hand2 expression in hand2 loss-of-function embryos (Figure 7A,B and Figure 7—figure supplement 1), suggesting the possibility that hand2 acts to inhibit its own expression. Importantly, however, we observed comparable dimensions of the hand2 expression territory in wild-type and morphant embryos (Figure 7A,B). More specifically, when using Tg(hand2:EGFP), we found no significant difference between the numbers of GFP+ cells in the posterior mesoderm of wild-type and hans6 mutant embryos (Figure 7C–E). Thus, it seems that the expansion of the IM in hans6 mutants does not come at the expense of the formation of cells that normally express hand2.
Figure 7 with 1 supplement see all
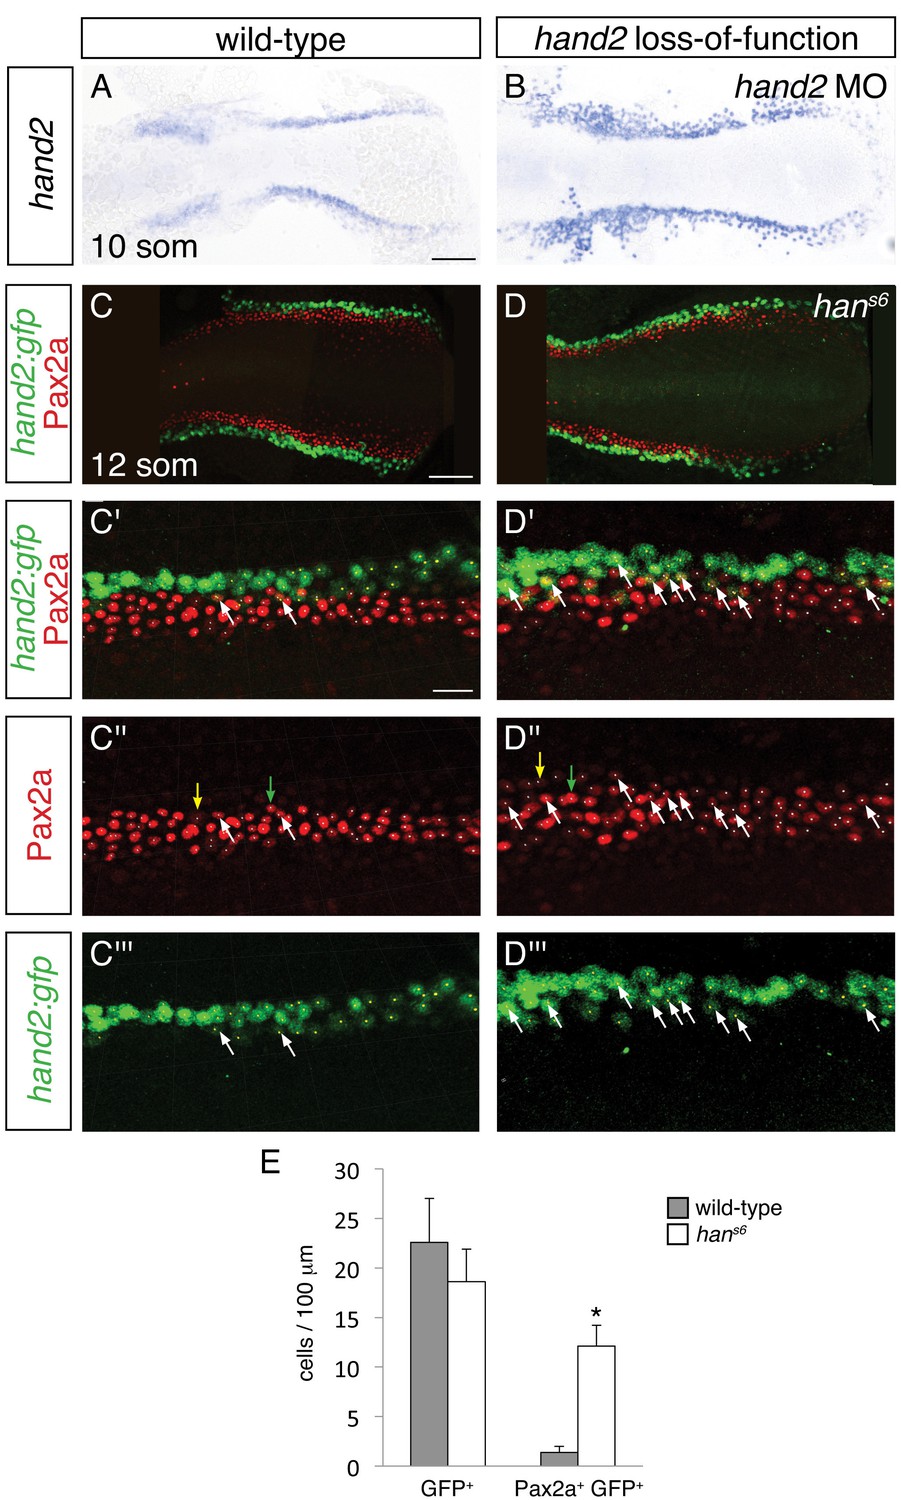
Increased presence of Pax2a in hand2-expressing cells of hand2 mutants.
(A–B) In situ hybridization depicts presence of hand2 expression in hand2 morphants (B); dorsal views, anterior to the left, at the 10 somite stage. There is no evident loss of hand2-expressing cells in hand2 morphants; moreover, hand2 expression levels appear higher in the context of hand2 loss-of-function. Scale bar represents 100 μm. (C–D) Immunofluorescence for Pax2a and GFP in wild-type (C) and hans6 mutant (D) embryos, both carrying Tg(hand2:EGFP); dorsal views, anterior to the left, of three-dimensional reconstructions at the 12 somite stage, as in Figure 4G. (C'–D''') Magnification of 250 µm long regions from (C) and (D) used for quantification of the numbers of GFP+ and Pax2a+ cells in wild-type and hans6 mutant embryos. Yellow dots indicate GFP+ cells, white dots indicate Pax2a+ nuclei, and examples of GFP+ Pax2a+ cells are indicated by white arrows. Intensity of Pax2a+ staining varied from strong (for example, green arrows) to weak (for example, yellow arrows). Scale bars represent 100 μm (C, D) and 25 μm (C'–D'''). (E) Bar graph indicates the average numbers of GFP+ cells and GFP+ Pax2a+ cells per 100 µm of IM in wild-type and hans6 mutant embryos; error bars indicate standard deviation. Asterisk indicates a statistically significant difference compared to wild-type (p<0.0001, Student’s t test; n = 13 for wild-type and n = 10 for hans6).
-
Figure 7—source data 1
GFP+ and Pax2a+ GFP+ cells in wild-type and hans6 intermediate mesoderm.
The numbers of GFP+ and Pax2a+ GFP+ cells were quantified on the indicated dates of analysis. Representative 250 μm long regions of IM were analyzed, and values were normalized to represent the number of cells per 100 μm. Average numbers and standard deviation are represented in Figure 7E.
- https://doi.org/10.7554/eLife.19941.017
We next assessed whether the increased number of IM cells in hans6 mutants could arise at least in part from aberrant IM marker expression in cells that normally express hand2. Careful examination of wild-type embryos carrying the Tg(hand2:EGFP) transgene revealed that ~6% of the GFP+ cells in their posterior mesoderm also displayed the IM marker Pax2a (Figure 7C,E). In dramatic contrast, ~60% of the GFP+ cells in the hans6 mutant posterior mesoderm were also Pax2a+ (Figure 7D,E). Intriguingly, the GFP+ Pax2a+ cells were typically observed at or near the border where the hand2-expressing cells meet the IM (Figure 7C,D). These data suggest that hand2 limits IM dimensions by constraining the lateral boundary of the IM through repression of IM gene expression within hand2-expressing cells.
Functionally antagonistic roles for hand2 and osr1 in pronephron development
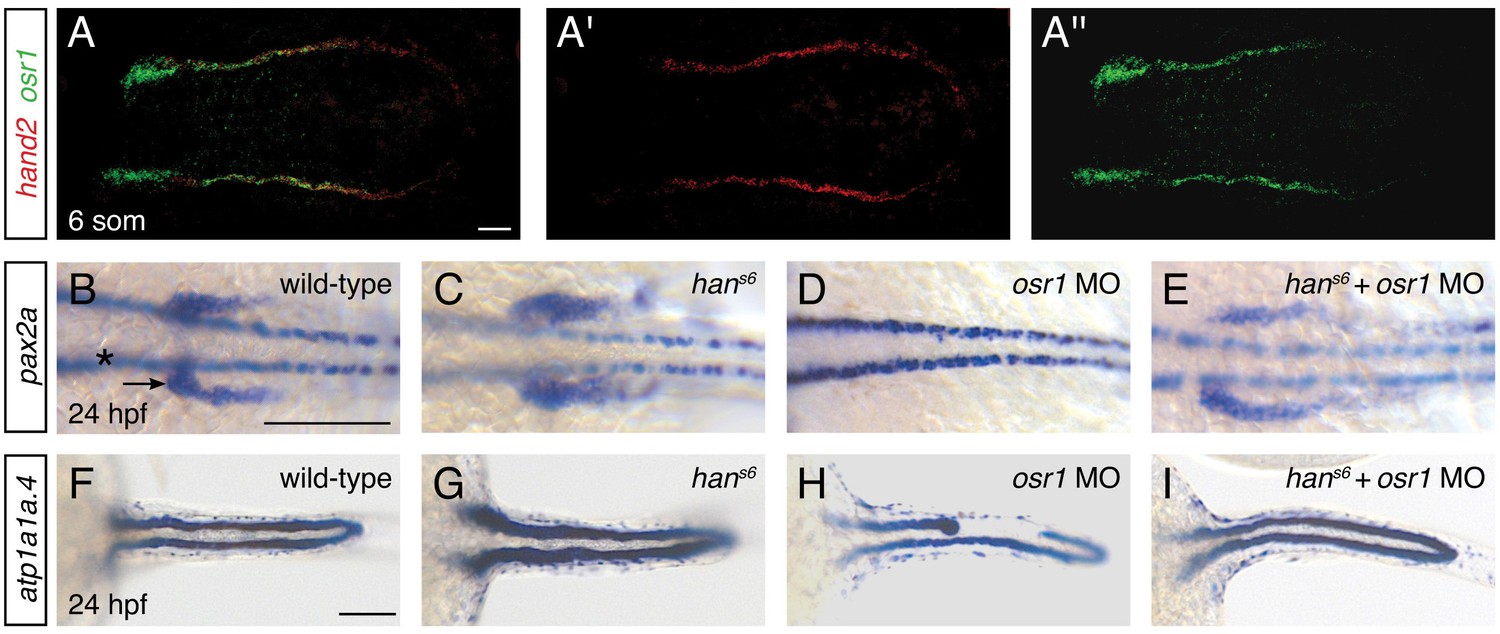
The expansion of Pax2a expression in the hand2-expressing territory in hans6 mutants suggests that factors that promote IM development are present within hand2-expressing cells. We hypothesized that osr1 could be one of these factors, because of the correspondence between the hand2 and osr1 expression patterns and loss-of-function phenotypes. First, osr1 was previously reported to be expressed in the lateral posterior mesoderm, adjacent to the IM (Mudumana et al., 2008). Through direct comparison of hand2 and osr1 expression patterns, we found that the genes are co-expressed in the lateral posterior mesoderm (Figure 8A). Additionally, prior studies demonstrated that loss of osr1 function results in phenotypes opposite to those caused by loss of hand2: in contrast to the expanded pronephron and defective venous vasculature in hans6 mutants, osr1 morphants were found to exhibit inhibited pronephron development together with expansion of venous structures (Mudumana et al., 2008; Tena et al., 2007).
Figure 8 with 1 supplement see all
hand2 and osr1 act in opposing, parallel pathways to regulate pronephron development.
(A–A'') Fluorescent in situ hybridization depicts overlap (A) of hand2 (A') and osr1 (A'') expression in wild-type embryos; dorsal views, anterior to the left, of three-dimensional reconstructions at the 6 somite stage. (B–I) In situ hybridization depicts pax2a (B–E) and atp1a1a.4 (F–I) expression at 24 hpf in wild-type embryos (B, F), hans6 mutant embryos (C, G), osr1 morphant (osr1 MO) embryos (D, H) and hans6 mutant embryos injected with osr1 morpholino (hans6 + osr1 MO) (E, I); dorsal views, anterior to the left. (B–E) Compared to wild-type (B), pax2a expression in the glomerular and neck precursors (arrow) was expanded in 100% of hans6 mutants (C, n=11), absent (48%) or reduced (48%) in osr1 morphants (D, n=25), and relatively normal in hans6 + osr1 MO embryos (E, n=11). While the extent of marker expression was generally comparable to wild-type in the double loss-of-function embryos, the stereotypic patterning of this population was often somewhat disrupted. Expression in overlying spinal neurons (asterisk) was unaffected. (F–I) Compared to wild-type (F), atp1a1a.4 expression in the pronephric tubules was wide in 85% of hans6 mutants (G, n=13), while many osr1 morphants (H, n=133) had tubules with shortened anterior expression (18%) or tubules with segmental losses (35%), and 47% of osr1 morphants had a wild-type appearance. 85% of hans6 + osr1 MO embryos (I, n=46) resembled wild-type, whereas 11% had a shortened anterior tubule and 4% had segmental losses in the tubules. Scale bars represent 100 μm.
To assess the functional relationship between hand2 and osr1, we investigated double loss-of-function embryos. Dramatically, removal of hand2 function in the setting of osr1 loss-of-function largely restored normal pronephron development. This interaction was most notable in the glomerular precursor population (Figure 8B–E). While this population was expanded in hand2 mutants, it was absent in embryos injected with an osr1 morpholino (Figure 8B–D). In hand2 mutants injected with the osr1 morpholino, however, the precursor population appeared comparable to wild-type (Figure 8E). Consistent with prior studies (Mudumana et al., 2008), osr1 morpholino injection had a less dramatic effect on the pronephron tubule than on the glomerulus (Figure 8D,H). Nevertheless, a comparable interaction between hand2 and osr1 was found in tubule formation (Figure 8F–I). While hans6 mutants had wide tubules and many osr1 morphants had disrupted tubules, hans6 mutantsinjected with osr1 morpholino displayed relatively normal tubules.
We wondered whether the observed genetic interaction between hand2 and osr1 might reflect roles for these genes in regulating one another's expression. We found, however, that loss of hand2 function did not seem to affect the intensity or dimensions of osr1 expression (Figure 8—figure supplement 1A,B). Similarly, osr1 loss-of-function did not appear to alter hand2 expression (Figure 8—figure supplement 1C,D). Therefore, hand2 and osr1 appear to affect downstream gene expression independently, without affecting one another’s expression. Furthermore, our data suggest that hand2 and osr1 function in parallel genetic pathways that act in opposition in order to regulate the precise dimensions of the pronephron. More generally, our findings implicate hand2 within a genetic network that regulates progenitor cell fates at the lateral edge of the IM, at the interface with the hand2- and osr1-expressing territory.
Discussion
Together, our data present a new perspective on how the posterior mesoderm is divided into defined territories that create distinct tissues. Importantly, our work provides the first evidence that hand2 restricts the size of the kidney and promotes vein development. Specifically, our data indicate that hand2 limits the specification of pronephric progenitors by restraining the lateral boundary of the IM. Furthermore, at the end of the hand2-sensitive phase of IM formation, hand2 supports the formation of venous progenitors just beyond the lateral edge of the IM, in the same region where it represses IM development. Finally, our data reveal a novel genetic interaction in which the inhibitory function of hand2 is balanced by the inductive role of osr1 during the establishment of IM dimensions.
Our findings highlight the importance of regulating the refinement of the lateral boundary of the IM. It is intriguing to consider how hand2, given its expression in the lateral posterior mesoderm, could influence the restriction of the adjacent IM. Perhaps hand2 acts cell-autonomously to inhibit IM specification; the ectopic appearance of Pax2a+ cells within the hand2-expressing territory in hand2 mutants makes this an attractive model. Alternatively, hand2 could have a non-autonomous influence on IM dimensions, perhaps by regulating the production of a lateralizing signal, the absence of which would result in the lateral expansion of IM gene expression. In this scenario, it is tempting to speculate that the role of hand2 could interface with the BMP signaling pathway, considering its prior implication in posterior mesoderm patterning (James and Schultheiss, 2005). Wherever its precise location of action may be, this function of hand2 -- preventing lateral hand2+osr1+ cells from acquiring more medial characteristics, such as expression of pax2a or lhx1a --suggests a possible mechanism for distinguishing IM gene expression from that of neighboring lateral territories, a distinct process required during both in vivo (James et al., 2006) and in vitro (Takasato et al., 2014) IM development.
Additionally, our data imply a close connection between the specification of the IM and the formation of the lateral venous progenitor population. Are the roles of hand2 during IM and venous development coupled to each other, or do these represent two independent functions of hand2? We can envision a model in which the lateral venous progenitor cells emerge from a hand2-expressing lineage, and hand2 influences a cell fate decision between IM and venous identities. In particular, we suggest that hand2 normally inhibits IM specification within a portion of the hand2-expressing territory, while also promoting the differentiation of these same hand2-expressing cells into lateral venous progenitors. On the other hand, it remains feasible that hand2 could have completely separable effects on the kidney and vein lineages. Currently, the lineage relationships between the IM, the lateral venous progenitors, and the hand2-expressing lateral mesoderm remain undetermined; future work on the generation of appropriate tissue-specific lineage tracing tools will facilitate progress toward the resolution of these open questions.
In future studies, it will also be valuable to elucidate the effector genes that act downstream of Hand2 in the posterior mesoderm. It is plausible that Hand2 could act directly to repress transcription of IM genes, especially considering that ChIP-seq analysis in the mouse limb bud has revealed Hand2-binding peaks associated with Pax2 and Lhx1a (Osterwalder et al., 2014). Alternatively, Hand2 could repress IM genes without necessarily engaging Hand2-binding sites in their regulatory regions, since Hand2 can influence transcription through DNA-binding-independent mechanisms (Funato et al., 2009; Liu et al., 2009). Of course, Hand2 could also regulate IM gene expression indirectly. It will be particularly interesting to determine whether the Hand2 targets that influence the IM are also relevant to venous progenitor formation. Along those lines, it is noteworthy that our findings have demonstrated a difference between the functions of hand2 during vessel progenitor development in the anterior and posterior mesoderm: while we have previously shown that hand2 overexpression inhibits the expression of vessel progenitor markers in the anterior mesoderm (Schindler et al., 2014), here we observed expanded expression of the same markers in the posterior mesoderm of hand2-overexpressing embryos. These distinct responses to hand2 activity in the anterior and posterior mesoderm may reflect regional differences in in the utilization of different bHLH binding partners or in the implementation of the different molecular functions ascribed to Hand2 (Firulli et al., 2005; Funato et al., 2009; Liu et al., 2009; McFadden et al., 2002; Schindler et al., 2014). Future studies will need to distinguish among these possibilities in order to define how Hand2 functions in different embryonic contexts.
By demonstrating that hand2 functions in opposition to osr1, our data provide the first key step toward incorporating hand2 into the genetic regulatory network that patterns the posterior mesoderm. It is important to note that prior studies have suggested a non-autonomous role for osr1 during IM development (Mudumana et al., 2008). The endoderm is expanded in osr1 morphants, and mutations that disrupt endoderm development abrogate the pronephron defects caused by osr1 loss-of-function (Mudumana et al., 2008; Terashima et al., 2014). In contrast, we suspect that hand2 affects IM formation from its position in the lateral mesoderm, rather than from the endoderm. We observe ectopic Pax2a+ cells emerging within hand2-expressing mesoderm in hand2 mutants; additionally, whereas osr1 morphants have an expansion of the endoderm (Mudumana et al., 2008; Terashima et al., 2014), hans6 mutants exhibit normal amounts of endoderm (Wendl et al., 2007; Yelon et al., 2000). Regardless of whether hand2 and osr1 both function within the lateral posterior mesoderm, our data suggest that these two genes control antagonistic and parallel genetic pathways that balance each other's influence in order to regulate the size of the IM.
It will be interesting to determine whether the relationship between hand2 and osr1 function is broadly conserved. Loss-of-function and gain-of-function studies in mouse, chick, and Xenopus have demonstrated a role for Osr1 in IM and kidney development through focused analyses of histology and gene expression patterns (James et al., 2006; Mugford et al., 2008; Tena et al., 2007; Wang et al., 2005). In contrast, while mice lacking Hand2 have been examined for developmental defects in some posterior structures, such as the limb buds and enteric nervous system (e.g. Charité et al., 2000; Lei and Howard, 2011), the influence of Hand2 on IM and kidney development has not yet been carefully interrogated. Moreover, future investigations in mouse may need to evaluate potential redundancy between the functions of Hand2 and Hand1: both of these genes are expressed in the murine lateral posterior mesoderm (Thomas et al., 1998), whereas zebrafish have only a single Hand gene.
Overall, our new insights into the genetic regulation of IM specification have the potential to impact our understanding of the origins and treatment of kidney disease. Prior studies have suggested a genetic component to the origins of congenital anomalies of the kidney and urinary tract (CAKUT) (Bulum et al., 2013; Vivante et al., 2014). In some cases of CAKUT, disease-causing mutations have been identified, many of which disrupt genes that influence early kidney development, including mutations in PAX2 and OSR1 (Madariaga et al., 2013; Thomas et al., 2011; Zhang et al., 2011). By implicating hand2 in the control of IM specification, we enrich the gene regulatory network that is relevant to the etiology of CAKUT. In this regard, it is interesting to note that there are case reports of chromosomal duplications containing HAND2 in patients with renal hypoplasia (Otsuka et al., 2005). Furthermore, the identification of genes that control IM specification can inspire new directions in the design of stem cell technologies and regenerative medicine strategies. Alteration of HAND2 function may allow for enhancement of current protocols for generating kidney progenitor cells in vitro (Kumar et al., 2015; Mae et al., 2013; Taguchi et al., 2014; Takasato et al., 2014; Takasato et al., 2015), potentially facilitating the requisite control that will be essential for future deployment in patient applications.
Materials and methods
Zebrafish
We generated embryos by breeding wild-type zebrafish, zebrafish heterozygous for the hand2 mutant allele hans6 (Yelon et al., 2000) (RRID: ZFIN_ZDB-GENO-071003-2), and zebrafish carrying Tg(hand2:EGFP)pd24 (Kikuchi et al., 2011) (RRID: ZFIN_ZDB-GENO-110128-35), Tg(hsp70:FLAG-hand2-2A-mCherry)sd28 (Schindler et al., 2014) (RRID: ZFIN_ZDB-GENO-141031-2), Tg(flk1:ras-mcherry)s896 (Chi et al., 2008) (RRID: ZFIN_ZDB-GENO-081212-2), or Tg(etv2:egfp)ci1 (Proulx et al., 2010) (RRID: ZFIN_ZDB-GENO-110131-58). For induction of heat shock-regulated expression, embryos were placed at 37°C for 1 hr and then returned to 28°C. Following heat shock, transgenic embryos were identified based on mCherry fluorescence; nontransgenic embryos were analyzed as controls. All heat shocks were performed at tailbud stage unless otherwise indicated.
In embryos older than 20 hpf, hans6 mutants were identified based on their cardiac phenotype (Yelon et al., 2000). In younger embryos, PCR genotyping of hans6 mutants was conducted as previously described (Yelon et al., 2000), with the exception of embryos containing Tg(hand2:EGFP)pd24, in which we used primers that amplify the first exon of hand2 (5’– CCTTCGTACAGCCCTGAATAC – 3’ and 5’ – CCTTCGTACAGCCCTGAATAC – 3’). This exon is present in the wild-type allele but is absent in both hans6homozygotes and the TgBAC(hand2:EGFP)pd24 transgene.
Injection
Request a detailed protocolSynthesis and injection of capped hand2 mRNA was performed as described previously (Schindler et al., 2014). To knock down hand2 function, we injected 3–6 ng of a previously characterized translation-blocking hand2 morpholino at the one-cell stage (Reichenbach et al., 2008). To knock down osr1 function, we used a previously characterized osr1 translation-blocking start site morpholino, osr1 ATG (Tena et al., 2007). 16–23 ng of this morpholino was injected with or without 1.6 ng of p53 morpholino (Robu et al., 2007).
In situ hybridization
Request a detailed protocolStandard and fluorescent whole-mount in situ hybridization were performed as previously described (Brend and Holley, 2009; Thomas et al., 2008), using the following probes: atp1a1a.4 (ZDB-GENE-001212-4), cdh17 (ZDB-GENE-030910-3), efnb2a (ZDB-GENE-990415-67), etv2 (etsrp; ZDB-GENE-050622-14), flt4 (ZDB-GENE-980526-326), gata1 (ZDB-GENE-980536-268), hand2 (ZDB-GENE-000511-1), lhx1a (lim1; ZDB-GENE-980526-347), mrc1a (ZDB-GENE-090915-4), osr1 (ZDB-GENE-070321-1), pax2a (ZDB-GENE-990415-8), slc12a3 (ZDB-GENE-030131-9505), and tal1 (scl; ZDB-GENE-980526-501). To prepare an osr1 probe, we amplified and subcloned the osr1 cDNA using the primers 5’ – GAGTTTCTACCCCGAGTAACCA – 3’ and 5’ – TTTTCAAAAATAAGTTTAAGGAATCCA – 3’.
Immunofluorescence and cell counting
Request a detailed protocolWhole-mount immunofluorescence was performed as previously described (Cooke et al., 2005), using polyclonal antibodies against Pax2a at 1:100 dilution (Genetex, Irvine, CA, GTX128127) (RRID: AB_2630322), GFP at 1:1000 dilution (Life Technologies, Carlsbad, CA, A10262) (RRID: AB_2534023) or phospho-Histone H3 (Ser10) at 1:500 dilution (EMD Millipore Corporation, Temecula, CA, 05-1336-S) (RRID: AB_1977261), and the secondary antibodies goat anti-chick Alexa Fluor 488 (Life Technologies, A11039) (RRID: AB_2534096), goat anti-rabbit Alexa Fluor 488 (Life Technologies, A11008) (RRID: AB_143165), goat anti-mouse Alexa Fluor 546 (Life Technologies, A11003) (RRID: AB_2534071), goat anti-rabbit Alexa Fluor 594 (Life Technologies, A11012) (RRID: AB_10562717), or goat anti-rabbit Alexa Fluor 647 (Life Technologies, A21245) (RRID: AB_2535813), all at 1:100 dilution. Samples were then placed in SlowFade Gold anti-fade reagent (Life Technologies).
To count Pax2a+ or GFP+ cells in Figures 2 and 7, we flat-mounted and imaged embryos after dissecting away the yolk and the anterior portion of the embryo. In wild-type and hans6 embryos, we examined a representative 250 µm long region in roughly the middle of the IM on one side of the embryo. This strategy allowed us to select contiguous regions that were unaffected by dissection artifacts. In hs:hand2 embryos (Figure 2), we examined a 500 µm long region in order to minimize any selection bias that could be introduced from the variability associated with the relative dearth of Pax2a+ cells. To count Pax2a+ or pH3+ cells in Figure 2—figure supplement 2, we chose to examine 400 µm long regions in undissected embryos, due to the low frequency of Pax2a+ pH3+ cells. In all cases, positive cells were determined through examination of both three-dimensional reconstructions and individual optical sections. Cell counts in Figure 2, Figure 2—figure supplement 2, and Figure 7 are presented as the average number of positive cells per 100 µm. Statistical analysis of data was performed using Microsoft Excel to conduct unpaired t-tests.
Histology
Request a detailed protocolHistological analysis was performed on tissues embedded in Spurr Low-Viscosity embedding mixture. Embryos were fixed in 2% paraformaldehyde and 2.5% glutaraldehyde in 0.1 M sodium phosphate buffer (pH 7.2), post-fixed with 2% osmium tetroxide, dehydrated in an ethanol gradient, infiltrated with a propylene oxide/resin gradient, and then embedded. Samples were oriented as desired and incubated for 24 hr at 60° C for polymerization. 2–4 μm sections were cut using glass blades, collected on standard slides, and stained with 1% toluidine blue.
Transverse sections from 24 hpf embryos were examined at three different anterior-posterior levels along the pronephron, with two sections analyzed per level in each embryo. We processed three embryos per genotype. Cell counting and area measurements were performed using Zeiss ZEN software. Data variance homogeneity and normal distribution were confirmed using IBM SPSS Statistics 22 software.
Imaging
Request a detailed protocolBright-field images were captured with a Zeiss Axiocam on a Zeiss Axiozoom microscope and processed using Zeiss AxioVision. Images of histological sections were captured using a Zeiss AxioImager A2 microscope coupled to a Zeiss Axiocam camera. Confocal images were collected by a Leica SP5 confocal laser-scanning microscope and analyzed using Imaris software (Bitplane, Switzerland).
Replicates
Request a detailed protocolAll assessments of phenotypes and expression patterns were replicated in at least two independent experiments with comparable results. Embryos were collected from independent crosses, and experimental processing (injection, heat shock, and/or staining) was carried out on independent occasions. Two exceptions to this include data presented in Figure 1Q–T and Figure 8C–E. In each of those cases, multiple embryos were processed, and the n is reported in the associated figure legends.
References
-
Zebrafish whole mount high-resolution double fluorescent in situ hybridizationJournal of Visualized Experiments e1229.https://doi.org/10.3791/1229
-
Synergism between Pax-8 and lim-1 in Embryonic Kidney DevelopmentDevelopmental Biology 214:46–59.https://doi.org/10.1006/dbio.1999.9414
-
The bHLH transcription factor dHAND controls Sonic hedgehog expression and establishment of the zone of polarizing activity during limb developmentDevelopment 127:2461–2470.
-
Foxn4 directly regulates tbx2b expression and atrioventricular canal formationGenes & Development 22:734–739.https://doi.org/10.1101/gad.1629408
-
Boundary formation and maintenance in tissue developmentNature Reviews Genetics 12:43–55.https://doi.org/10.1038/nrg2902
-
Role of dHAND in the anterior-posterior polarization of the limb bud: implications for the Sonic hedgehog pathwayDevelopment 127:2133–2142.
-
Cadherin-17 is required to maintain pronephric duct integrity during zebrafish developmentMechanisms of Development 115:15–26.https://doi.org/10.1016/S0925-4773(02)00094-1
-
Patterning of the avian intermediate mesoderm by lateral plate and axial tissuesDevelopmental Biology 253:109–124.https://doi.org/10.1006/dbio.2002.0863
-
Expression of the zebrafish paired box gene pax[zf-b] during early neurogenesisDevelopment 113:1193–1206.
-
Severe prenatal renal anomalies associated with mutations in HNF1B or PAX2 genesClinical Journal of the American Society of Nephrology 8:1179–1187.https://doi.org/10.2215/CJN.10221012
-
Misexpression of dHAND induces ectopic digits in the developing limb bud in the absence of direct DNA bindingDevelopment 129:3077–3088.
-
The surface ectoderm is essential for nephric duct formation in intermediate mesodermDevelopment 126:1103–1108.
-
Duplication of chromosome 4q: Renal pathology of two siblingsAmerican Journal of Medical Genetics Part A 134A:330–333.https://doi.org/10.1002/ajmg.a.30643
-
Cranial vasculature in zebrafish forms by angioblast cluster-derived angiogenesisDevelopmental Biology 348:34–46.https://doi.org/10.1016/j.ydbio.2010.08.036
-
Odd-skipped genes encode repressors that control kidney developmentDevelopmental Biology 301:518–531.https://doi.org/10.1016/j.ydbio.2006.08.063
-
Odd skipped related 1 is a negative feedback regulator of nodal-induced endoderm developmentDevelopmental Dynamics 243:1571–1580.https://doi.org/10.1002/dvdy.24191
-
The bHLH transcription factor hand2 plays parallel roles in zebrafish heart and pectoral fin developmentDevelopment 127:2573–2582.
Article and author information
Author details
Zayra V Garavito-Aguilar

Yocheved L Schindler
Funding
California Institute for Regenerative Medicine (TG2-01154)
- Elliot A Perens
A.P. Giannini Foundation (Postdoctoral Fellowship)
- Elliot A Perens
Universidad de los Andes (FAPA)
- Zayra V Garavito-Aguilar
Vicerrectoria de Investigaciones (P14.160422.007/01)
- Zayra V Garavito-Aguilar
Colciencias Convocatoria (617-2013-Joven Investigador Fellowship)
- Karen T Peña
National Institutes of Health (R01HL069594)
- Deborah Yelon
March of Dimes Foundation (1-FY16-257)
- Deborah Yelon
National Institutes of Health (R01HL108599)
- Deborah Yelon
The funders had no role in study design, data collection and interpretation, or the decision to submit the work for publication.
Acknowledgements
We thank members of the Yelon lab, N Chi, L Oxburgh, and D Traver for valuable discussions; I Drummond, K Poss, S Sumanas, J Torres-Vázquez, and D Traver for providing reagents; L Rincón-Camacho with assistance with histology; and H Knight for assistance with graphics.
Ethics
Animal experimentation: All zebrafish work followed protocols (S09125) approved by the University of California, San Diego IACUC.
Version history
- Received: July 22, 2016
- Accepted: November 1, 2016
- Accepted Manuscript published: November 2, 2016 (version 1)
- Version of Record published: December 1, 2016 (version 2)
- Version of Record updated: May 10, 2018 (version 3)
Copyright
© 2016, Perens et al.
This article is distributed under the terms of the Creative Commons Attribution License, which permits unrestricted use and redistribution provided that the original author and source are credited.
Metrics
-
- 1,720
- views
-
- 539
- downloads
-
- 13
- citations
Views, downloads and citations are aggregated across all versions of this paper published by eLife.
Download links
A two-part list of links to download the article, or parts of the article, in various formats.
Downloads (link to download the article as PDF)
Open citations (links to open the citations from this article in various online reference manager services)
Cite this article (links to download the citations from this article in formats compatible with various reference manager tools)
Hand2 inhibits kidney specification while promoting vein formation within the posterior mesoderm
eLife 5:e19941.
https://doi.org/10.7554/eLife.19941
Further reading
-
- Developmental Biology
We previously showed that SerpinE2 and the serine protease HtrA1 modulate fibroblast growth factor (FGF) signaling in germ layer specification and head-to-tail development of Xenopus embryos. Here, we present an extracellular proteolytic mechanism involving this serpin-protease system in the developing neural crest (NC). Knockdown of SerpinE2 by injected antisense morpholino oligonucleotides did not affect the specification of NC progenitors but instead inhibited the migration of NC cells, causing defects in dorsal fin, melanocyte, and craniofacial cartilage formation. Similarly, overexpression of the HtrA1 protease impaired NC cell migration and the formation of NC-derived structures. The phenotype of SerpinE2 knockdown was overcome by concomitant downregulation of HtrA1, indicating that SerpinE2 stimulates NC migration by inhibiting endogenous HtrA1 activity. SerpinE2 binds to HtrA1, and the HtrA1 protease triggers degradation of the cell surface proteoglycan Syndecan-4 (Sdc4). Microinjection of Sdc4 mRNA partially rescued NC migration defects induced by both HtrA1 upregulation and SerpinE2 downregulation. These epistatic experiments suggest a proteolytic pathway by a double inhibition mechanism:
SerpinE2 ┤HtrA1 protease ┤Syndecan-4 → NC cell migration.
-
- Developmental Biology
- Neuroscience
Human fetal development has been associated with brain health at later stages. It is unknown whether growth in utero, as indexed by birth weight (BW), relates consistently to lifespan brain characteristics and changes, and to what extent these influences are of a genetic or environmental nature. Here we show remarkably stable and lifelong positive associations between BW and cortical surface area and volume across and within developmental, aging and lifespan longitudinal samples (N = 5794, 4–82 y of age, w/386 monozygotic twins, followed for up to 8.3 y w/12,088 brain MRIs). In contrast, no consistent effect of BW on brain changes was observed. Partly environmental effects were indicated by analysis of twin BW discordance. In conclusion, the influence of prenatal growth on cortical topography is stable and reliable through the lifespan. This early-life factor appears to influence the brain by association of brain reserve, rather than brain maintenance. Thus, fetal influences appear omnipresent in the spacetime of the human brain throughout the human lifespan. Optimizing fetal growth may increase brain reserve for life, also in aging.


