Apical targeting of the formin Diaphanous in Drosophila tubular epithelia
- Weizmann Institute of Science, Israel
- University of California, San Francisco, United States
Figures
Figure 1 with 1 supplement
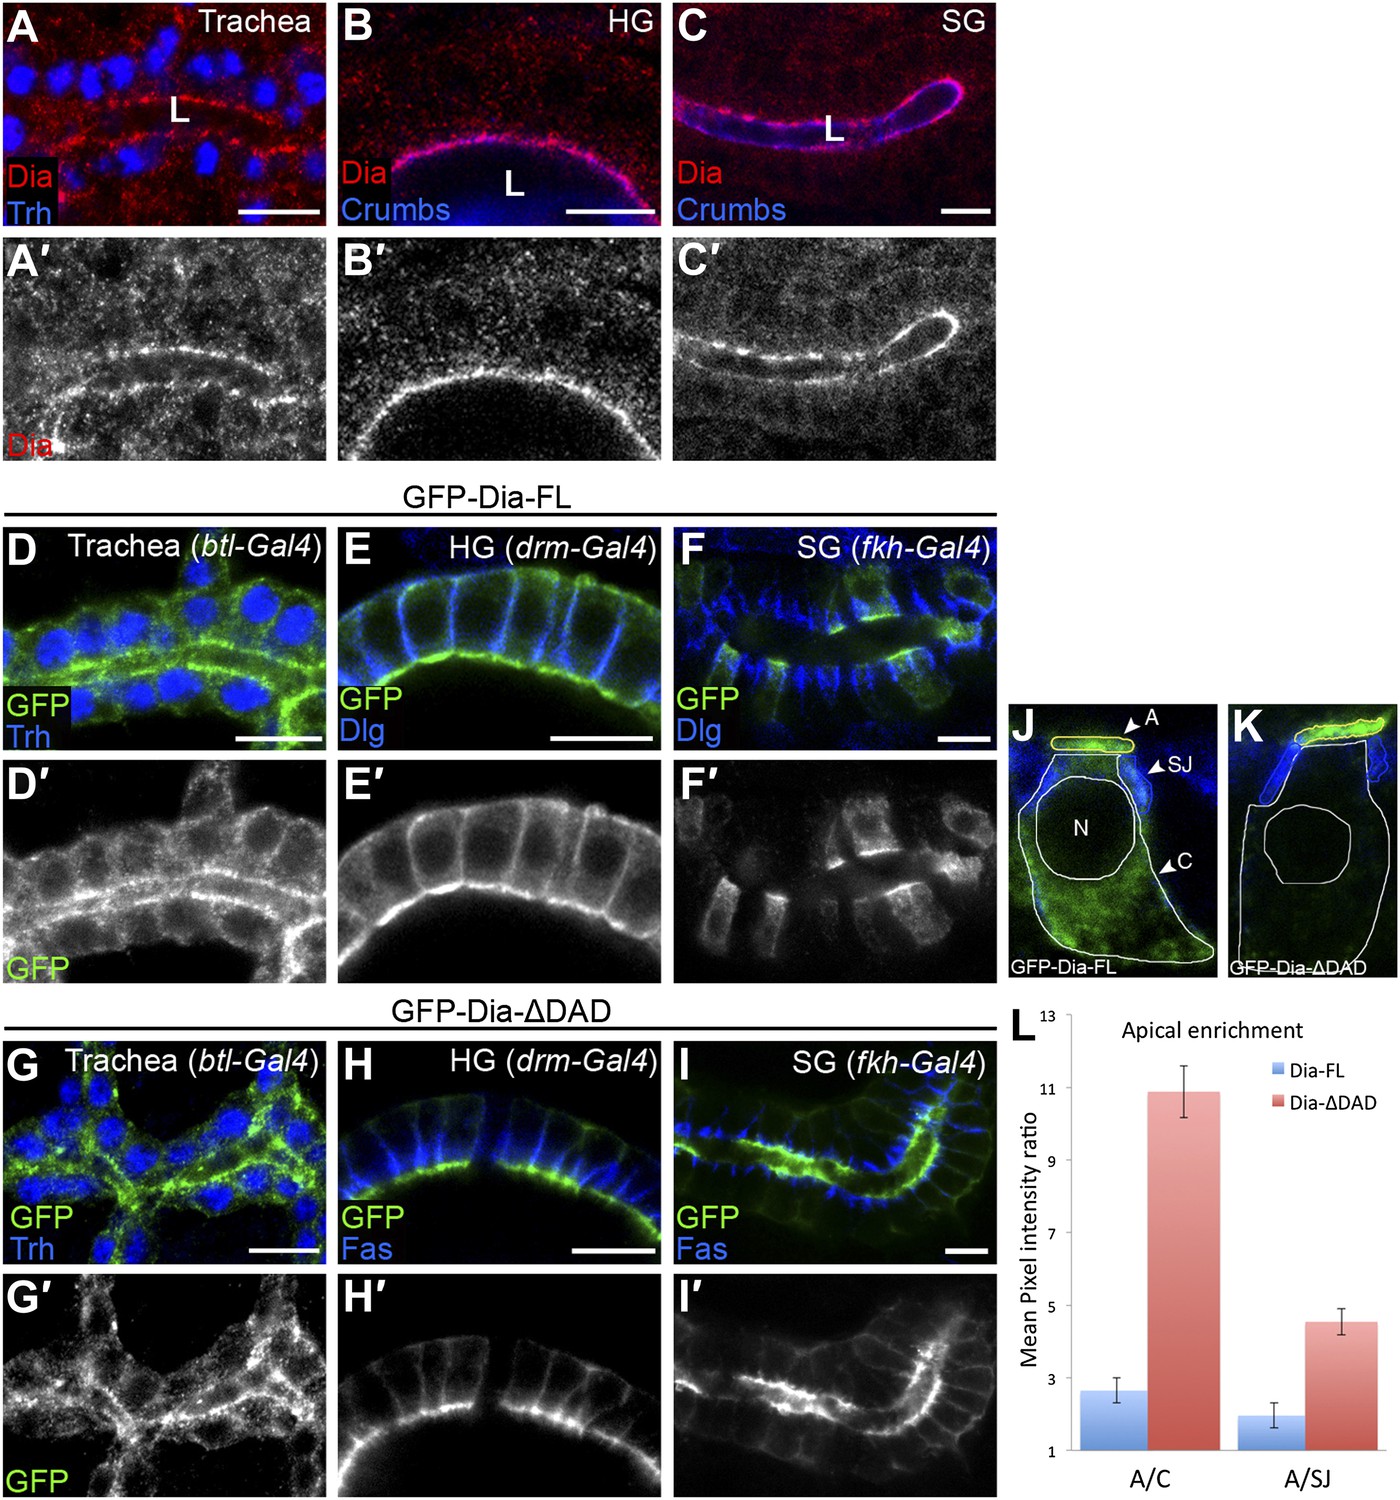
The open conformation enhances Dia apical localization.
(A–C′) Endogenous Dia staining (red, shown separately [grey] in single-primed panels) shows apical localization in the trachea (A), hindgut (HG, B) and salivary gland (SG, C) of stage 15 embryos. Trh (blue, A) marks nuclei of tracheal cells. Crumbs (blue, B and C) marks the apical surface. Apical surfaces face the lumen (L). (D–I′) The localization of GFP-tagged Dia constructs (Figure 2A, green and shown separately [grey] in single-primed panels) was monitored following expression in stage 14–15 embryonic trachea, hindgut and salivary gland under btl-Gal4 (D and G), drm-Gal4 (E and H) and fkh-Gal4 (F and I), respectively. Trh (blue, D and G) marks nuclei of tracheal cells. Dlg and FasIII (blue, E,F,H,I) mark septate junctions. GFP-Dia-ΔDAD (G–I′) is more apically localized than GFP-Dia-FL (D–F′). Scale bars, 10 μm. (J–L) Quantification of GFP fluorescence-intensity ratios. All measurements were carried out on confocal images of the different constructs expressed in the salivary gland. (J and K) Illustration of the different cellular domains measured in GFP-Dia-FL (J) and GFP-Dia-ΔDAD (K) expressing salivary gland cells. A–apical domain (outlined in yellow), SJ–septate junctions (outlined in blue), C–cytoplasm (outlined in white), N–nucleus. (L) Apical enrichment quantification represented by the mean pixel intensity ratio between the apical domain and the cytoplasm (A/C) or the septate junctions region (A/SJ). Error bars represent standard error. n = 20. See also Figure 1—figure supplement 1.
Figure 1—figure supplement 1
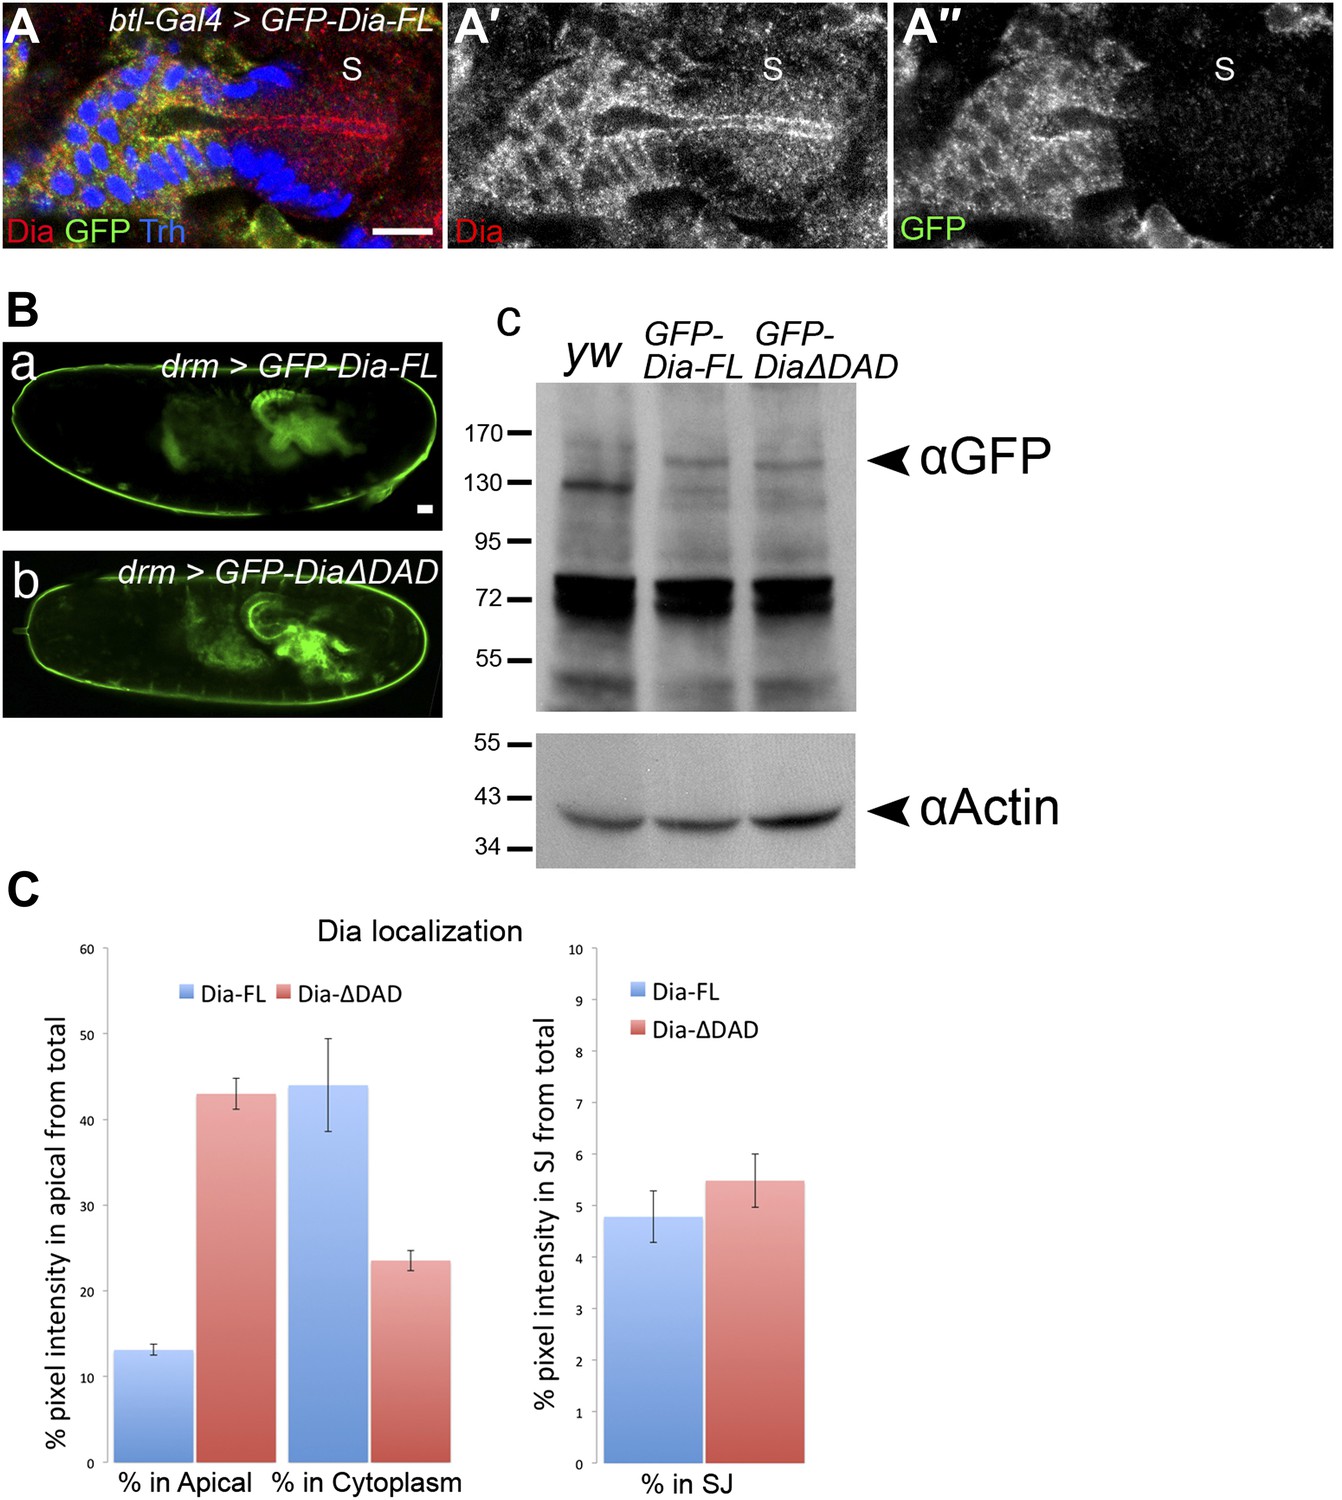
Characteristics of Dia apical enrichment.
(A–A″) Dia protein levels are similar (∼two fold higher, quantification not shown) in tracheal cells expressing the GFP-Dia-FL construct and in the adjacent posterior spiracle cells (S). GFP-Dia-FL was expressed in stage15 embryonic tracheal cells under btl-Gal4 and localization of the endogenous protein (in the S region) as well as the expressed protein (marked with GFP), was followed by staining with both anti-Dia (red, A′) and anti-GFP (green, A″) antibodies. Trh (blue) marks nuclei of tracheal cells. Scale bar, 10 µm. (B) Expression levels of GFP-Dia-FL and GFP-DiaΔDAD are similar. (a and b) Live imaging of whole embryos expressing the indicated constructs under drm-Gal4 showing the hindgut and Malpighian tubules. Scale bar, 20 μm. (c) Lysates of embryos expressing the indicated constructs were probed with an anti-GFP antibody and anti-Actin as a loading control. GFP-Dia-FL and GFP-DiaΔDAD are apparent at ≈150 kDa and ≈145 kDa, respectively (arrowhead), but are absent from lysates of yw embryos. (C) Quantification of GFP intensity in salivary gland cells expressing GFP-Dia-FL (blue bars) and GFP-Dia-ΔDAD (red bars) (Figure 1F,I and J,K). Left chart: percentage of intensity that is concentrated in the apical membrane and cytoplasmic domains from the total intensity in the cell. Right chart: percentage of intensity that is concentrated in the lateral membrane domain (represented by the septate junctions [SJ]), from the total intensity in the cell. While a significant shift in GFP fluorescence levels from the cytoplasm to the apical domain is observed between GFP-Dia-FL and GFP-Dia-ΔDAD expressing cells, GFP fluorescence levels in the lateral membrane domain remain the same. Error bars represent standard error, n = 19–20.
Figure 2 with 1 supplement
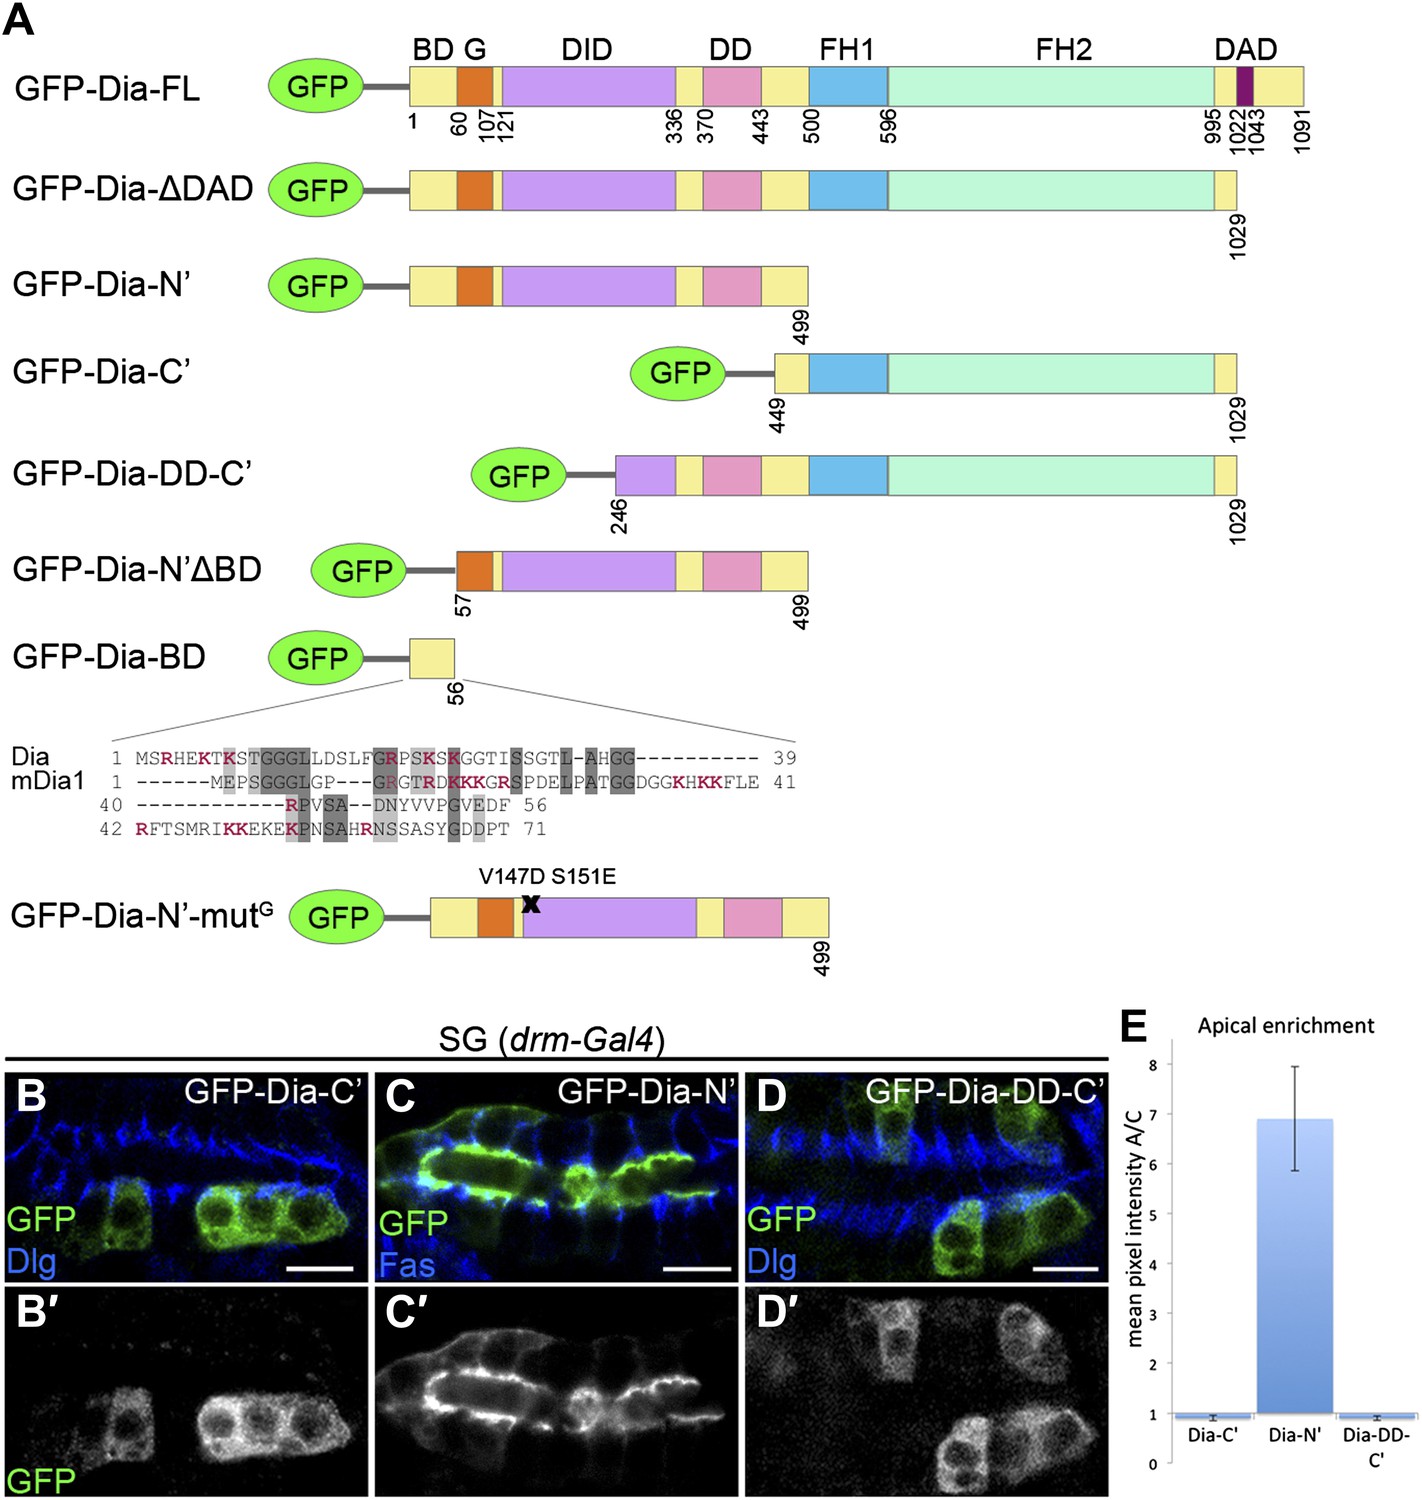
The N-terminal domain of Dia is necessary and sufficient for apical targeting.
(A) Schemes of Dia constructs tagged with GFP at the N-terminus (Homem and Peifer, 2009 and this study, see ‘Materials and methods’). Shown for GFP-Dia-BD is a global pairwise amino acid sequence alignment of the basic domain (BD) between Drosophila Dia and the mammalian homologue mDia1 (Needle, EMBOSS package, default parameters). Basic residues are marked in red. BD, Basic Domain; G, GTPase-binding domain; DID, Diaphanous Inhibitory Domain; DD, Dimerization Domain; FH1 and FH2, Formin Homology domains 1 and 2; DAD, Diaphanous Autoregulatory Domain. (B–D′) Stage 15 embryonic salivary glands expressing GFP-tagged Dia constructs (A) under drm-Gal4 (green, shown separately (grey) in single-primed panels). Dlg and FasIII (blue) mark septate junctions. (B and B′) The GFP-Dia-C’ construct displays cytoplasmic distribution. (C and C′) The GFP-Dia-N’ construct is highly restricted to the apical domain. (D and D′) The dimerization domain (DD) does not contribute to apical targeting of the Dia-C’ domain, as GFP-Dia-DD-C’ distribution is completely cytoplasmic (compare with B). Some cells appear to contain two nuclei, which may reflect an effect of this constitutively-activated Dia construct on cytokinesis. Scale bars, 10 μm. (E) Quantification of GFP fluorescence intensity in (B–D), represented by the mean pixel intensity ratio between the apical domain and the cytoplasm. Error bars represent standard error. n = 7–11. See also Figure 2—figure supplement 1.
Figure 2—figure supplement 1
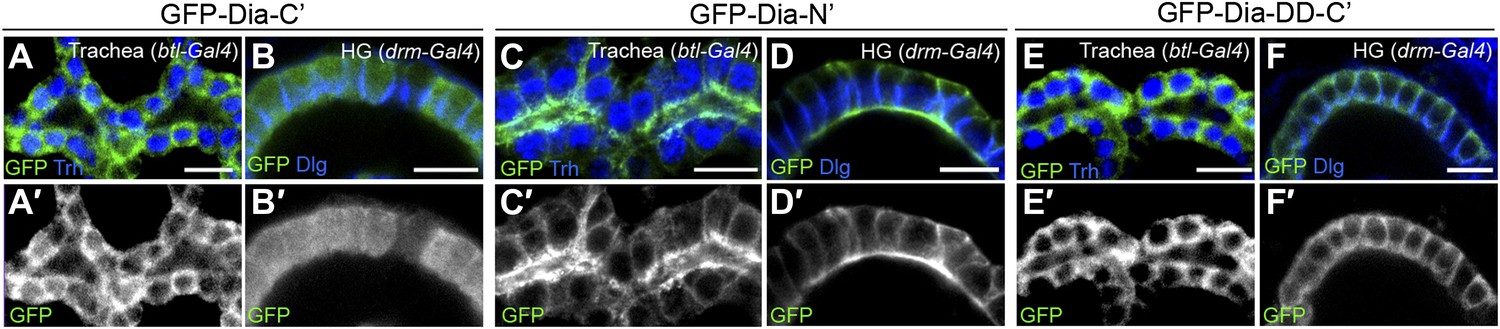
Dia constructs show similar localization patterns in all tubular organs.
(A–F′) Stage 14–15 embryonic trachea and hindgut expressing GFP tagged Dia constructs (Figure 2A) under btl-Gal4 and drm-Gal4, respectively. Localization was followed by staining for GFP (green, shown separately [grey] in single primed panels). Trh (blue) marks nuclei of tracheal cells. Dlg and FasIII (blue) mark septate junctions. (A–B′) The GFP-Dia-C’ construct displays a cytoplasmic distribution. (C–D′) The GFP-Dia-N’ construct is highly restricted to the apical domain. (E–F′) The dimerization domain (DD) does not contribute to apical targeting of the Dia-C’ domain, as GFP-Dia-DD-C’ distribution is cytoplasmic.
Figure 3
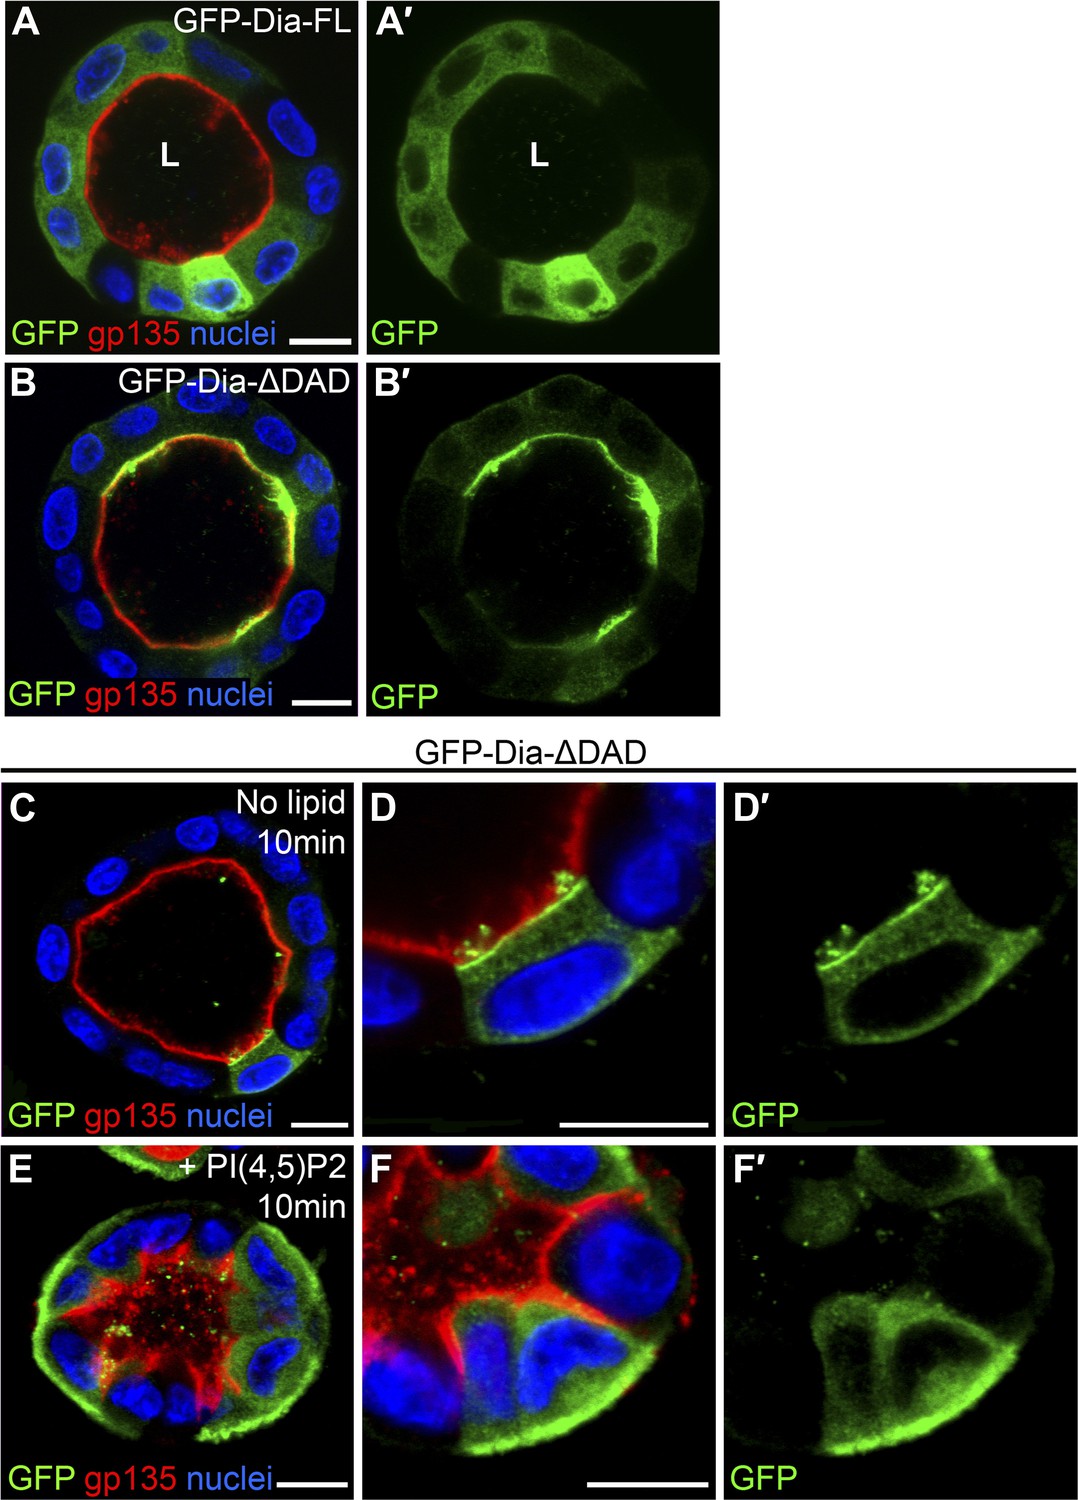
PI(4,5)P2 levels regulate Drosophila Dia localization in MDCK cysts.
(A–B′) The localization of GFP-tagged Dia constructs (green, shown separately in single-primed panels) was monitored following stable expression in MDCK cyst culture. GFP-Dia-FL (A) displays an entirely cytoplasmic distribution, while GFP-Dia-ΔDAD (B) is highly restricted apically. (C–F′) GFP-Dia-ΔDAD expressing MDCK cysts were incubated with histone (no lipid, C–D′) or PI(4,5)P2-histone complexes (+PI(4,5)P2, E–F′) for up to 10 min. Exogenous PI(4,5)P2 re-localized GFP-Dia-ΔDAD to the basal membrane (E and magnified in F) in comparison to control cysts (C and magnified in D). Apical enrichment is slightly reduced in the control cysts (compare C with B), probably due to pre-incubation with Trypsin and low-calcium levels. Nuclei are stained with Hoechst. Apical surfaces face the lumen (L). Scale bars, 10 μm.
Figure 4
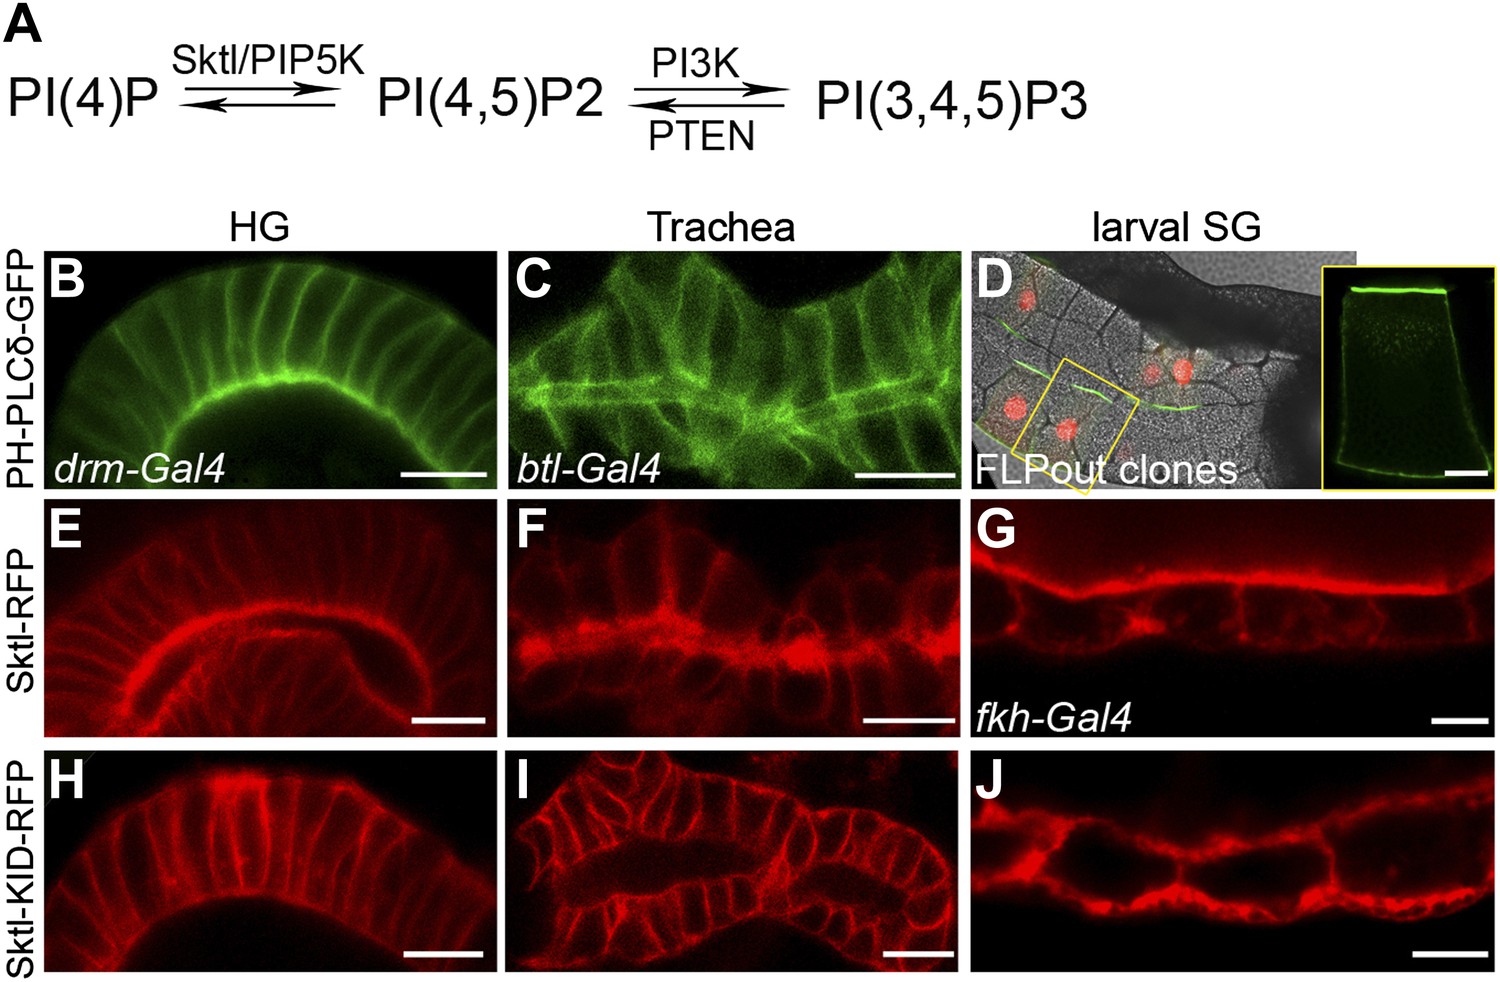
PI(4,5)P2 and Skittles, a PIP5 kinase, are apically enriched in Drosophila tubular organs.
(A) Simplified scheme of the PI(4,5)P2 biosynthetic pathway. PI(4)P is phosphorylated by Sktl /PIP5K to generate PI(4,5)P2. PI(4,5)P2 can be further phosphorylated by PI3K to produce PI(3,4,5)P3, which can be dephosphorylated by PTEN phosphatase to regenerate PI(4,5)P2. (B–D) Live imaging of PH-PLCδ-GFP following expression in stage 14 embryonic hindgut (B) and trachea (C) under drm-Gal4 and btl-Gal4, respectively, and in third instar larval salivary gland FLP-out clones (D). (D) Salivary gland FLP-out clones expressing PH-PLCδ-GFP under actin-Gal4. Clones are marked by nuclear RFP (red), and the salivary gland outline is visualized using transmitted light. Inset shows sensor distribution within a single magnified clone cell. PH-PLCδ-GFP is enriched at the apical surface of these tubular organs. (E–J) Live imaging of Sktl-RFP and Sktl-KID-RFP, following expression in the embryonic hindgut (E and H) and trachea (F and I) under drm-Gal4 and btl-Gal4, respectively, and in the 2nd instar larval salivary gland under fkh-Gal4 (G and J). Sktl is enriched at the apical domain, while a kinase-dead form (Sktl-KID) is localized throughout the cell cortex. Scale bars, 10 μm, and 20 μm (D).
Figure 5
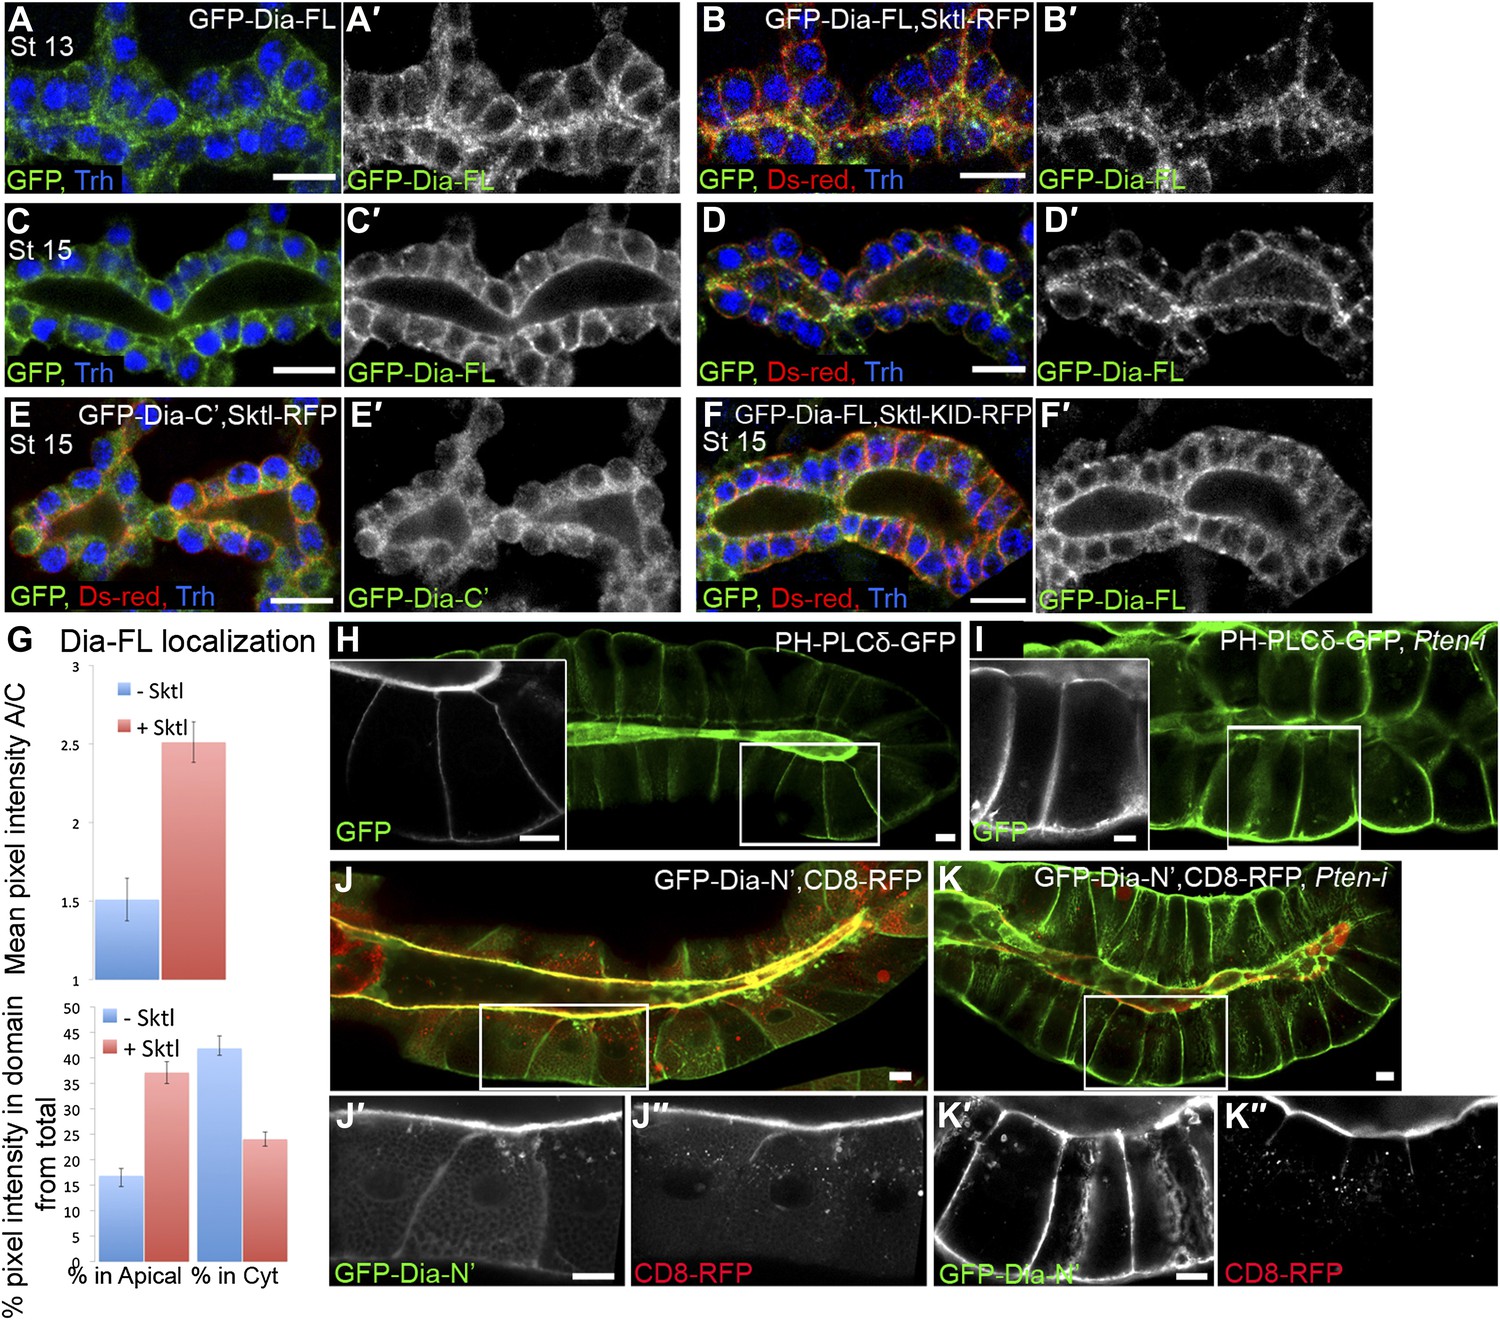
PI(4,5)P2 levels regulate Dia apical localization in Drosophila tubular epithelia.
(A–F′) Localization of the indicated constructs was monitored by staining with antibodies against GFP and Ds-Red, following expression in the embryonic trachea under btl-Gal4. Primed panels (grey) show the GFP channel alone. Trh (blue) marks tracheal cell nuclei. (A–D′) The localization of GFP-Dia-FL is shifted from the cytoplasm to the apical surface following co-expression with Sktl-RFP in stage 13 (B and B′) and stage 15 (D and D′) tracheal cells. Compare with the control embryos expressing GFP-Dia-FL alone (A,A′ and C,C′). (E,E′) When co-expressed with Sktl-RFP, the localization of GFP-Dia-C’ remained entirely cytoplasmic. (F and F′) Apical enrichment of GFP-Dia-FL is not enhanced upon co-expression with Sktl-KID-RFP. Scale bars, 10 μm. (G) Quantification of GFP fluorescence intensity in stage 15 tracheal cells. Upper chart: mean pixel intensity ratio between the apical domain and the cytoplasm. Lower chart: percentage of intensity that is concentrated in the apical and cytoplasmic domains from the total intensity in the cell. Error bars represent standard error. n = 11–20. (H–K″) Localization of the indicated constructs was examined by live imaging in third instar larval salivary glands following expression under fkh-Gal4. (H) In WT cells, the PI(4,5)P2 sensor PH-PLCδ-GFP is highly enriched in the apical membrane. (I) Upon co-expression with Pten-RNAi, PH-PLCδ-GFP is re-distributed between the cell membranes, and appears cortical. (J–K″) Co-expression of GFP-Dia-N’ (green) with CD8-RFP (red), which served as a general apical membrane marker. Separate channels (grey) are shown in primed panels. (J–J″) In WT cells, both GFP-Dia-N’ and CD8-RFP are highly restricted apically. (K–K″) In Pten-RNAi expressing cells, GFP-Dia-N’ is re-distributed between the cell membranes and appears cortical, while CD8-RFP remains restricted to the apical membrane. Scale bars, 20 μm.
Figure 6 with 1 supplement
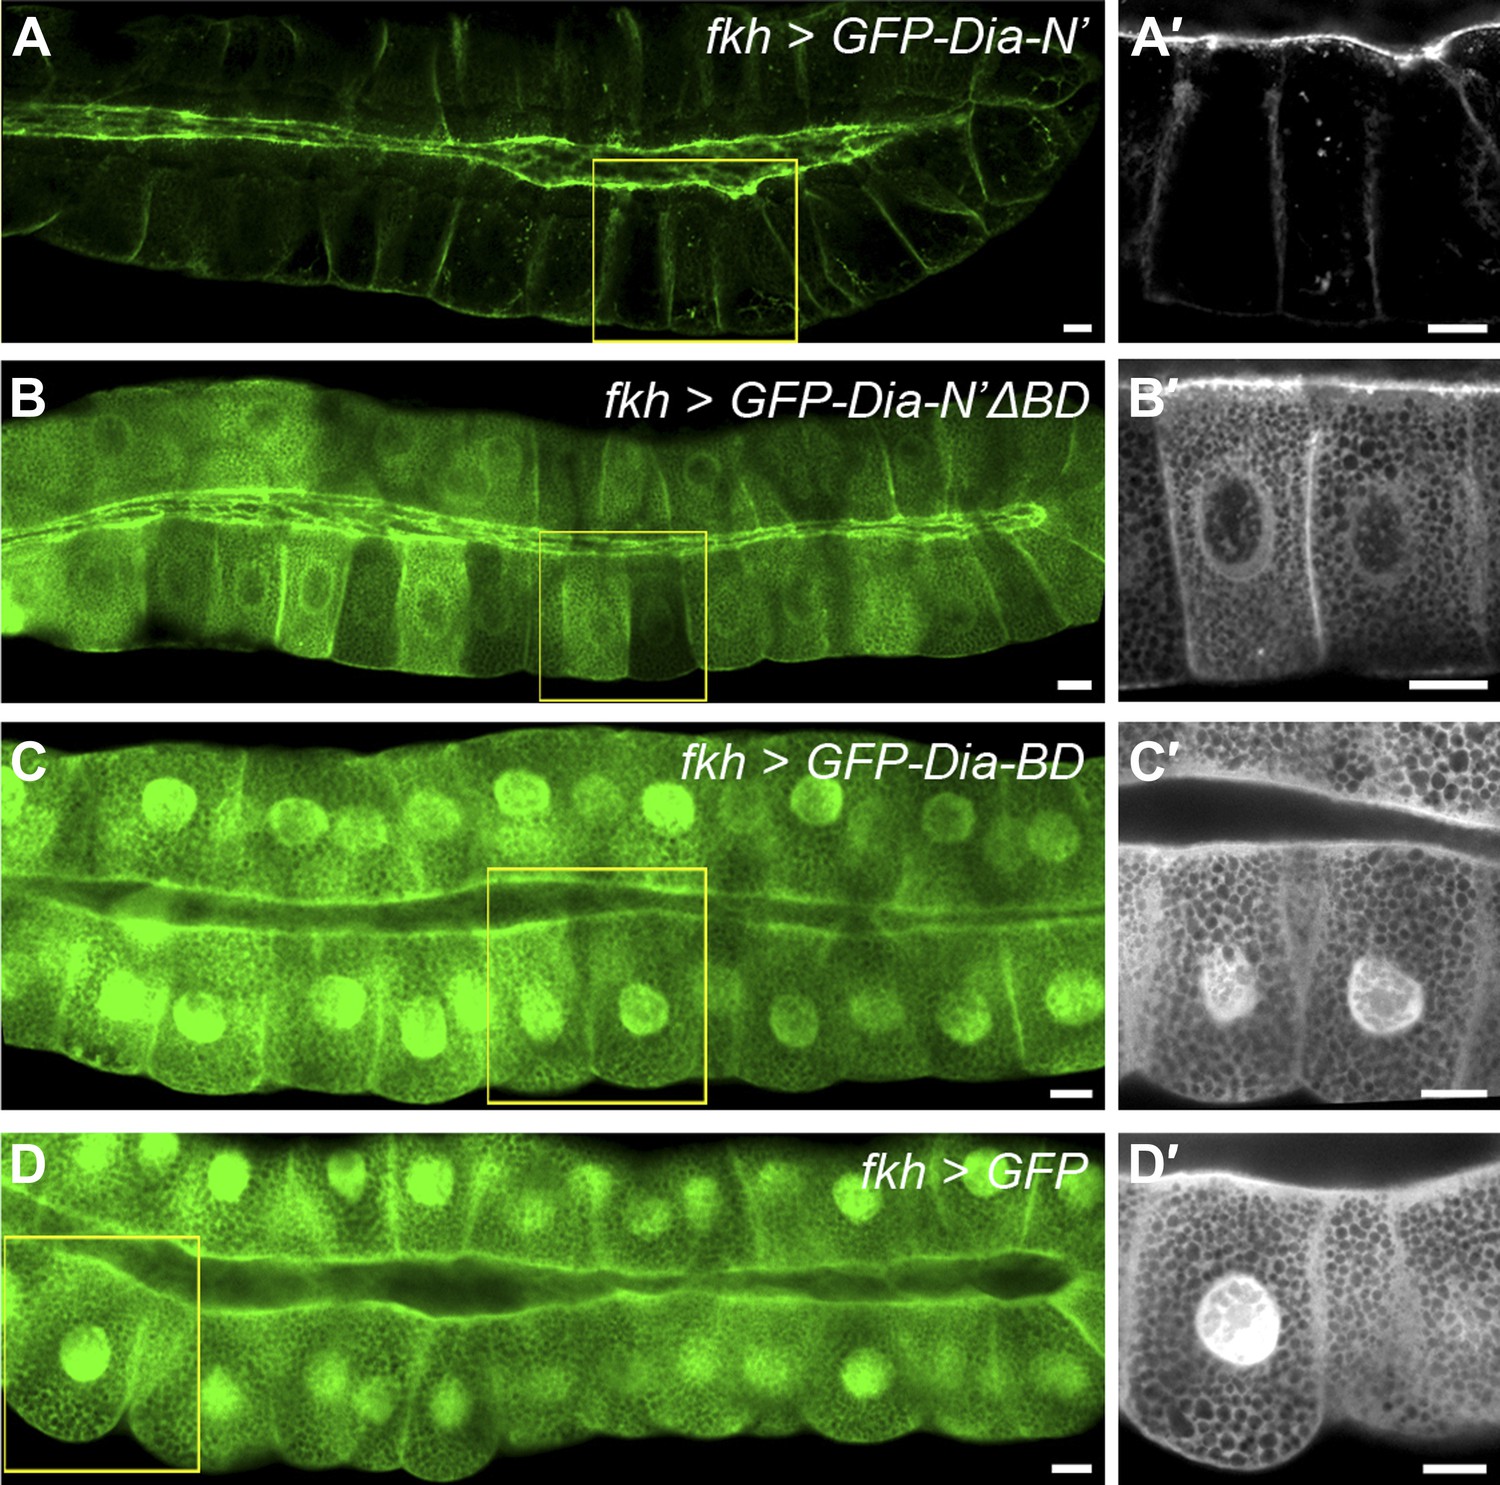
PI(4,5)P2-Dia interaction is mediated by direct binding through the BD domain.
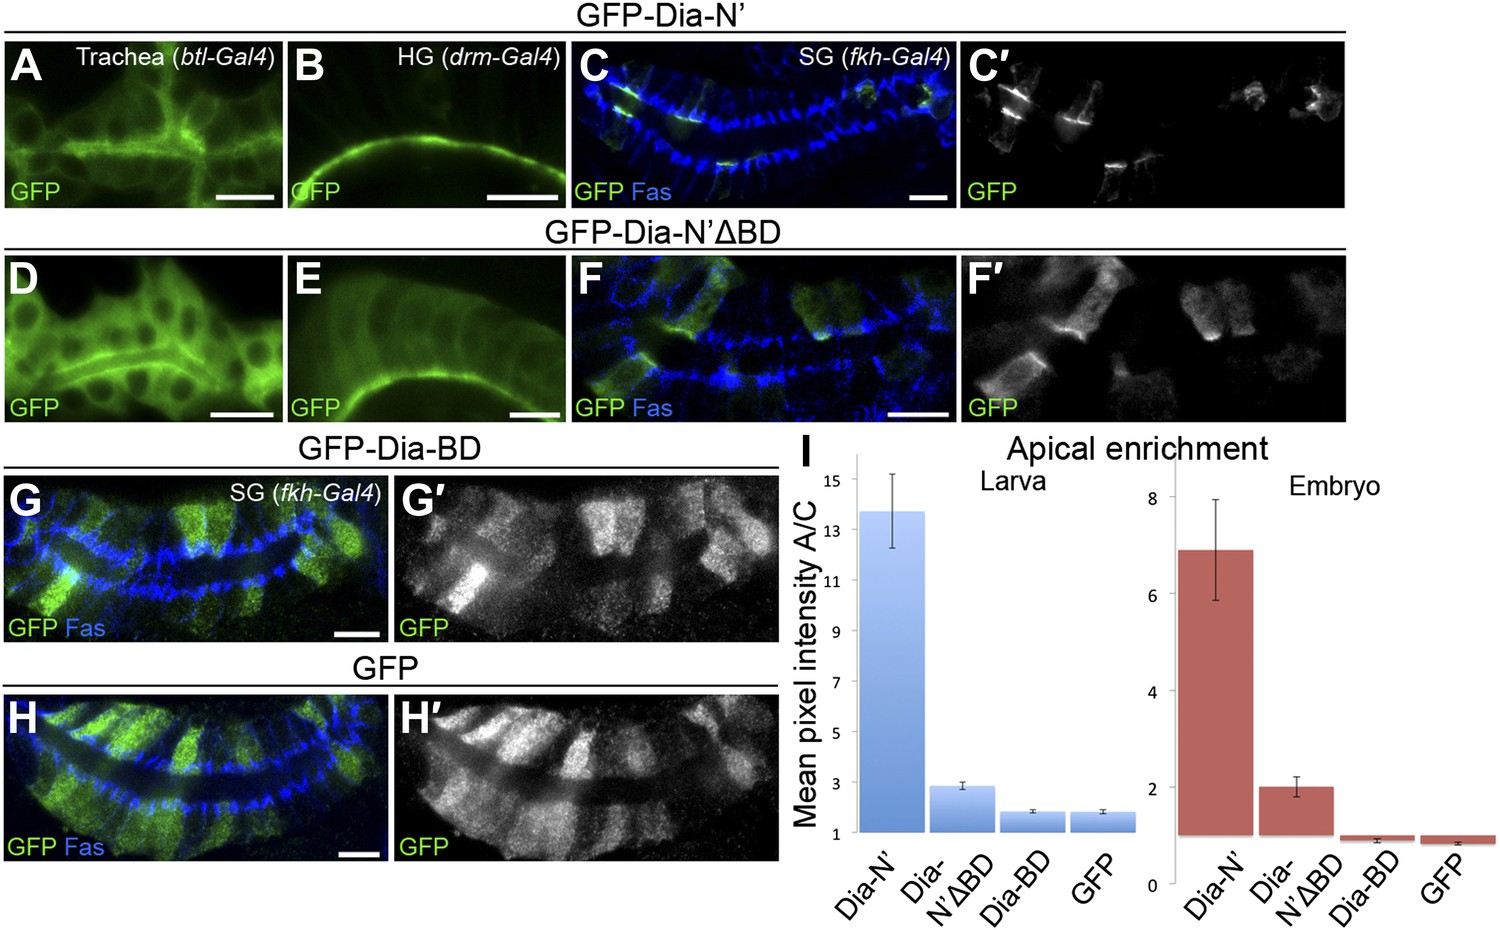
Live imaging of GFP-tagged Dia constructs (Figure 2A), expressed in third instar larval salivary glands by fkh-Gal4. Primed panels (grey) show an enlargement of the marked area. (A–B′) Apical localization of GFP-Dia-N’ΔBD (B and B′) is significantly weaker than GFP-Dia-N’ (A and A′). (C–D′) GFP-Dia-BD displays a cytoplasmic and nuclear distribution (C and C′), which is comparable to that of GFP alone (D and D′). The apparent enrichment in the apical domain, resulting from absence of granules in this area, as well as nuclear localization, is observed with both constructs. Scale bars, 20 μm. See also Figure 6—figure supplement 1.
Figure 6—figure supplement 1
Dia constructs show similar localization patterns in all tubular organs.
(A–H′) Stage 14–15 embryonic trachea, hindgut and salivary glands expressing the indicated constructs (Figure 2A) under btl-Gal4, drm-Gal4 and fkh-Gal4, respectively. Localization was followed by live imaging (A,B and D,E) or staining with anti-GFP (C,F and G–H, green and shown separately in primed panels). FasIII (blue) marks septate junctions. Apical localization of GFP-Dia-N’ΔBD (D–F′) is significantly reduced compared to GFP-Dia-N’ (A–C′) in embryonic tubular tissues. GFP-Dia-BD (G and G′) displays a completely cytoplasmic and nuclear distribution, similar to GFP alone (H and H′). Scale bars, 10 μm. (I) Quantification of GFP intensity in larval (left chart) and embryonic (right chart) salivary gland cells, expressing the indicated constructs under fkh-Gal4 (Figure 6 and this figure). Apical enrichment is represented by the mean pixel intensity ratio between the apical domain and the cytoplasm. Error bars represent standard error, n = 14–21.
Figure 7 with 3 supplements
Direct binding to Rho1 mediates Dia apical localization.
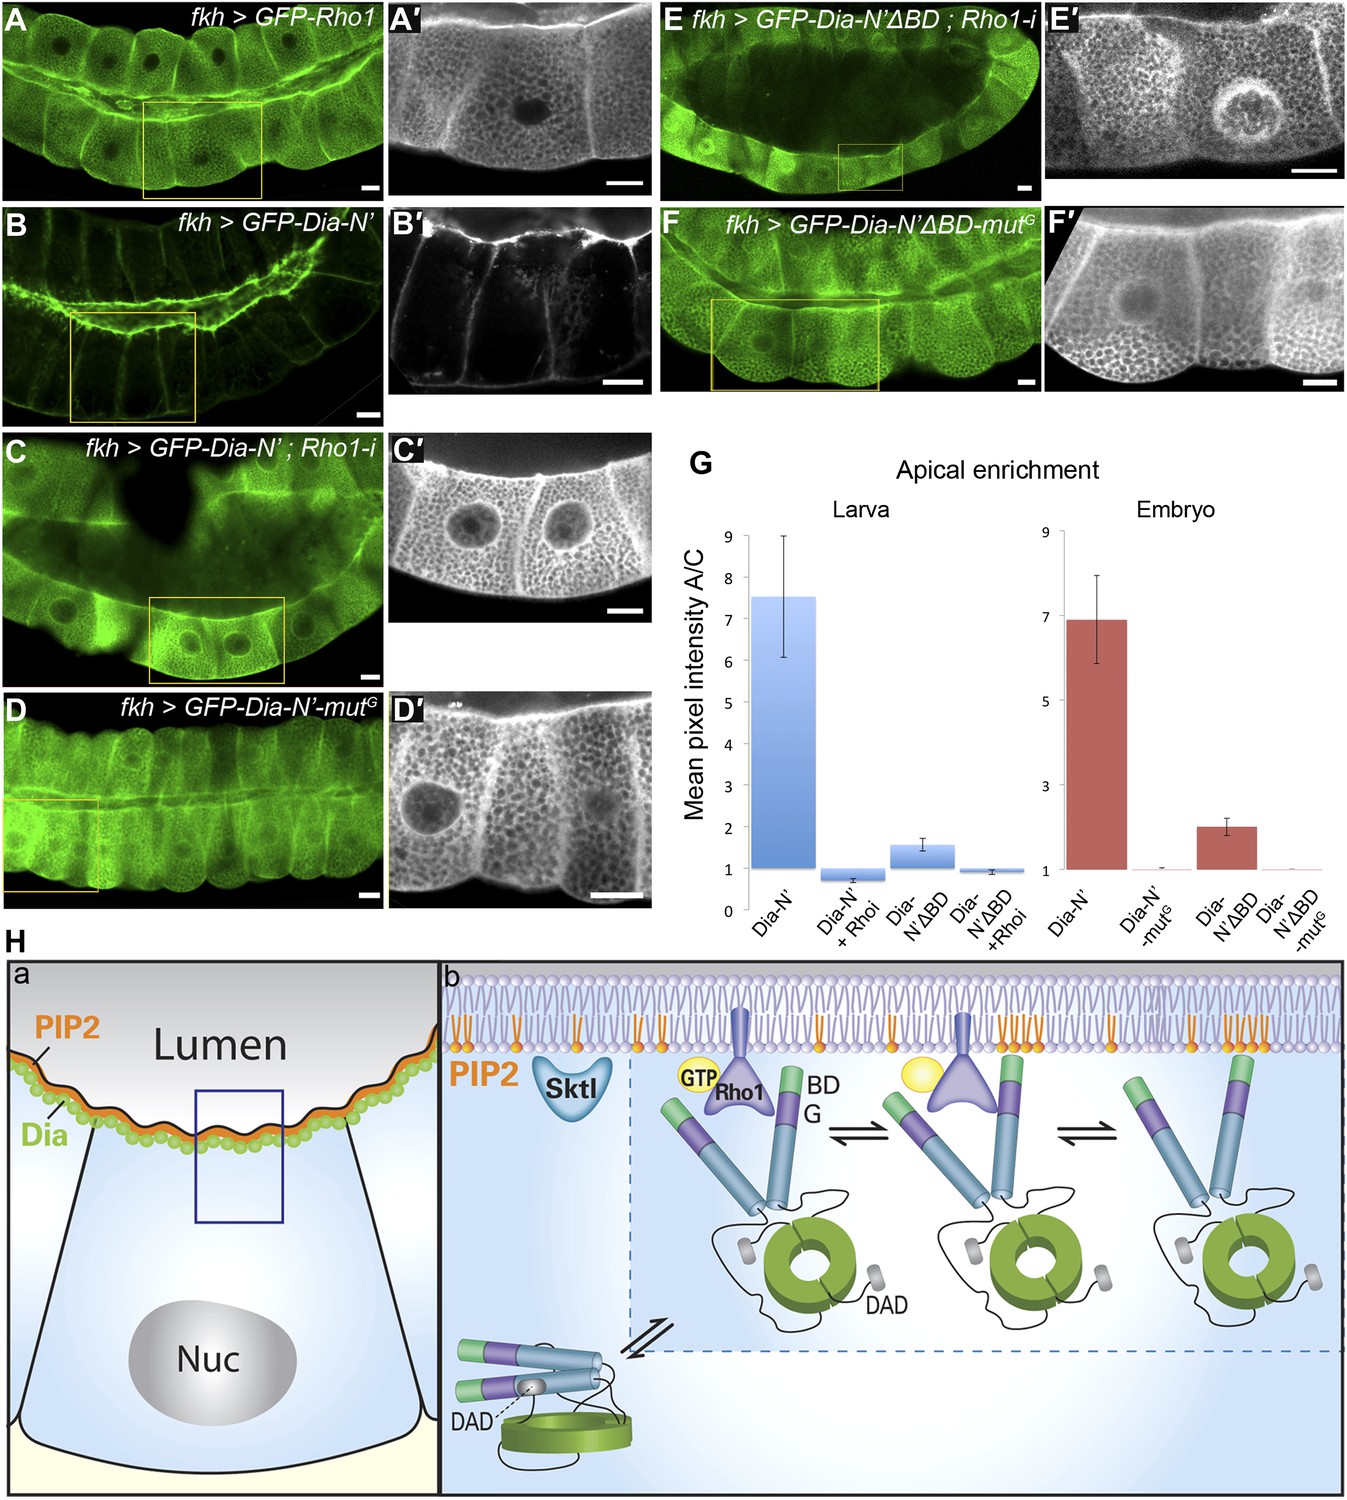
(A–F′) Live imaging of GFP-tagged constructs (Figure 2A) expressed in third instar larval salivary glands under fkh-Gal4. Primed panels (grey) show an enlargement of the marked area. (A and A′) GFP-Rho1 is distributed between the apical domain and the cytoplasm. (B–D′) Apical localization of Dia-N’ is Rho1 dependent. Co-expression with Rho1-RNAi dramatically alters GFP-Dia-N’ localization from apical restriction (B and B′) to a complete cytoplasmic localization (C and C′). Correspondingly, GFP-Dia-N’-mutG, a variant lacking Rho-1 binding capacity, assumes an entirely cytoplasmic distribution (D and D′). Note the expanded lumen of Rho1-RNAi expressing salivary glands (C and C′), previously reported for Rho1 mutant alleles (Xu et al., 2011), indicative of the loss of active Rho1 in this system. (E–F′) Apical localization of Dia-N’ΔBD is Rho1 dependent. Co-expression with Rho1-RNAi dramatically alters GFP-Dia-N’ΔBD localization to a cytoplasmic localization (E and E′, compare with Figure 6B), while GFP-Dia- N’ΔBD -mutG, lacking Rho-1 binding capacity, assumes an entirely cytoplasmic distribution (F and F′). Scale bars, 20 μm. (G) Quantification of GFP intensity in larval (left chart) and embryonic (right chart) salivary gland cells, expressing the indicated constructs under fkh-Gal4 (Figures 6 and 7, Figure 6—figure supplement 1 and Figure 7—figure supplement 2). Apical enrichment is represented by the mean pixel intensity ratio between the apical domain and the cytoplasm. For larval salivary gland cells, the values are normalized to measurements of cells expressing cytoplasmic GFP. Due to morphological changes resulting from Rho1–RNAi expression, Dia apical localization is even lower than the baseline. Error bars represent standard error. n = 10–24 glands. (H) A model describing the dynamics of Dia targeting to the apical membrane in Drosophila tubular organs. a) Enrichment of both PI(4,5)P2 and Dia at the apical membrane is an inherent feature of Drosophila tubular epithelial cells. b) In a closed conformation, Dia assumes a cytoplasmic distribution. Dia binding to Rho1-GTP generates an initial apical bias, and promotes PI(4,5)P2 binding via exposure of the N-terminal region and enrichment near the apical membrane. The Dia- PI(4,5)P2 interaction further stabilizes apical membrane association. Dia can shift dynamically between three states, being bound to each of the apical cues alone, or to both simultaneously, increasing the probability for re-binding and therefore the efficiency of apical targeting. See also Figure 7—figure supplement 1–3.
Figure 7—figure supplement 1
Apical enrichment of Rho1 is not dependent on Dia.
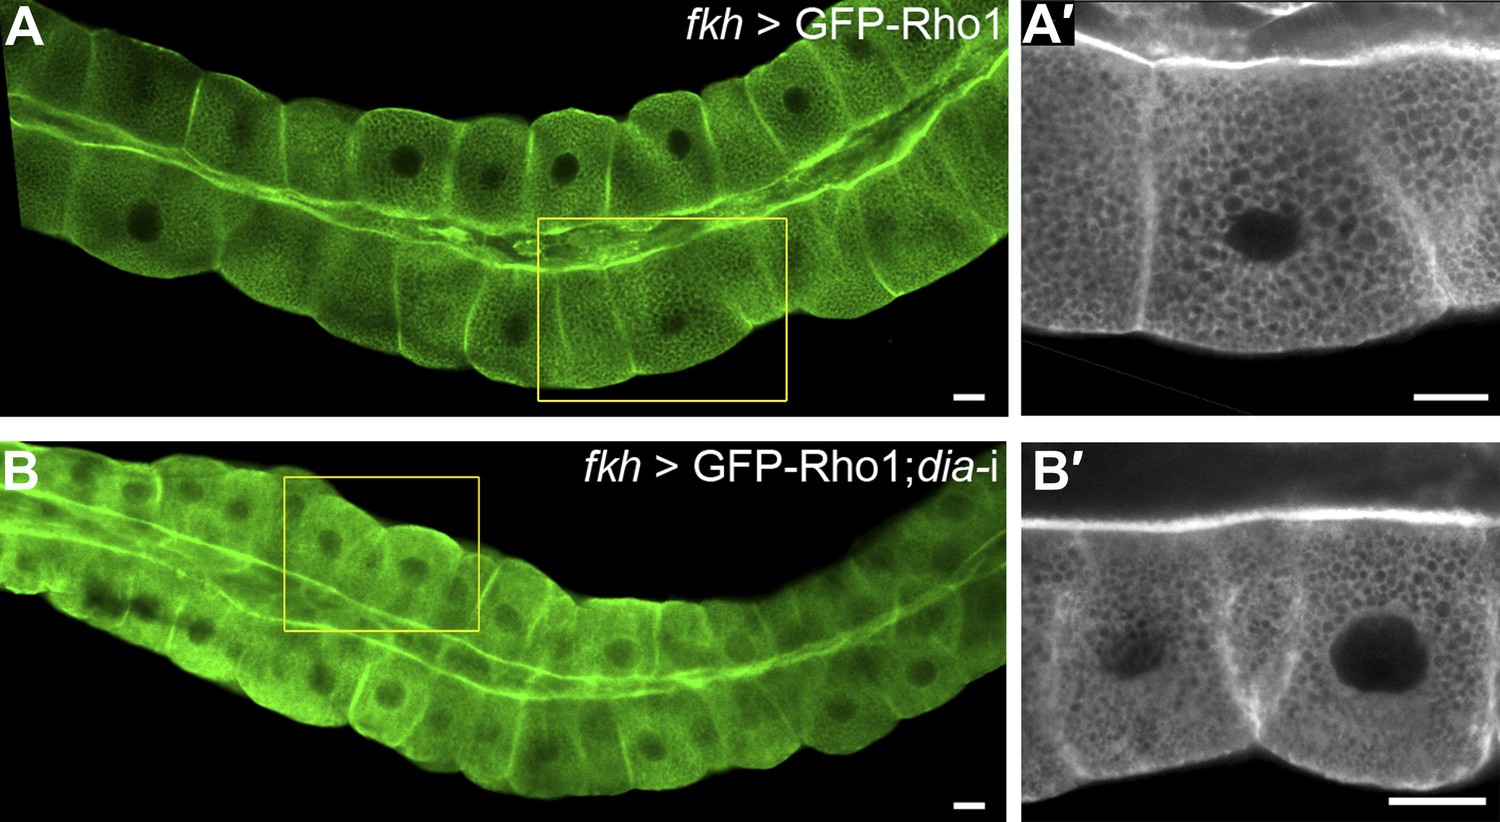
The indicated constructs were expressed in third instar larval salivary gland under fkh-Gal4, and GFP was visualized by live imaging. GFP-Rho1 distribution remains the same in control cells (A and A′) and upon co-expression with a dia-RNAi construct (B and B′). Primed panels show an enlargement of the marked area. Scale bars, 20 µm.
Figure 7—figure supplement 2
Rho1 binding is critical for Dia localization in embryonic tubular organs.
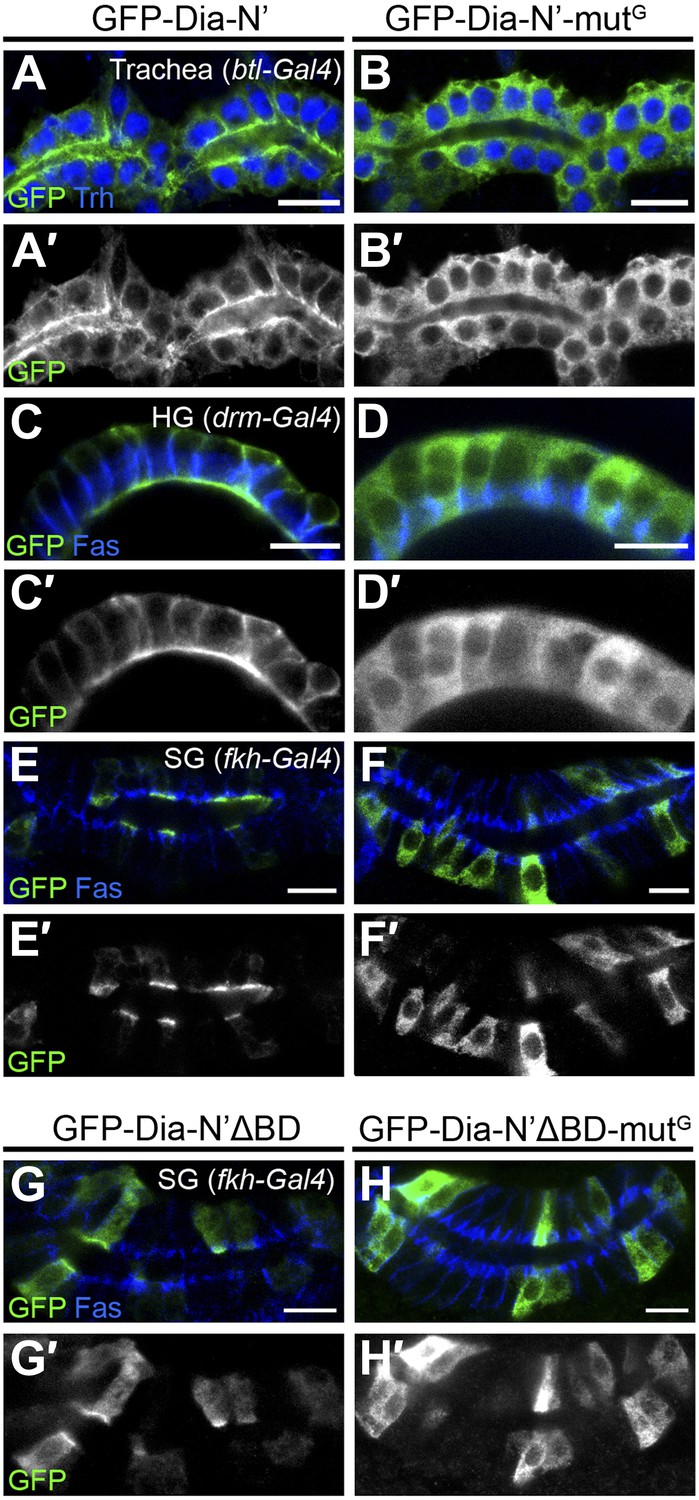
(A–H′) The indicated constructs (Figure 2A) were expressed in the trachea (A–B′), the hindgut (C–D′) and the salivary gland (E–F′ and G–H′) of stage 15 embryos under btl-Gal4, drm-Gal4 and fkh-Gal4, respectively. (A–F′) GFP-Dia-N’-mutG assumes a cytoplasmic distribution in embryonic tubular organs (B,D and F), in contrast to GFP-Dia-N’, which is apically restricted (A,C and E). (G–H′) GFP-Dia-N’ΔBD-mutG assumes a cytoplasmic distribution in embryonic salivary glands (H and H′), in contrast to GFP-Dia-N’ΔBD, which displays some apical enrichment in addition to cytoplasmic localization (G and G′). Localization was followed by staining with anti-GFP (green, shown separately [grey] in primed panels). Trh (blue) marks nuclei of tracheal cells. FasIII (blue) marks septate junctions. Scale bars, 10 µm.
Figure 7—figure supplement 3
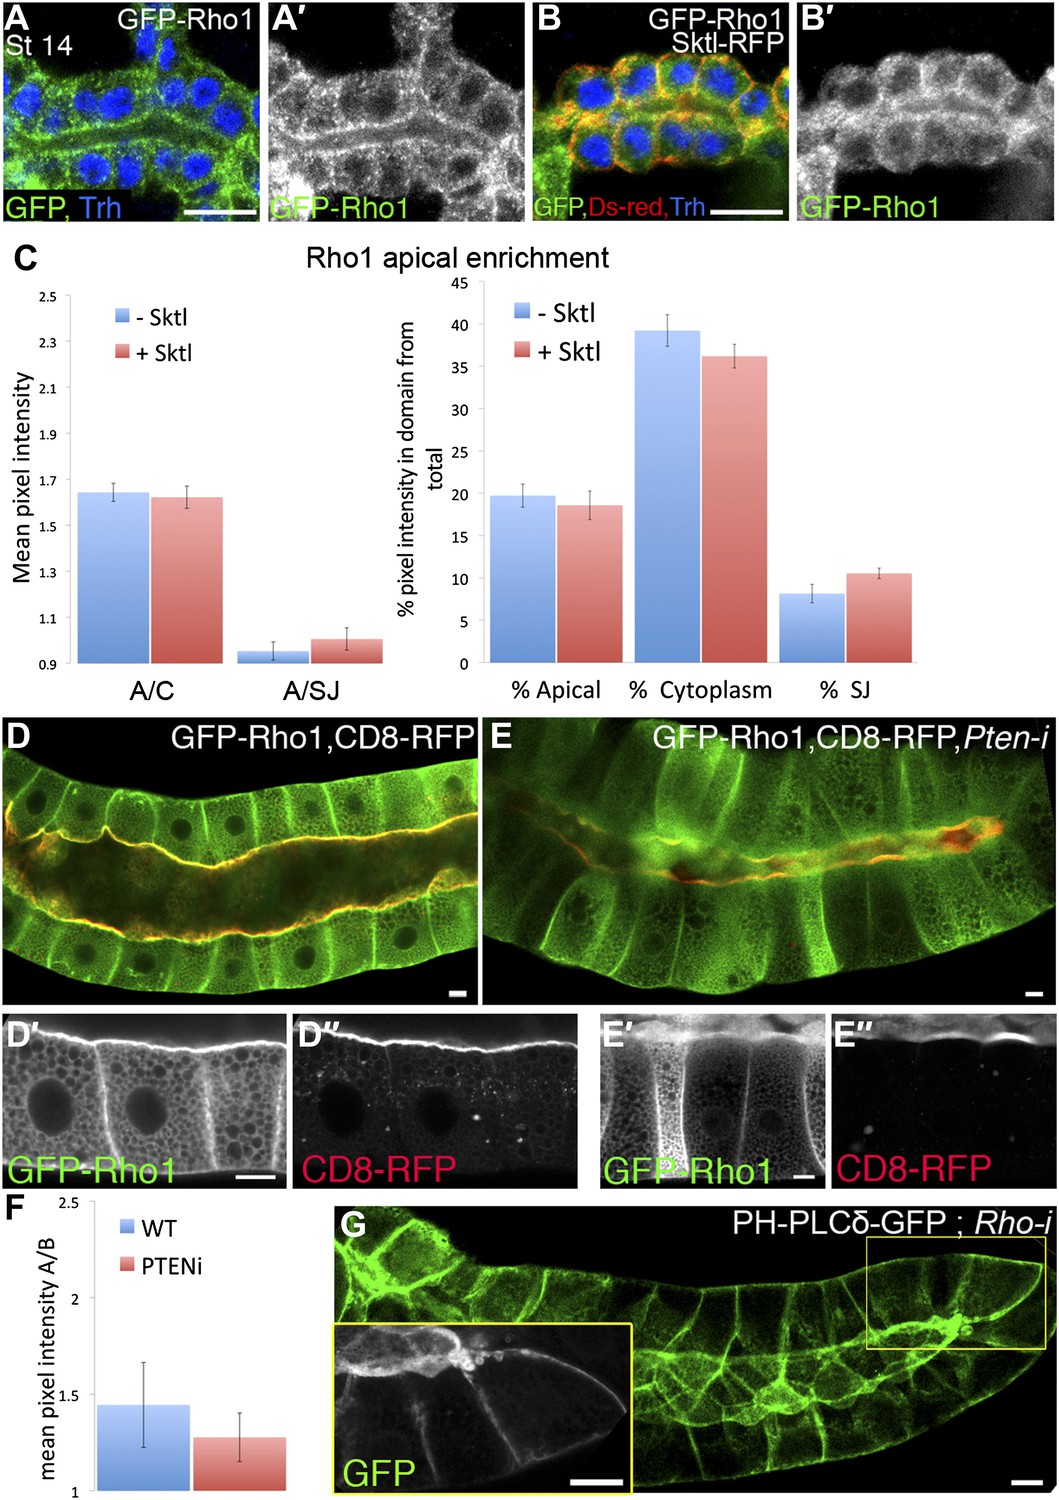
Rho1 and PI(4,5)P2 do not regulate each other’s localization pattern.
(A–B′) Over-expression of Sktl does not effect Rho1 apical localization upon co-expression in the trachea. The indicated constructs were expressed by btl-Gal4, and their localization was followed in stage 14–15 embryonic trachea by staining for GFP (green, shown separately [grey] in primed panels) and RFP (DsRed, red). Trh (blue) marks the tracheal cell nuclei. (A and A′) GFP-Rho1 displays a localization pattern that is distributed between the cytoplasm and the cell cortex when expressed in the trachea, which does not change upon co-expression with Sktl (B and B′). Scale bars, 10 µm. (C) Quantification of GFP intensity in (A, -Sktl) compared with (B, +Sktl). Left chart: mean pixel intensity ratio between the apical domain and the cytoplasm (A/C) or the lateral membrane domain (represented by the septate junctions, A/SJ). Right chart: percentage of intensity that is concentrated in the apical, cytoplasmic and septate junctions domains from the total intensity in the cell. Error bars represent standard error, n = 10–18. (D–E″) Pten silencing does not effect Rho1 localization in the salivary gland. The localization of the indicated constructs was examined by live imaging (green, shown separately [grey] in single primed panels), following expression in the third instar larval salivary gland under fkh-Gal4. Upon co-expression with a Pten-RNAi construct, GFP-Rho1 remained moderately enriched apically (E and E′), as in control cells (D and D′). CD8-RFP, which served as a general marker for apical membrane morphology, remained restricted to the apical membrane as well (D″–E″). (F) Quantification of GFP intensity ratios in (D, WT) compared with (E, Pten-i), represented by the mean pixel intensity ratio between the apical and basal domains (A/B). Both genotypes exhibit apical enrichment represented by a >1 ratio. Error bars represent standard error, n = 13–17. (G) Rho1 silencing does not effect PI(4,5)P2 localization. PH-PLCδ-GFP remains apically enriched upon co-expression with a Rho1–RNAi construct. Inset shows an enlargement of the marked area. Scale bars, 20 µm.
Download links
A two-part list of links to download the article, or parts of the article, in various formats.
Downloads (link to download the article as PDF)
Open citations (links to open the citations from this article in various online reference manager services)
Cite this article (links to download the citations from this article in formats compatible with various reference manager tools)
Apical targeting of the formin Diaphanous in Drosophila tubular epithelia
eLife 2:e00666.
https://doi.org/10.7554/eLife.00666


